Embed Size (px)
Citation preview

THE NKF-KDOQI (2002) CKD DEFINITION AND
CLASSIFICATION SYSTEM:Limitations and Problems
Richard J. Glassock, MD, MACPDavid Geffen School of Medicine at UCLA
KDIGO Controversies ConferenceLondon, UK
October 4, 2009

A Contrarians Lament

“A critic is a man who leaves no turn
unstoned”
George Bernard ShawNew York Times
November 5, 1950
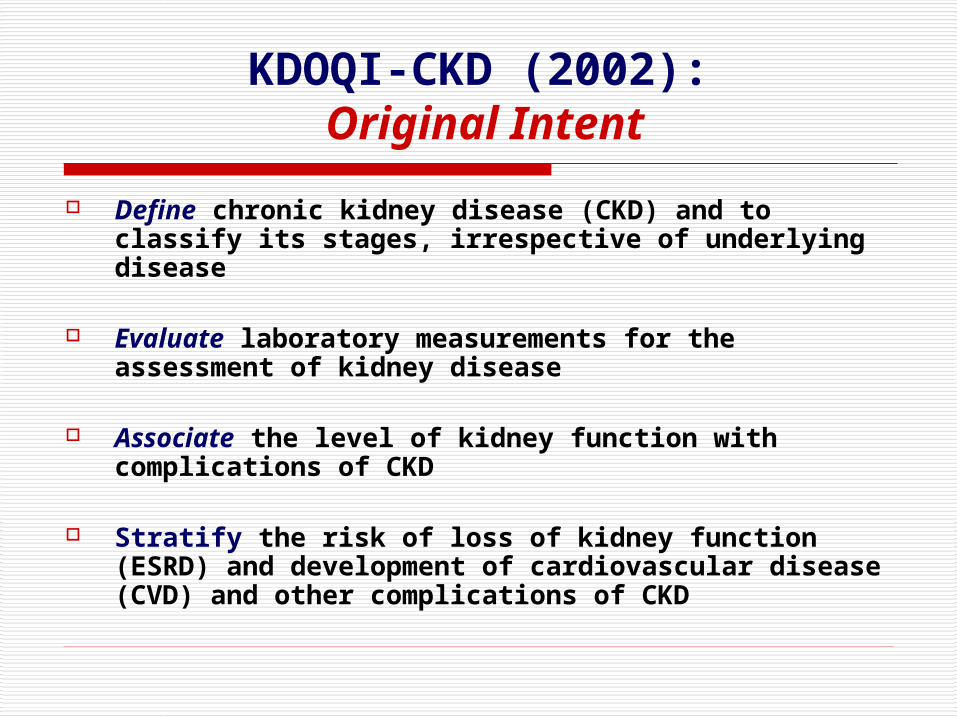
KDOQI-CKD (2002):
Original Intent
Define chronic kidney disease (CKD) and to classify its stages, irrespective of underlying disease
Evaluate laboratory measurements for the assessment of kidney disease
Associate the level of kidney function with complications of CKD
Stratify the risk of loss of kidney function (ESRD) and development of cardiovascular disease (CVD) and other complications of CKD

Original Intent: Classification system was to be applied (unmodified) to both population analysis and to individual patient
management

Chronic Kidney Disease (CKD): Classification-(NKF-K/DOQI-2002)
Stage Kidney eGFR*
Damage (ml/min/1.73m2) 1 + ≥90 2 + 60-89 3 NA 30-59 4 NA 15-29 5 NA <15 (or dialysis)
(*calculated from serum creatinine level by the abbreviated MDRD equation; NA= not applicable: findings must persist for ≥3 months)

The KDOQI-CKD Classification System Benefits
(Real and Perceived)
Brought order to the chaos of nosology of CKD
Increased awareness of the “public health” problem of CKD in the general population and in general physicians
Galvanized research (clinical, basic, epidemiological) on the issue of CKD
Stimulated interest in early detection (population and targeted screening) of CKD
Minimized untimely start of dialysis

Chronic Kidney Disease:Citations in PubMed: 1998-2008
0
1000
2000
3000
4000
5000
6000
1998 2000 2002 2004 2006 2008
Year
Nu
mb
er
of
Cit
ati
on
s

The KDOQI-CKD Classification System
Limitations and Problems (Real and Perceived)
Described as a staging system, it is really a grading system based on arbitrary bands of eGFR values
Asserts that normal GFR is >90ml/min/1.73m2 and an GFR <60ml/min/1.73m2 is pathological across all adult ages, genders and ancestral groups
Ignores age- and gender-related changes in GFR Linked to an imprecise measurement of GFR- the 4
variable eGFR (MDRD) Allows the “diagnosis” of CKD based on eGFR alone Conflates isolated “microalbuminuria” (in absence
fo diabetes or corroborating evidence of “kidney damage”) with “kidney disease”
Links “complications” of “CKD” (e.g.CVD)to levels of eGFR, without reference to albuminuria
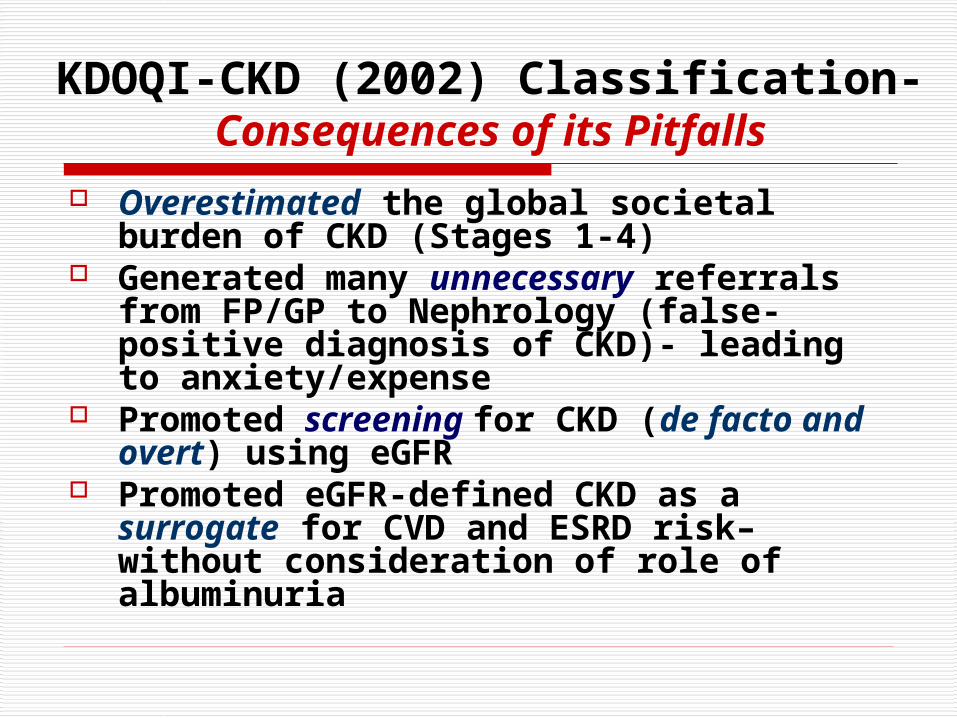
KDOQI-CKD (2002) Classification- Consequences of its Pitfalls
Overestimated the global societal burden of CKD (Stages 1-4)
Generated many unnecessary referrals from FP/GP to Nephrology (false-positive diagnosis of CKD)- leading to anxiety/expense
Promoted screening for CKD (de facto and overt) using eGFR
Promoted eGFR-defined CKD as a surrogate for CVD and ESRD risk– without consideration of role of albuminuria

CKD Prevalence-USA:NHANES (KDOQI-Based:1999-2004)
(Coresh et al JAMA, 2007)
Stage Prevalence Prevalence (%) (x 106)
1 1.78 3.6 2 3.24 6.5 3 7.69 15.5 4 0.35 0.7Total 1-4 13.07 26.3(One in every 7.6 persons over
age 20-- 60% with Stage 3 CKD)

CKD-NHANESPrevalence of CKD (KDOQI) Stage 3 by Age
(1999-2004)
0%
5%
10%
15%
20%
25%
30%
35%
40%
Prevalence (%)
20-39 40-59 60-69 70+
Age Group (years)

CKD Prevalence Trends: eGFR (creatinine) v eGFR (cystatin C)
(1988-1994 vs 1999-2002 NHANES; Foley R, et al CJASN 4:965, 2009)
00.20.40.60.8
11.21.41.61.8
2
Adjusted Prevalence
Ratios (1999-2002 v 1998-1994)
Stage 1 Stage 2 Stage 3A Stage 3B Stage4/ 5
CKD Stage (eGFR/ UACR)
eGFR (creatinine) eGFR (cystatin C)

Aging and GFR

Glomerular Filtration Rate (Cin) and Filtration Fraction (Cin/RPF) in Ageing
(Davies and Shock, J Clin Invest 29:496, 1950)
0
20
40
6080
100
120
140
20-29
30-39
40-49
50-59
60-69
70-79
80-89
Age (Years)GFR (ml/ min/ 1.73m2) Filtration Fraction (% )

CKD: eGFR in “Healthy” Caucasians
by Gender
0
20
40
60
80
100
120
140
160
18- 24 25- 29 30- 34 35- 39 40- 44 45- 49 50- 54 55- 59 60- 64 65- 69 70- 74 75- 79 80- 84 85+
Age (years)
eGFR
(m
L/m
in/1
.73m
2)
(Wetzels,J et al;Nijmegen Biomedical Study, 2008)
0
20
40
60
80
100
120
140
160
18- 24 25- 29 30- 34 35- 39 40- 44 45- 49 50- 54 55- 59 60- 64 65- 69 70- 74 75- 79 80- 84 85+
Age (years)eG
FR (
mL/
min
/1.7
3m2)
Males Females
95th Percentile50th Percentile
5th Percentile
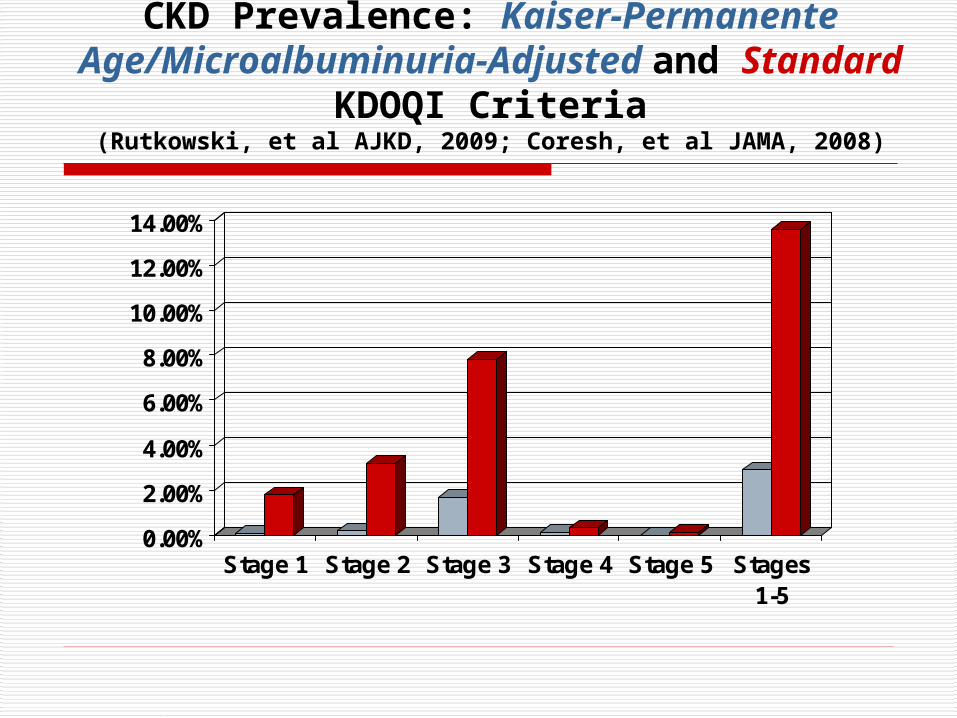
CKD Prevalence: Kaiser-Permanente Age/Microalbuminuria-Adjusted and
Standard KDOQI Criteria(Rutkowski, et al AJKD, 2009; Coresh, et al JAMA, 2008)
0.00%
2.00%
4.00%
6.00%
8.00%
10.00%
12.00%
14.00%
Stage 1 Stage 2 Stage 3 Stage 4 Stage 5 Stages1-5

eGFR (MDRD): Precision and Bias

eGFR (MDRD) vs mGFR (Cin)(Botev, et al, CJASN, 2009)
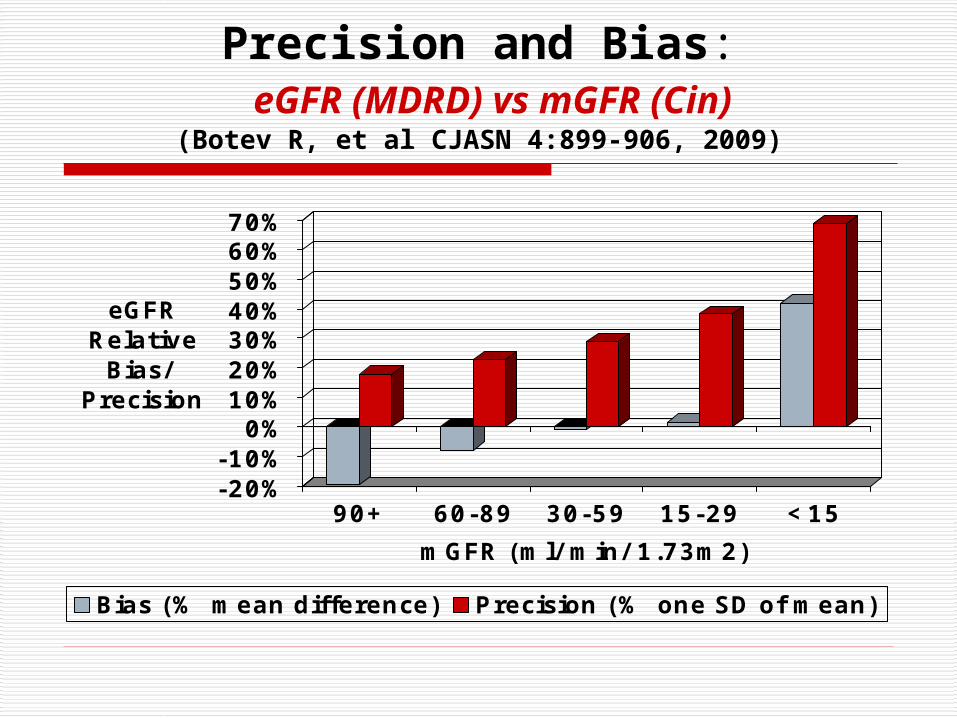
Precision and Bias: eGFR (MDRD) vs mGFR (Cin)(Botev R, et al CJASN 4:899-906, 2009)
-20%-10%
0%10%20%30%40%50%60%70%
eGFR Relative
Bias/Precision
90+ 60-89 30-59 15-29 <15
mGFR (ml/ min/ 1.73m2)
Bias (% mean difference) Precision (% one SD of mean)

Concordance of CKD Stage According to mGFR (Cedta) and eGFR (MDRD)
(Froissart, et al. JASN, 2005)(2095 subjects; 1995 with CKD/162 normal donors)
mGFR Stage 1
Stage 2
Stage 3
Stage 4
Stage 5
>90 67% 32% 0.6% 0
0
60-89 16% 64% 21% 0.2% 0
30-59 0.5% 12% 78% 10% 0
15-29 0 0 17% 79% 4.2%
<15 0 0 3.1% 32% 65%

eGFR and Diagnosis of CKD: An Illustration
A 25 year old man with an eGFR of 55 ml/min/1.73m2 is 45% below the median for his age and -25 ml/min/1.73m2 below the 5th percentile for age and gender
A 75 year old man with an eGFR of 55ml/min/1.73m2 is 30% below the median for his age and +5 ml/min/1.73m2 above the 5th percentile for age and gender
WHICH ONE HAS SIGNIFiCANT CKD?

CKD and Complications: Cardiovascular Disease
(CVD)

CKD-CVD: Adjusted HR for All-Cause Mortality and CV
Events(Go et al, NEJM)
0
1
2
3
4
5
6
Hazard Ratio
>60 45-59 30-44 15-29 <15 (nodailysis)
eGFR (ml/min/1.73m2)
Mortality
CV Events

eGFR and Mortality Risk in the Elderly: Over 70 years of age
(PROSPER; n=5804)(Ford I, et al PLoS Med 6:76, 2009)
00.5
11.5
22.5
33.5
Hazard Ratio (Fully
Adjusted)
>60 50-60 40-50 20-40
eGFR Strata (ml/ min/ 1.73m2)
All-Cause Mortality Fatal/ non-fatal CHDFatal/ non-fatal CHF Fatal/ non-fatal Stroke
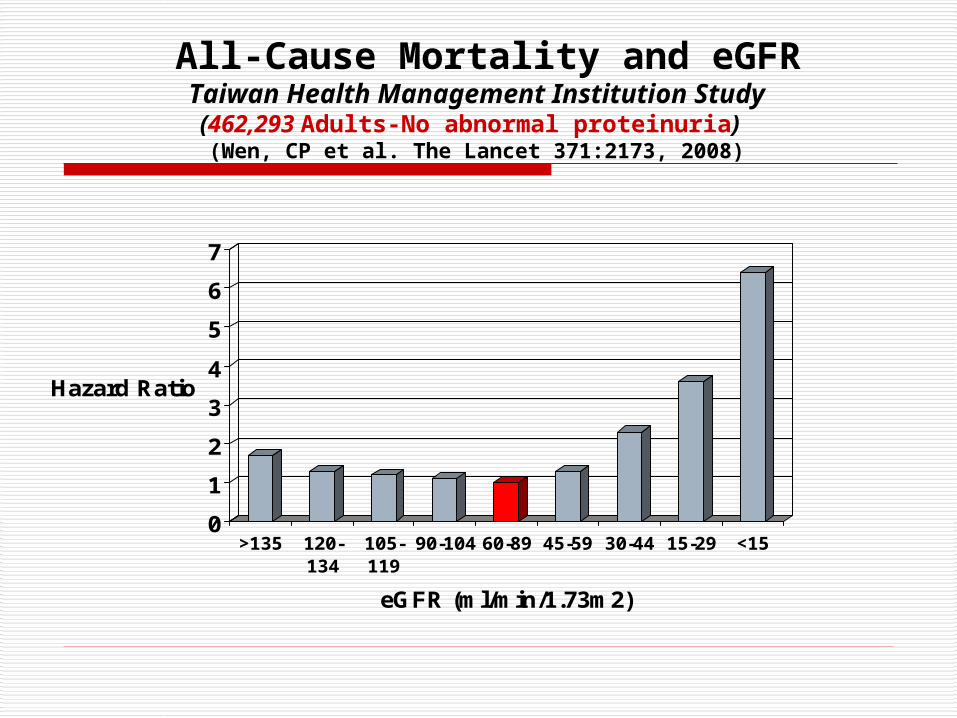
All-Cause Mortality and eGFRTaiwan Health Management Institution Study
(462,293 Adults-No abnormal proteinuria) (Wen, CP et al. The Lancet 371:2173, 2008)
0
1
2
3
4
5
6
7
Hazard Ratio
>135 120-134
105-119
90-104 60-89 45-59 30-44 15-29 <15
eGFR (ml/min/1.73m2)
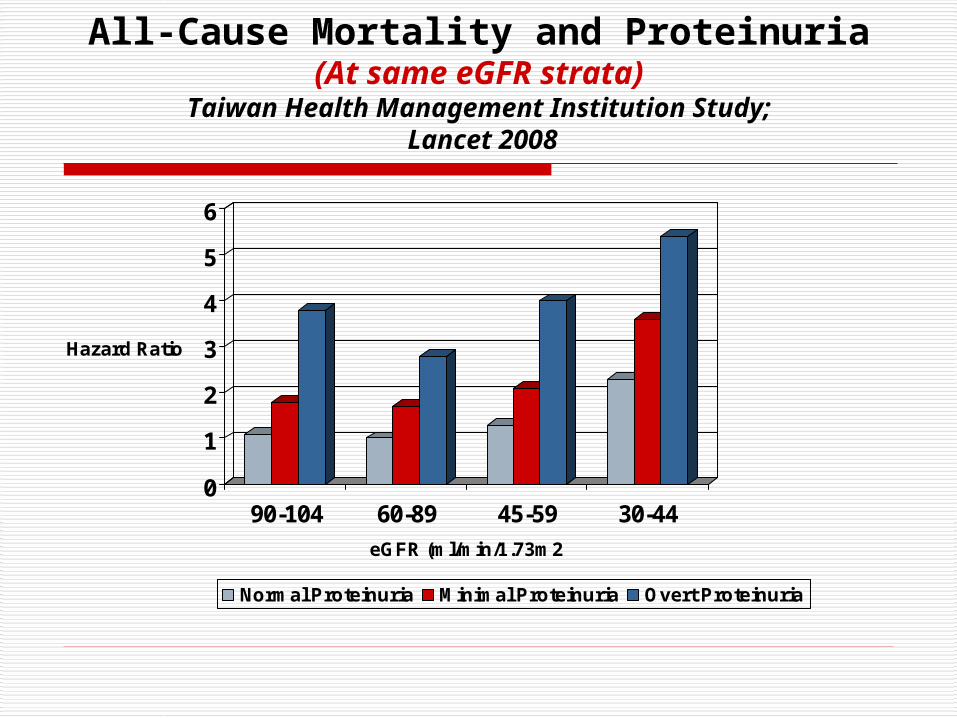
All-Cause Mortality and Proteinuria(At same eGFR strata)
Taiwan Health Management Institution Study; Lancet 2008
0
1
2
3
4
5
6
Hazard Ratio
90-104 60-89 45-59 30-44
eGFR (ml/min/1.73m2
Normal Proteinuria Minimal Proteinuria Overt Proteinuria

CKD Stage 3Risk of Cardiovascular Disease
(Brantsma AH, et al and PREVEND. NDT, 2008) (n=8495- 1590 with CKD)
0
0.5
1
1.5
2
2.5
Hazard Ratio for CV Events (no CKD=1.00)
Stage 1 Stage 2 Stage 3 (All) Stage 3 (UAE<30mg/ d)
Stage 3 (UAE>30mg/ d)
CKD Stage

CVD events and CKD: PREVEND Study
(van der Velde M, et al. ASN, 2008)
02468
101214
Hazard Ratio: CVD
Events
<60 60-90 >90
eGFR (MDRD)-ml/ min/ 1.73m2
Age >60; MA + Age >60; MA-Age <60; MA + Age <60; MA-
CKD and Complications: Progression to ESRD

The HUNT-II Study- Adjusted 10 year risk of ESRD according to
eGFR and Albuminuria (Hallan S, et al JASN 20:1069-1077, 2009)
0500
10001500200025003000350040004500
Hazard Ratio
>60 45-59 30-44 15-29
eGFR (MDRD)-ml/ min/ 1.73m2
Normoalbuminuria Microalbuminuria Macroalbuminuria

The Problems with CKD Classification:
Conclusions-2009
eGFR (1999) and KDOQI-CKD (2002) interacts to greatly overestimate the societal burden of CKD- Stages 1-4
The “Diagnosis” of CKD by arbitrary eGFR thresholds (not adjusted for age and gender) leads to a significant error rate (false positive Stage 3 CKD)
Risk of Complications of CKD, based on eGFR alone are overemphasized- neglects the multiplier effect of albuminuria
Conflation of isolated “microalbuminuria” (without abnormal eGFR or diabetes) as a “kidney disease” lacks a firm rationale
Screening for CKD based on eGFR alone cannot be justified as cost-effective for prevention of ESRD or CVD

What is “CKD”?
Is it a Diagnosis?--- For a population or an individual?
Is it a Post-diagnostic step to grade the severity and determine the risks of progression or complications ?
Is it a non-specific means of categorizing patients with generic manifestations of specific kidney diseases?
Or all three?

“It ought to be remembered that there is nothing more difficult to take in hand, more perilous to
conduct or more uncertain in its success than to take the lead in the
introduction of a new order of things”
Niccolo Machiavelli- The Prince, 1513

THANK YOU !!!