Embed Size (px)
Citation preview
THE NFL LOS ANGELES STADIUM IN CARSON:
AN ECONOMIC IMPACT ANALYSIS
INSTITUTE FOR APPLIED ECONOMICS
Los Angeles County Economic Development Corporation
MARCH 2015
THE NFL LOS ANGELES STADIUM IN CARSON:
AN ECONOMIC IMPACT ANALYSIS
INSTITUTE FOR APPLIED ECONOMICS 444 S. Flower Street, 37th Floor Los Angeles, CA 90071 www.LAEDC.org/IAE
March 2015
This research was commissioned by San Diego Chargers and Oakland Raiders.
The LAEDC Institute for Applied Economics specializes in objective and unbiased economic and policy research in order to foster informed decision-making and guide strategic planning. In addition to commissioned research and analysis, the Institute conducts foundational research to ensure LAEDC’s many programs for economic development are on target. The Institute focuses on economic impact studies, regional industry and cluster analysis and issue studies, particularly in workforce development and labor market analysis. Every reasonable effort has been made to ensure that the data contained herein reflect the most accurate and timely information possible and they are believed to be reliable. This report is provided solely for informational purposes and is not to be construed as providing advice, recommendations, endorsements, representations or warranties of any kind whatsoever.
© 2015 Los Angeles County Economic Development Corporation. All rights reserved.
Economic Impact Analysis NFL Los Angeles Stadium in Carson
Institute for Applied Economics 1
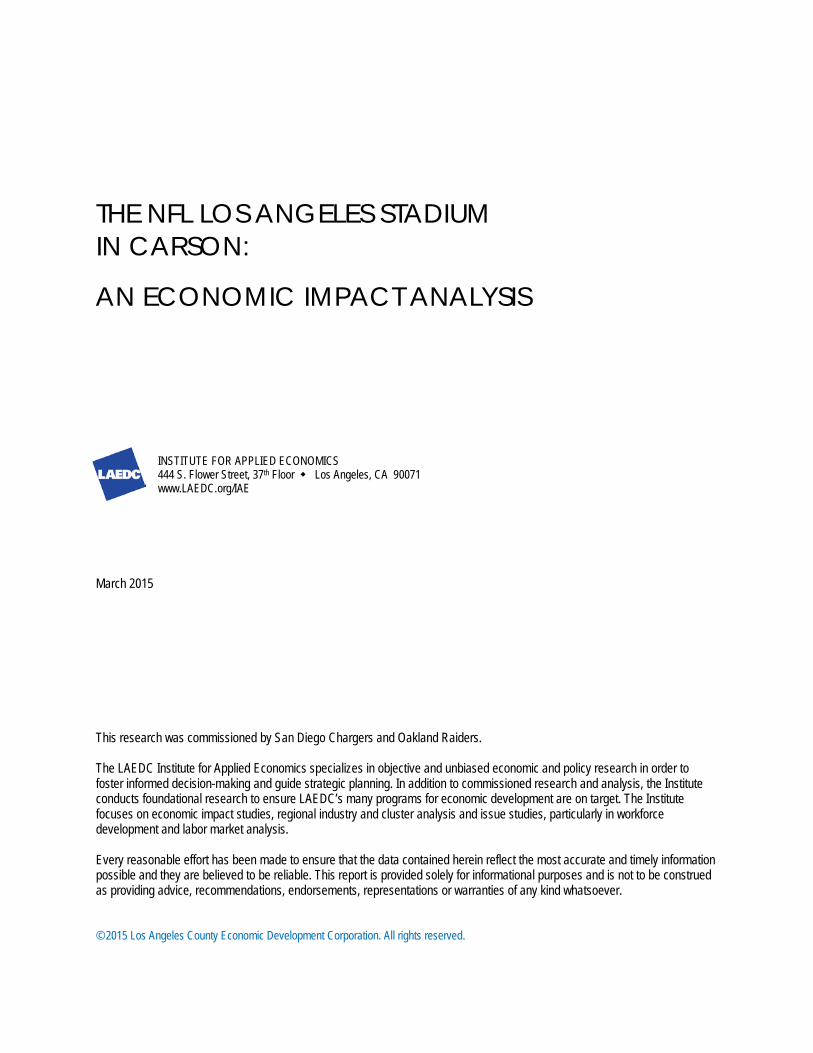
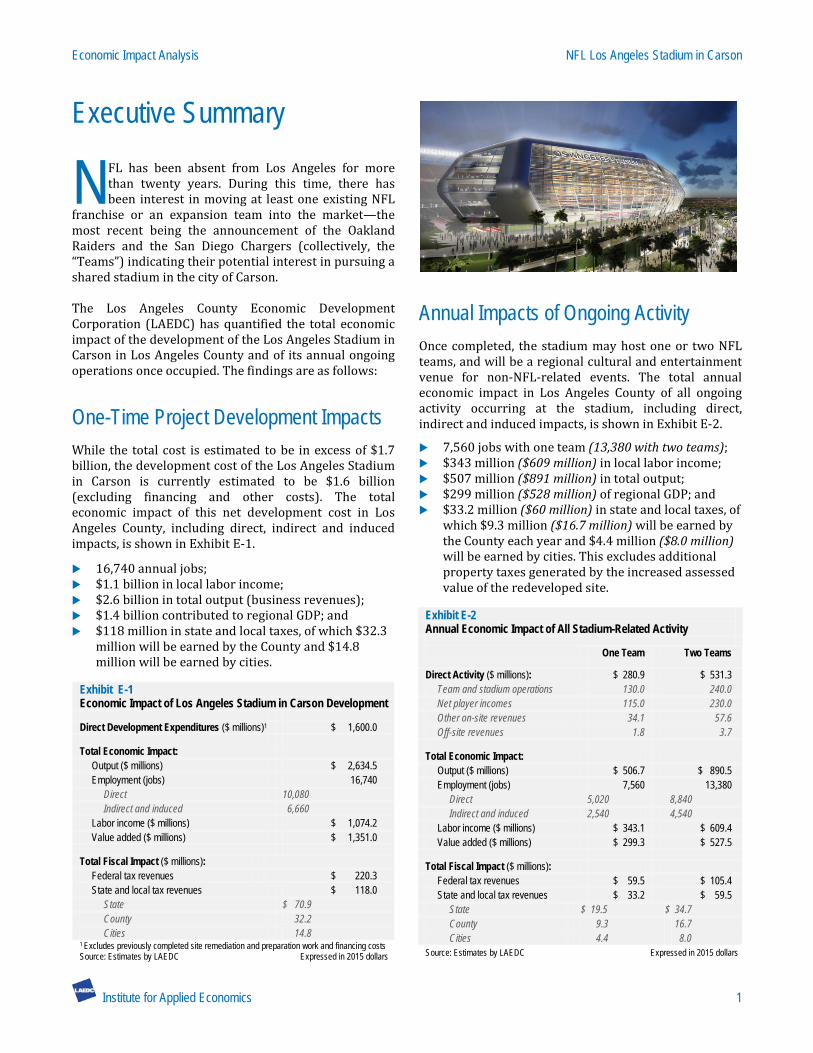
Executive Summary
FL has been absent from Los Angeles for more than twenty years. During this time, there has been interest in moving at least one existing NFL
franchise or an expansion team into the market—the most recent being the announcement of the Oakland Raiders and the San Diego Chargers (collectively, the “Teams”) indicating their potential interest in pursuing a shared stadium in the city of Carson. The Los Angeles County Economic Development Corporation (LAEDC) has quantified the total economic impact of the development of the Los Angeles Stadium in Carson in Los Angeles County and of its annual ongoing operations once occupied. The findings are as follows:
One-Time Project Development Impacts While the total cost is estimated to be in excess of $1.7 billion, the development cost of the Los Angeles Stadium in Carson is currently estimated to be $1.6 billion (excluding financing and other costs). The total economic impact of this net development cost in Los Angeles County, including direct, indirect and induced impacts, is shown in Exhibit E-1.
16,740 annual jobs; $1.1 billion in local labor income; $2.6 billion in total output (business revenues); $1.4 billion contributed to regional GDP; and $118 million in state and local taxes, of which $32.3
million will be earned by the County and $14.8 million will be earned by cities.
Exhibit E-1 Economic Impact of Los Angeles Stadium in Carson Development Direct Development Expenditures ($ millions)1 $ 1,600.0 Total Economic Impact: Output ($ millions) $ 2,634.5 Employment (jobs) 16,740 Direct 10,080 Indirect and induced 6,660 Labor income ($ millions) $ 1,074.2 Value added ($ millions) $ 1,351.0 Total Fiscal Impact ($ millions): Federal tax revenues $ 220.3 State and local tax revenues $ 118.0 State $ 70.9 County 32.2 Cities 14.8 1 Excludes previously completed site remediation and preparation work and financing costs Source: Estimates by LAEDC Expressed in 2015 dollars
Annual Impacts of Ongoing Activity Once completed, the stadium may host one or two NFL teams, and will be a regional cultural and entertainment venue for non-NFL-related events. The total annual economic impact in Los Angeles County of all ongoing activity occurring at the stadium, including direct, indirect and induced impacts, is shown in Exhibit E-2.
7,560 jobs with one team (13,380 with two teams); $343 million ($609 million) in local labor income; $507 million ($891 million) in total output; $299 million ($528 million) of regional GDP; and $33.2 million ($60 million) in state and local taxes, of
which $9.3 million ($16.7 million) will be earned by the County each year and $4.4 million ($8.0 million) will be earned by cities. This excludes additional property taxes generated by the increased assessed value of the redeveloped site.
Exhibit E-2 Annual Economic Impact of All Stadium-Related Activity
One Team Two Teams Direct Activity ($ millions): $ 280.9 $ 531.3 Team and stadium operations 130.0 240.0 Net player incomes 115.0 230.0 Other on-site revenues 34.1 57.6 Off-site revenues 1.8 3.7 Total Economic Impact: Output ($ millions) $ 506.7 $ 890.5 Employment (jobs) 7,560 13,380 Direct 5,020 8,840 Indirect and induced 2,540 4,540 Labor income ($ millions) $ 343.1 $ 609.4 Value added ($ millions) $ 299.3 $ 527.5 Total Fiscal Impact ($ millions): Federal tax revenues $ 59.5 $ 105.4 State and local tax revenues $ 33.2 $ 59.5 State $ 19.5 $ 34.7 County 9.3 16.7 Cities 4.4 8.0 Source: Estimates by LAEDC Expressed in 2015 dollars
N
NFL Los Angeles Stadium in Carson Economic Impact Analysis
2 Institute for Applied Economics
1 Introduction
os Angeles County and its surrounding region have been without an NFL team for more than twenty years. There has been periodic interest in either
moving an existing NFL franchise or creating an expansion team in Los Angeles. As the second largest media market in the country with dual franchises in almost every professional sport, the absence of an NFL team has been marked. Momentum has been building recently in actively recruiting teams to the region, including two franchises, the Oakland Raiders and the San Diego Chargers (collectively, the “Teams”). The two NFL rivals jointly issued a statement on February 19, 2015, indicating their interest in pursuing a shared stadium in the City of Carson financed solely by stadium revenues. The site proposed for the stadium is a 168-acre site at the southwest intersection of the I-405 Freeway and Del Amo Boulevard, which is currently unoccupied. The project calls for an approximately 70,000-seat capacity stadium that could expand to 75,000 seats. The project will also accommodate a mix of on-site and off-site parking totaling 18,000 to 20,000 spaces. The Chargers and Raiders both have ties to Los Angeles County. The Chargers were established in 1960 as part of the American Football League and played their first season in Los Angeles. In 1961, they moved to San Diego and have been playing their home games at Qualcomm Stadium since that time. The team joined the American Football Conference (AFC) in 1970. The Raiders were also established in 1960 as part of the American Football League and joined the National Football League in 1970 as part of the American Football Conference (AFC). The Raiders played in the Los Angeles Memorial Coliseum from 1982 through 1994 before returning to Oakland, CA where they have played since. The Los Angeles County Economic Development Corporation (LAEDC) has been retained to quantify the total economic impact (including direct, indirect and induced effects) of the development of Los Angeles Stadium in Carson and its ongoing annual operations. The analysis is taken in three parts. First, the initial one-time economic impact of stadium investment and construction is reviewed and its direct, indirect and
induced economic impact is estimated. Second, ongoing annual activity associated with NFL games is reviewed and its direct, indirect and induced economic impact is estimated. This includes not only the on-site activity occurring at the stadium but also the off-site activity related to visiting teams and visiting members of the media and NFL organization who spend money in the regional economy before and after the game. The third aspect to the analysis considers that the stadium will be a cultural center hosting events other than NFL games. Activity associated with all other events occurring at the stadium is reviewed and its direct, indirect and induced economic impact estimated.
Economic Impact Analysis Economic impact analysis is used to estimate the overall economic activity, including spill-over and multiplier impacts (often referred to as indirect and induced activity), which occurs as a result of a particular business, event or geography (direct activity).
L
Economic Impact Analysis NFL Los Angeles Stadium in Carson
Institute for Applied Economics 3
The initial economic activity related to the construction of the Los Angeles Stadium in Carson and to its ongoing operations as well as ancillary activities is the purchase of goods and services from local vendors and the wages and benefits paid to local workers. This injection of funds into the county circulates from the Los Angeles Stadium to the owner and employees of establishments that help supply the goods and services that the stadium and franchises purchase. These suppliers in turn hire workers and buy goods and services to facilitate their business. The developers will spend millions of dollars for the wages and benefits of construction employees. These workers, as well as employees of all suppliers, spend a portion of their incomes on groceries, rent, vehicle expenses, healthcare, entertainment, and so on. This recirculation of the original expenditures multiplies their impact through these indirect and induced effects. The extent to which the initial expenditures multiply is estimated using economic models that depict the relationships between industries (such as construction and its suppliers) and among different economic agents (such as industries and their employees). These models are built upon actual data of expenditure patterns reported to the U.S. Bureau of Labor Statistics, the U.S. Census Bureau and the Bureau of Economic Analysis of the U.S. Department of Commerce. Data is regionalized so that it reflects and incorporates local conditions such as prevailing wages rates, expenditure patterns, and resource availability and costs. The magnitude of the multiplying effect differs from one region to another depending on the extent to which the local region can fill the demand for all rounds of supplying needs. For example, the automobile manufacturing industry has high multipliers in Detroit and Indiana since these regions have deep and wide supplier networks, while the same industry multiplier in Phoenix is quite small. In another example, the jobs multiplier for the construction industry is higher in, say, Arkansas, than in California because the same amount of spending will purchase fewer workers in Los Angeles than in Little Rock. Multipliers can also differ from year to year as relative material and labor costs change and as the production “recipe” of industries change. For example, the IT revolution significantly reduced the job multiplier of many industries (such as manufacturing, accounting, architecture and publishing) as computers replaced administrative and production workers.
Approach and Methodology Economic impact analysis typically begins with an increase in final demand for an industry’s output, such as a purchase of football game tickets, concessions, legal services, or rent and utilities. Alternatively, analysis may be conducted using detailed expenditures, such as the team’s spending on employees, medical care, rent, legal costs and so on. With complete and detailed information, these two approaches should be comparable for most industries. Spending patterns within the professional sports business can be quite idiosyncratic. The industry includes not only highly-compensated players, such as star centers with the Lakers or pitching sensations with the Dodgers, but also everyday players who are likely to be paid less than stratospheric salaries. Professional football is even more singular in that its players and owners receive significant compensation that may or may not stay in the region. These payments are made from the revenues generated not only from ticket sales (and premium seats) but also from sponsorships, broadcasting rights, royalties, NFL transfers and more. To model the impact of adding one or two NFL franchises to the local market, a hybrid approach is used here, as follows: Team and stadium operations are modeled with an expenditures approach using operational budgets provided by the Teams for employee costs, services and other expenses. These expenditures exclude players’ salaries, which are modeled as increases in incomes for households earning more than $150,000 per year (the highest household income category). This methodology
NFL Los Angeles Stadium in Carson Economic Impact Analysis
4 Institute for Applied Economics
will allow for leakage from the region for non-local spending, and will also take into account the higher savings rates of upper-income households. These incomes are subject to usual taxation. The overall player salary budget is reduced to account for approximately 25 percent of team personnel living elsewhere during the off-season. The remaining player costs are reduced by an additional 25 percent to account for immediate expatriation. Other on-site operations such as concessions, merchandise and parking are modeled with a revenue approach using estimates provided by the client. Increases in final demand for off-site goods and services by visiting teams and NFL officials such as accommodations and food and beverages are estimated using industry averages and survey data as described in the narrative. While this analysis includes spending as a result of activities at the stadium and team business activities, spending that may occur elsewhere in the region by game attendees before or after the game is not considered. NFL-related revenues that are not included in the analysis are: local and national broadcasting rights, NFL royalties, local advertising revenues, signage, promotions and NFL transfers. These revenues are typically significant but the extent to which they remain locally is not known. The impacts of non-NFL events are estimated using projected attendance and ticket sales, and on-site concession and merchandise estimates. Not included in the analysis is off-site regional spending of event-goers such as restaurant meals or gas. Where data has been provided by the client, reasonableness of estimates is assessed using comparable data published in economic analysis conducted in numerous studies of stadium construction and renovation, stadium operations and professional sports team operations, including those of NFL teams, as well as other data as appropriate. The metrics used to determine the value of the economic impact include employment, labor income and the value of output. Employment includes full-time, part-time, permanent and seasonal employees and the self-employed, and is measured on a job-count basis regardless of the number of hours worked. Labor income includes all income received by both payroll employees and the self-employed, including wages and benefits
such as health insurance and pension plan contributions. Output is the value of the goods and services produced. For most industries, this is simply the revenues generated through sales; for others, in particular retail industries, output is the value of the services supplied. Value added is the contribution to regional GDP of the investment or ongoing activity. Estimates are developed using software and data from the IMPLAN Group, LLC, which traces inter-industry transactions resulting from an increase in demand in a given region. The economic region of interest is Los Angeles County. The total estimated economic impact includes direct, indirect and induced effects. Direct activity includes the materials purchased and the employees hired by the developer itself, and in the case of the operations, by each hiring onsite entity. Indirect effects are those which stem from the employment and business revenues motivated by the purchases made by the developer or hiring entity and any of its suppliers. Induced effects are those generated by the spending of employees whose wages are sustained by both direct and indirect spending. All values are expressed in 2015 dollars.
Other Benefits and Considerations In addition to quantifiable economic and fiscal impacts described in this analysis, there is additional activity related to having one or two NFL franchises in the local area which has not been considered here. As part of the NFL organization, it is a possibility that the Los Angeles Stadium in Carson will host one, if not more, Super Bowls in the first decade of its operations. As a marquee sporting event, the Super Bowl attracts hundreds of thousands of visitors from around the nation and the globe—most of whom will be out-of-town visitors. These fans often stay for several days to enjoy Super Bowl festivities and frequent local establishments, including not only hotels and restaurants but also taking the opportunity to visit the numerous tourist destinations that make Los Angeles a premier vacation spot for millions of people around the world. The spending of these fans and visitors will likely add millions to local government coffers and generate a significant economic impact, which is not included in this study.
Economic Impact Analysis NFL Los Angeles Stadium in Carson
Institute for Applied Economics 5
In addition to those who travel to Los Angeles, certainly a significant intangible benefit is the exposure of Los Angeles to a national and international audience. Through the media and broadcasting of NFL games, the area would be marketed to millions of people who will be exposed to the cultural and natural amenities that Los Angeles has to offer. Along with the economic benefits directly attributable to the presence of one or both NFL teams, local community and philanthropic groups will likely benefit from the active support that the NFL and its franchises typically contribute. Players and staff volunteer and participate in local community events in their home markets, often at food banks, youth fitness programs and violence prevention programs. It is possible that property values will change in the vicinity of Los Angeles Stadium in Carson. Certain businesses and households might be attracted to the locale while others might move out of the area. There may be a displacement effect from the presence of the NFL in Los Angeles County as local residents who might have spent their entertainment dollars on other activities might opt to attend a game instead. However, the extent to which this may occur is not known, and it may be just as likely that entertainment spending previously allocated to regions outside of Los Angeles County will be repatriated.
NFL Los Angeles Stadium in Carson Economic Impact Analysis
6 Institute for Applied Economics
2 Stadium Construction
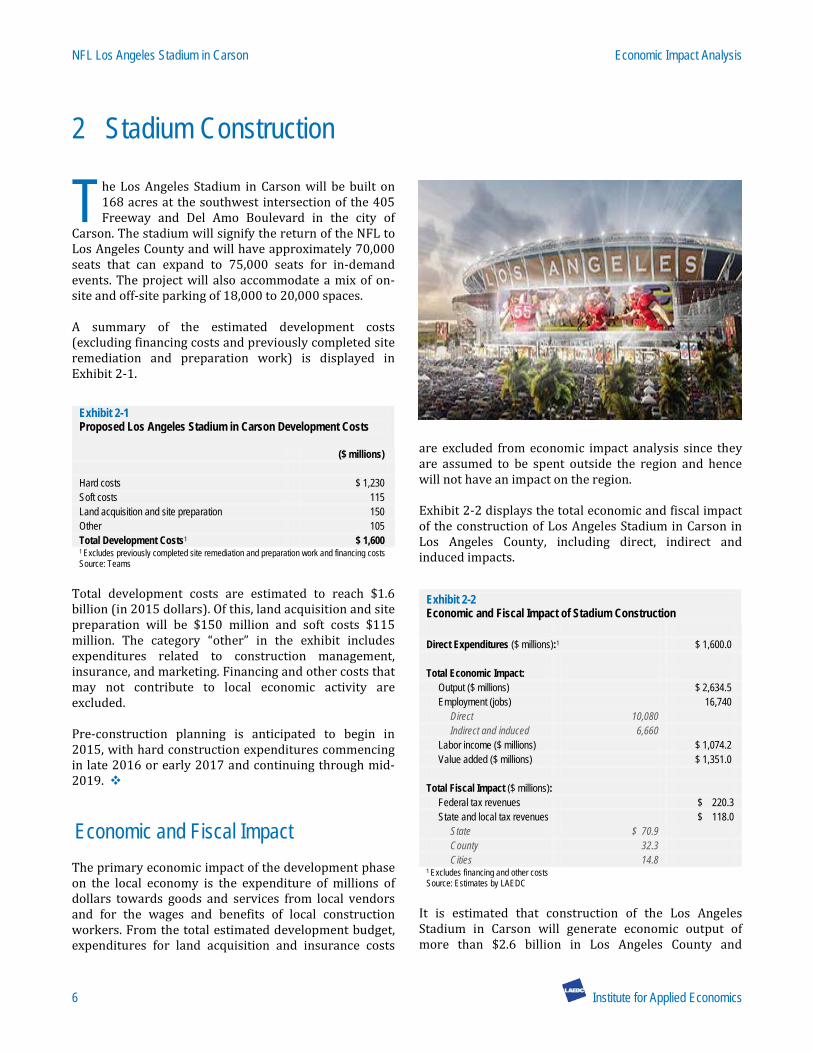
he Los Angeles Stadium in Carson will be built on 168 acres at the southwest intersection of the 405 Freeway and Del Amo Boulevard in the city of
Carson. The stadium will signify the return of the NFL to Los Angeles County and will have approximately 70,000 seats that can expand to 75,000 seats for in-demand events. The project will also accommodate a mix of on-site and off-site parking of 18,000 to 20,000 spaces. A summary of the estimated development costs (excluding financing costs and previously completed site remediation and preparation work) is displayed in Exhibit 2-1.
Exhibit 2-1 Proposed Los Angeles Stadium in Carson Development Costs ($ millions) Hard costs $ 1,230 Soft costs 115 Land acquisition and site preparation 150 Other 105 Total Development Costs1 $ 1,600 1 Excludes previously completed site remediation and preparation work and financing costs Source: Teams
Total development costs are estimated to reach $1.6 billion (in 2015 dollars). Of this, land acquisition and site preparation will be $150 million and soft costs $115 million. The category “other” in the exhibit includes expenditures related to construction management, insurance, and marketing. Financing and other costs that may not contribute to local economic activity are excluded. Pre-construction planning is anticipated to begin in 2015, with hard construction expenditures commencing in late 2016 or early 2017 and continuing through mid-2019.
Economic and Fiscal Impact The primary economic impact of the development phase on the local economy is the expenditure of millions of dollars towards goods and services from local vendors and for the wages and benefits of local construction workers. From the total estimated development budget, expenditures for land acquisition and insurance costs
are excluded from economic impact analysis since they are assumed to be spent outside the region and hence will not have an impact on the region. Exhibit 2-2 displays the total economic and fiscal impact of the construction of Los Angeles Stadium in Carson in Los Angeles County, including direct, indirect and induced impacts.
Exhibit 2-2 Economic and Fiscal Impact of Stadium Construction Direct Expenditures ($ millions):1 $ 1,600.0 Total Economic Impact: Output ($ millions) $ 2,634.5 Employment (jobs) 16,740 Direct 10,080 Indirect and induced 6,660 Labor income ($ millions) $ 1,074.2 Value added ($ millions) $ 1,351.0 Total Fiscal Impact ($ millions): Federal tax revenues $ 220.3 State and local tax revenues $ 118.0 State $ 70.9 County 32.3 Cities 14.8 1 Excludes financing and other costs Source: Estimates by LAEDC
It is estimated that construction of the Los Angeles Stadium in Carson will generate economic output of more than $2.6 billion in Los Angeles County and
T
Economic Impact Analysis NFL Los Angeles Stadium in Carson
Institute for Applied Economics 7
support 16,740 jobs with labor income of almost $1.1 billion during the four years that the development will take place. In addition, the development’s contribution to regional GDP will be more than $1.35 billion over the development period. This economic activity is projected to generate more than $118 million in state and local taxes and more than $220 million in federal taxes. The majority of the state and local taxes will be earned at the state level, while the County will earn $32.3 million and cities (in the aggregate) will earn $14.8 million. Disaggregation of taxes (including direct, indirect and induced) by type is shown in Exhibit 2-3.
Exhibit 2-3 Detailed Fiscal Impact of Los Angeles Stadium in Carson Construction By Type of Tax ($ millions):
Personal income taxes $ 111.6 Social insurance 118.4 Sales and excise taxes 42.9 Property taxes 30.9 Corporate profits taxes 17.2 Other 16.5 Total $ 338.3 By Type of Government ($ millions): Federal $ 220.3 State 70.9 County 32.3 Property taxes1 $ 25.4 Sales taxes 6.9 Cities 14.8 Property taxes1 $ 5.6 Sales taxes 3.7 Other taxes and fees 5.5 Total $ 338.3 1 Excludes property taxes levied on redeveloped site Source: Estimates by LAEDC
Personal income taxes paid by all employees of direct, indirect and induced activity will account for $111.6 million. Social insurance payments are made to both state and federal governments and will be $118.4 million. Other sources of tax revenues include sales and excise taxes (including transient occupancy taxes), taxes on corporate profits and other taxes and fees paid by businesses and households, including utility taxes. The federal government will collect almost two-thirds of all tax revenues in Los Angeles County attributed to stadium construction, earning $220.3 million consisting mainly of social insurance taxes, personal income taxes and corporate profits taxes. The state of California will
collect $70.9 million, which includes sales tax revenues, personal income taxes, corporate profits taxes, and other fees and royalties. Los Angeles County will collect $32.3 million, largely from property taxes and its share of sales tax revenues. Cities will receive $14.8 million from a share of sales taxes, transient occupancy taxes, property taxes and licenses and fees, most of which will accrue to the City of Carson. The total economic impacts will spill across industries through indirect and induced effects. The complete list of estimated impacts by industry sector is shown in Exhibit 2-4 for Los Angeles County.
Exhibit 2-4 Distribution of Impacts of Stadium Construction by Industry Sector
Jobs
Labor Income
($ millions) Output
($ millions) Natural resources 25 $ 3.5 $ 8.6 Utilities 7 1.1 5.8 Construction 9,162 597.6 1,384.5 Manufacturing 230 16.2 145.1 Wholesale trade 417 31.5 98.1 Retail trade 731 28.7 66.1 Transportation and warehousing 360 22.8 57.6 Information 122 15.7 66.2 Finance and insurance 425 31.7 81.1 Real estate and rental 429 13.7 161.7 Professional and technical services 1,655 164.0 285.9 Management of companies 69 7.9 16.2 Administrative and waste services 550 20.0 35.6 Educational services 178 8.8 14.4 Health and social services 924 52.8 88.8 Arts, entertainment and recreation 173 6.4 14.1 Accommodation and food services 712 21.4 48.6 Other services 498 22.5 38.2 Government and non-NAICS 68 7.9 17.8 Total 16,740 $ 1,074.2 $ 2,634.5 Source: Estimates by LAEDC
Of the 16,740 jobs generated, 9,162 will be in the construction sector as this is the industry that is responsible for most of the direct activity. However, all industry sectors will experience a positive economic impact from the stadium construction spending, especially professional and technical services, health and social services, retail trade, finance and insurance and accommodation and food services. The values in the exhibit should be interpreted as illustrative of industry effects rather than precise given model and data limitations.
NFL Los Angeles Stadium in Carson Economic Impact Analysis
8 Institute for Applied Economics
3 NFL-Related Activity at the Los Angeles Stadium in Carson
he Los Angeles Stadium in Carson is expected to host at least ten games per season (two pre-season and eight regular season games) for each NFL team.
It is proposed that the stadium host two teams, resulting in 20 home games per season and almost twice the overall economic activity associated with the stadium. The direct economic impact of ongoing operations of the stadium includes on-site game day revenues such as ticket sales, concessions and parking revenues, and off-site revenues such as visiting team and media expenditures on accommodations and food. Potential post-season home playoff games played at the stadium are not included in the analysis.
Team and Stadium Revenues Revenues are derived from ticket sales, sponsorships and premium inventory (suites and club seats), merchandise (such as souvenirs), concessions and parking. These revenues are substantial and would not be accrued in the region without the presence of the stadium and the NFL franchise(s). Stadium revenues will depend on the number of home games played. While many revenues may nearly double by having two resident teams, not all will. To gauge the magnitude of these revenues, Exhibit 3-1 presents data from the 2014 Fan Cost Index (FCI) published by the Team Marketing Report for the Raiders (playing in Oakland) and the Chargers (playing in San Diego).
Exhibit 3-1 NFL Fan Cost Index Raiders Chargers Average ticket $ 64.80 $ 84.55 Average premium ticket 138.93 170.00 Beverages 39.50 41.00 Food 27.00 24.00 Parking 35.00 25.00 Souvenirs (program, caps, etc.) 60.00 50.00 Fan Cost Index (FCI) $ 420.70 $ 478.30 Per capita $ 105.18 $ 119.55 Per capita merchandise, concessions, parking $ 40.38 $ 35.00 Source: Team Marketing Report
The FCI reflects the average cost for a family of four to attend a sporting event and includes four season tickets, two beers, four soft drinks, four hot dogs, parking, two programs and two adult caps. Revenue estimates for the Los Angeles Stadium in Carson are presented in Exhibit 3-2.
Exhibit 3-2 Projected Team and Stadium Revenues One Team Two Teams Projected annual attendance 680,000 1,360,000 Team and stadium operations ($ millions) $ 130.0 $ 240.0 Net player costs ($ millions) 115.0 230.0 Other On-Site Revenues ($ millions): Ticket sales / premium seats / sponsorships $ 185.0 $ 340.0 Concessions / merchandise / parking 23.6 47.1 Total $ 208.6 $ 387.1 Per capita on-site revenues $ 307 $ 285 Per capita ticket / premium / sponsorships $ 272 $ 250 Per capita merchandise, concessions, parking $ 34.65 $ 34.65 Source: Teams
These revenues are consistent with comparable studies conducted of stadium and professional sports operations, as discussed above. While economic activity is expected to be greater with two teams compared to a single team, it may not precisely double in all categories
T
Economic Impact Analysis NFL Los Angeles Stadium in Carson
Institute for Applied Economics 9
of revenues due to operational efficiencies at the stadium and the type of activity, such as sponsorships. The franchises expect near full attendance at each of eight regular season home games and two pre-season games. During 2014, the Chargers averaged 65,432 in football attendance for home games and the Raiders averaged 57,416. Given the size of the Los Angeles market with more than 21 million people, it seems reasonable that attendance at home games after relocation will exceed those in their current markets. Team and stadium operations spending are estimated at $245.0 million for a single team and $470.0 million for two teams. Players’ costs are analyzed separately from operational expenditures. Approximately 75 percent of the players and 95 percent of other team personnel are reported to live in the local region year round. Net overall player costs included above have been adjusted to account for those living elsewhere during the off-season, and are discounted by an additional 25 percent to accommodate immediate expatriation. Of other on-site revenues, the per capita ticket, premium inventory (suites and club seats) and sponsorship revenues are $272 for a single team and $250 for two teams at the stadium, both of which are above that shown for both the Raiders and the Chargers. However, it may be reasonable to assume a significant premium given the larger market and the newer facility with more premium suites and seats. Also, the FCI Index does not reflect sponsorship revenues, which will be significant and which we are unable to isolate with the confidential data received from the client. However, because premium inventory sales and sponsorships are dependent on the strength of the local market and are highly variable, it may be more relevant to compare the per capita spend on other items between the FCI and the data provided by client. This comparison shows that the FCI index on concessions, parking and merchandise is $40.38 per capita for Raiders games and $35.00 per capita for Chargers games. The client’s data shows this per capita spend to be $34.65, well within range of the FCI index for these items. Accordingly, operational expenditures and increased household incomes due to players’ salaries along with the on-site revenues from concessions, merchandise and parking will form the basis of the on-site direct revenues of the stadium in estimating the total economic impact. Not included in this analysis are other sources of revenue that may have an economic impact in the region including local and national broadcasting rights, NFL
royalties, local advertising revenues, signage, promotions and NFL transfers. Playoff games, SuperBowls and other NFL-related events which may occur are also not included.
Off-Site NFL-Related Spending In addition to the thousands of fans that attend each NFL game, there are associated NFL personnel who travel to away games. These include the visiting team members and their staff, out-of-town media, local media, officiating crews and other game staff, and NFL officials. The spending patterns of these groups of visitors may vary, but for the purpose of aggregation here, we assume that the daily expenditure estimates for domestic business travelers provided by the Los Angeles Convention and Tourism Board are a representative estimate for these visitors. The number of non-spectator visitors and their average daily spend are shown in Exhibit 3-3. This is certainly an underestimate since it is assumed that each of the visiting personnel spends only one day in the Los Angeles region, which is highly unlikely. Visiting team expenditures are estimated using client data from historical records. This data suggests that visiting teams will spend approximately $1.5 million annually in travel costs for ten away games. These expenditures are a combination of accommodations and food and beverages.
Exhibit 3-3 Total NFL-Related Visitors Per Season One Team Two Teams Visiting national media 1,000 2,000 Visiting local media 60 120 NFL game staff 350 700 NFL officials 100 200 Total Each Season 1,510 3,020 Per capita spend $ 255 $ 255 Total expenditures $ 1,230,090 $ 2,460,180 Visiting team expenditures $ 1,500,000 $ 3,000,000 Total off site revenues ($millions) $ 1.8 $ 3.7 Sources: Los Angeles Convention and Tourism Board; Teams; LAEDC Estimates
Of course, the largest number of game-related visitors will be the fans coming to games. Those coming from further afield, such as loyal Chargers fans driving from San Diego or loyal Raiders fans coming from Oakland,
NFL Los Angeles Stadium in Carson Economic Impact Analysis
10 Institute for Applied Economics
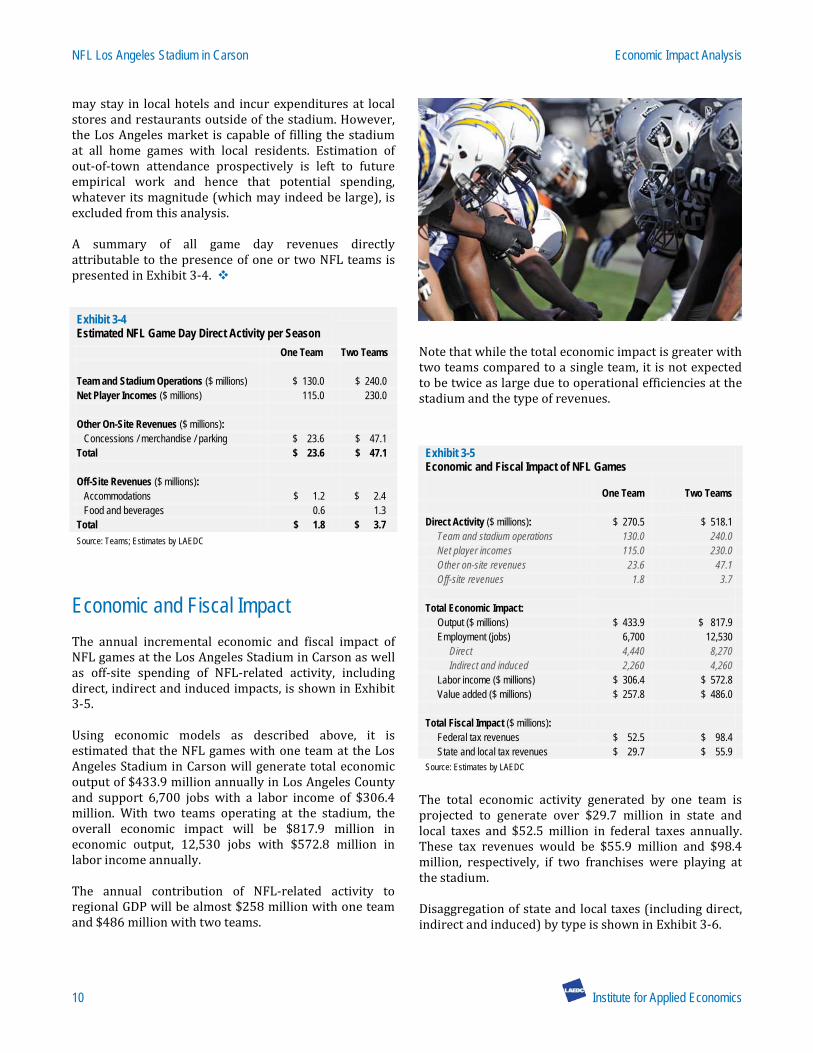
may stay in local hotels and incur expenditures at local stores and restaurants outside of the stadium. However, the Los Angeles market is capable of filling the stadium at all home games with local residents. Estimation of out-of-town attendance prospectively is left to future empirical work and hence that potential spending, whatever its magnitude (which may indeed be large), is excluded from this analysis. A summary of all game day revenues directly attributable to the presence of one or two NFL teams is presented in Exhibit 3-4.
Exhibit 3-4 Estimated NFL Game Day Direct Activity per Season
One Team Two Teams Team and Stadium Operations ($ millions) $ 130.0 $ 240.0 Net Player Incomes ($ millions) 115.0 230.0 Other On-Site Revenues ($ millions): Concessions / merchandise / parking $ 23.6 $ 47.1 Total $ 23.6 $ 47.1 Off-Site Revenues ($ millions): Accommodations $ 1.2 $ 2.4 Food and beverages 0.6 1.3 Total $ 1.8 $ 3.7 Source: Teams; Estimates by LAEDC
Economic and Fiscal Impact The annual incremental economic and fiscal impact of NFL games at the Los Angeles Stadium in Carson as well as off-site spending of NFL-related activity, including direct, indirect and induced impacts, is shown in Exhibit 3-5. Using economic models as described above, it is estimated that the NFL games with one team at the Los Angeles Stadium in Carson will generate total economic output of $433.9 million annually in Los Angeles County and support 6,700 jobs with a labor income of $306.4 million. With two teams operating at the stadium, the overall economic impact will be $817.9 million in economic output, 12,530 jobs with $572.8 million in labor income annually. The annual contribution of NFL-related activity to regional GDP will be almost $258 million with one team and $486 million with two teams.
Note that while the total economic impact is greater with two teams compared to a single team, it is not expected to be twice as large due to operational efficiencies at the stadium and the type of revenues.
Exhibit 3-5 Economic and Fiscal Impact of NFL Games One Team Two Teams Direct Activity ($ millions): $ 270.5 $ 518.1 Team and stadium operations 130.0 240.0 Net player incomes 115.0 230.0 Other on-site revenues 23.6 47.1 Off-site revenues 1.8 3.7 Total Economic Impact: Output ($ millions) $ 433.9 $ 817.9 Employment (jobs) 6,700 12,530 Direct 4,440 8,270 Indirect and induced 2,260 4,260 Labor income ($ millions) $ 306.4 $ 572.8 Value added ($ millions) $ 257.8 $ 486.0 Total Fiscal Impact ($ millions): Federal tax revenues $ 52.5 $ 98.4 State and local tax revenues $ 29.7 $ 55.9 Source: Estimates by LAEDC
The total economic activity generated by one team is projected to generate over $29.7 million in state and local taxes and $52.5 million in federal taxes annually. These tax revenues would be $55.9 million and $98.4 million, respectively, if two franchises were playing at the stadium. Disaggregation of state and local taxes (including direct, indirect and induced) by type is shown in Exhibit 3-6.
Economic Impact Analysis NFL Los Angeles Stadium in Carson
Institute for Applied Economics 11
Sales taxes (including transient occupancy taxes) will be $11.2 million from the presence of one team and $21.1 million from two teams. Property taxes will add $8.1 million or $15.2 million, respectively (excluding property taxes from the site). The state of California will earn $17.3 million or $32.5 million, while the county and local governments will collect $12.4 million or $23.4 million.
Exhibit 3-6 Detailed Fiscal Impact of NFL Games at Los Angeles Stadium (Including Direct, Indirect and Induced Impacts) By Type of Tax ($ millions): One Team Two Teams
Income taxes $ 26.0 $ 49.0 Social insurance 32.2 60.1 Sales and excise taxes 11.2 21.1 Property taxes 8.1 15.2 Other 4.7 8.8 Total $ 82.1 $ 154.3 By Type of Government ($ millions): Federal $ 52.4 $ 98.4 State 17.3 32.5 County 8.4 15.8 Property taxes1 6.6 12.5 Sales taxes 1.8 3.3 Cities 4.0 7.6 Property taxes1 1.5 2.7 Sales taxes 1.1 2.1 Other taxes and fees 1.4 2.7 Total $ 82.1 $ 154.3 1 Excludes property taxes levied on redeveloped site Source: Estimates by LAEDC
In addition to the taxes shown above, the redevelopment will impact the assessed value of the site’s property and hence generate an additional annual increase in property taxes, which is not included in Exhibit 3-6. The total economic impacts from having one or two NFL teams housed at the Los Angeles Stadium in Carson will be spread across industries through indirect and induced effects. The complete list of estimated impacts by industry sector is shown in Exhibit 3-7 for two teams (estimates for a single team is available on request). Most of the new jobs generated will be in the arts, entertainment and recreation industry because this industry includes professional sports. However, all industry sectors will experience a positive economic impact from the activities associated with an NFL stadium—in particular, retail trade, accommodation and food services and health and social services industry sectors will benefit.
The values in the exhibit should be interpreted as illustrative of industry effects rather than precise given model and data limitations.
Exhibit 3-7 Distribution of Impacts of Two NFL Teams at Los Angeles Stadium
Jobs Labor
Income ($ millions)
Output ($ millions)
Natural resources 4 $ 0.5 $ 1.2 Utilities 3 0.5 2.7 Construction 30 2.0 5.6 Manufacturing 32 2.2 23.8 Wholesale trade 79 6.0 18.6 Retail trade 646 23.4 48.4 Transportation and warehousing 116 6.8 17.7 Information 64 8.2 34.8 Finance and insurance 257 19.0 50.0 Real estate and rental 212 5.1 95.0 Professional and technical services 188 15.5 30.8 Management of companies 34 3.9 8.0 Administrative and waste services 269 9.8 18.1 Educational services 154 7.6 12.4 Health and social services 658 37.1 62.4 Arts, entertainment and recreation 8,689 383.5 298.5 Accommodation and food services 726 23.0 55.0 Other services 332 14.3 24.8 Government and non-NAICS 37 4.4 10.0 Total 12,530 $ 572.8 $ 817.9 Source: Estimates by LAEDC
NFL Los Angeles Stadium in Carson Economic Impact Analysis
12 Institute for Applied Economics
4 Other Stadium Events
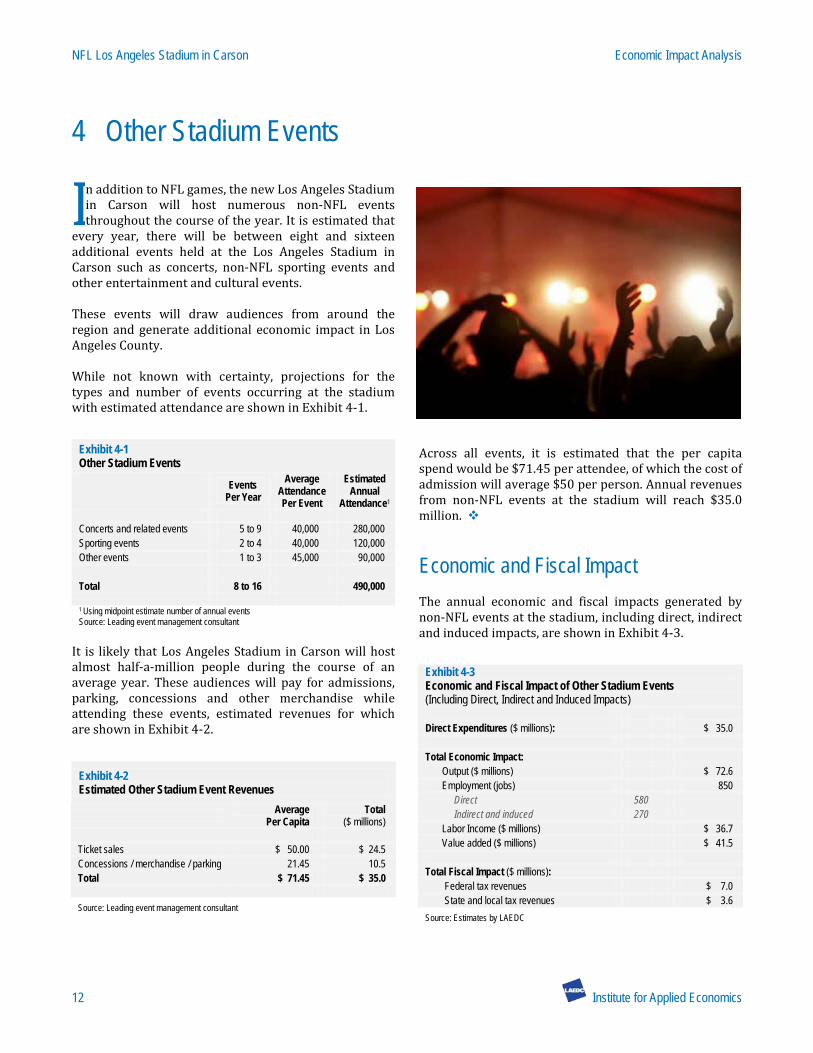
n addition to NFL games, the new Los Angeles Stadium in Carson will host numerous non-NFL events throughout the course of the year. It is estimated that
every year, there will be between eight and sixteen additional events held at the Los Angeles Stadium in Carson such as concerts, non-NFL sporting events and other entertainment and cultural events. These events will draw audiences from around the region and generate additional economic impact in Los Angeles County. While not known with certainty, projections for the types and number of events occurring at the stadium with estimated attendance are shown in Exhibit 4-1.
Exhibit 4-1 Other Stadium Events Events
Per Year Average
Attendance Per Event
Estimated Annual
Attendance1 Concerts and related events 5 to 9 40,000 280,000 Sporting events 2 to 4 40,000 120,000 Other events 1 to 3 45,000 90,000 Total 8 to 16 490,000 1 Using midpoint estimate number of annual events Source: Leading event management consultant
It is likely that Los Angeles Stadium in Carson will host almost half-a-million people during the course of an average year. These audiences will pay for admissions, parking, concessions and other merchandise while attending these events, estimated revenues for which are shown in Exhibit 4-2.
Exhibit 4-2 Estimated Other Stadium Event Revenues
Average Per Capita
Total ($ millions)
Ticket sales $ 50.00 $ 24.5 Concessions / merchandise / parking 21.45 10.5 Total $ 71.45 $ 35.0 Source: Leading event management consultant
Across all events, it is estimated that the per capita spend would be $71.45 per attendee, of which the cost of admission will average $50 per person. Annual revenues from non-NFL events at the stadium will reach $35.0 million.
Economic and Fiscal Impact The annual economic and fiscal impacts generated by non-NFL events at the stadium, including direct, indirect and induced impacts, are shown in Exhibit 4-3.
Exhibit 4-3 Economic and Fiscal Impact of Other Stadium Events (Including Direct, Indirect and Induced Impacts) Direct Expenditures ($ millions): $ 35.0 Total Economic Impact: Output ($ millions) $ 72.6 Employment (jobs) 850 Direct 580 Indirect and induced 270 Labor Income ($ millions) $ 36.7 Value added ($ millions) $ 41.5 Total Fiscal Impact ($ millions): Federal tax revenues $ 7.0 State and local tax revenues $ 3.6 Source: Estimates by LAEDC
I
Economic Impact Analysis NFL Los Angeles Stadium in Carson
Institute for Applied Economics 13
It is estimated that non-NFL events at the Los Angeles Stadium in Carson will generate economic output of $72.6 million annually in Los Angeles County and support 850 jobs with a labor income of $36.7 million. The annual contribution of non-NFL-related activity to regional GDP will be almost $41.5 million per year. This economic activity is projected to generate over $3.6 million in state and local taxes and $7.0 million in federal taxes annually. Disaggregation of taxes (including direct, indirect and induced) by type is shown in Exhibit 4-4. Exhibit 4-4 Detailed Fiscal Impact of Non-NFL Events at Los Angeles Stadium (Including Direct, Indirect and Induced Impacts) By Type of Tax ($ millions):
Income taxes $ 4.1 Social insurance 3.8 Sales and excise taxes 1.2 Property taxes 0.9 Other 0.5 Total $ 10.6 By Type of Government ($ millions): Federal $ 7.0 State 2.2 County 0.9 Property taxes 0.7 Sales taxes 0.2 Cities 0.4 Property taxes 0.2 Sales taxes 0.1 Other taxes and fees 0.1 Total $ 10.6 Source: Estimates by LAEDC
Non-NFL events held at the Los Angeles Stadium in Carson will generate more than $10 million in tax revenues, the majority of which will be earned at the federal level. The state of California will earn $2.2 million annually, while the county and local governments will earn $0.9 million and $0.4 million annually from non-NFL events occurring at the stadium.
The total economic impacts from hosting non-NFL events will also spread across industries through induced and indirect effects. The complete list of estimated impacts by disaggregated industry sector is shown in Exhibit 4-4.
Exhibit 4-5 Distribution of Impacts of Non-NFL Events at Los Angeles Stadium
Jobs Labor
Income ($ millions)
Output ($ millions)
Natural resources $ 0.1 $ 0.1 Utilities 0.0 0.2 Construction 2 0.1 0.4 Manufacturing 2 0.1 1.9 Wholesale trade 5 0.4 1.1 Retail trade 24 0.9 2.0 Transportation and warehousing 16 0.8 1.7 Information 5 0.7 2.7 Finance and insurance 21 1.6 3.9 Real estate and rental 20 0.5 6.7 Professional and technical services 17 1.4 2.8 Management of companies 3 0.3 0.7 Administrative and waste services 28 1.1 1.9 Educational services 14 0.6 0.9 Health and social services 32 1.8 3.1 Arts, entertainment and recreation 570 22.8 34.4 Accommodation and food services 71 2.3 5.8 Other services 18 0.8 1.3 Government and non-NAICS 5 0.5 1.0 Total 850 $ 36.7 $ 72.6 Source: Estimates by LAEDC
The values in this exhibit should be interpreted as illustrative of industry effects rather than precise given model and data limitations.

NFL Los Angeles Stadium in Carson Economic Impact Analysis
14 Institute for Applied Economics
Economic Impact Analysis NFL Los Angeles Stadium in Carson
Institute for Applied Economics 15
Study Authors Christine Cooper, Ph.D. Vice President Dr. Cooper leads the Institute for Applied Economics whose work involves research in regional issues such as economic impact studies, regional industry analysis and forecasts, workforce development analysis, and issue studies related to the L.A. County Strategic Plan for Economic Development. Her fields of expertise include development economics, environmental economics, regional analysis and urban sustainability. Prior to joining the LAEDC, Dr. Cooper was a co-founder of a start-up company in Hong Kong concentrating on equity transactions software and computer accessories manufacturing, which expanded production into the special economic zone of Shenzhen, China, and distributed products throughout the United States and Asia. With her business partner, she also established the first authorized Apple Computer retailer in China. She has been a lecturer at California State University, Long Beach and at the Pepperdine Graziadio School of Business and Management. Dr. Cooper is a citizen of the United States and Canada. She earned a Bachelor of Arts in Economics from Carleton University in Ottawa, Canada, and a Ph.D. in Economics from the University of Southern California. With funding from the National Science Foundation, she earned a Graduate Certificate in Environmental Sciences, Policy and Engineering. Her current research includes industry cluster determination and performance in the regional economy, commuting and job allocation patterns, and workforce development issues. Shannon M. Sedgwick Economist Ms. Sedgwick joined the LAEDC team in June of 2008 as an Economic Research Assistant for the Kyser Center for Economic Research. In that role she assisted both Economic Research and the Consulting Practice of the LAEDC with data collection and research, managing multiple data sets covering the State of California, Southern California, its counties and their sub-regions. In addition to writing sections of LAEDC’s Economic Forecasts, she was responsible for the monthly Business Scan containing a collection of Los Angeles County economic indicators, the annual L.A. Stats containing the most frequently requested statistics for Los Angeles and its
surrounding counties, and was a regular contributor to the weekly economic newsletter, e-Edge. In her current capacity as Economist, Ms. Sedgwick develops subject-specific information and data interpretation for economic impact, demographic, transportation, industry and issue studies. She performs research, data collection and organization, analysis and report preparation. Her work focuses on demographics, industry clusters and workforce development. Ms. Sedgwick is also proficient at conducting geospatial analysis. Before joining the LAEDC, Ms. Sedgwick managed an industrial and steel supply company located in the Inland Empire. There she identified and targeted a diverse customer base, and analyzed product and customer patterns in the local industrial market to successfully increase revenues. A Southern California native, Ms. Sedgwick received her Bachelor of Arts in Economics from the University of Southern California (USC) with a minor in Architecture. She has been a member of the national and the Los Angeles Chapter of the National Association for Business Economics (NABE) since 2008. Somjita Mitra, Ph.D. Economist Somjita Mitra joined the LAEDC as an Economist in June 2013. She is involved in planning, designing and conducting research and analysis for consulting clients and local businesses and governments, as well as for LAEDC’s internal departments. Her focus is in regional analysis, economic impact studies and the industrial and occupational structure of local economies. Before joining the LAEDC, Dr. Mitra was an Economist for a local economic research and litigation consulting company evaluating economic damages, estimating lost profits, identifying key economic issues and developing necessary analytical and empirical frameworks. Prior to this, Dr. Mitra was a Project Director for a consumer research firm in Los Angeles where she managed projects that identified and analyzed key market issues for small, local firms as well as multinational corporations. Dr. Mitra received her Bachelor of Arts in Economics and Political Science from the University of California, Los Angeles and her Master of Arts in Politics, Economics and Business as well as her Ph.D. in Economics from Claremont Graduate University. Dr. Mitra enjoys volunteering in the local community and is actively involved in both women’s welfare and animal rescue organizations.

INSTITUTE FOR APPLIED ECONOMICS 444 S. Flower Street, 37th Floor Los Angeles, CA 90071