Embed Size (px)
Citation preview
Final Report
The Next Decade of Housing in Minnesota
Final Report
November 17, 2003
The Next Decade of Housing in Minnesota
Prepared for
Family Housing Fund Midwest Plaza, Suite 1650 Nicollet Mall Minneapolis, Minnesota 55402 and Minnesota Housing Finance Agency 400 Sibley Street, Suite 300 St. Paul, Minnesota 55101-1998 and Greater Minnesota Housing Fund 332 Minnesota Street, Suite 1310 East St. Paul, Minnesota 55101 Prepared by
BBC Research & Consulting 3773 Cherry Creek N. Drive, Suite 850 Denver, Colorado 80209-3827 303.321.2547 fax 303.399.0448 www.bbcresearch.com [email protected]

Table of Contents
I. Introduction
Purpose of the Study ................................................................................................................... I–1
Reporting of Results..................................................................................................................... I–1
How to Read This Document ....................................................................................................... I–2
Overview of Model ...................................................................................................................... I–2
Policy Prescriptions ...................................................................................................................... I–3
Acknowledgements ..................................................................................................................... I–4
II. Methodology
Key Assumptions ........................................................................................................................ II–1
Definition of Low-Income Households ........................................................................................ II–3
Data Used................................................................................................................................... II–4
Limitations.................................................................................................................................. II–5
Presentation of Data ................................................................................................................... II–5
Detailed Description of Exhibits .................................................................................................. II–6
III. Summary of Findings
Key Conclusions ........................................................................................................................ III–1
Study Findings........................................................................................................................... III–1
Study Limitations..................................................................................................................... III–11
IV. Housing Need Exhibits
Statewide Needs
Twin Cities Metropolitan Area Needs
Greater Minnesota Needs
BBC RESEARCH & CONSULTING i

SECTION I. Introduction
SECTION I. Introduction
Purpose of the Study
In January 2003, the Family Housing Fund (FHF), the Greater Minnesota Housing Fund (GMHF) and the Minnesota Housing Finance Agency (MHFA) retained BBC Research & Consulting (BBC) to project housing needs in Minnesota in 2010.1 This project is known as The Next Decade of Housing in Minnesota.
Using the best available data, the goal of this effort was to quantify the need for affordable housing in each county in Minnesota from 2000 to 2010, taking into account housing market activity already completed between 2000 and 2002. Within the bounds of this goal, the research effort had the following objectives:
Understand housing demand by income and by type of household in 2010;
Understand the likely success or failure of the housing market (public, private and philanthropic) to meet that demand; and
Quantify the unmet need for affordable housing in 2010.
The information provided in this report will be helpful for a variety of stakeholders and policy makers, including community leaders, state legislators, state agencies, and housing providers.
It is important to note that this study is the first of its kind in Minnesota and follows a specific research path. The study is intended to serve as a benchmark for further discussion, analysis and research. The research team hopes that subsequent research efforts will build from this effort to further clarify the need for low-income housing throughout Minnesota.
Reporting of Results
The Next Decade of Housing in Minnesota conveys findings in a Main Report (this document) and seven regional reports. The Main Report provides a discussion of findings at the State, Greater Minnesota and Twin Cities Metropolitan Area2 levels. The seven regional reports provide in-depth discussions about the nature and magnitude of low-income housing need specific to each region. The regional reports follow the county groupings outlined in the Economic Vitality and Housing Initiative (EVHI), a program adopted by the Minnesota Legislature in 1995 that links affordable housing to economic development and redevelopment throughout the state. The county groupings used in the EVHI program are listed in Section II, page II-6.
1 In addition to the study funders, the Metropolitan Council was a key partner on this project.
2 The seven-county region containing Anoka, Carver, Dakota, Hennepin, Ramsey, Scott and Washington counties.
BBC RESEARCH & CONSULTING SECTION I, PAGE 1
How to Read This Document
This document consists of four distinct parts.
Section I presents an overall guide about the Next Decade of Housing in Minnesota project and acknowledgements for the many individuals who supported this effort.
Section II contains an in-depth discussion of the methodology used to develop the housing model, including the assumptions and data used to produce the estimates in this Main Report and each of the seven regional reports.
Section III presents a summary of findings. It offers data on the size and nature of the estimated need for affordable housing statewide, in the Twin Cities Metropolitan Area and in Greater Minnesota.
Section IV (the heart of the report) is comprised of a collection of exhibits presenting housing needs for the state, the Twin Cities Metropolitan Area and Greater Minnesota. Each exhibit tells a slightly different story about the likely need for affordable housing in a particular place in 2010. While each of the exhibits has footnotes that provide a general understanding of the methodology, a review of the technical explanations in Section II is recommended for a comprehensive understanding.
Overview of Model
The housing model developed in this analysis uses current and projected demographic and housing data to evaluate the need for affordable housing throughout the state. Estimates were based on demographic and housing market information gathered using the best available data. These data sources included the 2000 Census, databases of subsidized units from affordable housing funders and demographic projections from three sources: commercial data providers (PCensus and Claritas), Minnesota Planning and the Metropolitan Council.
To increase the quality of the findings, every effort was made to minimize assumptions. As a result, projections about housing market factors such as the share of affordable units provided by the private market are based on recent experience and reliable data sources. Testing of the assumptions used in the model indicates consistency with past housing market trends.
The following paragraphs describe the model in general terms. A detailed description of the data, assumptions and calculations in each exhibit is provided in Section II of this report.
The model first identifies households by income and type (family/non-family structure) in 2000 and 2010. These results can be found in Exhibit 1. This exhibit also shows the changes between the two periods, which is critical to identifying the unmet need in 2010.
The model next identifies, in Exhibit 2, the structure of the low-income housing market in 2000. This part of the model identifies the number of existing low-income households and how they are housed (in subsidized units or private-market units). This part of the model ultimately reveals the
BBC RESEARCH & CONSULTING SECTION I, PAGE 2
number of cost-burdened households3 that existed in 2000, a large component of housing need (however, a category of need that may be satisfied through housing assistance programs rather than new construction).
The heart of the housing model for the Next Decade of Housing in Minnesota project is presented in Exhibit 3. This part of the model serves to reveal unmet need for new low-income housing (specifically, the need for new unit construction) in 2010 by following this approach:
New Low-Income Households 2000-2010
minus Expected Provision of Low-Income Units by the Private Market by 2010
minus Expected Provision of Low-Income Units by the Public and Philanthropic Sectors by 2010
equals Unmet Need for New Low-Income Units in 2010
The model does not address the provision of housing by public and philanthropic entities in counties and regions in 2010 because there are no reliable projections at these smaller levels of geography. Instead, the model reports public and philanthropic provision at the larger state, Twin Cities Metropolitan Area and Greater Minnesota levels. This is explained in greater detail in Section II, the discussion of methodology.
Exhibit 4 shows an analysis of the unmet need in 2010 for new construction and housing assistance, at the State, Greater Minnesota and the Twin Cities levels. This data is important because it will help inform housing stakeholders about the needs for a variety of housing assistance programs (possible including new construction) at the broader area levels of the state.
Policy Prescriptions
It should be noted that the reader looking for policy prescriptions to address the need will not find them in this report. This report intentionally provides only an assessment of housing needs throughout the state during the remainder of the decade. It is expected that policymakers, housing providers and government officials will examine the report and consider its findings within the context of policymaking decisions. Solutions to the affordable housing needs demonstrated in this model could include housing production, housing rehabilitation, individual income support, tenant-based rental assistance, economic development to generate jobs with increased wages and others.
The most prominent example of this focus on an assessment of housing needs is in the decision not to estimate housing need by tenure (owner versus renter) for 2010. Development of such an estimate would have required the research team to understand the policy stance of local, regional and state-level policymakers toward housing production and predict their decisions regarding acceptable levels of subsidy for owner and rental housing in the future. While the model does show different classes of households in need of affordable housing (i.e. seniors, families with children and all others), the type
3 Cost-burdened households are those who spend 30% or more of their household income on selected monthly owner or
renter costs. HUD defines household spending of more than 30% of income on housing as unaffordable.
BBC RESEARCH & CONSULTING SECTION I, PAGE 3
of unit that should be produced to house these households must be left to policymakers, who will consider local area demographic trends, the presence of specific housing alternatives and the availability of housing production funds.
The research team did not want to suggest the owner/renter breakdown for new housing in any area of Minnesota, believing instead that a wide range of decision-makers at various levels should decide how to best allocate housing subsidies among income levels, household types and tenure situations.
Acknowledgements
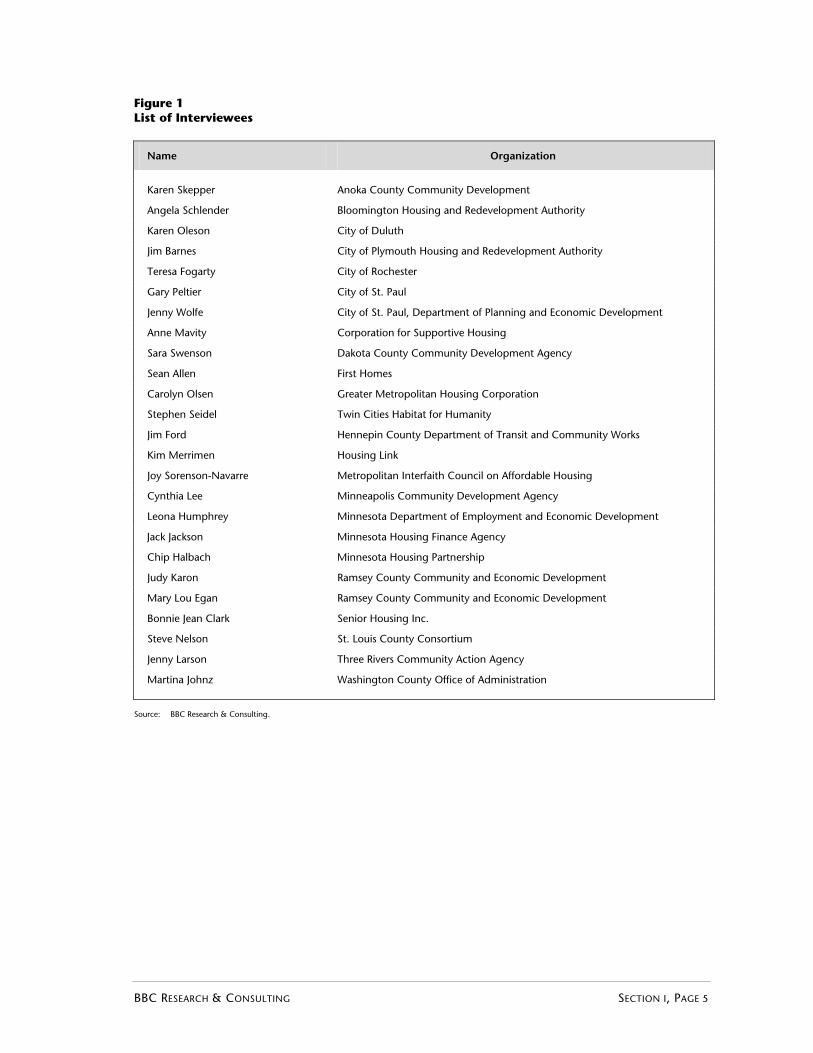
This report is the product of a collaborative effort among a number of key affordable housing professionals. Special thanks are due to Monte Aaker of the MHFA, Bill Byers of the Metropolitan Council, Warren Hanson and Stephanie Omersa Vergin of the Greater Minnesota Housing Fund, Tom O’Neil of Dahlgren, Shardlow and Uban and Angie Skildum of the Family Housing Fund. Each of these individuals carefully reviewed numerous iterations of the housing model found in Section IV and provided countless helpful revisions that have made this a better product. Additional thanks go to the many individuals interviewed for the project, a list of whom is provided on the following page in Figure 1.
BBC RESEARCH & CONSULTING SECTION I, PAGE 4
BBC RESEARCH & CONSULTING SECTION I, PAGE 5
Figure 1 List of Interviewees
Name Organization
Karen Skepper Anoka County Community Development
Angela Schlender Bloomington Housing and Redevelopment Authority
Karen Oleson City of Duluth
Jim Barnes City of Plymouth Housing and Redevelopment Authority
Teresa Fogarty City of Rochester
Gary Peltier City of St. Paul
Jenny Wolfe City of St. Paul, Department of Planning and Economic Development
Anne Mavity Corporation for Supportive Housing
Sara Swenson Dakota County Community Development Agency
Sean Allen First Homes
Carolyn Olsen Greater Metropolitan Housing Corporation
Stephen Seidel Twin Cities Habitat for Humanity
Jim Ford Hennepin County Department of Transit and Community Works
Kim Merrimen Housing Link
Joy Sorenson-Navarre Metropolitan Interfaith Council on Affordable Housing
Cynthia Lee Minneapolis Community Development Agency
Leona Humphrey Minnesota Department of Employment and Economic Development
Jack Jackson Minnesota Housing Finance Agency
Chip Halbach Minnesota Housing Partnership
Judy Karon Ramsey County Community and Economic Development
Mary Lou Egan Ramsey County Community and Economic Development
Bonnie Jean Clark Senior Housing Inc.
Steve Nelson St. Louis County Consortium
Jenny Larson Three Rivers Community Action Agency
Martina Johnz Washington County Office of Administration
Source: BBC Research & Consulting.

SECTION II. Methodology
SECTION II. Methodology
The exhibits included in Section III of this document present detailed data on housing needs in Minnesota through 2010. Each of these exhibits includes a series of footnotes allowing readers to identify the sources and primary assumptions used in their development. However, a more detailed understanding of the methodology used to develop the housing model is helpful in accurately interpreting the data. This section provides an in-depth description of the assumptions, data and calculations used in these exhibits.
Key Assumptions
The housing model presented in this report rests on the following key assumptions. These assumptions were used to inform the development of the model and should be considered in interpreting findings.
Comparative statics.
One of the underlying principles of this model is an assumption of “comparative statics.” In other words, the model assumes that over the next decade, public, private and non-profit housing providers will continue to respond to demand in much the same way as they do now. The private market will provide housing to similar households as those it currently serves. The public and philanthropic sectors will have similar priorities for responding to housing needs and will continue to spend their resources in approximately the manner in which they are currently spent.
One strong reason to use the comparative statics approach is to minimize the number of assumptions in the housing model. Every assumption increases the complexity of interactions within a model, and consequently increases the potential errors produced. It is preferable to use the fewest assumptions possible, while not hesitating to make sound assumptions where they are required.
In addition to minimizing the number of assumptions, additional reasons to use the comparative statics approach are the historical consistency of private market provision of housing and the uncertainty inherent in forecasting changes in the provision of subsidized housing.
Expected private market provision of housing.
The relative share of low-income housing provided by the private market has stayed relatively constant over the past decade. This can be verified by considering the percent of total households in each county that were cost burdened in 1990 and 2000, as well as the relationships between median household incomes and median housing prices. These two measures are strong indicators of the degree to which the private housing market is providing affordable housing.
BBC RESEARCH & CONSULTING SECTION II, PAGE 1
The fact that the proportion of cost-burdened households has remained stable regardless of population increases or decreases in every Minnesota county indicates that the private market is providing affordable housing to a consistent share of the population. Stable shares of the population are (and are not) adequately served by the housing market over the decade.
The ratio between median household income and median housing prices is another strong indicator of the degree to which private market is providing affordable housing. It portrays the degree to which housing prices have shifted in relationship to incomes, and potentially may have served only particular segments of the population. The fact that this ratio has been consistent over the decade indicates that the private housing market is serving low-income households to the same degree as it did in 1990. This ratio changed by less than 2 percent in every county over the decade, with most counties experiencing changes of far less than 1 percent. These patterns indicate consistent private market activity across a variety of economic environments.
Given the consistency of private market provision of affordable housing, the model assumes that a stable percentage of low-income households will be affordably housed by the private market. To arrive at this percentage, the total number of low-income households in each county is first reduced by:
1. The number of cost-burdened households who, by definition, are not affordably housed; and
2. The number of households in subsidized units who are not served by the private market.
The remainder are households served by the private market. The percent of all households in the county represented by this remainder is used in both 2000 and 2010 to estimate private market provision of affordable housing.
Expected public and philanthropic provision of low-income housing.
While the private market is assumed to serve the same proportion of low-income households over the decade, public and philanthropic funders were assumed to have a fixed capacity to fund subsidized units (referred to as the “pipeline” in this document). The ability of organizations to deliver subsidized units depends on the resources available to them; this depends on public policy and private charitable decisions.
The pipeline of expected public and philanthropic units was determined by reviewing databases of funded units from 2000-2002 (a three-year period) provided by the Department of Housing and Urban Development (HUD), the Greater Minnesota Housing Fund (GMHF), Habitat for Humanity and the Minnesota Housing Finance Agency (MHFA). These databases were reviewed extensively to eliminate the double counting of units funded by multiple organizations. This process determined how many units could be expected to be funded going forward through available resources.
BBC RESEARCH & CONSULTING SECTION II, PAGE 2
To supplement this work, key person interviews were conducted with representatives of other jurisdictions that receive direct federal funding and with major subsidized housing providers. Adjustments were made to reflect projections of future funding (2003 and after).
Due to the difficulty of allocating units to particular counties, the pipeline for subsidized housing was only calculated at the Statewide, Twin Cities Metropolitan Area and Greater Minnesota levels. Since funding allocation decisions at the county level are unpredictable, the most conservative approach was to quantify the recent pipeline at the three large-area levels, but not move to the county or regional level.
The model assumed that future funding for low-income units by household type (families with children, seniors and all other households) at the State, Greater Minnesota and Twin Cities Metro Area levels would follow unmet need. To the extent that public policy or private donation decisions change markedly in the coming years, the pipeline will grow or shrink and the households in need of affordable housing forecast in this model will increase or decrease.
Replacement of lost affordable housing.
The methodology contained in this report does not explicitly measure the amount of housing needed to replace obsolete units, those that may be demolished or those that may be lost due to gentrification during the period under study. Measuring housing need along these lines is fraught with pitfalls for the following reasons:
There are no reliable local area estimates of obsolete housing (and whether it is occupied or not);
The U.S. Census does not make definitive statements on unit obsolescence but instead only measures certain physical conditions that could be associated with obsolescence;
At the time the study was conducted, available Census data did not allow for the identification of the overlap between affordable units and those in poor condition, leading to the danger of double counting if poor condition units were identified;
There is no clear way to determine if a demolished unit was affordable or not;
Making assumptions about units lost to gentrification involves anticipating which areas may be of interest to developers and homebuyers in the future, which is difficult to predict.
Definition of Low-Income Households
To define low-income households across the state, the housing model takes into account the variance in incomes, housing prices and purchasing power between most of Greater Minnesota and the Twin Cities. BBC initially considered using one cutoff point, 60% or 80% of median family income, for all areas of the state since both 60% and 80% of median income are federal definitions of low-income commonly used in the administration of HUD programs. However, this approach did not realistically reflect the cost of new construction.
BBC RESEARCH & CONSULTING SECTION II, PAGE 3
The median family income throughout most of Greater Minnesota is significantly lower than that in the Twin Cities. Simply defining a low-income household at the same cutoff percentage (e.g. 60% of income) throughout the state would misrepresent the number of households that indeed have difficulty finding affordable housing. For example, if the model had set the low-income cutoff at 60% of median income, it would have left out many households in the lowest-income counties of Greater Minnesota who technically earn above the cutoff, but still earn well below what is needed to afford newly constructed unsubsidized housing. If the model had set the low-income cutoff at 80% of median income, it would have included many Twin Cities area households who are technically defined as “low-income” (below the 80% cutoff), but for whom ample, affordable market-rate options exist.
The final version of the model uses a “blended” rate to define low-income households across Minnesota: those falling below 60% of HUD median family income in the Twin Cities and those below 80% of median family-income throughout Greater Minnesota.1
Data Used
The exhibits presented in this report depend on five primary data sources:
U.S. Census data for 2000 were used for all of the 2000 exhibits, and 1990 and 2000 U.S. Census data were used in confirming the response of the private market in providing low-income housing;
Databases provided by the Department of Housing and Urban Development (HUD), GMHF, Habitat for Humanity and MHFA were used to quantify the number of subsidized units in each county in 2000;
Key person interviews with representatives of every city and county that receives direct HUD funding, interviews with major non-profit housing providers, and databases provided by GMHF and MHFA were used to quantify the “pipeline” of subsidized units through 2010;
Metropolitan Council forecasts of households in 2010 were used to determine household growth during the decade in the Twin Cities Metropolitan Area; and
Claritas, PCensus, MN Planning were used to project household growth and incomes in Greater Minnesota, and to project household incomes in the Twin Cities Metropolitan Area.
The demographic forecasting databases used to project households and incomes in 2010 account for a number of economic and demographic variables in their projections, including in- and out-migration, aging of demographic cohorts, employment, income trends and other factors.
1 For the Twin Cities counties, the model uses the HUD median family income figure for the 7-county Metro Area as a
whole. In the Greater Minnesota counties, the model uses the HUD median family income for each county.
BBC RESEARCH & CONSULTING SECTION II, PAGE 4
Limitations
As with any modeling exercise, the estimates presented in this report are subject to certain limitations. All models are abstractions of reality limited by the available data, and no model can precisely mirror the actual functioning of a housing market. These limitations have a number of effects on the estimates provided in this report.
First, data is only provided at the county level, potentially hiding trends at the sub-county level. For example, some rural counties will show no need for new housing in 2010 due to declining population. However, specific cities within these counties may have a need for new housing for one or more household types because of population gains (e.g. in-migration of migrant workers) or changing resident demographics (e.g. aging in place). In these cases, different measures of housing need between the county and local level are reasonable, and neither estimate is necessarily wrong. This situation simply acknowledges the fact that housing markets are often very localized. The research team expects that the figures in this report will be used to support discussions of housing provision at the broader level (e.g. county and region), but that decisions regarding need within a municipality will be based on local area market research.
Second, it is impossible to accurately predict the geographic distribution of public and philanthropic resources at small levels of geography. Therefore, new subsidized development projections are reported only at the Twin Cities Metropolitan Area, Greater Minnesota and Statewide levels.
Third, a number of factors may also serve to understate the need for affordable housing. Households that are not cost-burdened but are living in housing that is in poor condition or overcrowded are not measured in this study. At the time the study was completed, it was not possible to assess the overlap between poor condition, overcrowded and cost-burdened households using Census data. Given the limitations of the data, a conservative approach was taken and only cost-burdened households were considered in the model. In addition, housing units lost to gentrification or demolition are also not estimated in this analysis, due to the lack of reliable demolition data and the difficulty in predicting gentrification. These limitations combine to make the estimates presented in this report a conservative picture of affordable housing needs in Minnesota.
Finally, a note on how homelessness was considered in this study. The estimated housing needs of Minnesota’s homeless population are included in the “cost-burdened” category. However, homeless households are very difficult to count. The study estimated this need using the most recent data available from the Minnesota Department of Human Services Quarterly Shelter Survey. This is a very conservative estimate of homelessness, as it only includes those utilizing shelters on a given night. More complete information on the overall need for housing to serve the homeless will be available in the 2003 Wilder Research Center survey of homeless adults and children in Minnesota, expected to be released in early 2004.
Presentation of Data
The exhibits and summary reports throughout the Next Decade of Minnesota project present the need for affordable housing at a number of geographic levels, including county, EVHI Region (see below), Greater Minnesota, Twin Cities Metropolitan Area and statewide. The Twin Cities Metropolitan Area summary includes the counties of Anoka, Carver, Dakota, Hennepin, Ramsey,
BBC RESEARCH & CONSULTING SECTION II, PAGE 5
Scott and Washington, while the Greater Minnesota summary encompasses the other 80 Minnesota counties. The EVHI regional reports include counties as listed below.
Figure 2. Breakdown of Minnesota Counties by EVHI Region (For Regional Analyses)
Central Metro Northeast Northwest Southeast Southwest West Central
Benton Anoka Aitkin Beltrami Blue Earth Big Stone BeckerCass Carver Carlton Clearwater Brown Chippewa ClayChisago Dakota Cook Hubbard Dodge Cottonwood DouglasCrow Wing Hennepin Itasca Kittson Faribault Jackson GrantIsanti Ramsey Koochiching Lake of the Woods Fillmore Kandiyohi Otter TailKanabec Scott Lake Mahnomen Freeborn Lac Qui Parle PopeMille Lacs Washington St. Louis Marshall Goodhue Lincoln StevensMorrison Norman Houston Lyon TraversePine Pennington Le Sueur McLeod WilkinSherburne Polk Martin MeekerStearns Red Lake Mower MurrayTodd Roseau Nicollet NoblesWadena Olmsted PipestoneWright Rice Redwood
Sibley RenvilleSteele RockWabasha SwiftWaseca Yellow MedicineWatonwanWinona
Detailed Description of Exhibits
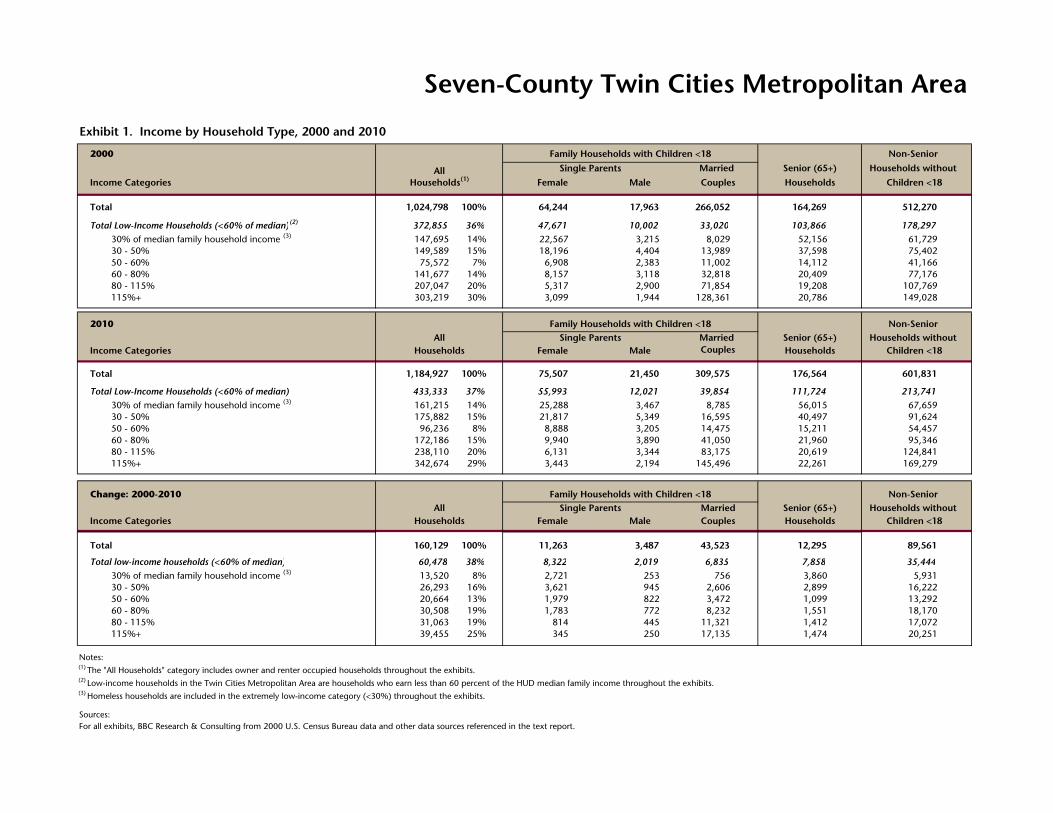
Exhibit 1. Households by income and household type, 2000 and 2010.
Exhibit 1 first presents the number of households in several income categories in 2000. The model uses 2000 HUD Median Family Income for the seven-county Twin Cities Metropolitan area for each of the Metro Area counties. For each of the remaining Greater Minnesota counties, the model uses the median family income that HUD defines for that specific county. Census data were supplemented by quarterly shelter survey data provided by the Minnesota Department of Human Services to incorporate homeless households that are not counted by the Census.
Households in each income category in Exhibit 1 were subdivided into three categories: family households, senior households and non-senior households without children under 18. This division was completed using a variety of cross-tabulations from the 2000 Census. These categories of housing types correspond with a variety of housing programs and potential housing solutions.
The second part of Exhibit 1 includes projections for 2010 following the same income breakdown as in 2000. In the 80 Greater Minnesota counties, the household projections reflect averages of data provided by MN Planning and two commercial data providers, Claritas and PCensus. In the seven-county Twin Cities Metro Area, total households were projected using Metropolitan Council forecasts, and were then distributed into income and household type categories using the averages from other resources.
BBC RESEARCH & CONSULTING SECTION II, PAGE 6
A two-step method was used to allocate the projected households into groups of household types. First, PCensus forecasts of households by age were used to identify senior and non-senior households. The second step used 2000 data to split remaining households into households with and without children under the age of 18.
Finally, Exhibit 1 concludes by subtracting the 2000 Census data from the 2010 projections to show the change over the decade.
Exhibit 2. The structure of the low-income housing market in 2000.
The second exhibit calculates the private market’s success at housing low-income households in 2000. As in Exhibit 1, data are provided for all households, family households, senior households and non-senior households without children under 18. Cost-burdened households and subsidized units are subtracted from total households to arrive at the share of affordable housing that is provided by the private market. Throughout the model, households “housed affordably by the private market” indicate non-cost-burdened, low-income households that are not living in subsidized housing. Although these are low-income households, they have successfully found housing they can afford in the private market.
Subsidized units for each household type (family, senior, other) were estimated using a variety of databases. In many cases, these databases identified the target population for each property. When such information was not available, non-senior units were allocated to family or non-family households by assuming that units with two or more bedrooms were for families and one-bedroom or studio units were for non-family households. Using these data and assumptions, relatively few units were identified as targeted to non-family households. However, it is possible that non-family households could be living in “family” units.
The cost-burdened household tallies are taken from the U.S. Census and supplemented with homeless households identified through quarterly state shelter counts. The calculations in Exhibit 2 produce estimates of the proportion of households served by the private market and the proportion of households not housed affordably by any provider.
Exhibit 3 Unmet low-income housing need.
Exhibit 3 projects the total number of new low-income households that will be in need of affordable housing in 2010, based on growth during the decade. The calculations start with new low-income households that are expected to be added during the decade in each area, by household type. Certain counties show declines in the overall number of low-income households (or among certain household types) mirroring expected declines in the larger population. In these cases, Exhibit 3 will show negative change numbers encased in parentheses (). Negative population growth does not necessarily indicate that housing investment is not needed. In such counties, rehabilitation and/or preservation may be key strategies, rather than new construction.
The exhibit then determines the number of low-income households that are not expected to be served by the private market by 2010. This is accomplished by subtracting the expected private market provision of low-income housing in 2010 from new low-income households that are expected during the decade.
BBC RESEARCH & CONSULTING SECTION II, PAGE 7
BBC RESEARCH & CONSULTING SECTION II, PAGE 8
If the number of low-income households is predicted to decrease across all household types, the model assumes no new private market provision for the low-income market. However, in some counties, the number of certain types of low-income households (e.g., senior households) is predicted to decrease, while the number of other types of low-income households (e.g., families with children < 18) is expected to increase. In these cases, the model does not address potential shifting of units between different household types.
For example, if the number of senior households decreases, the model does not assume that units vacated by those households would be suitable for families with children. While some units may be acceptable for all household types, quantifying the number of those units is beyond the scope of this study. As a result, some counties may show net household loss but still have a need for new units targeted to certain household types.
At the State, Greater Minnesota and Twin Cities Metropolitan Area levels, Exhibit 3 provides a deeper level of analysis, one that illuminates the true need for low-income housing during the decade due to increasing numbers of low-income households. At the bottom of the Exhibit, the model factors in the provision of low-income housing expected by the public and philanthropic sectors during the decade. After considering this production source, the new low-income households that remain in one of these three larger areas are truly unsupported; they find a home neither in the private market, nor in newly-built subsidized units. This is termed unmet need for new low-income units.
Exhibit 4. Analysis of unmet housing need, 2010.
This exhibit analyzes unmet need by income level and household type at the State, Greater Minnesota and Twin Cities Metropolitan Area levels. This exhibit works off of two sources: 1) the unmet need for new low-income housing units in 2010 that the model determined in Exhibit 3; and 2) the cost-burdened, low-income households in 2000 that the model described in Exhibit 2.
The former demand source could be characterized as demand for newly-constructed units that will emerge during the decade. The latter source of demand could be characterized as an entrenched, structural, housing-market problem that could be solved by a variety of programs, just one of which could be new construction. Households that were cost-burdened in 2000 (and still presumably are), were technically housed, but were in need of some sort of assistance to relieve a high-cost burden. This relief could come in a variety of unit- or household-based subsidy programs, among other solutions.
SECTION III. Summary of Findings

SECTION III. Summary of Findings
The purpose of the Next Decade of Housing in Minnesota study is to quantify the need for affordable housing in Minnesota from 2000 to 2010. The study was completed by BBC Research & Consulting (BBC), an independent firm based in Denver that specializes in housing market analysis. The study was funded by a collaborative of public and philanthropic organizations that provide resources for affordable housing development.1
Key Conclusions
During the past several years, the issue of affordable housing has become increasingly prominent in Minnesota. The study indicates that many households will continue to have difficulty finding affordable housing during the next decade.
Almost 300,000 low-income households are living in unaffordable housing in Minnesota.2 For the one-third of these households that earn less than 30% of median income, this housing cost burden often forces difficult choices between housing and other necessities.
There will be a shortfall of 33,000 affordable housing units for low-income households by 2010 in Minnesota. This shortfall will occur despite increased private market provision of housing and significant public and philanthropic contributions for affordable housing.
Study Findings
This section provides summary data on housing needs at the statewide, 80-county Greater Minnesota, and seven-county Twin Cities Metropolitan Area levels. Map 1 on the following page presents all counties in Minnesota, split into Greater Minnesota and the Twin Cities Metropolitan Area. Additional information on county-level housing needs is provided in Section IV of the report.
1 Funders of the study include the Minnesota Housing Finance Agency, Family Housing Fund and Greater Minnesota
Housing Fund. Additional support was provided by the Metropolitan Council. 2 The Department of Housing and Urban Development (HUD) defines housing as affordable if the household spends no
more than 30% of gross income to occupy it.
BBC RESEARCH & CONSULTING SECTION III, PAGE 1
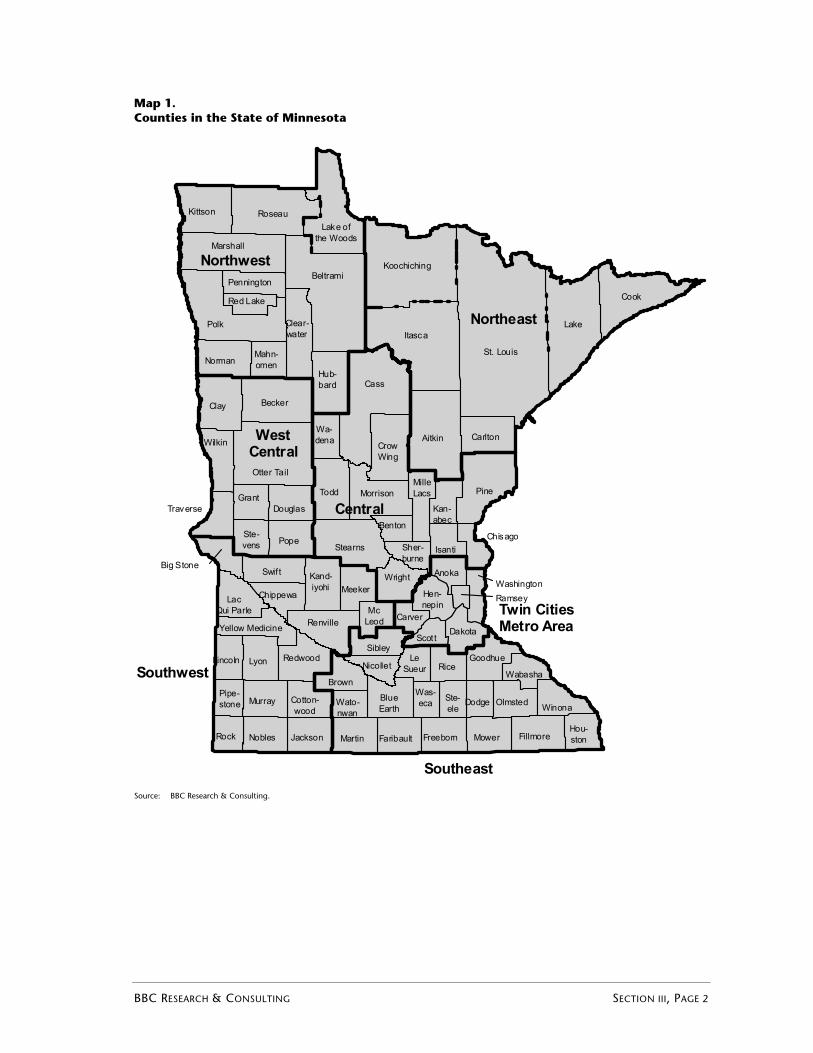
Map 1. Counties in the State of Minnesota
AnokaWashington
Hen-nepin
Ramsey
CarverDakota
Scott
Southeast
Southwest
WestCentral
Twin CitiesMetro Area
Northwest
Northeast
Central
Aitkin
Becker
Beltrami
Benton
Big Stone
BlueEarth
Brown
Carlton
Cass
Chippewa
Chisago
Clay
Clear-water
Cook
Cotton-wood
CrowWing
Dodge
Douglas
Faribault FillmoreFreeborn
Goodhue
Grant
Hou-ston
Hub-bard
Isanti
Itasca
Jackson
Kan-abec
Kand-iyohi
Kittson
Koochiching
LacQui Parle
Lake
Lake ofthe Woods
LeSueur
Lincoln Lyon
McLeod
Mahn-omen
Marshall
Martin
Meeker
MilleLacsMorrison
Mower
Murray
Nicollet
Nobles
Norman
Olmsted
Otter Tail
Pennington
Pine
Pipe-stone
Polk
Pope
Red Lake
Redwood
Renville
Rice
Rock
Roseau
St. Louis
Sher-burne
Sibley
Stearns
Ste-ele
Ste-vens
Swift
Todd
Traverse
Wabasha
Wa-dena
Was-ecaWato-
nwan
Wilkin
Winona
Wright
Yellow Medicine
Source: BBC Research & Consulting.
BBC RESEARCH & CONSULTING SECTION III, PAGE 2
Statewide Housing Needs.
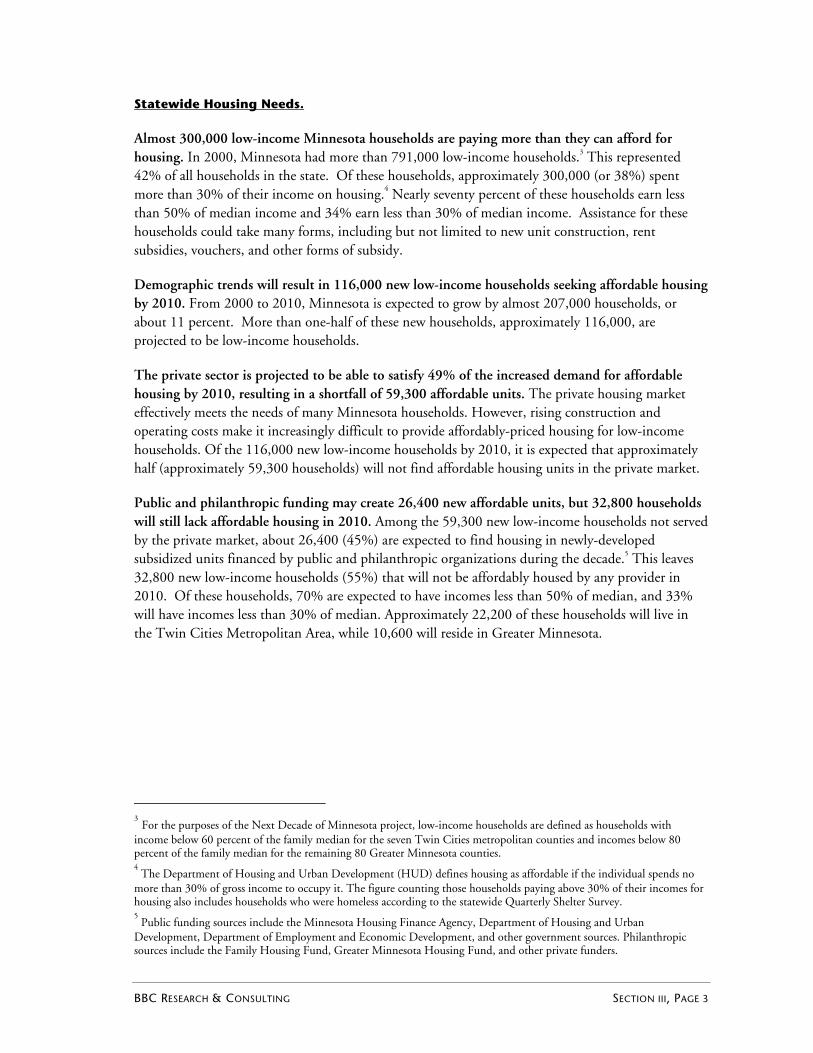
Almost 300,000 low-income Minnesota households are paying more than they can afford for housing. In 2000, Minnesota had more than 791,000 low-income households.3 This represented 42% of all households in the state. Of these households, approximately 300,000 (or 38%) spent more than 30% of their income on housing.4 Nearly seventy percent of these households earn less than 50% of median income and 34% earn less than 30% of median income. Assistance for these households could take many forms, including but not limited to new unit construction, rent subsidies, vouchers, and other forms of subsidy.
Demographic trends will result in 116,000 new low-income households seeking affordable housing by 2010. From 2000 to 2010, Minnesota is expected to grow by almost 207,000 households, or about 11 percent. More than one-half of these new households, approximately 116,000, are projected to be low-income households.
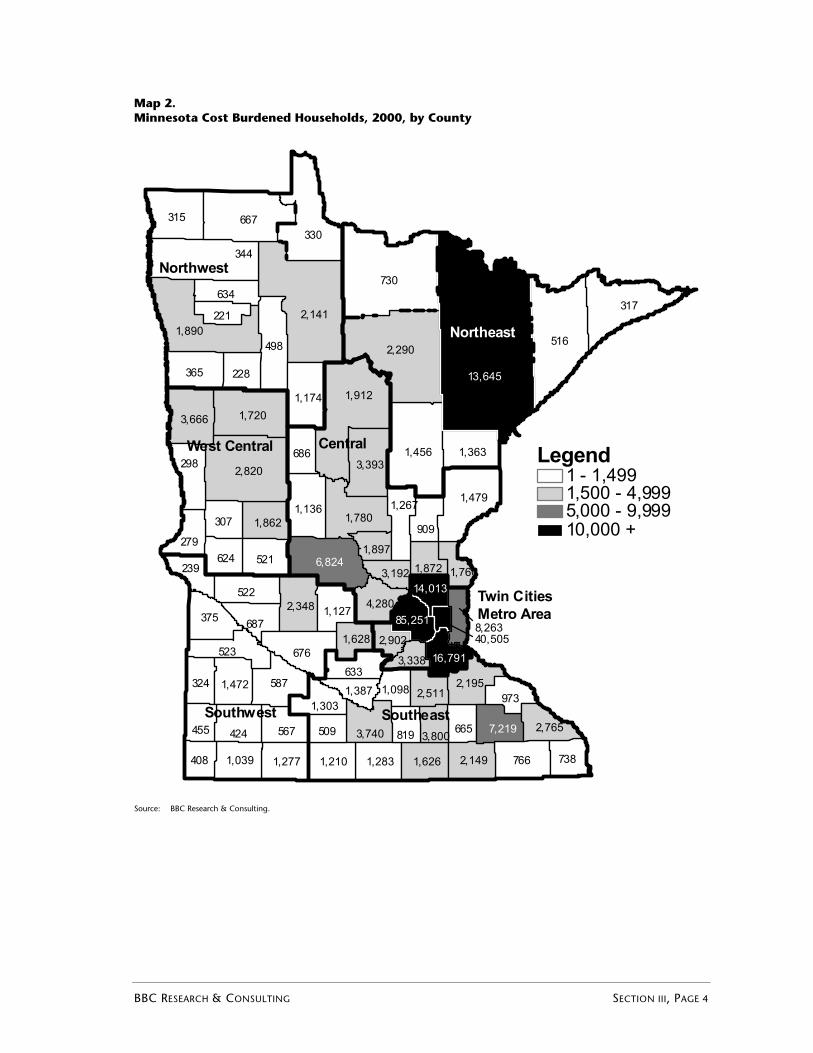
The private sector is projected to be able to satisfy 49% of the increased demand for affordable housing by 2010, resulting in a shortfall of 59,300 affordable units. The private housing market effectively meets the needs of many Minnesota households. However, rising construction and operating costs make it increasingly difficult to provide affordably-priced housing for low-income households. Of the 116,000 new low-income households by 2010, it is expected that approximately half (approximately 59,300 households) will not find affordable housing units in the private market.
Public and philanthropic funding may create 26,400 new affordable units, but 32,800 households will still lack affordable housing in 2010. Among the 59,300 new low-income households not served by the private market, about 26,400 (45%) are expected to find housing in newly-developed subsidized units financed by public and philanthropic organizations during the decade.5 This leaves 32,800 new low-income households (55%) that will not be affordably housed by any provider in 2010. Of these households, 70% are expected to have incomes less than 50% of median, and 33% will have incomes less than 30% of median. Approximately 22,200 of these households will live in the Twin Cities Metropolitan Area, while 10,600 will reside in Greater Minnesota.
3 For the purposes of the Next Decade of Minnesota project, low-income households are defined as households with income below 60 percent of the family median for the seven Twin Cities metropolitan counties and incomes below 80 percent of the family median for the remaining 80 Greater Minnesota counties. 4 The Department of Housing and Urban Development (HUD) defines housing as affordable if the individual spends no
more than 30% of gross income to occupy it. The figure counting those households paying above 30% of their incomes for housing also includes households who were homeless according to the statewide Quarterly Shelter Survey. 5 Public funding sources include the Minnesota Housing Finance Agency, Department of Housing and Urban
Development, Department of Employment and Economic Development, and other government sources. Philanthropic sources include the Family Housing Fund, Greater Minnesota Housing Fund, and other private funders.
BBC RESEARCH & CONSULTING SECTION III, PAGE 3
Map 2. Minnesota Cost Burdened Households, 2000, by County
730
2,141
5162,290
344
1,912
667
2,820
317
1,890
1,456
315
1,720
1,479
498
676
587
365
3,393
1,780
766
3,666
523
522
298
1,174
1,136
424
521
1,363
567
2,348
634
633
687
279
2,195
228
624
3,740
307
738
973324
1,210 1,626
686
1,039 1,283
1,472
1,277
1,862
4,280
2,149
909
239
1,267
1,127
408
2,765455
1,303
509 665819
221
2,511
1,628
1,0981,387
1,8723,192 1,760
3,800
8,263
1,897
2,902
3,338
40,505
375
330
Northwest
Northeast
West Central
Southwest
Central
Twin CitiesMetro Area
Southeast
13,645
85,251
16,791
14,013
6,824
7,219
Legend1 - 1,4991,500 - 4,9995,000 - 9,99910,000 +
Source: BBC Research & Consulting.
BBC RESEARCH & CONSULTING SECTION III, PAGE 4
Map 3. New Low-Income Households Not Served by the Private Market, 2010, by County
Northwest
Twin CitiesMetro Area
WestCentral
Southwest
Central
Southeast
12
11
545
294
735
495
8
617
126
170
1,327
0
551
98
60
92
0
1043
66
448
0 84211
389
2
35
281
218
497
0
267
415
0
70
59
14721 400
214
133
13
15
288
353501
317
21
173
83
0
935
582
94
610
7
29
81
6
51
17
490
31
107
1,326
1,508
128
1,828
310
62
51
222
0
168
209
12442
7
371
1739
79
3,026
441413,226 0
2,6688,6654,128
Northeast
LegendZero1-499500-1,4991,500 +
Source: BBC Research & Consulting.
BBC RESEARCH & CONSULTING SECTION III, PAGE 5
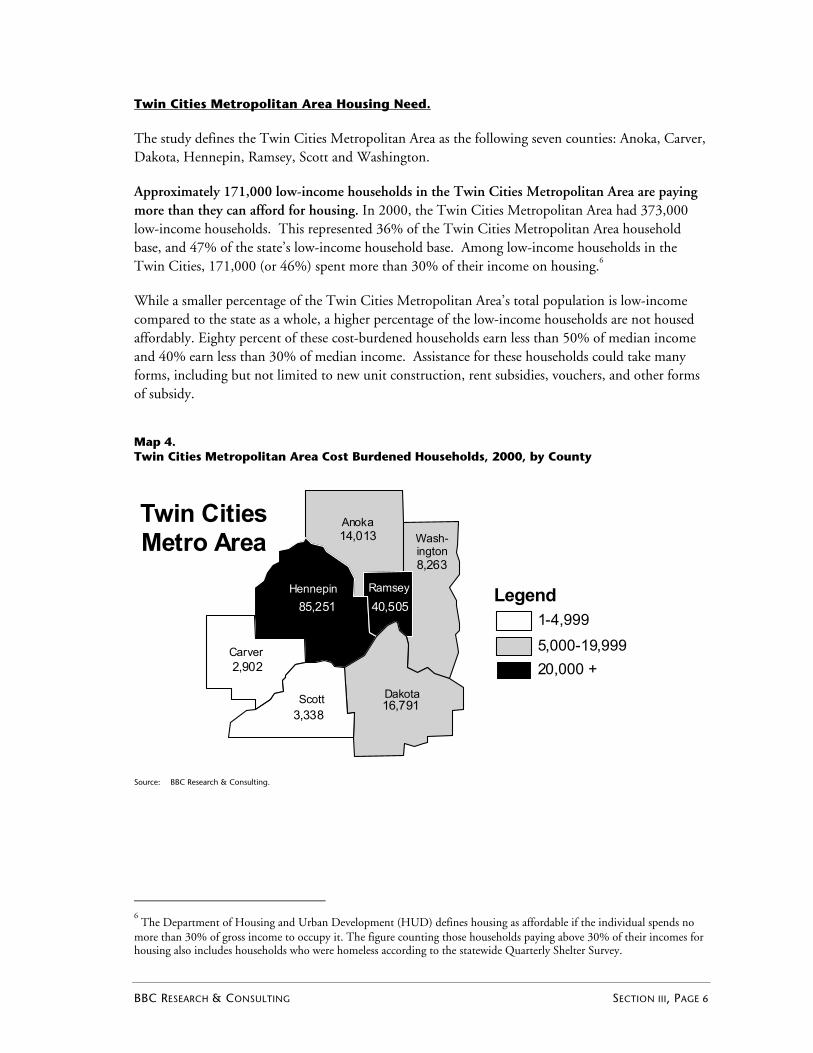
Twin Cities Metropolitan Area Housing Need.
The study defines the Twin Cities Metropolitan Area as the following seven counties: Anoka, Carver, Dakota, Hennepin, Ramsey, Scott and Washington.
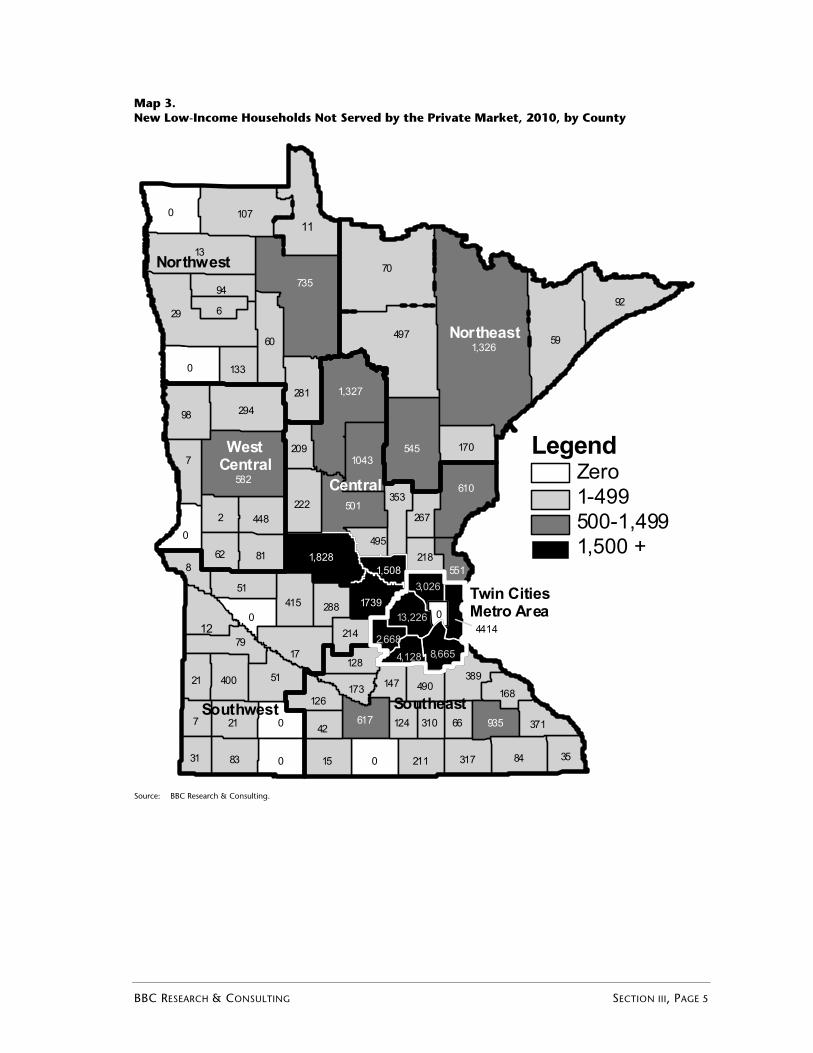
Approximately 171,000 low-income households in the Twin Cities Metropolitan Area are paying more than they can afford for housing. In 2000, the Twin Cities Metropolitan Area had 373,000 low-income households. This represented 36% of the Twin Cities Metropolitan Area household base, and 47% of the state’s low-income household base. Among low-income households in the Twin Cities, 171,000 (or 46%) spent more than 30% of their income on housing.6
While a smaller percentage of the Twin Cities Metropolitan Area’s total population is low-income compared to the state as a whole, a higher percentage of the low-income households are not housed affordably. Eighty percent of these cost-burdened households earn less than 50% of median income and 40% earn less than 30% of median income. Assistance for these households could take many forms, including but not limited to new unit construction, rent subsidies, vouchers, and other forms of subsidy.
Map 4. Twin Cities Metropolitan Area Cost Burdened Households, 2000, by County
14,013
8,263
85,251 40,505
2,902
16,7913,338
Twin CitiesMetro Area
AnokaWash-ington
Hennepin Ramsey
Carver
DakotaScott
Legend1-4,9995,000-19,99920,000 +
Source: BBC Research & Consulting.
6 The Department of Housing and Urban Development (HUD) defines housing as affordable if the individual spends no
more than 30% of gross income to occupy it. The figure counting those households paying above 30% of their incomes for housing also includes households who were homeless according to the statewide Quarterly Shelter Survey.
BBC RESEARCH & CONSULTING SECTION III, PAGE 6
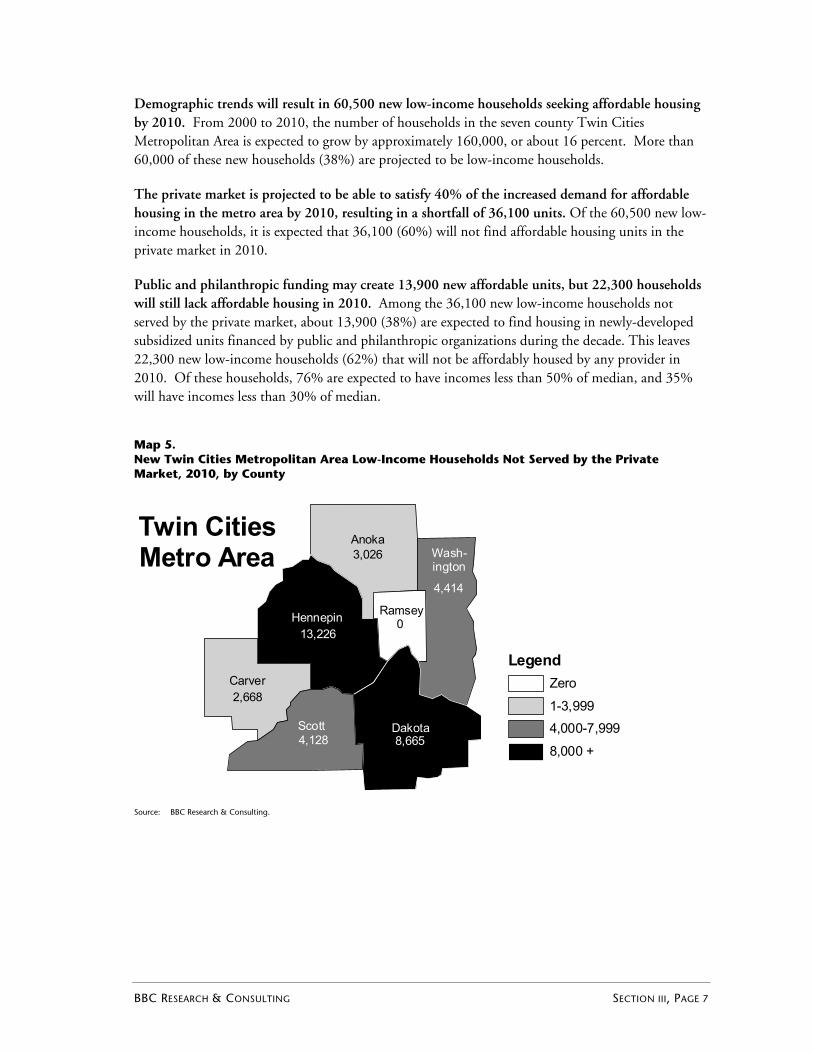
Demographic trends will result in 60,500 new low-income households seeking affordable housing by 2010. From 2000 to 2010, the number of households in the seven county Twin Cities Metropolitan Area is expected to grow by approximately 160,000, or about 16 percent. More than 60,000 of these new households (38%) are projected to be low-income households.
The private market is projected to be able to satisfy 40% of the increased demand for affordable housing in the metro area by 2010, resulting in a shortfall of 36,100 units. Of the 60,500 new low-income households, it is expected that 36,100 (60%) will not find affordable housing units in the private market in 2010.
Public and philanthropic funding may create 13,900 new affordable units, but 22,300 households will still lack affordable housing in 2010. Among the 36,100 new low-income households not served by the private market, about 13,900 (38%) are expected to find housing in newly-developed subsidized units financed by public and philanthropic organizations during the decade. This leaves 22,300 new low-income households (62%) that will not be affordably housed by any provider in 2010. Of these households, 76% are expected to have incomes less than 50% of median, and 35% will have incomes less than 30% of median.
Map 5. New Twin Cities Metropolitan Area Low-Income Households Not Served by the Private Market, 2010, by County
Twin CitiesMetro Area 3,026
4,414
13,2260
2,668
8,6654,128
AnokaWash-ington
Hennepin Ramsey
Carver
DakotaScott
LegendZero1-3,9994,000-7,9998,000 +
Source: BBC Research & Consulting.
BBC RESEARCH & CONSULTING SECTION III, PAGE 7
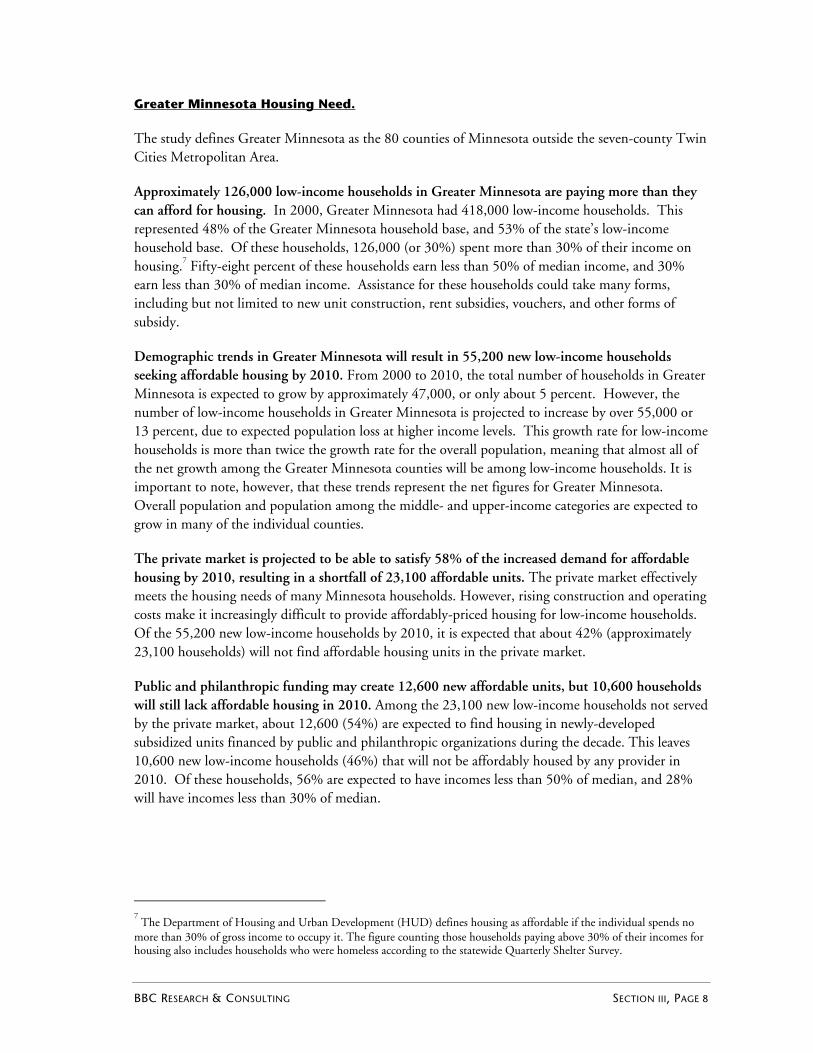
Greater Minnesota Housing Need.
The study defines Greater Minnesota as the 80 counties of Minnesota outside the seven-county Twin Cities Metropolitan Area.
Approximately 126,000 low-income households in Greater Minnesota are paying more than they can afford for housing. In 2000, Greater Minnesota had 418,000 low-income households. This represented 48% of the Greater Minnesota household base, and 53% of the state’s low-income household base. Of these households, 126,000 (or 30%) spent more than 30% of their income on housing.7 Fifty-eight percent of these households earn less than 50% of median income, and 30% earn less than 30% of median income. Assistance for these households could take many forms, including but not limited to new unit construction, rent subsidies, vouchers, and other forms of subsidy.
Demographic trends in Greater Minnesota will result in 55,200 new low-income households seeking affordable housing by 2010. From 2000 to 2010, the total number of households in Greater Minnesota is expected to grow by approximately 47,000, or only about 5 percent. However, the number of low-income households in Greater Minnesota is projected to increase by over 55,000 or 13 percent, due to expected population loss at higher income levels. This growth rate for low-income households is more than twice the growth rate for the overall population, meaning that almost all of the net growth among the Greater Minnesota counties will be among low-income households. It is important to note, however, that these trends represent the net figures for Greater Minnesota. Overall population and population among the middle- and upper-income categories are expected to grow in many of the individual counties.
The private market is projected to be able to satisfy 58% of the increased demand for affordable housing by 2010, resulting in a shortfall of 23,100 affordable units. The private market effectively meets the housing needs of many Minnesota households. However, rising construction and operating costs make it increasingly difficult to provide affordably-priced housing for low-income households. Of the 55,200 new low-income households by 2010, it is expected that about 42% (approximately 23,100 households) will not find affordable housing units in the private market.
Public and philanthropic funding may create 12,600 new affordable units, but 10,600 households will still lack affordable housing in 2010. Among the 23,100 new low-income households not served by the private market, about 12,600 (54%) are expected to find housing in newly-developed subsidized units financed by public and philanthropic organizations during the decade. This leaves 10,600 new low-income households (46%) that will not be affordably housed by any provider in 2010. Of these households, 56% are expected to have incomes less than 50% of median, and 28% will have incomes less than 30% of median.
7 The Department of Housing and Urban Development (HUD) defines housing as affordable if the individual spends no
more than 30% of gross income to occupy it. The figure counting those households paying above 30% of their incomes for housing also includes households who were homeless according to the statewide Quarterly Shelter Survey.
BBC RESEARCH & CONSULTING SECTION III, PAGE 8
Map 6. Greater Minnesota Cost Burdened Households, 2000, by County
Southeast
Southwest
Central
WestCentral
Northeast
Northwest
375
330
1,456
1,720
2,141
1,897
239
3,7401,303
1,363
1,912
687
1,760
3,666
498
317
567
3393
665
1862
1,283 7661,626
2,195
307
738
1,174
1,872
2,290
1,277
909
2,348
315
730
516
1,098324 1,472
1,628
228
344
1,210
1127
1,2671,780
2,149
424
1,387
1,039
365
7,219
2,820
634
1,479
455
1,890
521
221
587
676
2,511
408
667
13,645
3,192
633
6,824
3,800
624
522
1,136
279
973
686
819509
298
2,765
4,280
523
TwinCitiesMetroArea
(See Map 4)
5,000 +
750 - 1,4991 - 749
Legend
1,500 - 4,999
Source: BBC Research & Consulting.
BBC RESEARCH & CONSULTING SECTION III, PAGE 9
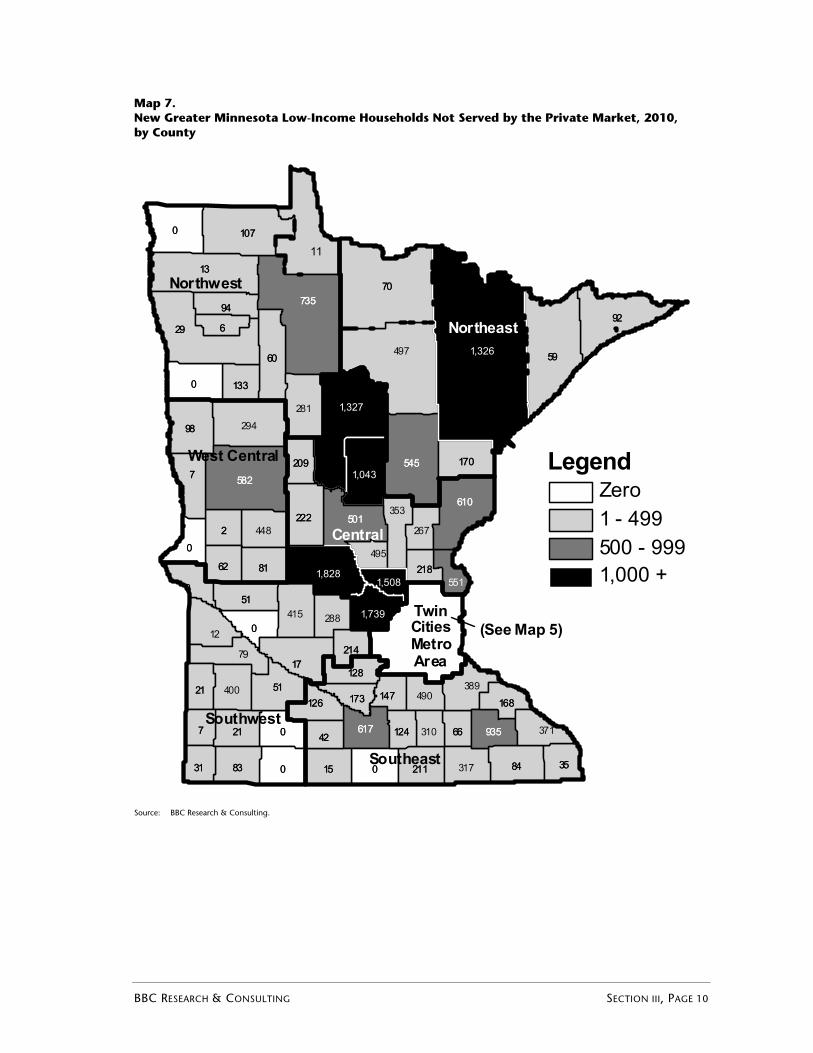
Map 7. New Greater Minnesota Low-Income Households Not Served by the Private Market, 2010, by County
11
Southeast
Central
Southwest
West Central
Northeast
Northwest
545
294
735
495
8
617
126
170
1,327
0
551
98
60
92
0
1,043
66
448
0 84211
389
2
35
281
218
497
0
267
415
0
70
59
14721 400
214
133
13
15
288
353501
317
21
173
83
0
935
582
94
610
7
29
81
6
51
17
490
31
107
1,326
1,508
128
1,828
310
62
51
222
0
168
209
12442
7
371
1,739
12
545
294
735
495
8
617
126
170
0
98
60
92
0 66
448
0 84211
389
2
35
281
218
497
0
267
415
0
70
59
14721 400
214
133
13
15
288
353501
317
21
173
83
0
935
582
94
610
7
29
81
6
51
17
490
31
107
128
310
62
51
222
0
168
209
12442
7
371
79
(See Map 5)TwinCitiesMetroArea
LegendZero1 - 499500 - 9991,000 +
Source: BBC Research & Consulting.
BBC RESEARCH & CONSULTING SECTION III, PAGE 10
BBC RESEARCH & CONSULTING SECTION III, PAGE 11
Study Limitations
The research team believes the study presents an accurate picture of housing needs in Minnesota. However, there are some important data limitations that affect the study results:
The estimated housing needs of Minnesota’s homeless population are included in the “cost burdened” category. However, homeless households are very difficult to count. The study estimated this need using the most recent data available from the statewide Quarterly Shelter Survey. This is a very conservative estimate of homelessness, as it only includes those utilizing shelters on a given night. More complete information on the overall need for housing to serve the homeless will be available in the 2003 Wilder Research Center survey of homeless adults and children in Minnesota, expected to be released in early 2004.
An analysis of housing units lost to demolition and attrition, as well as units that are in poor condition or overcrowded, is not included in the study. Good statewide data was not available, so the researchers excluded these factors in the calculation of housing need. As a result, the study presents a more conservative picture of housing need.
It is impossible to predict the level of public and philanthropic resources available to each county during the decade. As a result, the actual shortfall of affordable housing (after provision of subsidized units) can only be calculated at the statewide and Twin Cities Metropolitan Area and Greater Minnesota levels rather than for individual counties.
The study only provides data at the county level, which may mask trends at the sub-county (i.e., city) level. For example, some rural counties may show no housing need due to declining populations, but particular cities within a county may experience growth and need additional housing. In these cases, local area market research will be required to make decisions about the level of housing need and the provision of public and philanthropic resources.
Finally, the study does not attempt to predict policy changes or funding priorities during the coming decade. It does not offer funding recommendations, such as the type of subsidized housing (e.g., owner versus rental) that should be provided to address the identified shortfall. It is the responsibility of a variety of decision makers at the local, regional, and state levels to evaluate the study results and determine the appropriate responses.

SECTION IV. Housing Need Exhibits
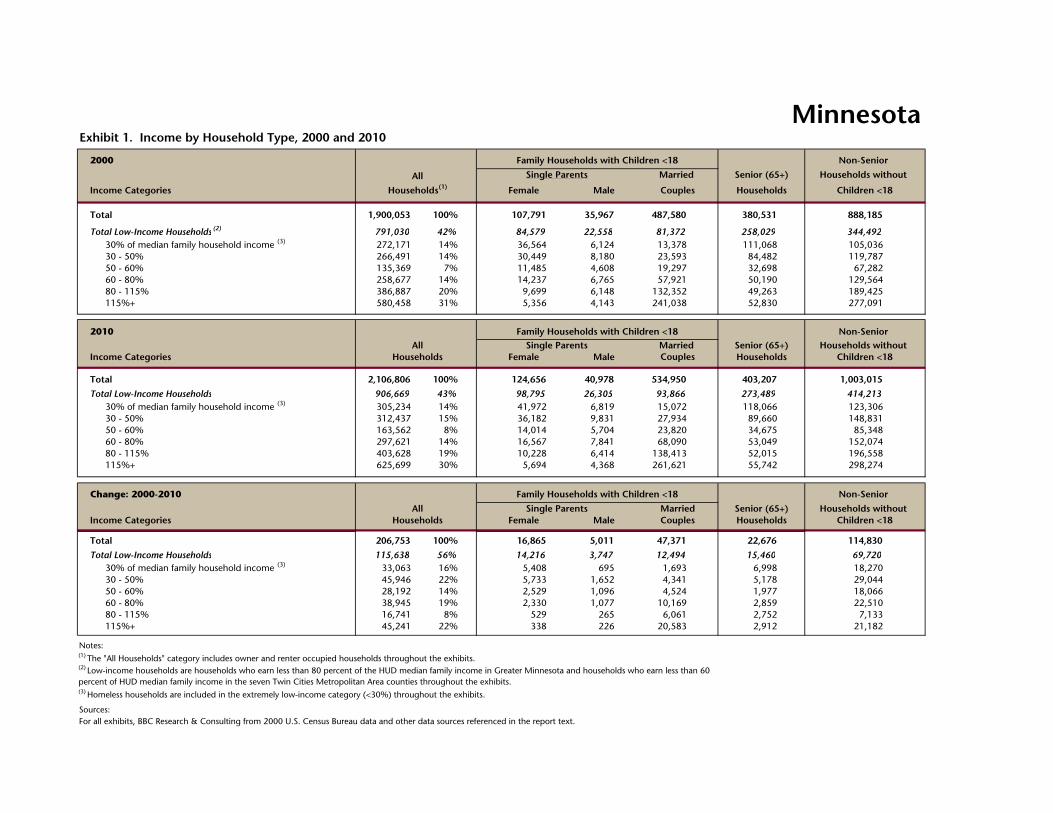
2000
Total 1,900,053 100% 107,791 35,967 487,580 380,531 888,185
Total Low-Income Households (2) 791,030 42% 84,579 22,558 81,372 258,029 344,49230% of median family household income (3) 272,171 14% 36,564 6,124 13,378 111,068 105,03630 - 50% 266,491 14% 30,449 8,180 23,593 84,482 119,78750 - 60% 135,369 7% 11,485 4,608 19,297 32,698 67,28260 - 80% 258,677 14% 14,237 6,765 57,921 50,190 129,56480 - 115% 386,887 20% 9,699 6,148 132,352 49,263 189,425115%+ 580,458 31% 5,356 4,143 241,038 52,830 277,091
2010
Total 2,106,806 100% 124,656 40,978 534,950 403,207 1,003,015
Total Low-Income Households 906,669 43% 98,795 26,305 93,866 273,489 414,21330% of median family household income (3) 305,234 14% 41,972 6,819 15,072 118,066 123,30630 - 50% 312,437 15% 36,182 9,831 27,934 89,660 148,83150 - 60% 163,562 8% 14,014 5,704 23,820 34,675 85,34860 - 80% 297,621 14% 16,567 7,841 68,090 53,049 152,07480 - 115% 403,628 19% 10,228 6,414 138,413 52,015 196,558115%+ 625,699 30% 5,694 4,368 261,621 55,742 298,274
Total 206,753 100% 16,865 5,011 47,371 22,676 114,830
Total Low-Income Households 115,638 56% 14,216 3,747 12,494 15,460 69,72030% of median family household income (3) 33,063 16% 5,408 695 1,693 6,998 18,27030 - 50% 45,946 22% 5,733 1,652 4,341 5,178 29,04450 - 60% 28,192 14% 2,529 1,096 4,524 1,977 18,06660 - 80% 38,945 19% 2,330 1,077 10,169 2,859 22,51080 - 115% 16,741 8% 529 265 6,061 2,752 7,133115%+ 45,241 22% 338 226 20,583 2,912 21,182
Notes:
Minnesota
Households withoutMarried
Family Households with Children <18
Exhibit 1. Income by Household Type, 2000 and 2010
All
Non-Senior
Senior (65+)
HouseholdsCouples
HouseholdsSenior (65+)
MaleHouseholds(1)
Single Parents
Households without
Female Children <18
Family Households with Children <18
Family Households with Children <18
CouplesFemale MaleHouseholds without
AllHouseholds
Income Categories
Income Categories HouseholdsAll
Children <18HouseholdsSenior (65+)
Change: 2000-2010
Single Parents MarriedCouplesMaleIncome Categories Female
(1) The "All Households" category includes owner and renter occupied households throughout the exhibits.
Non-Senior
Non-Senior
For all exhibits, BBC Research & Consulting from 2000 U.S. Census Bureau data and other data sources referenced in the report text.
(2) Low-income households are households who earn less than 80 percent of the HUD median family income in Greater Minnesota and households who earn less than 60 percent of HUD median family income in the seven Twin Cities Metropolitan Area counties throughout the exhibits.(3) Homeless households are included in the extremely low-income category (<30%) throughout the exhibits.
Sources:
Children <18Married Single Parents

2000
Total Low-Income Households 791,030 100% 188,509 100% 258,029 100% 344,492 100%
Housed Affordably:Existing Subsidized Units(2) 105,596 13% 74,798 40% 23,271 9% 7,527 2%
+ Private Market Units(3) 388,694 49% 45,308 24% 133,799 52% 209,587 61%= Total 494,290 62% 120,106 64% 157,070 61% 217,114 63%
494,290 120,106 157,070 217,114
Cost Burdened Households(4) 296,740 38% 68,403 36% 100,959 39% 127,378 37%
Notes:
(3)It is assumed households who are not cost burdened and who are not housed in subsidized units have affordable housing provided by the private market.(4) Cost burdened households are households who spend 30 percent or more of their household income on selected monthly owner or renter costs. A small percentage of the households in the cost-burdened category are homeless.
Exhibit 2. Structure of the Low-Income Housing Market, 2000
Minnesota
(2) Consists of all Low-Income Housing Tax Credit units, public housing, Section 8 project-based and tenant-based assistance, other HUD, RD units, and all owner-occupied subsidized units from MHFA and GMHF databases. A small percentage of subsidized units may house households earning above the low-income cutoff.
All Households(1)
Family Households with
Children <18Senior (65+) Households
Non-Senior Households
without Children <18
(1) Includes owner and renter occupied households.
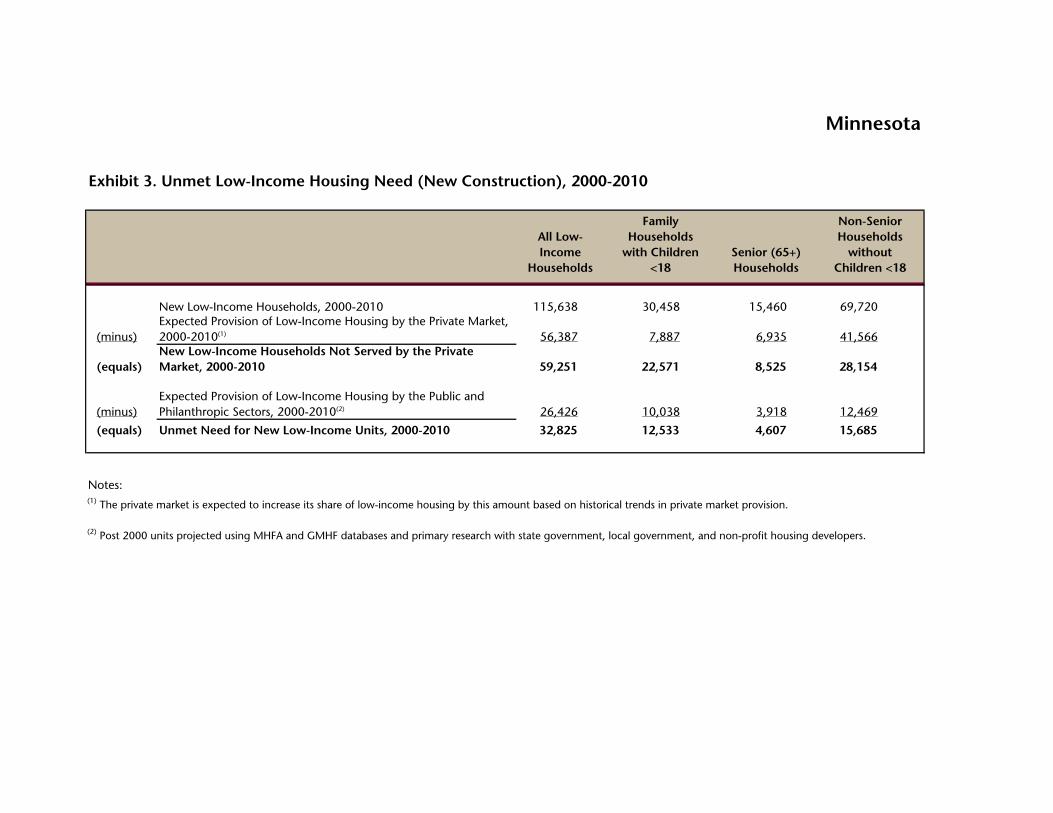
115,638 30,458 15,460 69,720New Low-Income Households, 2000-2010 115,638 30,458 15,460 69,720
(minus)Expected Provision of Low-Income Housing by the Private Market, 2000-2010(1) 56,387 ## 7,887 6,935 41,566
(equals)New Low-Income Households Not Served by the Private Market, 2000-2010 59,251 0 22,571 8,525 28,154
59,251 22,571 8,525 28,154
(minus)Expected Provision of Low-Income Housing by the Public and Philanthropic Sectors, 2000-2010(2) 26,426 10,038 3,918 12,469
(equals) Unmet Need for New Low-Income Units, 2000-2010 32,825 12,533 4,607 15,68532,825 12,533 4,607 15,685
59,163 8,675 7,629 42,859Notes: 57,755 7,321 8,017 42,417(1) The private market is expected to increase its share of low-income housing by this amount based on historical trends in private market provision.
(2) Post 2000 units projected using MHFA and GMHF databases and primary research with state government, local government, and non-profit housing developers.
Minnesota
Exhibit 3. Unmet Low-Income Housing Need (New Construction), 2000-2010
All Low-Income
Households
Family Households
with Children <18
Senior (65+) Households
Non-Senior Households
without Children <18
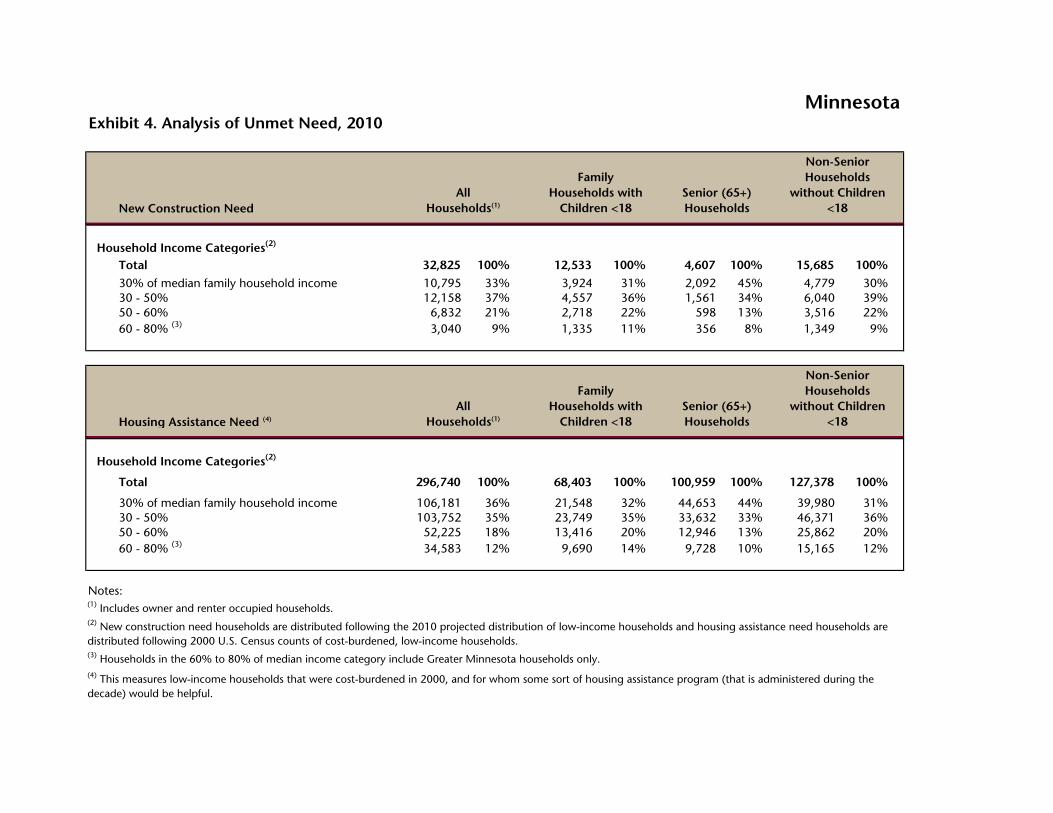
New Construction Need
Household Income Categories(2) 32,825 12,533 4,607 15,685Total 32,825 100% 12,533 100% 4,607 100% 15,685 100%
30% of median family household income 10,795 33% 34% 3,924 31% 2,092 45% 4,779 30%30 - 50% 12,158 37% 34% 4,557 36% 1,561 34% 6,040 39%50 - 60% 6,832 21% 18% 2,718 22% 598 13% 3,516 22%60 - 80% (3) 3,040 9% 33% 1,335 11% 356 8% 1,349 9%
Housing Assistance Need (4)
Household Income Categories(2)
Total 296,740 100% 68,403 100% 100,959 100% 127,378 100%
30% of median family household income 106,181 36% 21,548 32% 44,653 44% 39,980 31%30 - 50% 103,752 35% 23,749 35% 33,632 33% 46,371 36%50 - 60% 52,225 18% 13,416 20% 12,946 13% 25,862 20%60 - 80% (3) 34,583 12% 9,690 14% 9,728 10% 15,165 12%
Notes:
MinnesotaExhibit 4. Analysis of Unmet Need, 2010
All Households(1)
Family Households with
Children <18Senior (65+) Households
Non-Senior Households
without Children <18
(2) New construction need households are distributed following the 2010 projected distribution of low-income households and housing assistance need households are distributed following 2000 U.S. Census counts of cost-burdened, low-income households.
Senior (65+) Households
Non-Senior Households
without Children <18
(4) This measures low-income households that were cost-burdened in 2000, and for whom some sort of housing assistance program (that is administered during the decade) would be helpful.
(1) Includes owner and renter occupied households.
All Households(1)
Family Households with
Children <18
(3) Households in the 60% to 80% of median income category include Greater Minnesota households only.
2000
Total 1,024,798 100% 64,244 17,963 266,052 164,269 512,270
Total Low-Income Households (<60% of median)(2) 372,855 36% 47,671 10,002 33,020 103,866 178,29730% of median family household income (3) 147,695 14% 22,567 3,215 8,029 52,156 61,72930 - 50% 149,589 15% 18,196 4,404 13,989 37,598 75,40250 - 60% 75,572 7% 6,908 2,383 11,002 14,112 41,16660 - 80% 141,677 14% 8,157 3,118 32,818 20,409 77,17680 - 115% 207,047 20% 5,317 2,900 71,854 19,208 107,769115%+ 303,219 30% 3,099 1,944 128,361 20,786 149,028
2010
Total 1,184,927 100% 75,507 21,450 309,575 176,564 601,831
Total Low-Income Households (<60% of median) 433,333 37% 55,993 12,021 39,854 111,724 213,74130% of median family household income (3) 161,215 14% 25,288 3,467 8,785 56,015 67,65930 - 50% 175,882 15% 21,817 5,349 16,595 40,497 91,62450 - 60% 96,236 8% 8,888 3,205 14,475 15,211 54,45760 - 80% 172,186 15% 9,940 3,890 41,050 21,960 95,34680 - 115% 238,110 20% 6,131 3,344 83,175 20,619 124,841115%+ 342,674 29% 3,443 2,194 145,496 22,261 169,279
Total 160,129 100% 11,263 3,487 43,523 12,295 89,561
Total low-income households (<60% of median) 60,478 38% 8,322 2,019 6,835 7,858 35,44430% of median family household income (3) 13,520 8% 2,721 253 756 3,860 5,93130 - 50% 26,293 16% 3,621 945 2,606 2,899 16,22250 - 60% 20,664 13% 1,979 822 3,472 1,099 13,29260 - 80% 30,508 19% 1,783 772 8,232 1,551 18,17080 - 115% 31,063 19% 814 445 11,321 1,412 17,072115%+ 39,455 25% 345 250 17,135 1,474 20,251
Notes:
Income Categories FemaleHouseholds Children <18HouseholdsCouplesMale
Income Categories Female
Households withoutSingle Parents Married Senior (65+)Change: 2000-2010
Households
Non-Senior All
HouseholdsSenior (65+)All
Family Households with Children <18
Family Households with Children <18
Couples Children <18Married Single Parents
MaleHouseholds without
Non-Senior
Male
Exhibit 1. Income by Household Type, 2000 and 2010
HouseholdsAll
Households(1)
Non-Senior
Senior (65+)
Couples
Single Parents
Children <18
Seven-County Twin Cities Metropolitan Area
Households withoutMarried
Family Households with Children <18
FemaleIncome Categories
Sources:For all exhibits, BBC Research & Consulting from 2000 U.S. Census Bureau data and other data sources referenced in the text report.
(3) Homeless households are included in the extremely low-income category (<30%) throughout the exhibits.
(1) The "All Households" category includes owner and renter occupied households throughout the exhibits.(2) Low-income households in the Twin Cities Metropolitan Area are households who earn less than 60 percent of the HUD median family income throughout the exhibits.
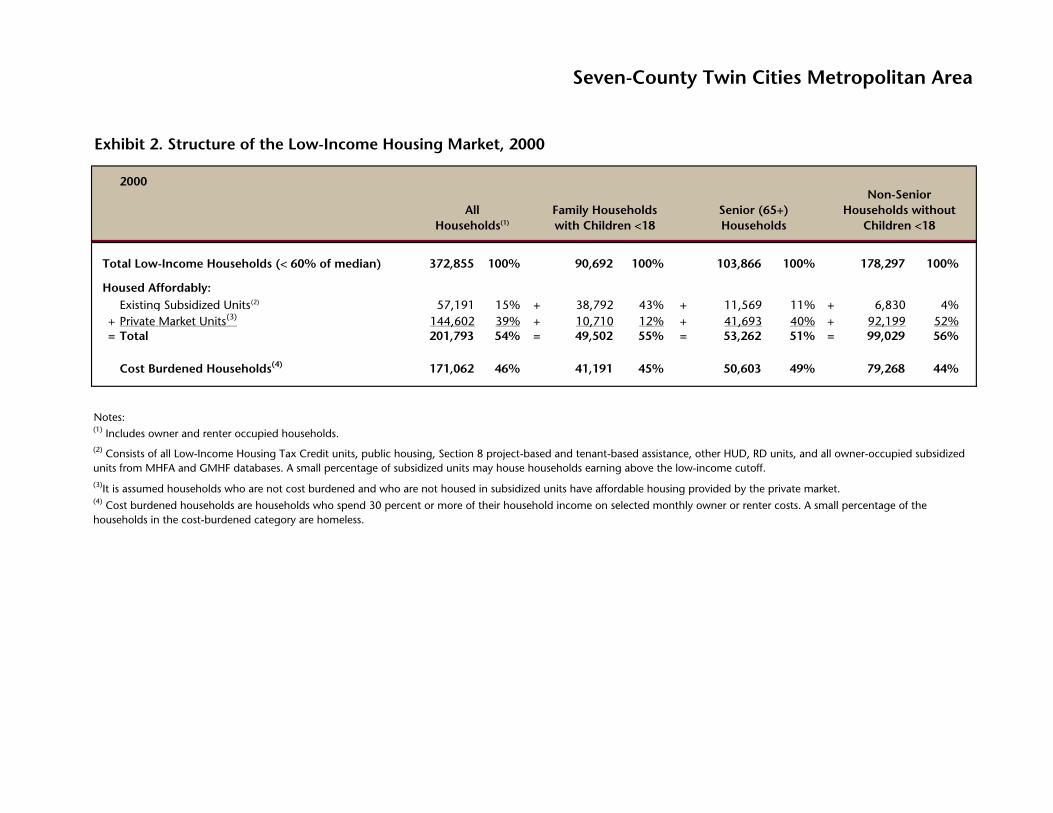
2000
Total Low-Income Households (< 60% of median) 372,855 100% 90,692 100% 103,866 100% 178,297 100%
Housed Affordably:Existing Subsidized Units(2) 57,191 15% + 38,792 43% + 11,569 11% + 6,830 4%
+ Private Market Units(3) 144,602 39% + 10,710 12% + 41,693 40% + 92,199 52%= Total 201,793 54% = 49,502 55% = 53,262 51% = 99,029 56%
201,793 49,502 53,262 99,029
Cost Burdened Households(4) 171,062 46% 41,191 45% 50,603 49% 79,268 44%
Notes:
Exhibit 2. Structure of the Low-Income Housing Market, 2000
Seven-County Twin Cities Metropolitan Area
(2) Consists of all Low-Income Housing Tax Credit units, public housing, Section 8 project-based and tenant-based assistance, other HUD, RD units, and all owner-occupied subsidized units from MHFA and GMHF databases. A small percentage of subsidized units may house households earning above the low-income cutoff.
All Households(1)
Family Households with Children <18
Senior (65+) Households
Non-Senior Households without
Children <18
(1) Includes owner and renter occupied households.
(3)It is assumed households who are not cost burdened and who are not housed in subsidized units have affordable housing provided by the private market.(4) Cost burdened households are households who spend 30 percent or more of their household income on selected monthly owner or renter costs. A small percentage of the households in the cost-burdened category are homeless.

60,478 17,176 7,858 35,444New Low-Income Households, 2000-2010 60,478 17,176 7,858 35,444 60,478
(minus)Expected Provision of Low-Income Housing by the Private Market, 2000-2010(1) 24,350 3,233 3,387 17,730 24,350
(equals)New Low-Income Households Not Served by the Private Market, 2000-2010 36,127 13,943 4,470 17,714 36,127
36,127 13,943 4,470 17,714
(minus)Expected Provision of Low-Income Housing by the Public and Philanthropic Sectors, 2000-2010(2) 13,865 5,351 1,716 6,798 13,865
(equals) Unmet Need for New Low-Income Units, 2000-2010 22,263 8,592 2,755 10,916 22,263
25,928 3,751 3,434 18,742Notes: 24,350 2,028 3,154 18,329(1) The private market is expected to increase its share of low-income housing by this amount based on historical trends in private market provision.(2) Post 2000 units projected using MHFA and GMHF databases and primary research with state government, local government, and non-profit housing developers.
Seven-County Twin Cities Metropolitan Area
Exhibit 3. Unmet Low-Income Housing Need (New Construction), 2000-2010
All Low-Income
Households
Family Households
with Children <18
Senior (65+)
Households
Non-Senior Households
without Children <18
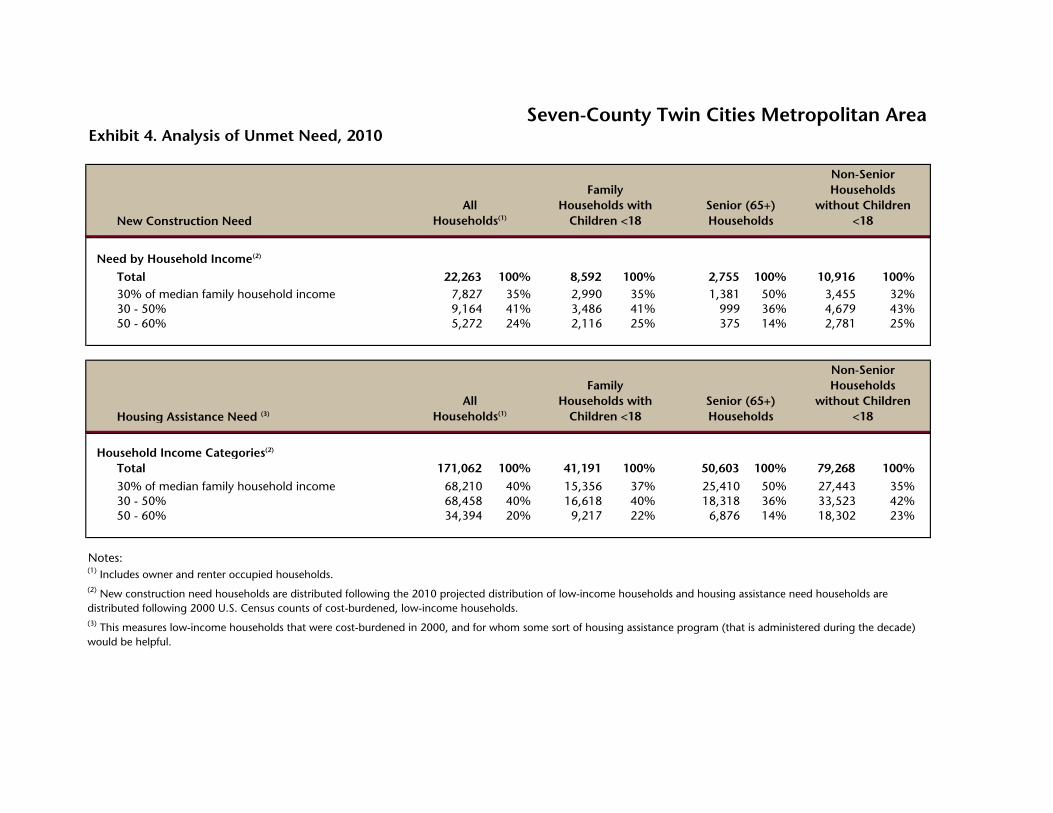
New Construction Need
Need by Household Income(2)
Total 22,263 100% 8,592 100% 2,755 100% 10,916 100%30% of median family household income 7,827 35% 2,990 35% 1,381 50% 3,455 32%30 - 50% 9,164 41% 3,486 41% 999 36% 4,679 43%50 - 60% 5,272 24% 2,116 25% 375 14% 2,781 25%
Housing Assistance Need (3)
Household Income Categories(2)
Total 171,062 100% 41,191 100% 50,603 100% 79,268 100%
30% of median family household income 68,210 40% 15,356 37% 25,410 50% 27,443 35%30 - 50% 68,458 40% 16,618 40% 18,318 36% 33,523 42%50 - 60% 34,394 20% 9,217 22% 6,876 14% 18,302 23%
Notes:
Seven-County Twin Cities Metropolitan AreaExhibit 4. Analysis of Unmet Need, 2010
All Households(1)
Family Households with
Children <18Senior (65+) Households
Non-Senior Households
without Children <18
Non-Senior Households
without Children <18
(1) Includes owner and renter occupied households.
(3) This measures low-income households that were cost-burdened in 2000, and for whom some sort of housing assistance program (that is administered during the decade) would be helpful.
(2) New construction need households are distributed following the 2010 projected distribution of low-income households and housing assistance need households are distributed following 2000 U.S. Census counts of cost-burdened, low-income households.
All Households(1)
Family Households with
Children <18Senior (65+) Households
2000
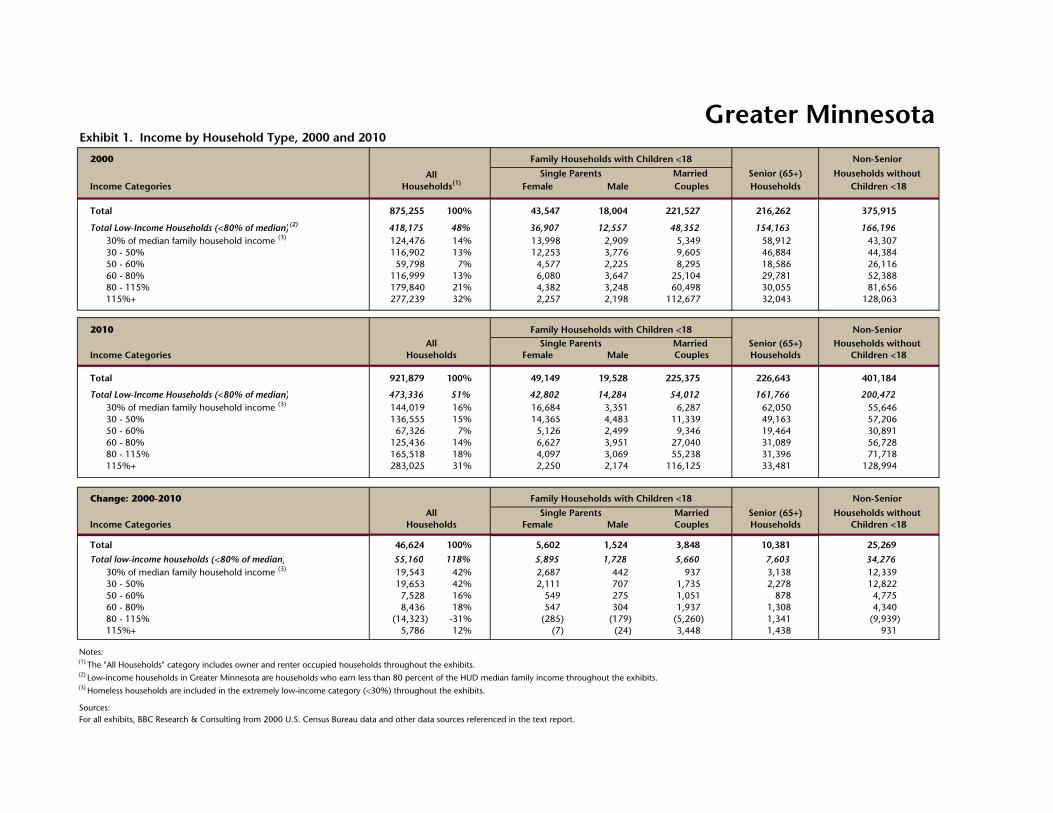
Total 875,255 100% 43,547 18,004 221,527 216,262 375,915
Total Low-Income Households (<80% of median)(2) 418,175 48% 36,907 12,557 48,352 154,163 166,19630% of median family household income (3) 124,476 14% 13,998 2,909 5,349 58,912 43,30730 - 50% 116,902 13% 12,253 3,776 9,605 46,884 44,38450 - 60% 59,798 7% 4,577 2,225 8,295 18,586 26,11660 - 80% 116,999 13% 6,080 3,647 25,104 29,781 52,38880 - 115% 179,840 21% 4,382 3,248 60,498 30,055 81,656115%+ 277,239 32% 2,257 2,198 112,677 32,043 128,063
2010
Total 921,879 100% 49,149 19,528 225,375 226,643 401,184
Total Low-Income Households (<80% of median) 473,336 51% 42,802 14,284 54,012 161,766 200,47230% of median family household income (3) 144,019 16% 16,684 3,351 6,287 62,050 55,64630 - 50% 136,555 15% 14,365 4,483 11,339 49,163 57,20650 - 60% 67,326 7% 5,126 2,499 9,346 19,464 30,89160 - 80% 125,436 14% 6,627 3,951 27,040 31,089 56,72880 - 115% 165,518 18% 4,097 3,069 55,238 31,396 71,718115%+ 283,025 31% 2,250 2,174 116,125 33,481 128,994
Total 46,624 100% 5,602 1,524 3,848 10,381 25,269
Total low-income households (<80% of median) 55,160 118% 5,895 1,728 5,660 7,603 34,27630% of median family household income (3) 19,543 42% 2,687 442 937 3,138 12,33930 - 50% 19,653 42% 2,111 707 1,735 2,278 12,82250 - 60% 7,528 16% 549 275 1,051 878 4,77560 - 80% 8,436 18% 547 304 1,937 1,308 4,34080 - 115% (14,323) -31% (285) (179) (5,260) 1,341 (9,939)115%+ 5,786 12% (7) (24) 3,448 1,438 931
Notes:
Greater Minnesota
Households withoutMarried
Family Households with Children <18
Exhibit 1. Income by Household Type, 2000 and 2010
All
Non-Senior
Senior (65+)HouseholdsCouples
HouseholdsSenior (65+)
MaleHouseholds(1)Single Parents
Households without
Female Children <18
Family Households with Children <18
Family Households with Children <18
CouplesFemale MaleHouseholds without
AllHouseholds
Income Categories
Income Categories HouseholdsAll
Children <18HouseholdsSenior (65+)
Change: 2000-2010
Single Parents MarriedCouplesMaleIncome Categories Female
Non-Senior
Non-Senior
For all exhibits, BBC Research & Consulting from 2000 U.S. Census Bureau data and other data sources referenced in the text report.
(2) Low-income households in Greater Minnesota are households who earn less than 80 percent of the HUD median family income throughout the exhibits.
(1) The "All Households" category includes owner and renter occupied households throughout the exhibits.
(3) Homeless households are included in the extremely low-income category (<30%) throughout the exhibits.
Sources:
Children <18Married Single Parents
2000
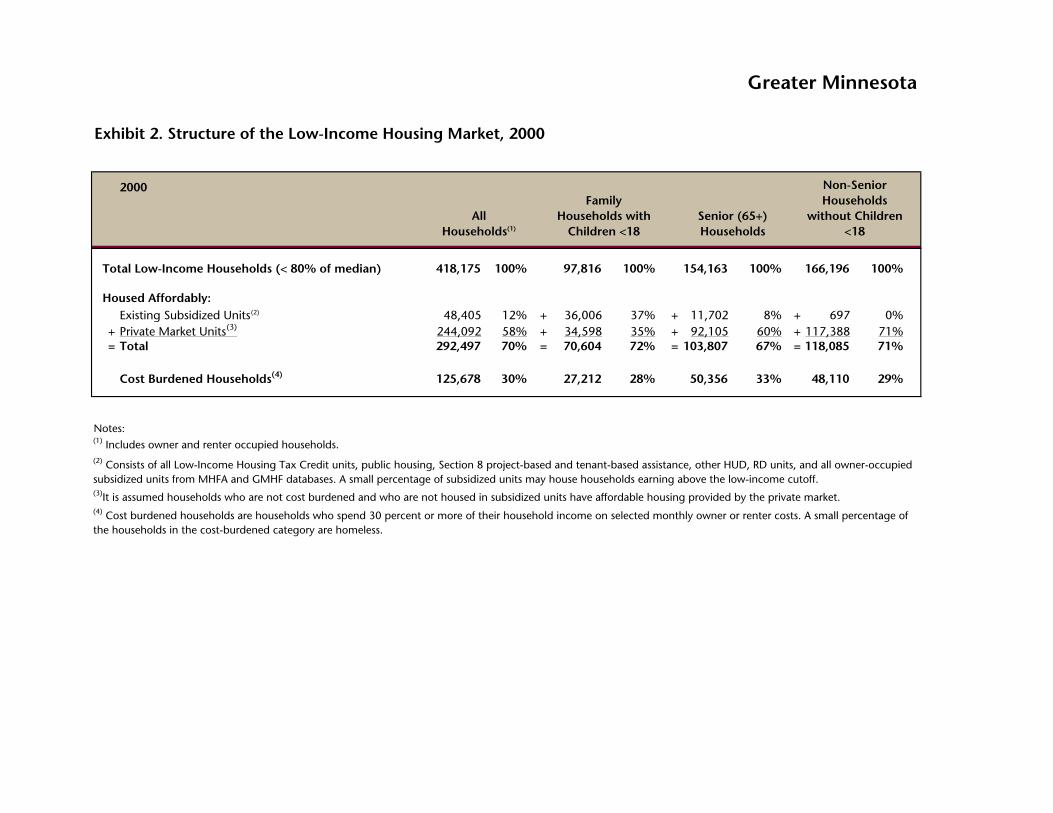
Total Low-Income Households (< 80% of median) 418,175 100% 97,816 100% 154,163 100% 166,196 100%
Housed Affordably:Existing Subsidized Units(2) 48,405 12% + 36,006 37% + 11,702 8% + 697 0%
+ Private Market Units(3) 244,092 58% + 34,598 35% + 92,105 60% + 117,388 71%= Total 292,497 70% = 70,604 72% = 103,807 67% = 118,085 71%
292,497 70,604 103,807 118,085
Cost Burdened Households(4) 125,678 30% 27,212 28% 50,356 33% 48,110 29%
Notes:
(4) Cost burdened households are households who spend 30 percent or more of their household income on selected monthly owner or renter costs. A small percentage of the households in the cost-burdened category are homeless.
Greater Minnesota
(2) Consists of all Low-Income Housing Tax Credit units, public housing, Section 8 project-based and tenant-based assistance, other HUD, RD units, and all owner-occupied subsidized units from MHFA and GMHF databases. A small percentage of subsidized units may house households earning above the low-income cutoff.
All Households(1)
Family Households with
Children <18Senior (65+) Households
Non-Senior Households
without Children <18
(1) Includes owner and renter occupied households.
(3)It is assumed households who are not cost burdened and who are not housed in subsidized units have affordable housing provided by the private market.
Exhibit 2. Structure of the Low-Income Housing Market, 2000
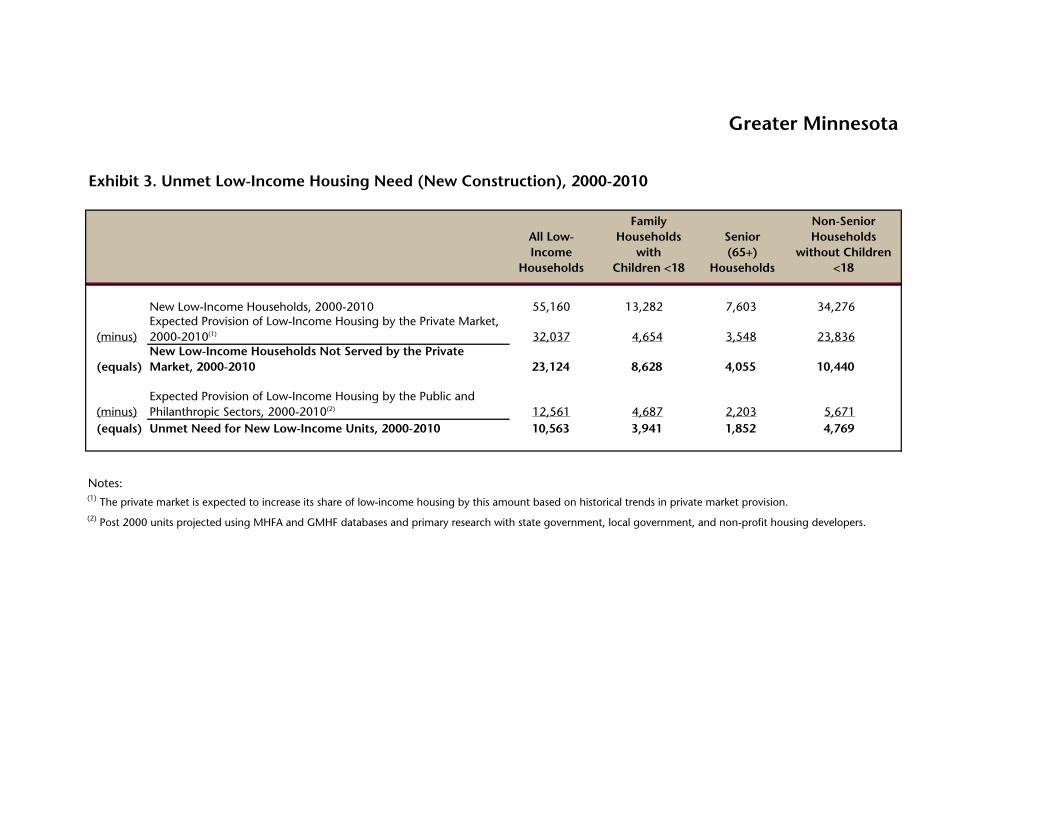
55,160 13,282 7,603 34,276New Low-Income Households, 2000-2010 55,160 13,282 7,603 34,276 55,160
(minus)Expected Provision of Low-Income Housing by the Private Market, 2000-2010(1) 32,037 4,654 3,548 23,836 32,037
(equals)New Low-Income Households Not Served by the Private Market, 2000-2010 23,124 0 8,628 4,055 10,440 23,124
23,124 8,628 4,055 10,440 0
(minus)Expected Provision of Low-Income Housing by the Public and Philanthropic Sectors, 2000-2010(2) 12,561 4,687 2,203 5,671 12,561
(equals) Unmet Need for New Low-Income Units, 2000-2010 10,563 3,941 1,852 4,769 10,563
33,235 4,923 4,195 24,117Notes: 4,698 4,542 24,210(1) The private market is expected to increase its share of low-income housing by this amount based on historical trends in private market provision.
Greater Minnesota
Exhibit 3. Unmet Low-Income Housing Need (New Construction), 2000-2010
All Low-Income
Households
Family Households
with Children <18
Senior (65+)
Households
Non-Senior Households
without Children <18
(2) Post 2000 units projected using MHFA and GMHF databases and primary research with state government, local government, and non-profit housing developers.
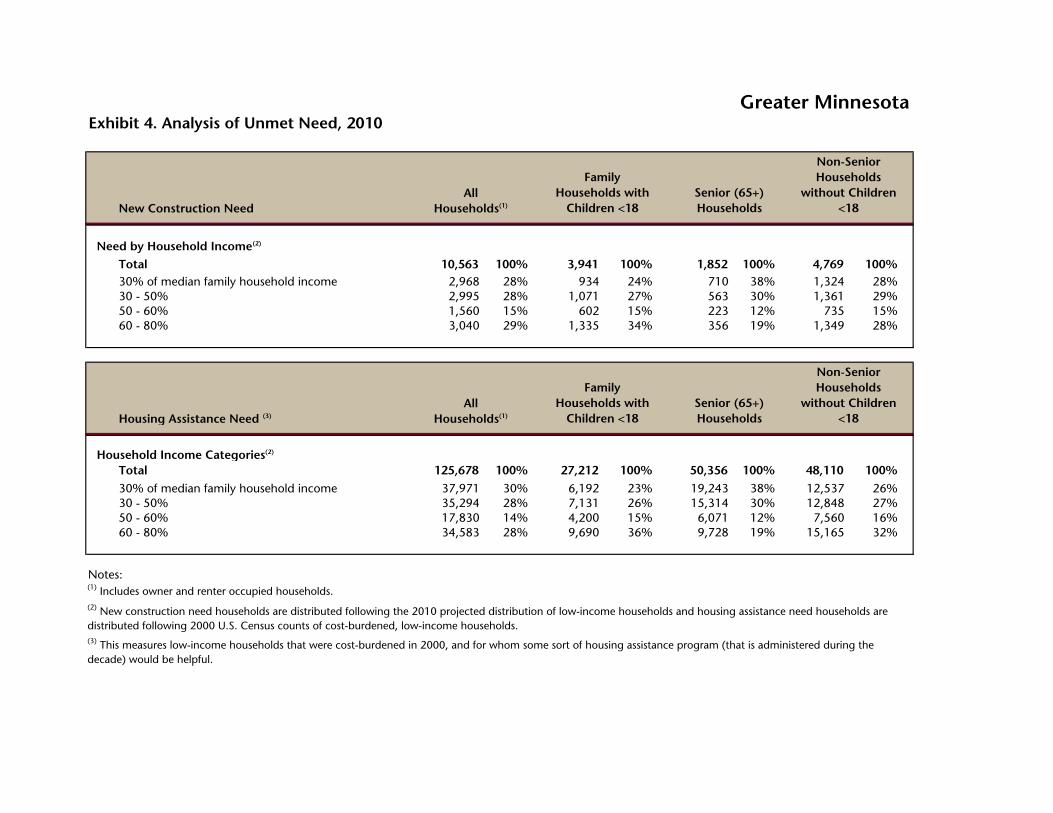
New Construction Need
Need by Household Income(2)
Total 10,563 100% 3,941 100% 1,852 100% 4,769 100%30% of median family household income 2,968 28% 934 24% 710 38% 1,324 28%30 - 50% 2,995 28% 1,071 27% 563 30% 1,361 29%50 - 60% 1,560 15% 602 15% 223 12% 735 15%60 - 80% 3,040 29% 1,335 34% 356 19% 1,349 28%
Housing Assistance Need (3)
Household Income Categories(2)
Total 125,678 100% 27,212 100% 50,356 100% 48,110 100%
30% of median family household income 37,971 30% 6,192 23% 19,243 38% 12,537 26%30 - 50% 35,294 28% 7,131 26% 15,314 30% 12,848 27%50 - 60% 17,830 14% 4,200 15% 6,071 12% 7,560 16%60 - 80% 34,583 28% 9,690 36% 9,728 19% 15,165 32%
Notes:
Greater MinnesotaExhibit 4. Analysis of Unmet Need, 2010
All Households(1)
Family Households with
Children <18Senior (65+) Households
Non-Senior Households
without Children <18
Senior (65+) Households
Non-Senior Households
without Children <18
(3) This measures low-income households that were cost-burdened in 2000, and for whom some sort of housing assistance program (that is administered during the decade) would be helpful.
(2) New construction need households are distributed following the 2010 projected distribution of low-income households and housing assistance need households are distributed following 2000 U.S. Census counts of cost-burdened, low-income households.
(1) Includes owner and renter occupied households.
All Households(1)
Family Households with
Children <18


![scripting slides.ppt [Read-Only] - perforce.com · Perforce Training, 2010.1 3 Objectives • Dl itt f tkDevelop scripts to perform common tasks • Follow best practices Uses of](https://img.pdfslide.us/doc/110x75/5b7894d57f8b9a7f378bdd29/scripting-read-only-perforcecom-perforce-training-20101-3-objectives.jpg)


![[Eng]Aluminium Code Check 2010.1 v1](https://img.pdfslide.us/doc/110x75/552a75d84a7959066e8b45f7/engaluminium-code-check-20101-v1.jpg)