Embed Size (px)
Citation preview
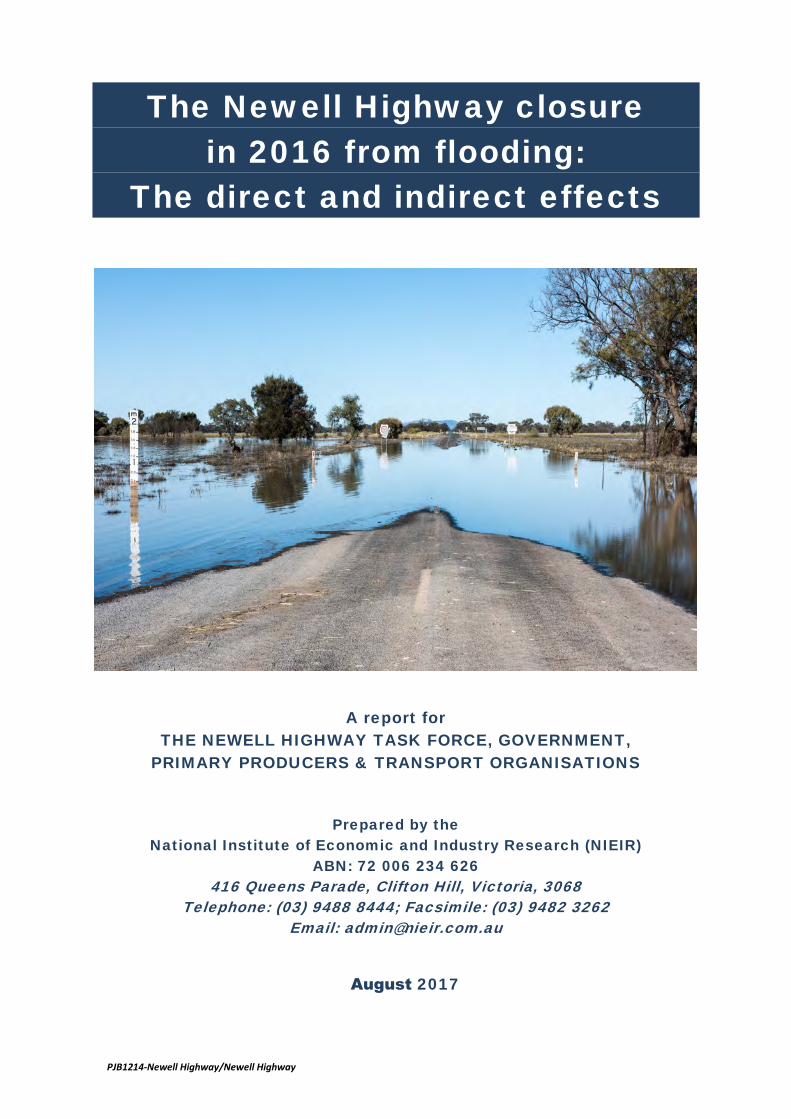
The Newell Highway closure
in 2016 from flooding:
The direct and indirect effects
A report for
THE NEWELL HIGHWAY TASK FORCE, GOVERNMENT,
PRIMARY PRODUCERS & TRANSPORT ORGANISATIONS
Prepared by the
National Institute of Economic and Industry Research (NIEIR)
ABN: 72 006 234 626
416 Queens Parade, Clifton Hill, Victoria, 3068
Telephone: (03) 9488 8444; Facsimile: (03) 9482 3262
Email: [email protected]
August 2017
PJB1214-Newell Highway/Newell Highway

While the National Institute endeavours to provide reliable forecasts and believes the material is accurate it will not be liable for any claim by any party acting on such information.
PJB1214 – The Newell Highway closure in 2016 from flooding: The direct and indirect effects 1 1 1 1
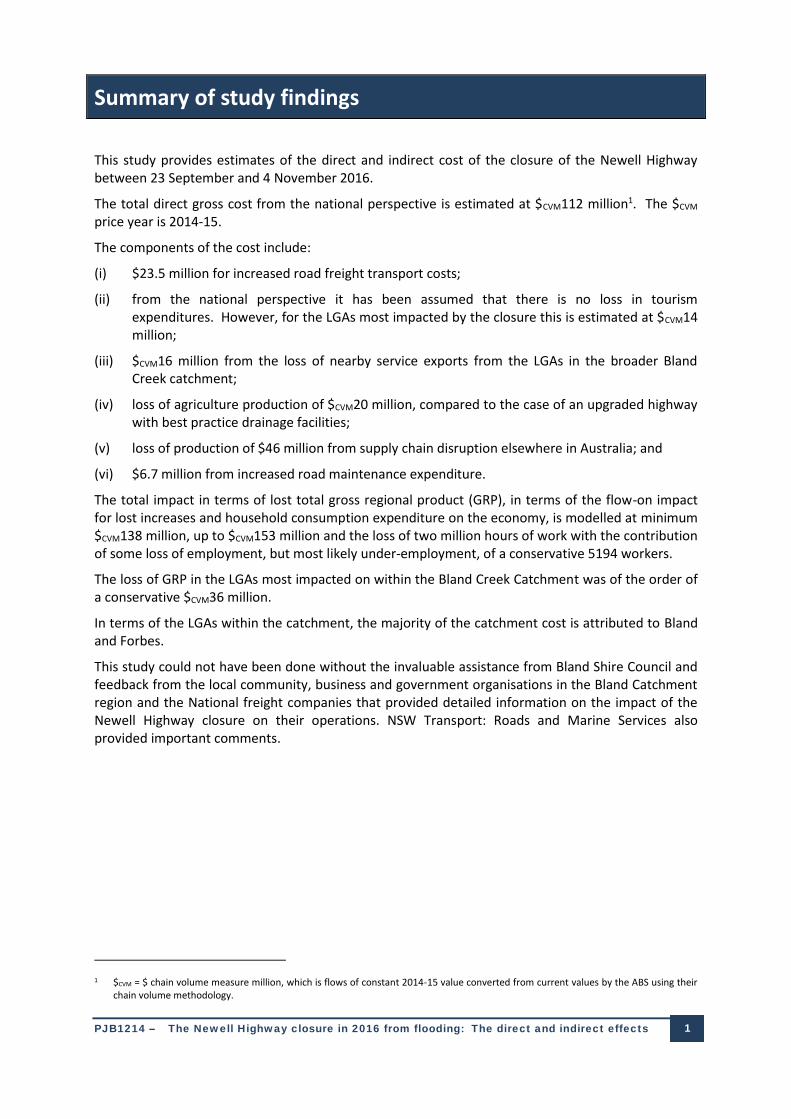
Summary of study findings
This study provides estimates of the direct and indirect cost of the closure of the Newell Highway between 23 September and 4 November 2016.
The total direct gross cost from the national perspective is estimated at $CVM112 million1. The $CVM price year is 2014-15.
The components of the cost include:
(i) $23.5 million for increased road freight transport costs;
(ii) from the national perspective it has been assumed that there is no loss in tourism expenditures. However, for the LGAs most impacted by the closure this is estimated at $CVM14 million;
(iii) $CVM16 million from the loss of nearby service exports from the LGAs in the broader Bland Creek catchment;
(iv) loss of agriculture production of $CVM20 million, compared to the case of an upgraded highway with best practice drainage facilities;
(v) loss of production of $46 million from supply chain disruption elsewhere in Australia; and
(vi) $6.7 million from increased road maintenance expenditure.
The total impact in terms of lost total gross regional product (GRP), in terms of the flow-on impact for lost increases and household consumption expenditure on the economy, is modelled at minimum $CVM138 million, up to $CVM153 million and the loss of two million hours of work with the contribution of some loss of employment, but most likely under-employment, of a conservative 5194 workers.
The loss of GRP in the LGAs most impacted on within the Bland Creek Catchment was of the order of a conservative $CVM36 million.
In terms of the LGAs within the catchment, the majority of the catchment cost is attributed to Bland and Forbes.
This study could not have been done without the invaluable assistance from Bland Shire Council and feedback from the local community, business and government organisations in the Bland Catchment region and the National freight companies that provided detailed information on the impact of the Newell Highway closure on their operations. NSW Transport: Roads and Marine Services also provided important comments.
1 $CVM = $ chain volume measure million, which is flows of constant 2014-15 value converted from current values by the ABS using their chain volume methodology.
PJB1214 – The Newell Highway closure in 2016 from flooding: The direct and indirect effects 2 2 2 2
The direct and indirect cost of the Newell Highway closure
The study objective is to quantify the direct and indirect economic costs of the flooding in the Bland Creek catchment which led to the closure of the Newell Highway between West Wyalong and Forbes. The road was closed on 23 September 2016 and reopened on 4 November 2016. A total of 43 days. However, the study assumes a 44 day closure to allow for lags in the adjustment of behaviour. This estimate is conservative. The effective impact on truck routes may well have occurred before 23 September while the lagged adjustment to the road opening would have been certainly greater than one day.
Hereinafter the event is referred to as the ‘road closure’.
1. Study information sources
The information sources on which this report was based were:
■ community and LGA consultation;
■ survey of freight transport organisations;
■ Tourism Research Australia data series; and
■ the NIEIR LGA data base.
The survey of freight transport organisations involved nine organisations. These organisations provided, on a strictly confidential basis, detailed information of freight transport economics along the Newell catchment area and the impact on the economics due to the road closure.
As will be seen below, Tourism Research Australia data was also an important input. However, the data had to be seasonally adjusted and greatly filtered to remove underlying instability caused by small sample sizes for some of the SA2 regions. For most of the Bland Creek Catchment LGAs the tourism data for the last two quarters of 2016 was in accordance with community assessment. This was not the case for West Wyalong which was assumed to follow the same outcome as the Forbes SA2 adjusted from community assessment feedback.
2. The Bland Creek Catchment
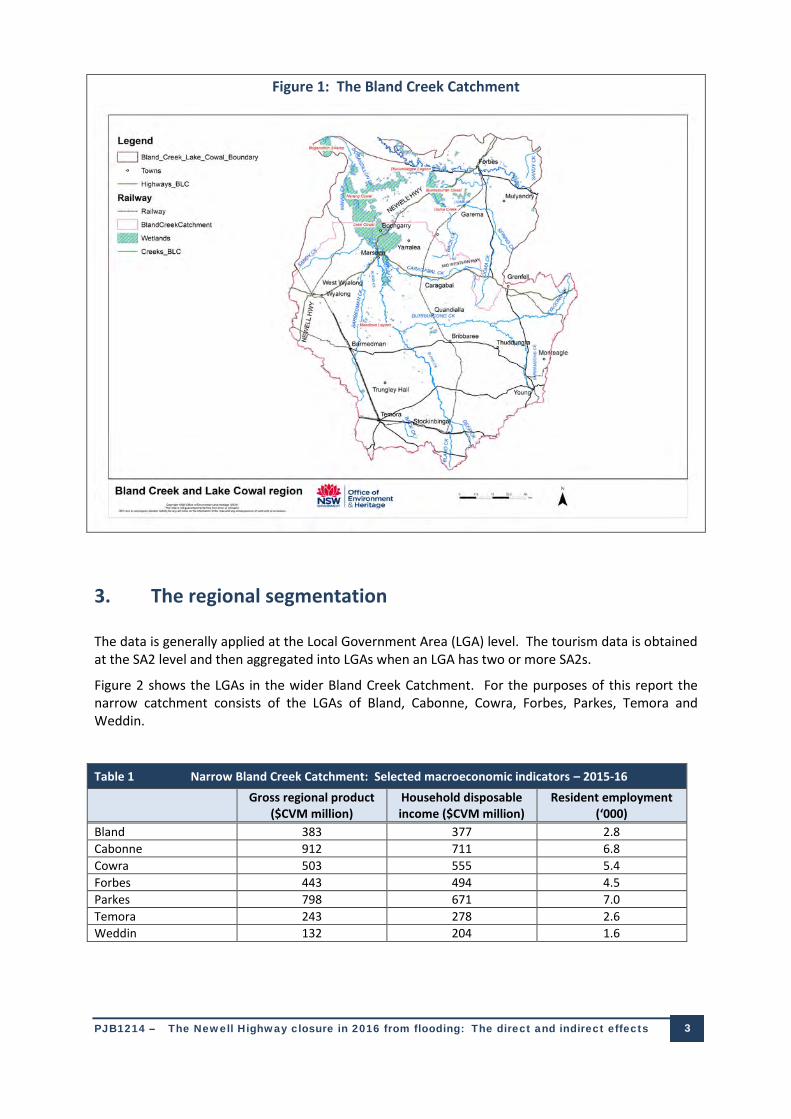
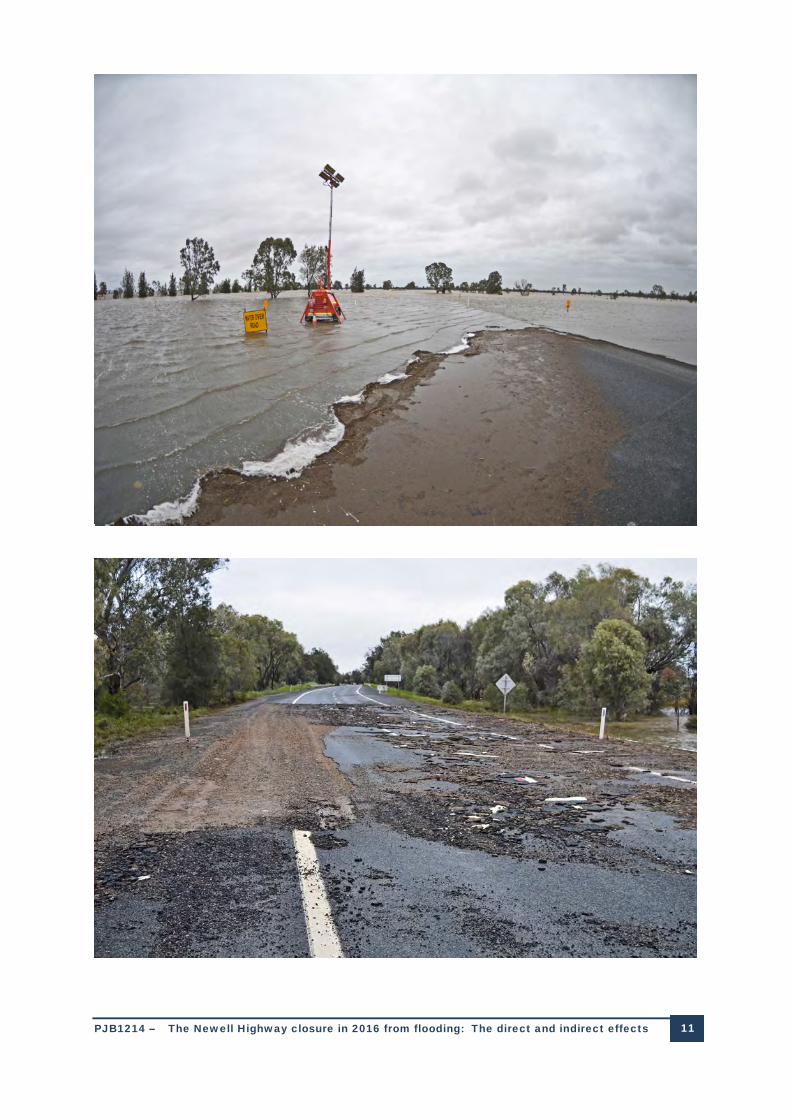
The Newell Highway was closed because of flooding in the Bland Creek catchment shown in Figure 1.
The Bland Creek in central New South Wales rises near Twins Range (elevation 390m) around 15kms west of Cootamundra. It drops around 185m over its 173km length, where it eventually flows into Lake Cowal (elevation 208m).
The following seven creeks flow into the Bland Creek: Berthong, Rushy, Meedallion, Bribbaree, Narraburra, Burrangong, and Barmedman Creeks.
The Bland Creek Catchment, which covers an approximate area of 940,950 hectares, has been divided into six sub-catchments: Barmedman, Burrangong/Tyagong, Caragabal, Lower Burrangong, Narraburra/Duck Creek, and Upper Bland.
PJB1214 – The Newell Highway closure in 2016 from flooding: The direct and indirect effects 3 3 3 3
Figure 1: The Bland Creek Catchment
3. The regional segmentation
The data is generally applied at the Local Government Area (LGA) level. The tourism data is obtained at the SA2 level and then aggregated into LGAs when an LGA has two or more SA2s.
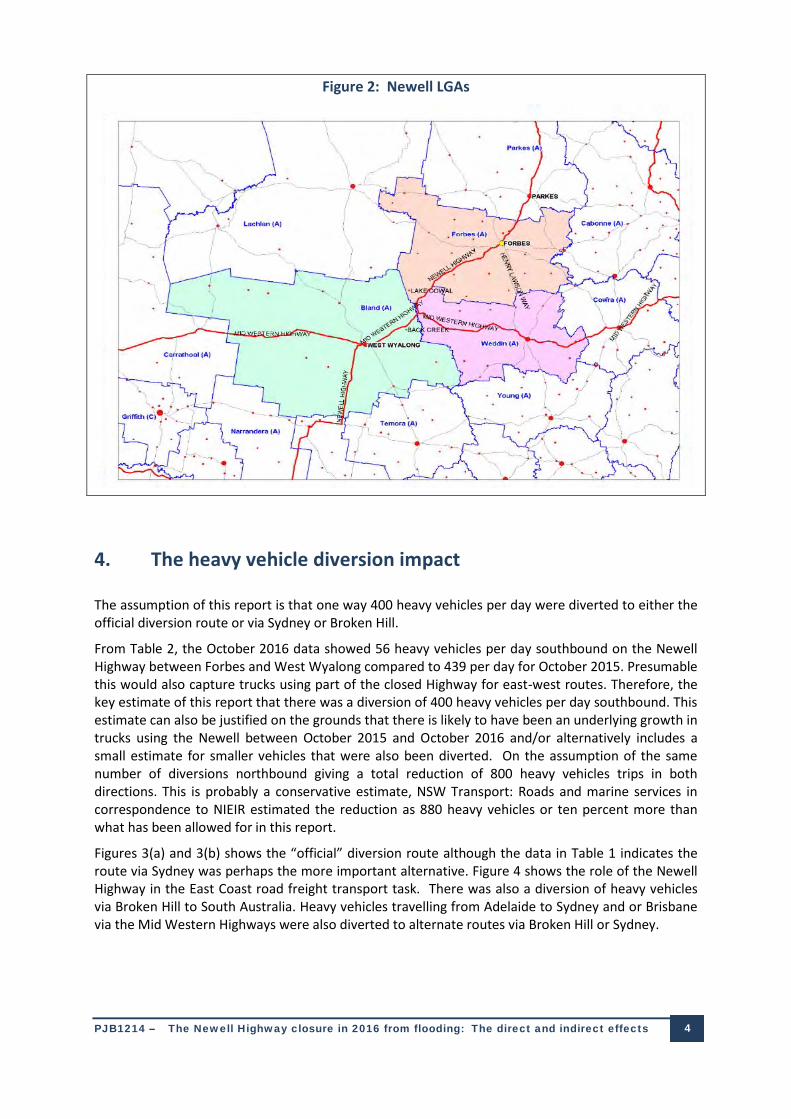
Figure 2 shows the LGAs in the wider Bland Creek Catchment. For the purposes of this report the narrow catchment consists of the LGAs of Bland, Cabonne, Cowra, Forbes, Parkes, Temora and Weddin.
Table 1 Narrow Bland Creek Catchment: Selected macroeconomic indicators – 2015-16
Gross regional product ($CVM million)
Household disposable income ($CVM million)
Resident employment (‘000)
Bland 383 377 2.8
Cabonne 912 711 6.8
Cowra 503 555 5.4
Forbes 443 494 4.5
Parkes 798 671 7.0
Temora 243 278 2.6
Weddin 132 204 1.6
PJB1214 – The Newell Highway closure in 2016 from flooding: The direct and indirect effects 4 4 4 4
Figure 2: Newell LGAs
4. The heavy vehicle diversion impact
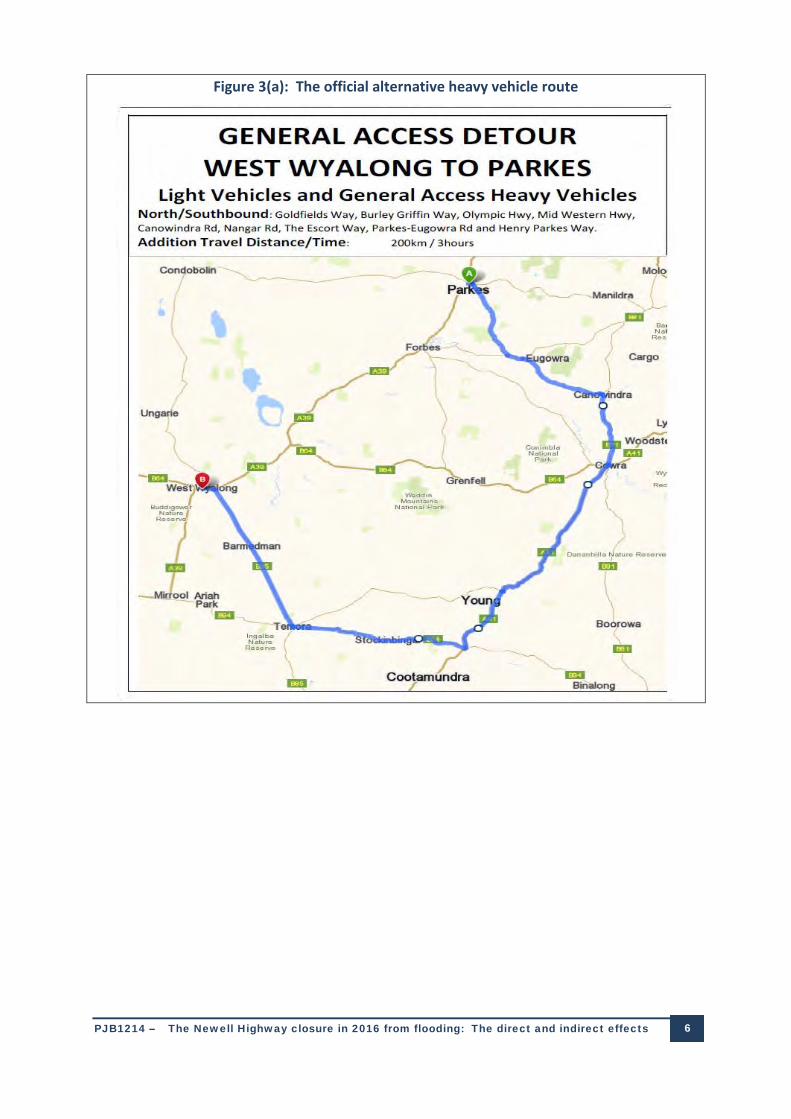
The assumption of this report is that one way 400 heavy vehicles per day were diverted to either the official diversion route or via Sydney or Broken Hill.
From Table 2, the October 2016 data showed 56 heavy vehicles per day southbound on the Newell Highway between Forbes and West Wyalong compared to 439 per day for October 2015. Presumable this would also capture trucks using part of the closed Highway for east-west routes. Therefore, the key estimate of this report that there was a diversion of 400 heavy vehicles per day southbound. This estimate can also be justified on the grounds that there is likely to have been an underlying growth in trucks using the Newell between October 2015 and October 2016 and/or alternatively includes a small estimate for smaller vehicles that were also been diverted. On the assumption of the same number of diversions northbound giving a total reduction of 800 heavy vehicles trips in both directions. This is probably a conservative estimate, NSW Transport: Roads and marine services in correspondence to NIEIR estimated the reduction as 880 heavy vehicles or ten percent more than what has been allowed for in this report.
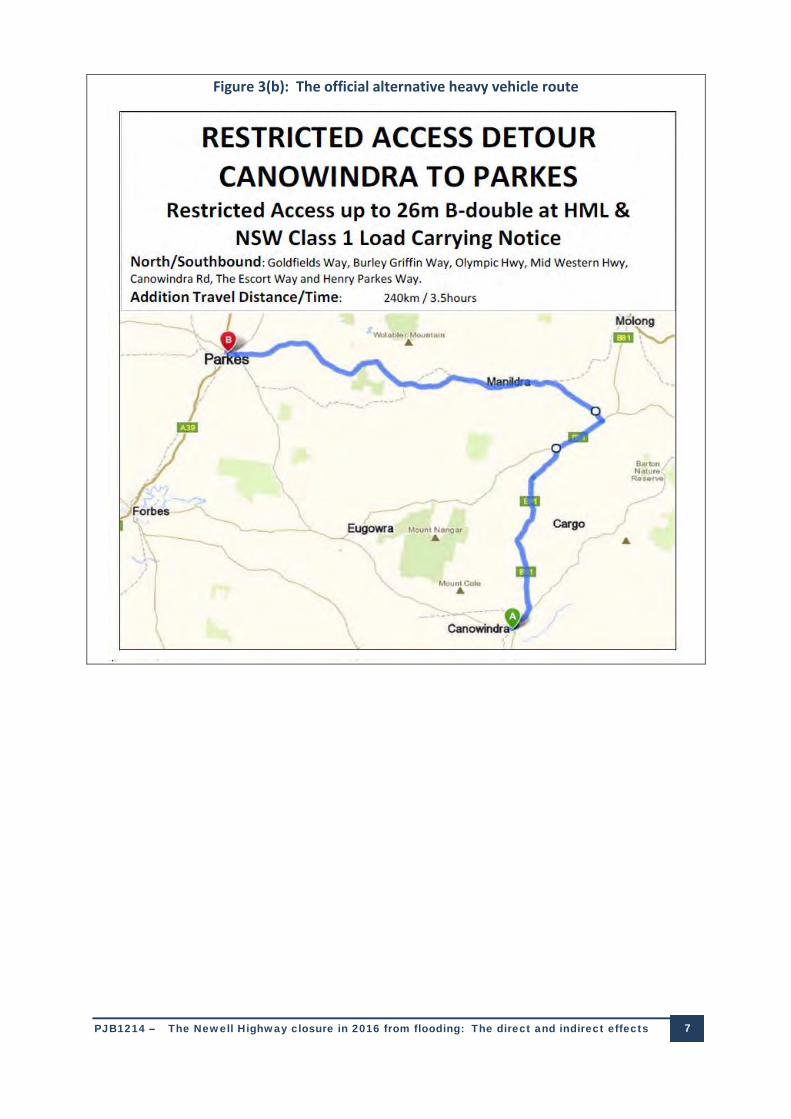
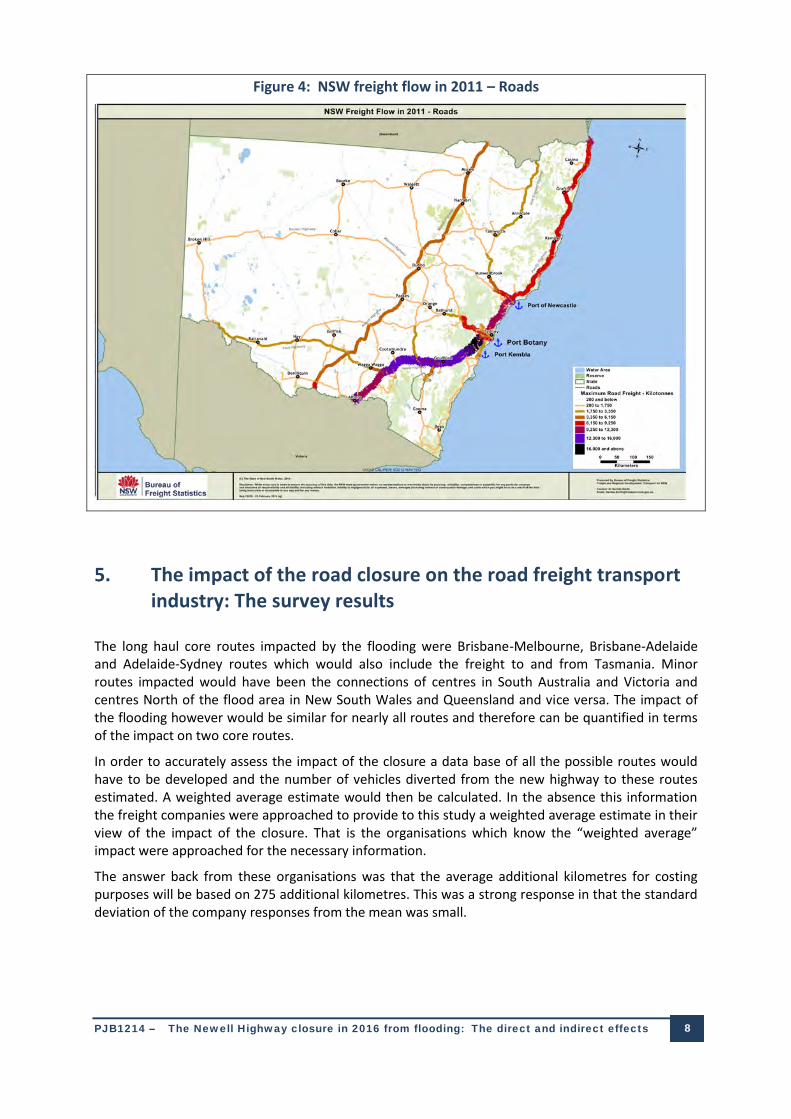
Figures 3(a) and 3(b) shows the “official” diversion route although the data in Table 1 indicates the route via Sydney was perhaps the more important alternative. Figure 4 shows the role of the Newell Highway in the East Coast road freight transport task. There was also a diversion of heavy vehicles via Broken Hill to South Australia. Heavy vehicles travelling from Adelaide to Sydney and or Brisbane via the Mid Western Highways were also diverted to alternate routes via Broken Hill or Sydney.
PJB1214 – The Newell Highway closure in 2016 from flooding: The direct and indirect effects 5 5 5 5
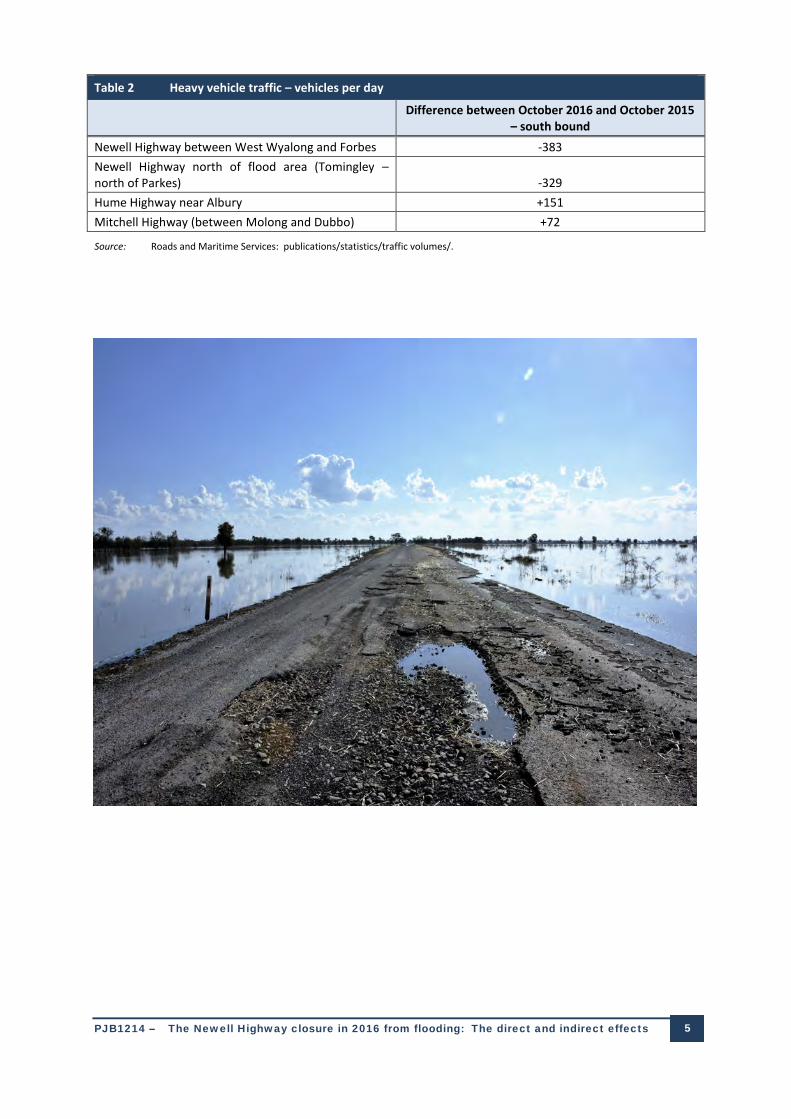
Table 2 Heavy vehicle traffic – vehicles per day
Difference between October 2016 and October 2015 – south bound
Newell Highway between West Wyalong and Forbes -383
Newell Highway north of flood area (Tomingley – north of Parkes) -329
Hume Highway near Albury +151
Mitchell Highway (between Molong and Dubbo) +72
Source: Roads and Maritime Services: publications/statistics/traffic volumes/.
PJB1214 – The Newell Highway closure in 2016 from flooding: The direct and indirect effects 6 6 6 6
Figure 3(a): The official alternative heavy vehicle route
PJB1214 – The Newell Highway closure in 2016 from flooding: The direct and indirect effects 7 7 7 7
Figure 3(b): The official alternative heavy vehicle route
PJB1214 – The Newell Highway closure in 2016 from flooding: The direct and indirect effects 8 8 8 8
Figure 4: NSW freight flow in 2011 – Roads
5. The impact of the road closure on the road freight transportindustry: The survey results
The long haul core routes impacted by the flooding were Brisbane-Melbourne, Brisbane-Adelaide and Adelaide-Sydney routes which would also include the freight to and from Tasmania. Minor routes impacted would have been the connections of centres in South Australia and Victoria and centres North of the flood area in New South Wales and Queensland and vice versa. The impact of the flooding however would be similar for nearly all routes and therefore can be quantified in terms of the impact on two core routes.
In order to accurately assess the impact of the closure a data base of all the possible routes would have to be developed and the number of vehicles diverted from the new highway to these routes estimated. A weighted average estimate would then be calculated. In the absence this information the freight companies were approached to provide to this study a weighted average estimate in their view of the impact of the closure. That is the organisations which know the “weighted average” impact were approached for the necessary information.
The answer back from these organisations was that the average additional kilometres for costing purposes will be based on 275 additional kilometres. This was a strong response in that the standard deviation of the company responses from the mean was small.
PJB1214 – The Newell Highway closure in 2016 from flooding: The direct and indirect effects 9 9 9 9
This does not mean that technically shorter options were not available. For example new or was used then the appropriate diversion would be the Dubbo-Cowra-Temora diversion a distance of 110 km. Some of the diversions via Sydney would also have added less than 275 km. The freight companies went to great pains to stress that the weighted average impact incorporated many factors. Some routes were not employed because of inferior roads resulting in greater wear and tear on trucks and increased travel times. Even if the shorter routes were employed the freight companies took this into account by estimating the travel length equivalent which captured the increased costs. The same is true of diversion routes via Sydney where the increased congestion costs of higher truck running cross per kilometre and increased travel times from congestion were also taken into account by deriving a weighted average effective travel distance to version.
The B-double is the largest vehicle allowed on the Newell Highway with a maximum load of 36 tonnes and higher for other vehicle types. The average load from the freight company survey is approximately 33 tonnes though back fill loads will in general be considerable less. Hence the 20 tonne average per trip in Table 4.
The average fuel efficiency of a loaded B-double is 1.6 to 1.8 kilometres per litre. However all survey respondents noted that fuel efficiency would have declined because of the flooding due to:
■ more hills for the alternative routes East of the Newell Highway;
■ to reach maximum fuel efficiency standards driver specialise in routes. The flooding forceddrivers into unfamiliar routes.
Therefore a fuel efficiency average standard of 1.6 kilometres is adopted for this report.
The average extra time for a trip was placed by the survey respondents at between three and five hours. The Sydney diversion incurred additional time delays from congestion. The average extra time adopted in this report is, therefore, four hours.
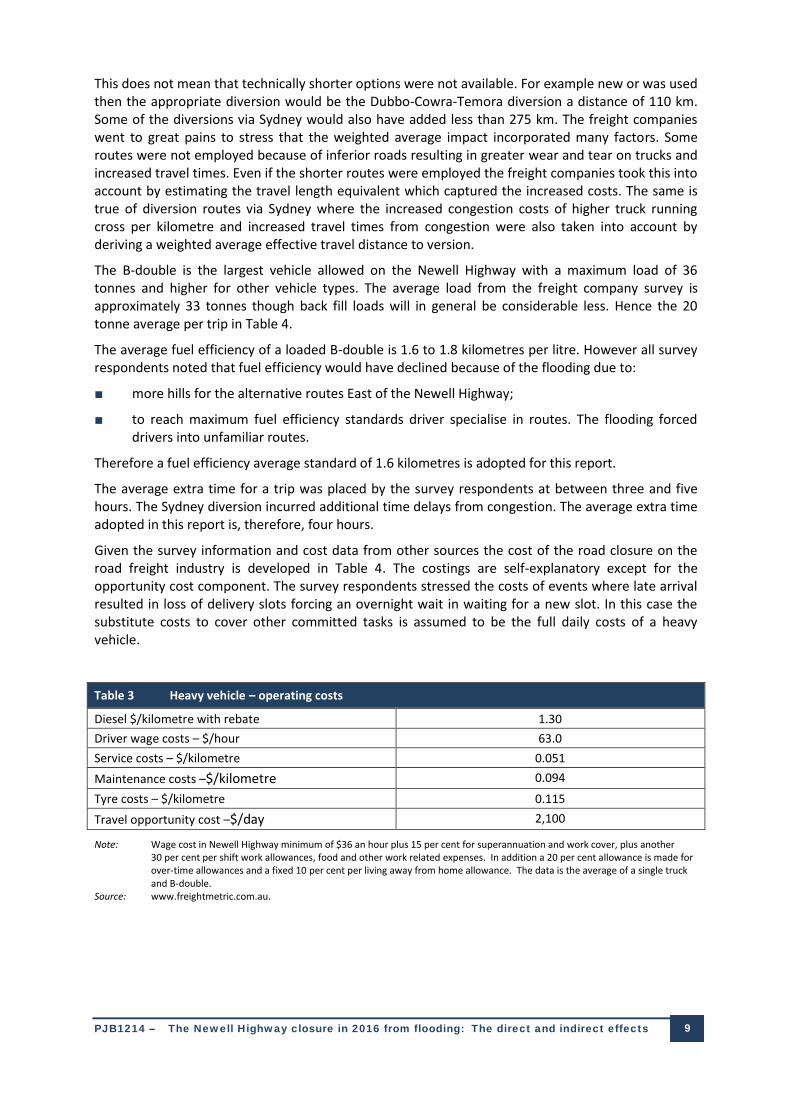
Given the survey information and cost data from other sources the cost of the road closure on the road freight industry is developed in Table 4. The costings are self-explanatory except for the opportunity cost component. The survey respondents stressed the costs of events where late arrival resulted in loss of delivery slots forcing an overnight wait in waiting for a new slot. In this case the substitute costs to cover other committed tasks is assumed to be the full daily costs of a heavy vehicle.
Table 3 Heavy vehicle – operating costs
Diesel $/kilometre with rebate 1.30
Driver wage costs – $/hour 63.0
Service costs – $/kilometre 0.051
Maintenance costs –$/kilometre 0.094
Tyre costs – $/kilometre 0.115
Travel opportunity cost –$/day 2,100
Note: Wage cost in Newell Highway minimum of $36 an hour plus 15 per cent for superannuation and work cover, plus another 30 per cent per shift work allowances, food and other work related expenses. In addition a 20 per cent allowance is made for over-time allowances and a fixed 10 per cent per living away from home allowance. The data is the average of a single truck and B-double.
Source: www.freightmetric.com.au.
PJB1214 – The Newell Highway closure in 2016 from flooding: The direct and indirect effects 10 10 10 10
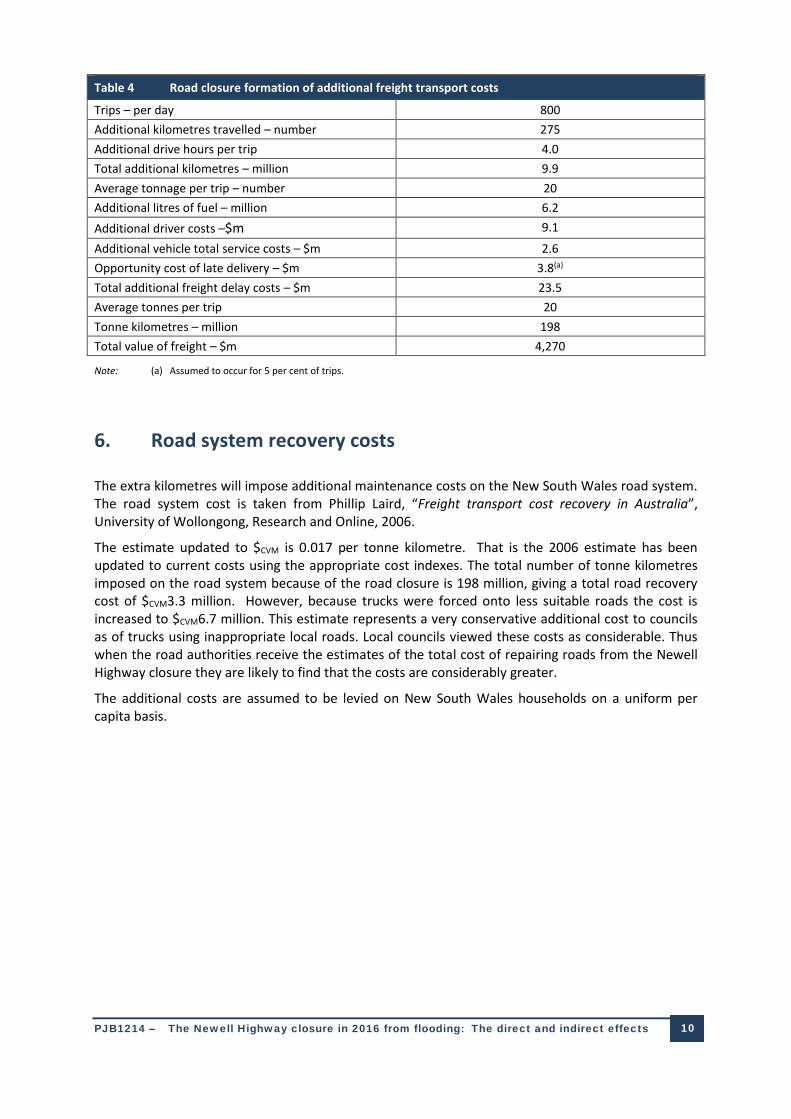
Table 4 Road closure formation of additional freight transport costs
Trips – per day 800
Additional kilometres travelled – number 275
Additional drive hours per trip 4.0
Total additional kilometres – million 9.9
Average tonnage per trip – number 20
Additional litres of fuel – million 6.2
Additional driver costs –$m 9.1
Additional vehicle total service costs – $m 2.6
Opportunity cost of late delivery – $m 3.8(a)
Total additional freight delay costs – $m 23.5
Average tonnes per trip 20
Tonne kilometres – million 198
Total value of freight – $m 4,270
Note: (a) Assumed to occur for 5 per cent of trips.
6. Road system recovery costs
The extra kilometres will impose additional maintenance costs on the New South Wales road system. The road system cost is taken from Phillip Laird, “Freight transport cost recovery in Australia”, University of Wollongong, Research and Online, 2006.
The estimate updated to $CVM is 0.017 per tonne kilometre. That is the 2006 estimate has been updated to current costs using the appropriate cost indexes. The total number of tonne kilometres imposed on the road system because of the road closure is 198 million, giving a total road recovery cost of $CVM3.3 million. However, because trucks were forced onto less suitable roads the cost is increased to $CVM6.7 million. This estimate represents a very conservative additional cost to councils as of trucks using inappropriate local roads. Local councils viewed these costs as considerable. Thus when the road authorities receive the estimates of the total cost of repairing roads from the Newell Highway closure they are likely to find that the costs are considerably greater.
The additional costs are assumed to be levied on New South Wales households on a uniform per capita basis.
PJB1214 – The Newell Highway closure in 2016 from flooding: The direct and indirect effects 11 11 11 11
PJB1214 – The Newell Highway closure in 2016 from flooding: The direct and indirect effects 12 12 12 12
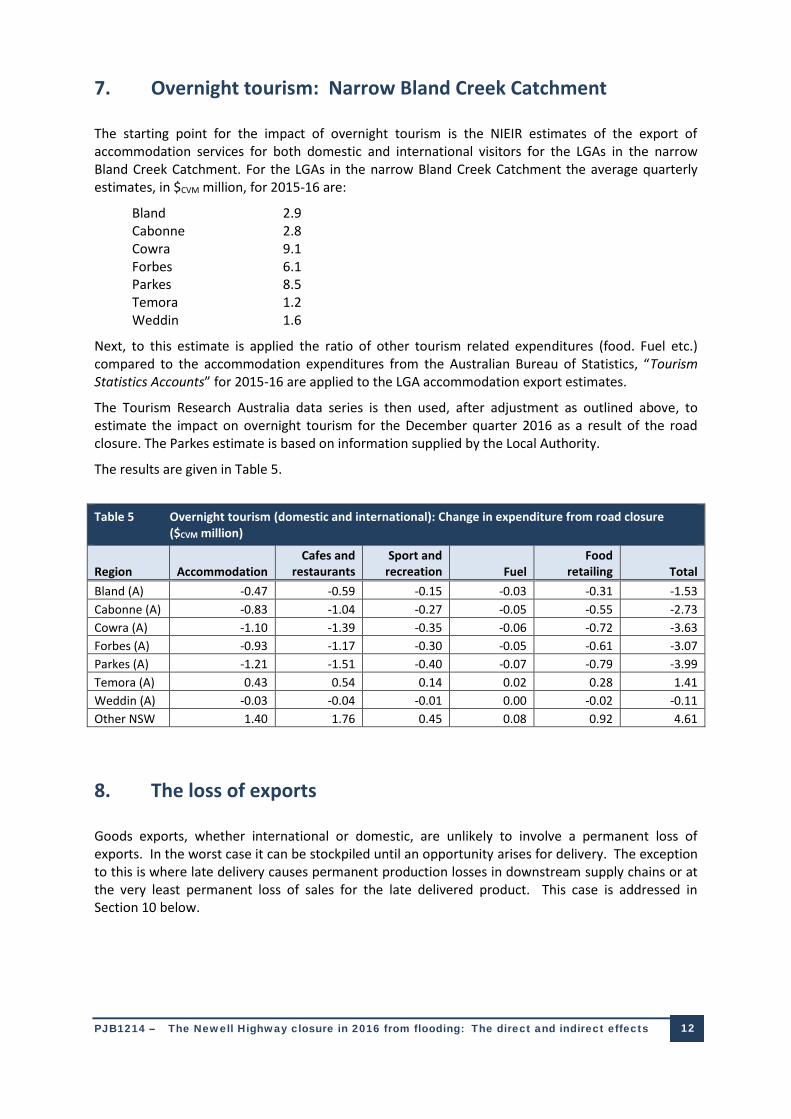
7. Overnight tourism: Narrow Bland Creek Catchment
The starting point for the impact of overnight tourism is the NIEIR estimates of the export of accommodation services for both domestic and international visitors for the LGAs in the narrow Bland Creek Catchment. For the LGAs in the narrow Bland Creek Catchment the average quarterly estimates, in $CVM million, for 2015-16 are:
Bland 2.9 Cabonne 2.8 Cowra 9.1 Forbes 6.1 Parkes 8.5 Temora 1.2 Weddin 1.6
Next, to this estimate is applied the ratio of other tourism related expenditures (food. Fuel etc.) compared to the accommodation expenditures from the Australian Bureau of Statistics, “Tourism Statistics Accounts” for 2015-16 are applied to the LGA accommodation export estimates.
The Tourism Research Australia data series is then used, after adjustment as outlined above, to estimate the impact on overnight tourism for the December quarter 2016 as a result of the road closure. The Parkes estimate is based on information supplied by the Local Authority.
The results are given in Table 5.
Table 5 Overnight tourism (domestic and international): Change in expenditure from road closure ($CVM million)
Region Accommodation Cafes and
restaurants Sport and
recreation Fuel Food
retailing Total
Bland (A) -0.47 -0.59 -0.15 -0.03 -0.31 -1.53
Cabonne (A) -0.83 -1.04 -0.27 -0.05 -0.55 -2.73
Cowra (A) -1.10 -1.39 -0.35 -0.06 -0.72 -3.63
Forbes (A) -0.93 -1.17 -0.30 -0.05 -0.61 -3.07
Parkes (A) -1.21 -1.51 -0.40 -0.07 -0.79 -3.99
Temora (A) 0.43 0.54 0.14 0.02 0.28 1.41
Weddin (A) -0.03 -0.04 -0.01 0.00 -0.02 -0.11
Other NSW 1.40 1.76 0.45 0.08 0.92 4.61
8. The loss of exports
Goods exports, whether international or domestic, are unlikely to involve a permanent loss of exports. In the worst case it can be stockpiled until an opportunity arises for delivery. The exception to this is where late delivery causes permanent production losses in downstream supply chains or at the very least permanent loss of sales for the late delivered product. This case is addressed in Section 10 below.
PJB1214 – The Newell Highway closure in 2016 from flooding: The direct and indirect effects 13 13 13 13
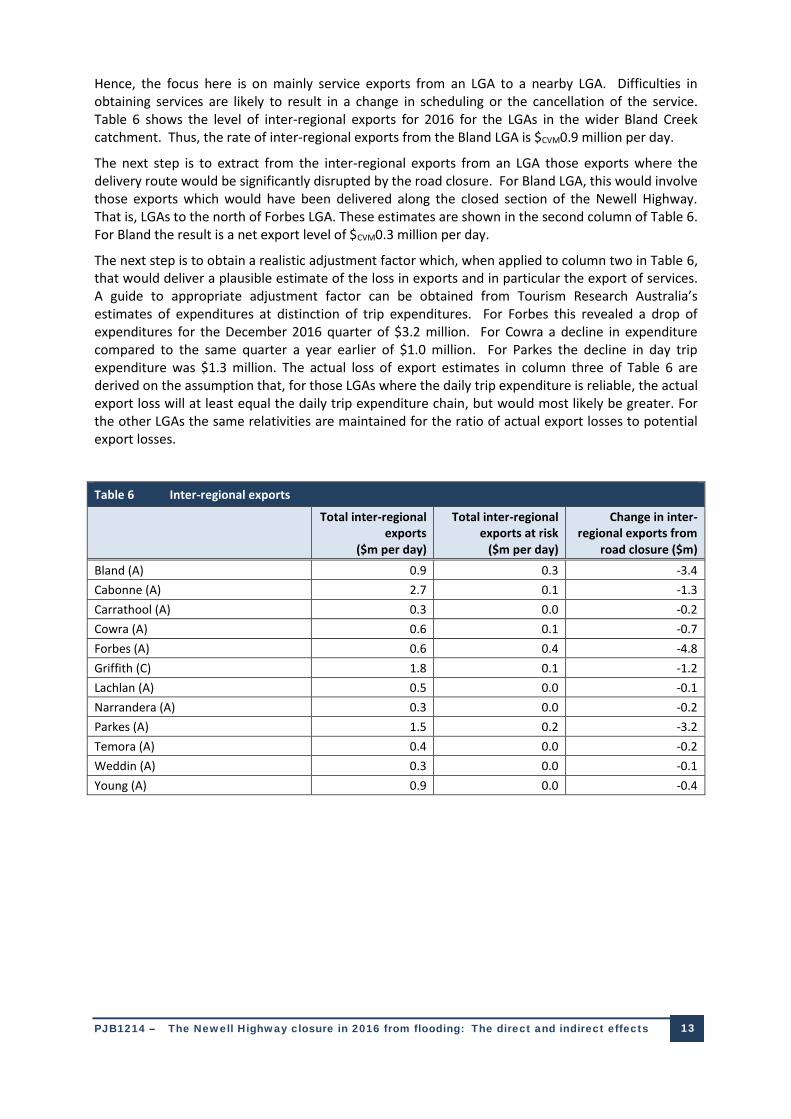
Hence, the focus here is on mainly service exports from an LGA to a nearby LGA. Difficulties in obtaining services are likely to result in a change in scheduling or the cancellation of the service. Table 6 shows the level of inter-regional exports for 2016 for the LGAs in the wider Bland Creek catchment. Thus, the rate of inter-regional exports from the Bland LGA is $CVM0.9 million per day.
The next step is to extract from the inter-regional exports from an LGA those exports where the delivery route would be significantly disrupted by the road closure. For Bland LGA, this would involve those exports which would have been delivered along the closed section of the Newell Highway. That is, LGAs to the north of Forbes LGA. These estimates are shown in the second column of Table 6. For Bland the result is a net export level of $CVM0.3 million per day.
The next step is to obtain a realistic adjustment factor which, when applied to column two in Table 6, that would deliver a plausible estimate of the loss in exports and in particular the export of services. A guide to appropriate adjustment factor can be obtained from Tourism Research Australia’s estimates of expenditures at distinction of trip expenditures. For Forbes this revealed a drop of expenditures for the December 2016 quarter of $3.2 million. For Cowra a decline in expenditure compared to the same quarter a year earlier of $1.0 million. For Parkes the decline in day trip expenditure was $1.3 million. The actual loss of export estimates in column three of Table 6 are derived on the assumption that, for those LGAs where the daily trip expenditure is reliable, the actual export loss will at least equal the daily trip expenditure chain, but would most likely be greater. For the other LGAs the same relativities are maintained for the ratio of actual export losses to potential export losses.
Table 6 Inter-regional exports
Total inter-regional exports
($m per day)
Total inter-regional exports at risk
($m per day)
Change in inter-regional exports from
road closure ($m)
Bland (A) 0.9 0.3 -3.4
Cabonne (A) 2.7 0.1 -1.3
Carrathool (A) 0.3 0.0 -0.2
Cowra (A) 0.6 0.1 -0.7
Forbes (A) 0.6 0.4 -4.8
Griffith (C) 1.8 0.1 -1.2
Lachlan (A) 0.5 0.0 -0.1
Narrandera (A) 0.3 0.0 -0.2
Parkes (A) 1.5 0.2 -3.2
Temora (A) 0.4 0.0 -0.2
Weddin (A) 0.3 0.0 -0.1
Young (A) 0.9 0.0 -0.4
PJB1214 – The Newell Highway closure in 2016 from flooding: The direct and indirect effects 14 14 14 14
9. The highway impact on agricultural costs
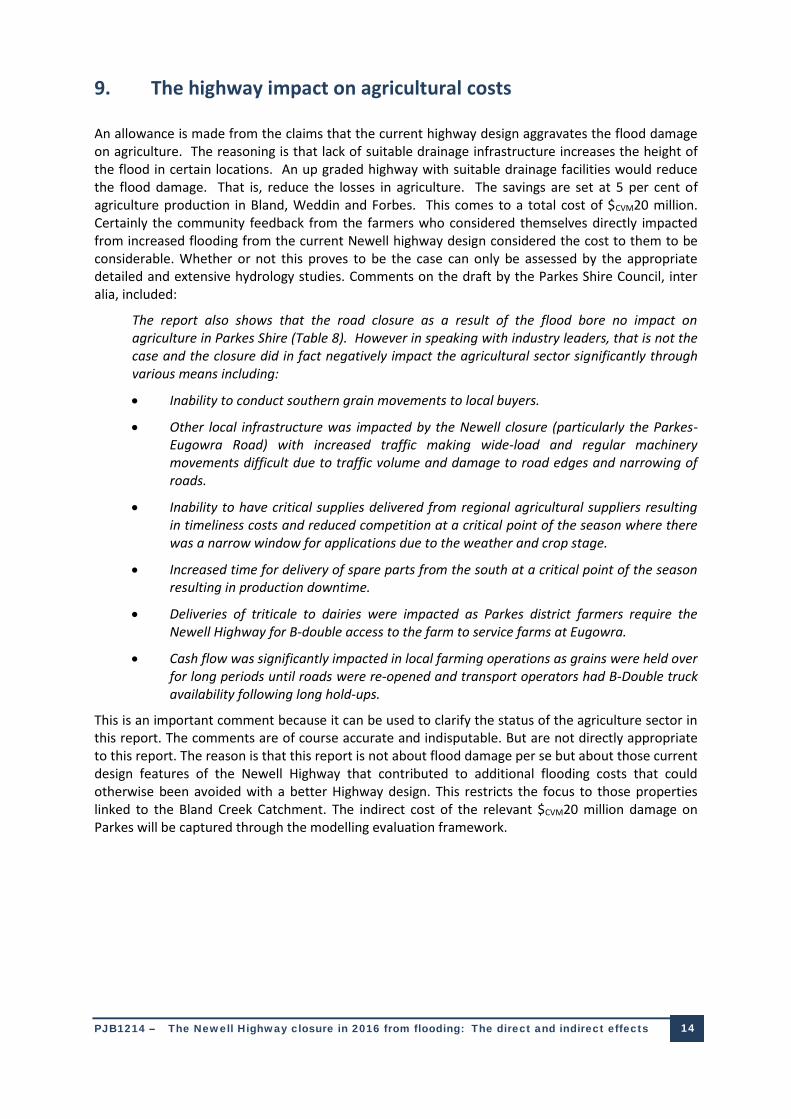
An allowance is made from the claims that the current highway design aggravates the flood damage on agriculture. The reasoning is that lack of suitable drainage infrastructure increases the height of the flood in certain locations. An up graded highway with suitable drainage facilities would reduce the flood damage. That is, reduce the losses in agriculture. The savings are set at 5 per cent of agriculture production in Bland, Weddin and Forbes. This comes to a total cost of $CVM20 million. Certainly the community feedback from the farmers who considered themselves directly impacted from increased flooding from the current Newell highway design considered the cost to them to be considerable. Whether or not this proves to be the case can only be assessed by the appropriate detailed and extensive hydrology studies. Comments on the draft by the Parkes Shire Council, inter alia, included:
The report also shows that the road closure as a result of the flood bore no impact on agriculture in Parkes Shire (Table 8). However in speaking with industry leaders, that is not the case and the closure did in fact negatively impact the agricultural sector significantly through various means including:
Inability to conduct southern grain movements to local buyers.
Other local infrastructure was impacted by the Newell closure (particularly the Parkes-Eugowra Road) with increased traffic making wide-load and regular machinerymovements difficult due to traffic volume and damage to road edges and narrowing ofroads.
Inability to have critical supplies delivered from regional agricultural suppliers resultingin timeliness costs and reduced competition at a critical point of the season where therewas a narrow window for applications due to the weather and crop stage.
Increased time for delivery of spare parts from the south at a critical point of the seasonresulting in production downtime.
Deliveries of triticale to dairies were impacted as Parkes district farmers require theNewell Highway for B-double access to the farm to service farms at Eugowra.
Cash flow was significantly impacted in local farming operations as grains were held overfor long periods until roads were re-opened and transport operators had B-Double truckavailability following long hold-ups.
This is an important comment because it can be used to clarify the status of the agriculture sector in this report. The comments are of course accurate and indisputable. But are not directly appropriate to this report. The reason is that this report is not about flood damage per se but about those current design features of the Newell Highway that contributed to additional flooding costs that could otherwise been avoided with a better Highway design. This restricts the focus to those properties linked to the Bland Creek Catchment. The indirect cost of the relevant $CVM20 million damage on Parkes will be captured through the modelling evaluation framework.
PJB1214 – The Newell Highway closure in 2016 from flooding: The direct and indirect effects 15 15 15 15
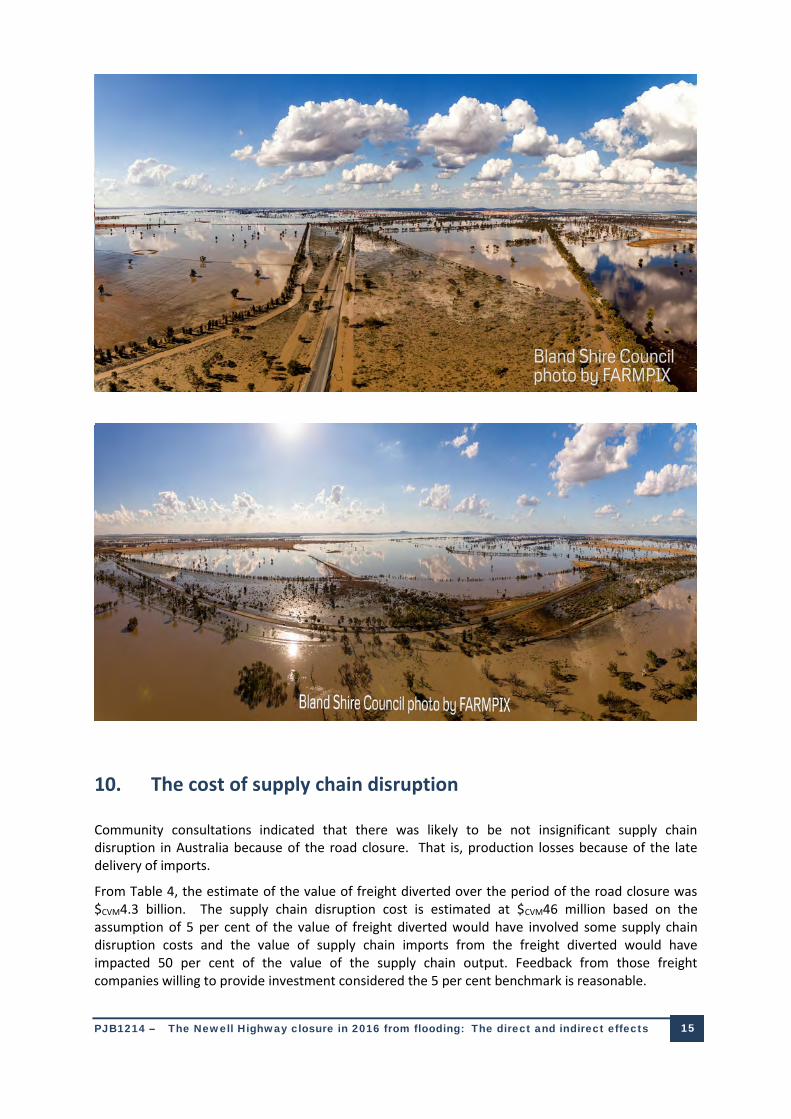
10. The cost of supply chain disruption
Community consultations indicated that there was likely to be not insignificant supply chain disruption in Australia because of the road closure. That is, production losses because of the late delivery of imports.
From Table 4, the estimate of the value of freight diverted over the period of the road closure was $CVM4.3 billion. The supply chain disruption cost is estimated at $CVM46 million based on the assumption of 5 per cent of the value of freight diverted would have involved some supply chain disruption costs and the value of supply chain imports from the freight diverted would have impacted 50 per cent of the value of the supply chain output. Feedback from those freight companies willing to provide investment considered the 5 per cent benchmark is reasonable.
PJB1214 – The Newell Highway closure in 2016 from flooding: The direct and indirect effects 16 16 16 16
11. The modelling framework
In order to access the impact of the direct costs on the economy of the road closure a regional econometric model is required. This modelling framework is based on NIEIR’s Local Government Area (LGA) based inter-regional input-output model of the Australian economy. Each of the 567 LGAs has its own input-output sub-model at the 86 industry 2-digit level. The industries are defined in the attached table. Each industry in a given LGA is linked to the same industry in any other LGA by a 567 by 567 inter-regional trade flow matrix.
Previous multiplier analysis using the model used behavioural functions in the model for household consumption expenditures, hours demanded, etc. This study imposes the structure of the economy as prevailing exactly at 2016 on the model so that the multiplier results are closer to the “pure” textbook input-output inter-regional multipliers. That is, the following parameter settings are imposed on the model for 2016:
(i) the prevailing consumption to disposable income ratio by LGA;
(ii) consumption expenditure share at 2-digit ANZSIC industry by LGA;
(iii) hours demanded per $m of output by 2-digit ANZSIC industry by LGA;
(iv) employment in numbers demanded for 1,000 hours worked by 2-digit ANZSIC industry by LGA;
(v) $/hour by 2-digit ANZSIC industry by LGA;
(vi) International imports per $m of demand by 2-digit ANZSIC industry by LGA; and
(vii) The inter-regional trade flow matrix fixed at average 2015 values by 2-digit industries by 567 LGAs.
The data base has been updated to the September quarter 2016. With a further partial update to March quarter 2017 for the 2017-18 NIEIR/ALGA “State of the Regions” report of June 2018.
12. The flow-on macroeconomic implications
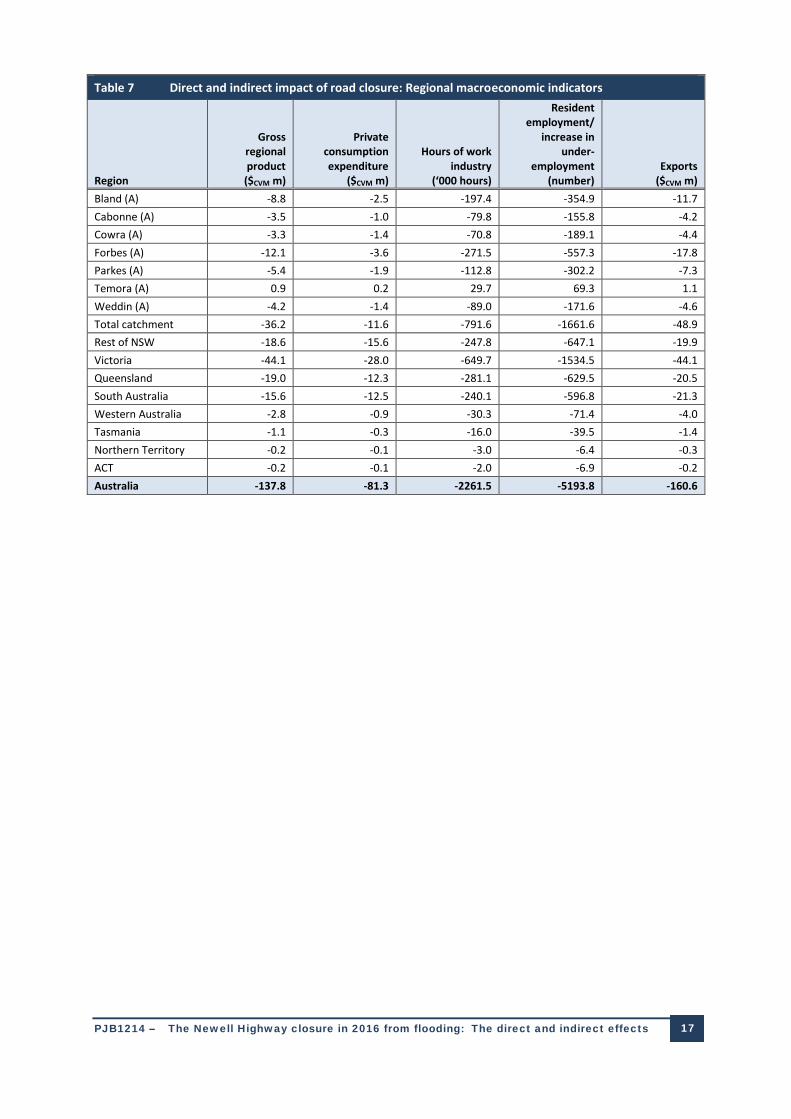
Using the modelling framework outlined above, Table 7 shows the impact on the regional economic aggregates with a national loss in gross product of $CVM138 million. In the main the employment loss would represent under-employment rather than outright loss of employment.
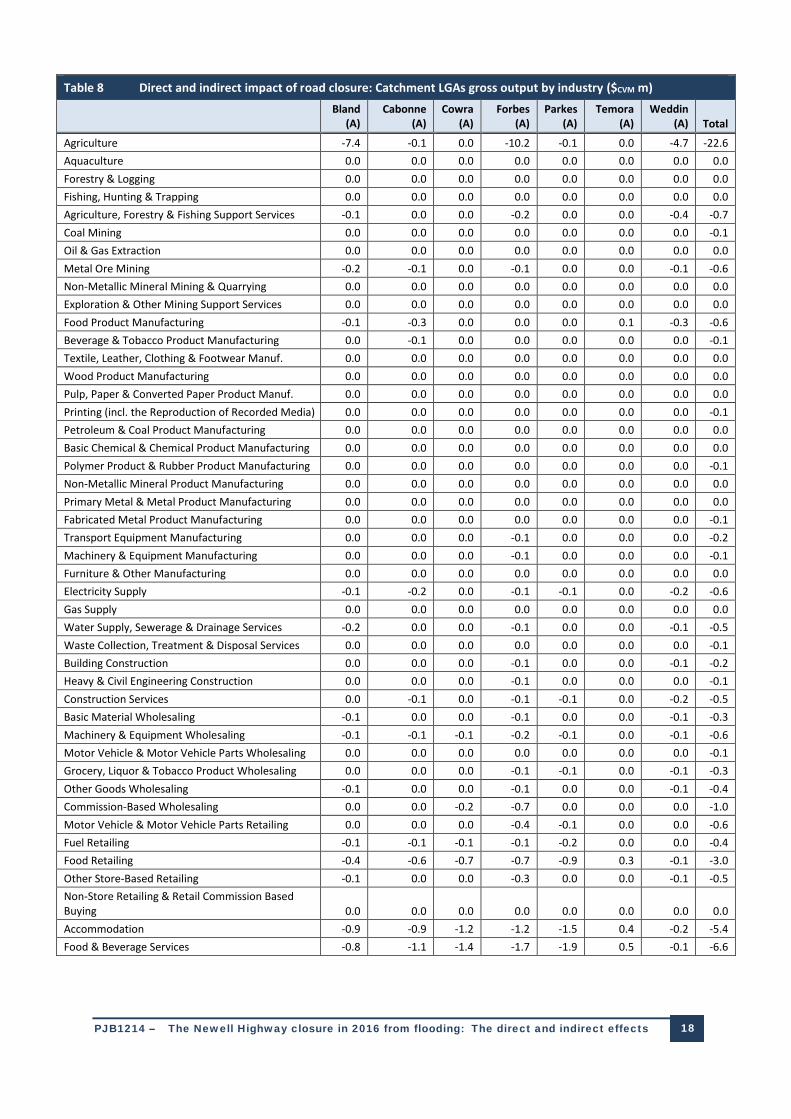
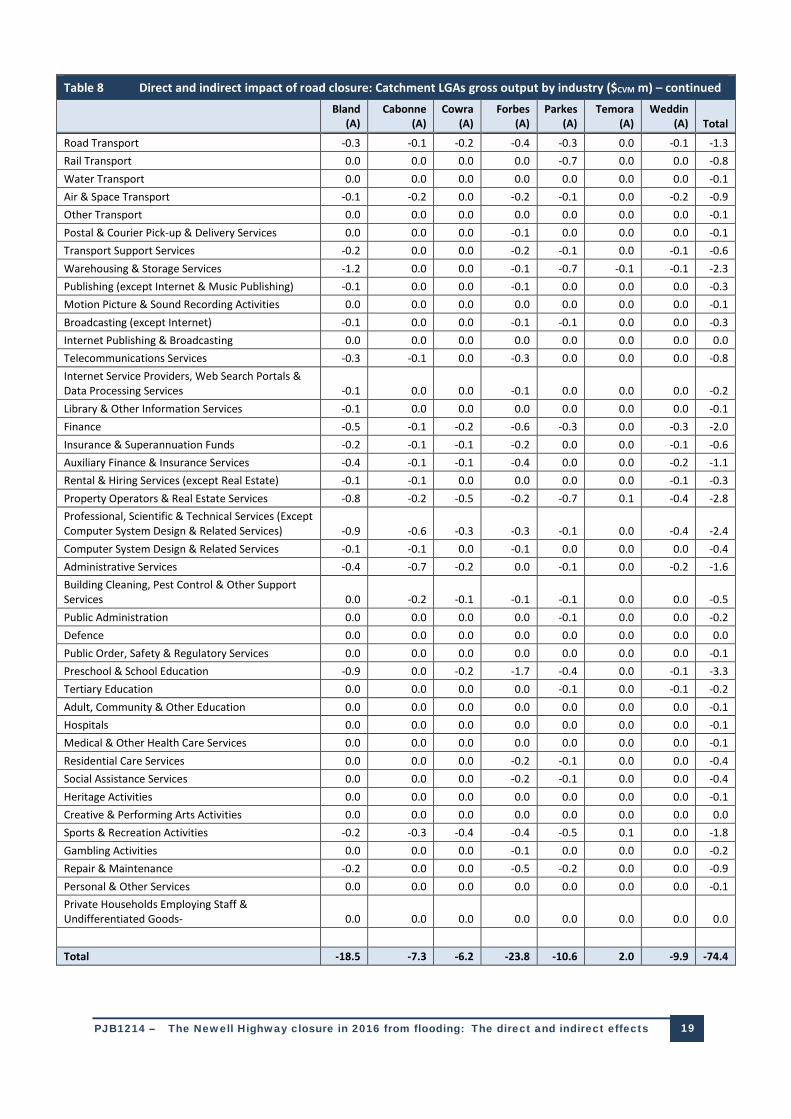
Table 8 shows the impact on industry output at the 2-digit ANZSIC level for the narrow Bland Creek Catchment LGAs. The total loss of the value of production is $CVM74 million. However, this estimate includes double counting with the net cost measured by the decline in gross regional product of $CVM36 million.
The degree of uncertainty will vary across the various cost segments. Some are “hard”, that is, have a small degree of uncertainty, while for others it would take considerable cost to finalise estimates. In this context, the costs that have been left out, in order to compensate for the degree of uncertainty surrounding some of the costs which have been included, should be noted. These include:
(i) the disruption to intra LGA economic activity has not been fully captured in the costs;
(ii) the costs of the Newell Highway repair, which would be avoided if the Highway was upgraded; and
(iii) the disruption to regional freight routes because of limits on heavy truck usage on alternative routes and, therefore, the fact that freight had to be either cancelled or delayed.
PJB1214 – The Newell Highway closure in 2016 from flooding: The direct and indirect effects 17 17 17 17
Table 7 Direct and indirect impact of road closure: Regional macroeconomic indicators
Region
Gross regional product
($CVM m)
Private consumption expenditure
($CVM m)
Hours of work industry
(‘000 hours)
Resident employment/
increase in under-
employment (number)
Exports ($CVM m)
Bland (A) -8.8 -2.5 -197.4 -354.9 -11.7
Cabonne (A) -3.5 -1.0 -79.8 -155.8 -4.2
Cowra (A) -3.3 -1.4 -70.8 -189.1 -4.4
Forbes (A) -12.1 -3.6 -271.5 -557.3 -17.8
Parkes (A) -5.4 -1.9 -112.8 -302.2 -7.3
Temora (A) 0.9 0.2 29.7 69.3 1.1
Weddin (A) -4.2 -1.4 -89.0 -171.6 -4.6
Total catchment -36.2 -11.6 -791.6 -1661.6 -48.9
Rest of NSW -18.6 -15.6 -247.8 -647.1 -19.9
Victoria -44.1 -28.0 -649.7 -1534.5 -44.1
Queensland -19.0 -12.3 -281.1 -629.5 -20.5
South Australia -15.6 -12.5 -240.1 -596.8 -21.3
Western Australia -2.8 -0.9 -30.3 -71.4 -4.0
Tasmania -1.1 -0.3 -16.0 -39.5 -1.4
Northern Territory -0.2 -0.1 -3.0 -6.4 -0.3
ACT -0.2 -0.1 -2.0 -6.9 -0.2
Australia -137.8 -81.3 -2261.5 -5193.8 -160.6
PJB1214 – The Newell Highway closure in 2016 from flooding: The direct and indirect effects 18 18 18 18
Table 8 Direct and indirect impact of road closure: Catchment LGAs gross output by industry ($CVM m)
Bland (A)
Cabonne (A)
Cowra (A)
Forbes (A)
Parkes (A)
Temora (A)
Weddin (A) Total
Agriculture -7.4 -0.1 0.0 -10.2 -0.1 0.0 -4.7 -22.6
Aquaculture 0.0 0.0 0.0 0.0 0.0 0.0 0.0 0.0
Forestry & Logging 0.0 0.0 0.0 0.0 0.0 0.0 0.0 0.0
Fishing, Hunting & Trapping 0.0 0.0 0.0 0.0 0.0 0.0 0.0 0.0
Agriculture, Forestry & Fishing Support Services -0.1 0.0 0.0 -0.2 0.0 0.0 -0.4 -0.7
Coal Mining 0.0 0.0 0.0 0.0 0.0 0.0 0.0 -0.1
Oil & Gas Extraction 0.0 0.0 0.0 0.0 0.0 0.0 0.0 0.0
Metal Ore Mining -0.2 -0.1 0.0 -0.1 0.0 0.0 -0.1 -0.6
Non-Metallic Mineral Mining & Quarrying 0.0 0.0 0.0 0.0 0.0 0.0 0.0 0.0
Exploration & Other Mining Support Services 0.0 0.0 0.0 0.0 0.0 0.0 0.0 0.0
Food Product Manufacturing -0.1 -0.3 0.0 0.0 0.0 0.1 -0.3 -0.6
Beverage & Tobacco Product Manufacturing 0.0 -0.1 0.0 0.0 0.0 0.0 0.0 -0.1
Textile, Leather, Clothing & Footwear Manuf. 0.0 0.0 0.0 0.0 0.0 0.0 0.0 0.0
Wood Product Manufacturing 0.0 0.0 0.0 0.0 0.0 0.0 0.0 0.0
Pulp, Paper & Converted Paper Product Manuf. 0.0 0.0 0.0 0.0 0.0 0.0 0.0 0.0
Printing (incl. the Reproduction of Recorded Media) 0.0 0.0 0.0 0.0 0.0 0.0 0.0 -0.1
Petroleum & Coal Product Manufacturing 0.0 0.0 0.0 0.0 0.0 0.0 0.0 0.0
Basic Chemical & Chemical Product Manufacturing 0.0 0.0 0.0 0.0 0.0 0.0 0.0 0.0
Polymer Product & Rubber Product Manufacturing 0.0 0.0 0.0 0.0 0.0 0.0 0.0 -0.1
Non-Metallic Mineral Product Manufacturing 0.0 0.0 0.0 0.0 0.0 0.0 0.0 0.0
Primary Metal & Metal Product Manufacturing 0.0 0.0 0.0 0.0 0.0 0.0 0.0 0.0
Fabricated Metal Product Manufacturing 0.0 0.0 0.0 0.0 0.0 0.0 0.0 -0.1
Transport Equipment Manufacturing 0.0 0.0 0.0 -0.1 0.0 0.0 0.0 -0.2
Machinery & Equipment Manufacturing 0.0 0.0 0.0 -0.1 0.0 0.0 0.0 -0.1
Furniture & Other Manufacturing 0.0 0.0 0.0 0.0 0.0 0.0 0.0 0.0
Electricity Supply -0.1 -0.2 0.0 -0.1 -0.1 0.0 -0.2 -0.6
Gas Supply 0.0 0.0 0.0 0.0 0.0 0.0 0.0 0.0
Water Supply, Sewerage & Drainage Services -0.2 0.0 0.0 -0.1 0.0 0.0 -0.1 -0.5
Waste Collection, Treatment & Disposal Services 0.0 0.0 0.0 0.0 0.0 0.0 0.0 -0.1
Building Construction 0.0 0.0 0.0 -0.1 0.0 0.0 -0.1 -0.2
Heavy & Civil Engineering Construction 0.0 0.0 0.0 -0.1 0.0 0.0 0.0 -0.1
Construction Services 0.0 -0.1 0.0 -0.1 -0.1 0.0 -0.2 -0.5
Basic Material Wholesaling -0.1 0.0 0.0 -0.1 0.0 0.0 -0.1 -0.3
Machinery & Equipment Wholesaling -0.1 -0.1 -0.1 -0.2 -0.1 0.0 -0.1 -0.6
Motor Vehicle & Motor Vehicle Parts Wholesaling 0.0 0.0 0.0 0.0 0.0 0.0 0.0 -0.1
Grocery, Liquor & Tobacco Product Wholesaling 0.0 0.0 0.0 -0.1 -0.1 0.0 -0.1 -0.3
Other Goods Wholesaling -0.1 0.0 0.0 -0.1 0.0 0.0 -0.1 -0.4
Commission-Based Wholesaling 0.0 0.0 -0.2 -0.7 0.0 0.0 0.0 -1.0
Motor Vehicle & Motor Vehicle Parts Retailing 0.0 0.0 0.0 -0.4 -0.1 0.0 0.0 -0.6
Fuel Retailing -0.1 -0.1 -0.1 -0.1 -0.2 0.0 0.0 -0.4
Food Retailing -0.4 -0.6 -0.7 -0.7 -0.9 0.3 -0.1 -3.0
Other Store-Based Retailing -0.1 0.0 0.0 -0.3 0.0 0.0 -0.1 -0.5
Non-Store Retailing & Retail Commission Based Buying 0.0 0.0 0.0 0.0 0.0 0.0 0.0 0.0
Accommodation -0.9 -0.9 -1.2 -1.2 -1.5 0.4 -0.2 -5.4
Food & Beverage Services -0.8 -1.1 -1.4 -1.7 -1.9 0.5 -0.1 -6.6
PJB1214 – The Newell Highway closure in 2016 from flooding: The direct and indirect effects 19 19 19 19
Table 8 Direct and indirect impact of road closure: Catchment LGAs gross output by industry ($CVM m) – continued
Bland (A)
Cabonne (A)
Cowra (A)
Forbes (A)
Parkes (A)
Temora (A)
Weddin (A) Total
Road Transport -0.3 -0.1 -0.2 -0.4 -0.3 0.0 -0.1 -1.3
Rail Transport 0.0 0.0 0.0 0.0 -0.7 0.0 0.0 -0.8
Water Transport 0.0 0.0 0.0 0.0 0.0 0.0 0.0 -0.1
Air & Space Transport -0.1 -0.2 0.0 -0.2 -0.1 0.0 -0.2 -0.9
Other Transport 0.0 0.0 0.0 0.0 0.0 0.0 0.0 -0.1
Postal & Courier Pick-up & Delivery Services 0.0 0.0 0.0 -0.1 0.0 0.0 0.0 -0.1
Transport Support Services -0.2 0.0 0.0 -0.2 -0.1 0.0 -0.1 -0.6
Warehousing & Storage Services -1.2 0.0 0.0 -0.1 -0.7 -0.1 -0.1 -2.3
Publishing (except Internet & Music Publishing) -0.1 0.0 0.0 -0.1 0.0 0.0 0.0 -0.3
Motion Picture & Sound Recording Activities 0.0 0.0 0.0 0.0 0.0 0.0 0.0 -0.1
Broadcasting (except Internet) -0.1 0.0 0.0 -0.1 -0.1 0.0 0.0 -0.3
Internet Publishing & Broadcasting 0.0 0.0 0.0 0.0 0.0 0.0 0.0 0.0
Telecommunications Services -0.3 -0.1 0.0 -0.3 0.0 0.0 0.0 -0.8
Internet Service Providers, Web Search Portals & Data Processing Services -0.1 0.0 0.0 -0.1 0.0 0.0 0.0 -0.2
Library & Other Information Services -0.1 0.0 0.0 0.0 0.0 0.0 0.0 -0.1
Finance -0.5 -0.1 -0.2 -0.6 -0.3 0.0 -0.3 -2.0
Insurance & Superannuation Funds -0.2 -0.1 -0.1 -0.2 0.0 0.0 -0.1 -0.6
Auxiliary Finance & Insurance Services -0.4 -0.1 -0.1 -0.4 0.0 0.0 -0.2 -1.1
Rental & Hiring Services (except Real Estate) -0.1 -0.1 0.0 0.0 0.0 0.0 -0.1 -0.3
Property Operators & Real Estate Services -0.8 -0.2 -0.5 -0.2 -0.7 0.1 -0.4 -2.8
Professional, Scientific & Technical Services (Except Computer System Design & Related Services) -0.9 -0.6 -0.3 -0.3 -0.1 0.0 -0.4 -2.4
Computer System Design & Related Services -0.1 -0.1 0.0 -0.1 0.0 0.0 0.0 -0.4
Administrative Services -0.4 -0.7 -0.2 0.0 -0.1 0.0 -0.2 -1.6
Building Cleaning, Pest Control & Other Support Services 0.0 -0.2 -0.1 -0.1 -0.1 0.0 0.0 -0.5
Public Administration 0.0 0.0 0.0 0.0 -0.1 0.0 0.0 -0.2
Defence 0.0 0.0 0.0 0.0 0.0 0.0 0.0 0.0
Public Order, Safety & Regulatory Services 0.0 0.0 0.0 0.0 0.0 0.0 0.0 -0.1
Preschool & School Education -0.9 0.0 -0.2 -1.7 -0.4 0.0 -0.1 -3.3
Tertiary Education 0.0 0.0 0.0 0.0 -0.1 0.0 -0.1 -0.2
Adult, Community & Other Education 0.0 0.0 0.0 0.0 0.0 0.0 0.0 -0.1
Hospitals 0.0 0.0 0.0 0.0 0.0 0.0 0.0 -0.1
Medical & Other Health Care Services 0.0 0.0 0.0 0.0 0.0 0.0 0.0 -0.1
Residential Care Services 0.0 0.0 0.0 -0.2 -0.1 0.0 0.0 -0.4
Social Assistance Services 0.0 0.0 0.0 -0.2 -0.1 0.0 0.0 -0.4
Heritage Activities 0.0 0.0 0.0 0.0 0.0 0.0 0.0 -0.1
Creative & Performing Arts Activities 0.0 0.0 0.0 0.0 0.0 0.0 0.0 0.0
Sports & Recreation Activities -0.2 -0.3 -0.4 -0.4 -0.5 0.1 0.0 -1.8
Gambling Activities 0.0 0.0 0.0 -0.1 0.0 0.0 0.0 -0.2
Repair & Maintenance -0.2 0.0 0.0 -0.5 -0.2 0.0 0.0 -0.9
Personal & Other Services 0.0 0.0 0.0 0.0 0.0 0.0 0.0 -0.1
Private Households Employing Staff & Undifferentiated Goods- 0.0 0.0 0.0 0.0 0.0 0.0 0.0 0.0
Total -18.5 -7.3 -6.2 -23.8 -10.6 2.0 -9.9 -74.4
PJB1214 – The Newell Highway closure in 2016 from flooding: The direct and indirect effects 20 20 20 20
13. Newell Highway closure: Unaccounted costs
No account has been taken of intra LGA costs of the Newell highway closure. That is the cost to local businesses and residents of the inability of local workers to reach their places of employment or local residents to reach local businesses in terms retail and service expenditures. This is likely to impose a significant conservative estimate to the costs of the flooding event. The impact of intra LGAs and accessing normal services such as doctors, dentists, chemists, family and friends and emergency services. In addition the inter LGA export estimate appear conservative compared to the community feedback.
Accordingly an additional $15m has been included as a contingency cost bring the total direct and indirect cost to $CVM0.153 billion
14. Newell Highway closure: Preliminary cost benefit
Cost benefit analysis of the level of Newell Highway upgrade costs to avoid or mitigate the impact of flooding that can be justified will be carried out by those best equipped for this task. However, some high level benefit numbers can be readily obtained from this analysis.
On the assumption that:
(i) climate change results in a 1 in 20 year flood becoming a 1 in 15 year flood;
(ii) on average every seven years there are minor flood events occurring to at half the cost of the 2016 event; and
(iii) the growth in Newell Highway heavy vehicle traffic equals the real discount rate.
Then on the assumption that over a 50 years of the life of a Newell Highway upgrade that rendered the road flood-proof the discount net economic benefit would sum to five times the 2016 national economic costs, or $CVM0.8 billion. The next step would be to commission the Bureau of Meteorology to endorse or change these assumptions.
The next step in relation to validating or changing these costs would be for the appropriate transport authorities to estimate the impact of the proposed inland rail you route between Brisbane and Melbourne in terms of mitigating the costs of the closure of the Newell highway from future flood events.
However the most important next step would be to commission a study of what can be done to mitigate flooding damage generally in the Bland Creek catchment and how much the capital cost of these strategies would in effect also involve flood proofing the Newell highway. If future flood proofing of the region could be justified on economic grounds and a significant element of that was the upgrading of the Newell Highway then the benefits assessed in this report (less the flood damage costs) in cost-benefit terms would only have to be compared to the additional costs of flood proofing the Newell highway. That is those costs over and above the capital cost of changing the Newell highway design to mitigate regional flood damage costs.
The Newell Highway has been flooded and or closed between West Wyalong and Forbes in 1950, 1952, 1956, 1962, 1974, 1983, 1990 for twelve weeks, and 2012 and in 2016 for six weeks.
It could well prove that these costs are relatively small compared to the benefits (that is avoided costs) assessed for the national impact of avoiding Newell Highway closure from future flood events.
PJB1214 – The Newell Highway closure in 2016 from flooding: The direct and indirect effects 21 21 21 21