Embed Size (px)
Citation preview
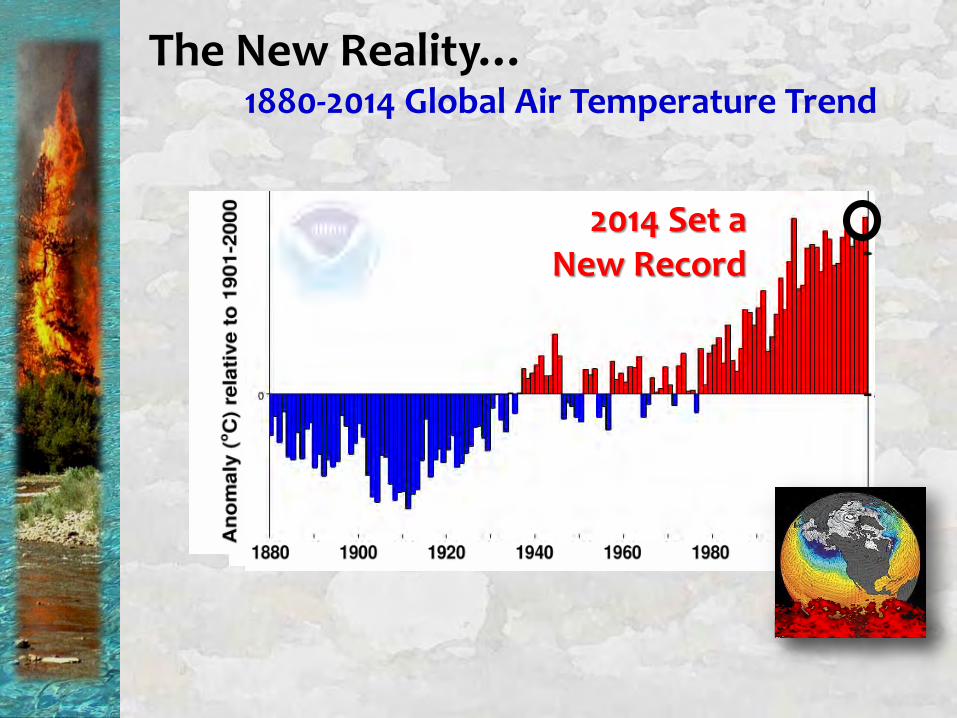
The New Reality…1880-2014 Global Air Temperature Trend
2014 Set a New Record
The New Reality…1880-2014 Global Air Temperature Trend
2014 Set a New Record
2015Another bad new record!
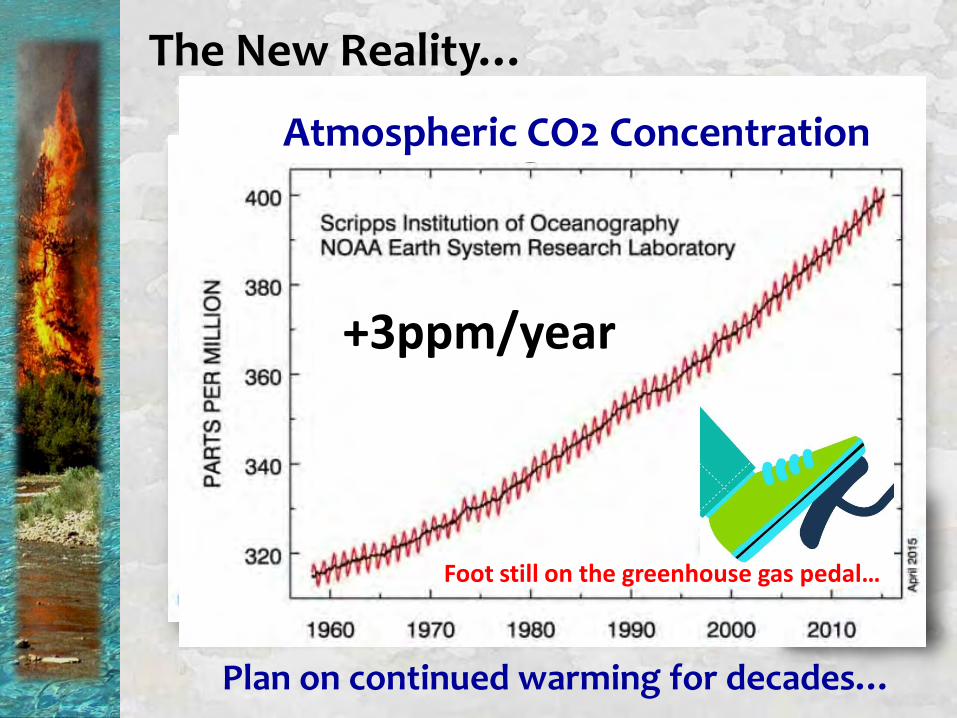
Plan on continued warming for decades…
+3ppm/year
Atmospheric CO2 Concentration
Foot still on the greenhouse gas pedal…
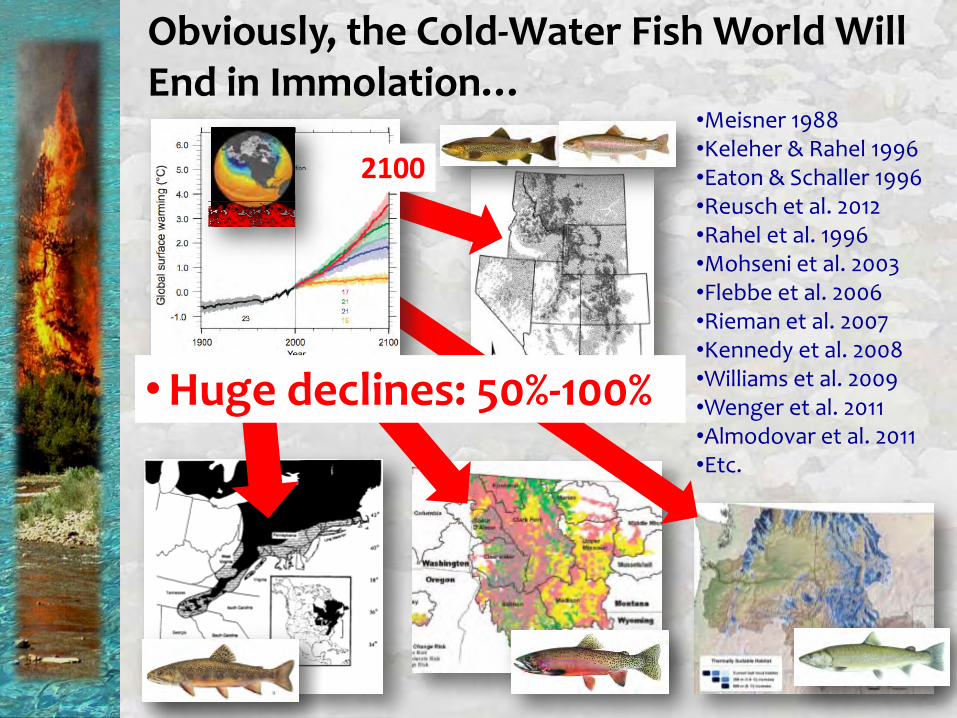
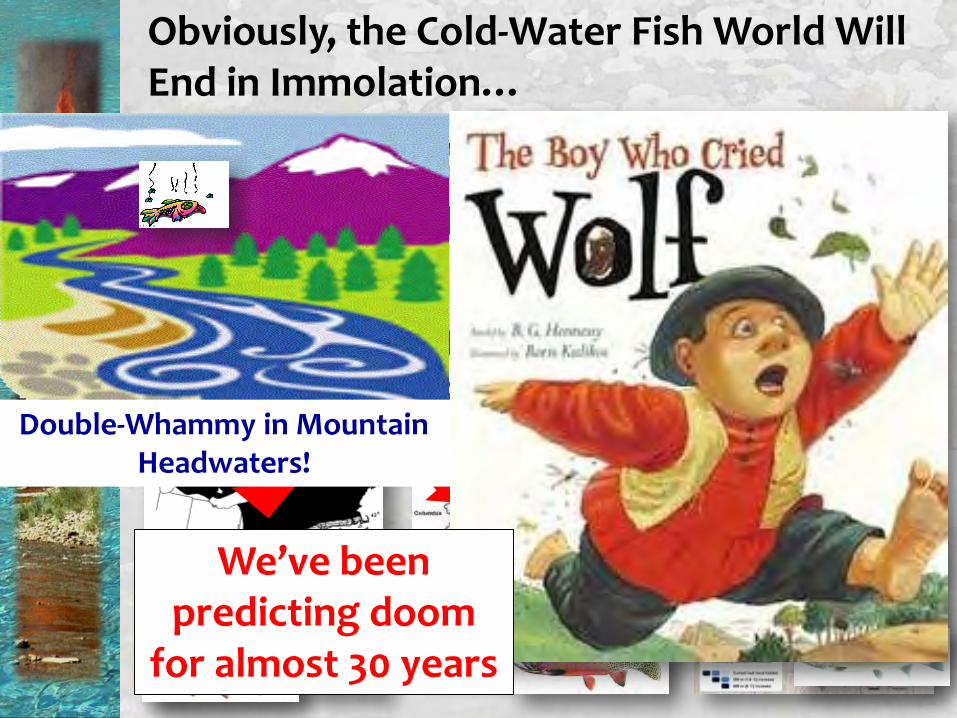
Obviously, the Cold-Water Fish World Will End in Immolation…
•Meisner 1988•Keleher & Rahel 1996•Eaton & Schaller 1996•Reusch et al. 2012•Rahel et al. 1996•Mohseni et al. 2003•Flebbe et al. 2006•Rieman et al. 2007•Kennedy et al. 2008•Williams et al. 2009•Wenger et al. 2011•Almodovar et al. 2011•Etc.
• Huge declines: 50%-100%
2100
We’ve been predicting doom
for almost 30 years
Double-Whammy in Mountain Headwaters!
If it’s steep, it slows the creep…
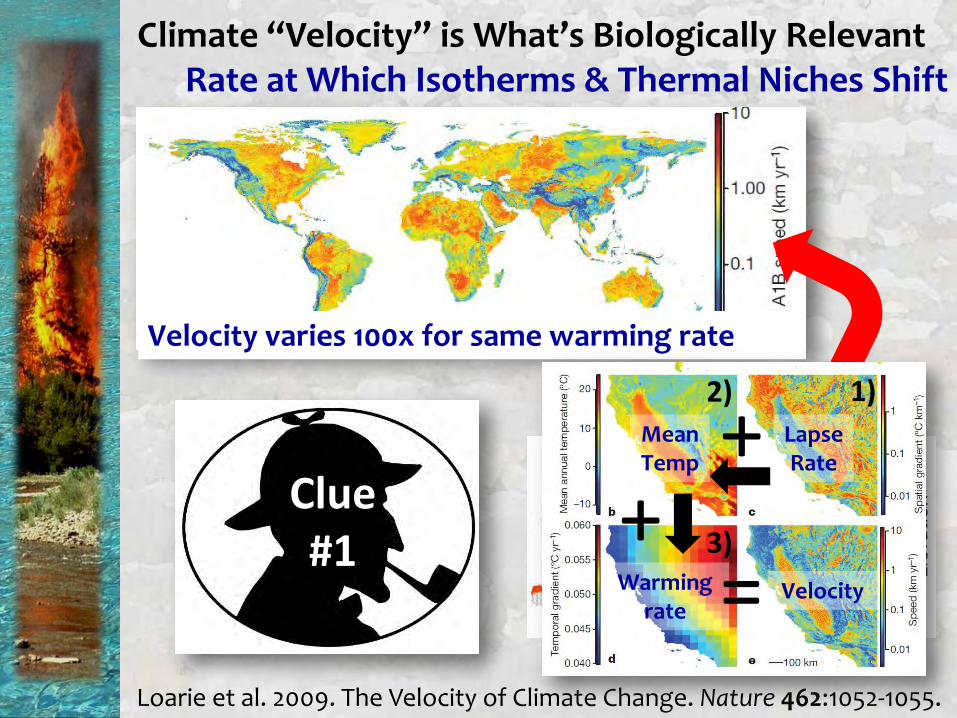
Climate “Velocity” is What’s Biologically RelevantRate at Which Isotherms & Thermal Niches Shift
Velocity varies 100x for same warming rate
Loarie et al. 2009. The Velocity of Climate Change. Nature 462:1052-1055.
Clue#1
++
Mean Temp
Lapse Rate
Warming rate
Velocity=
1)2)
3)
edge boundary/rate it’s shifting
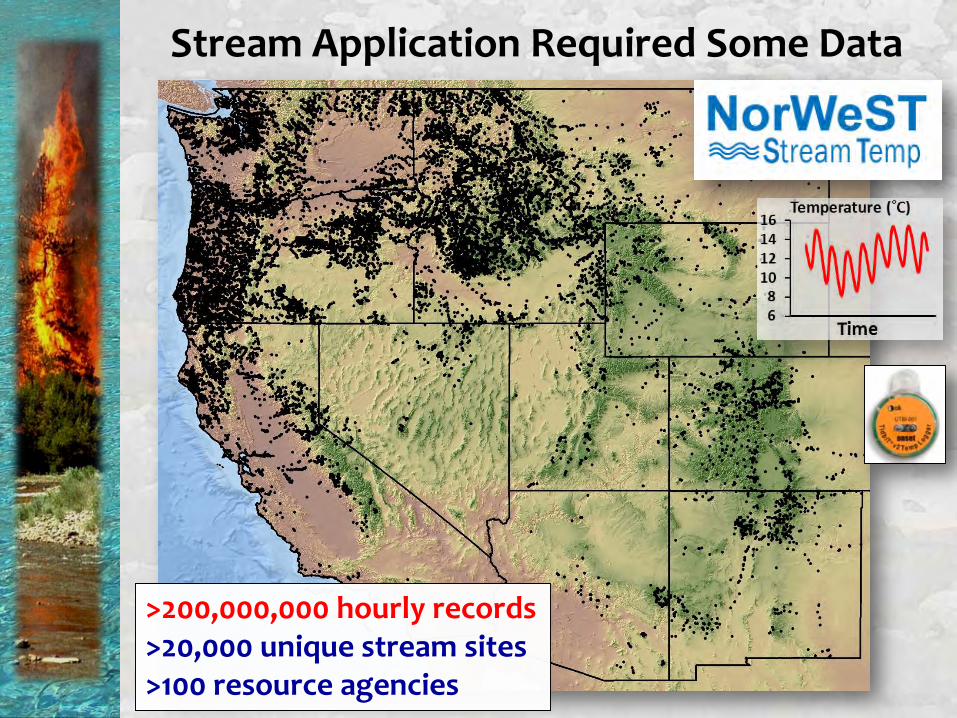
>200,000,000 hourly records>20,000 unique stream sites>100 resource agencies
Stream Application Required Some Data
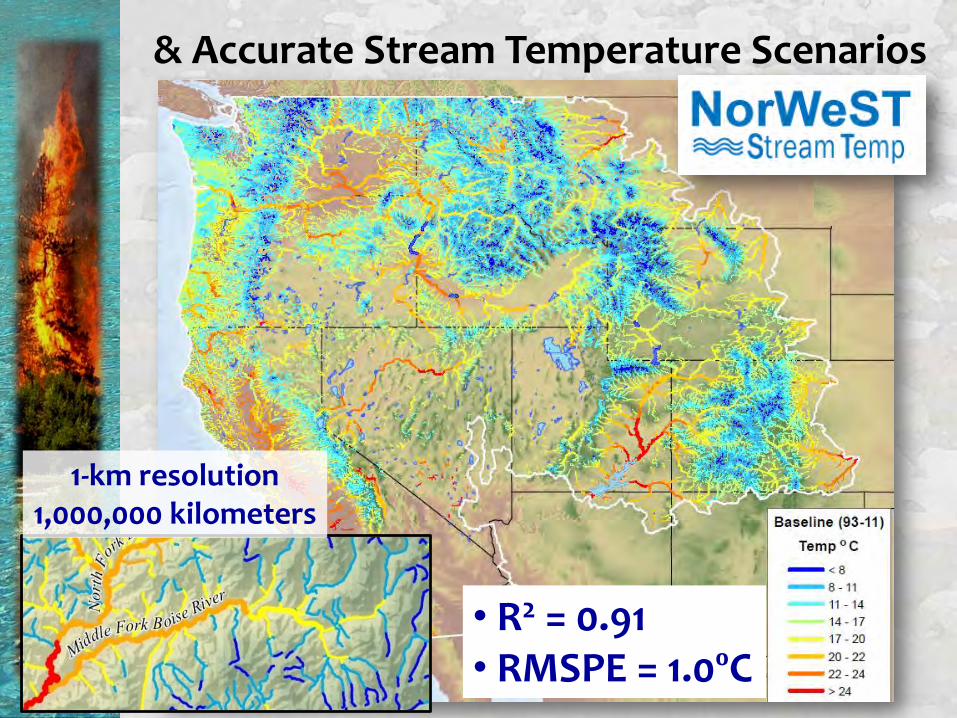
& Accurate Stream Temperature Scenarios
• R2 = 0.91• RMSPE = 1.0ºC
1-km resolution1,000,000 kilometers
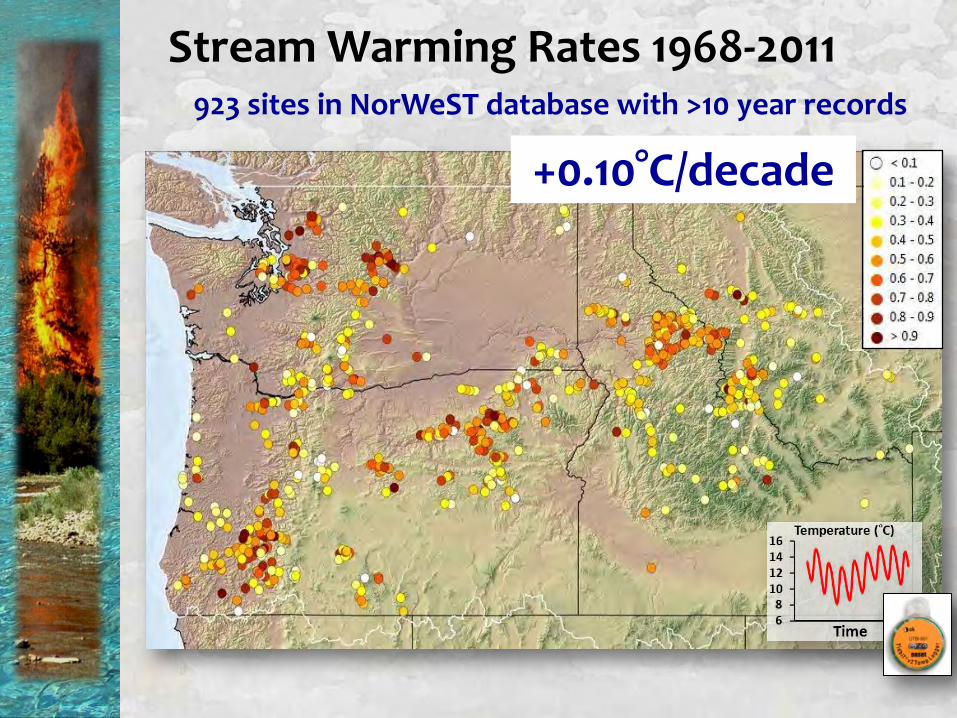
923 sites in NorWeST database with >10 year records
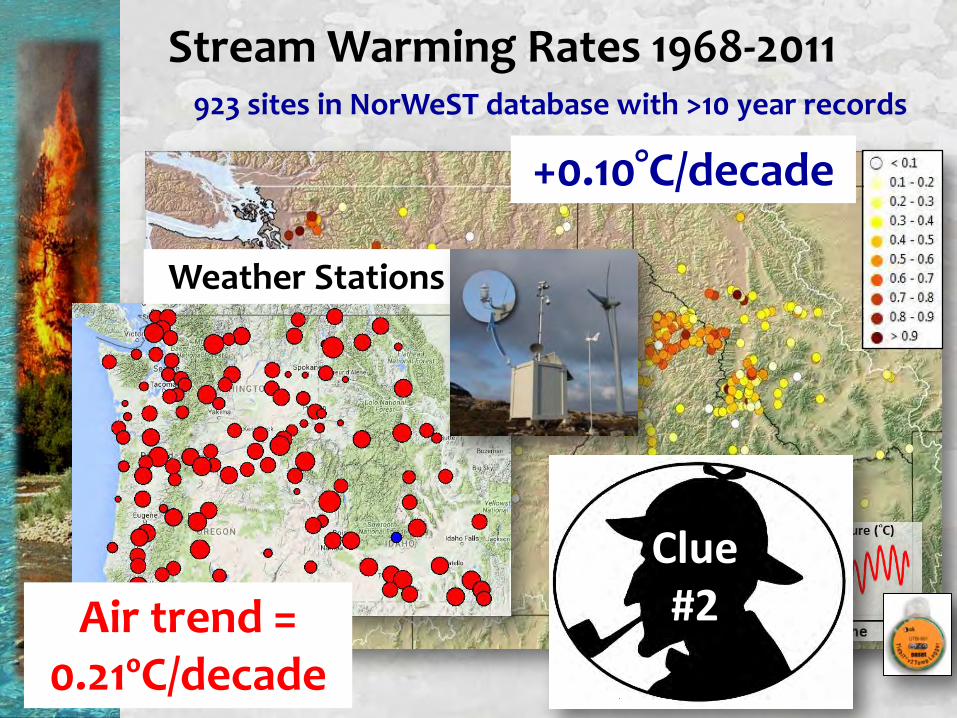
Stream Warming Rates 1968-2011
+0.10°C/decade
923 sites in NorWeST database with >10 year records
Stream Warming Rates 1968-2011
+0.10°C/decade
Air trend = 0.21ºC/decade
Weather Stations
Clue#2
0.1
0.2
0.4
0.8
1.6
3.2
6.4
12.8
25.6
51.2
102.4
204.8
409.6
0.1 0.2 0.4 0.8 1.6 3.2 6.4 12.8
Clim
ate
ve
loci
ty (
km/d
eca
de
)
Stream slope (%)
+0.1 C/decade
+0.2 C/decade
+0.3 C/decade
+0.4 C/decade
+0.5 C/decade
(y = 3.75x-1)
(y = 5.00x-1)
(y = 6.25x-1)
(y = 2.50x-1)
(y = 1.25x-1)
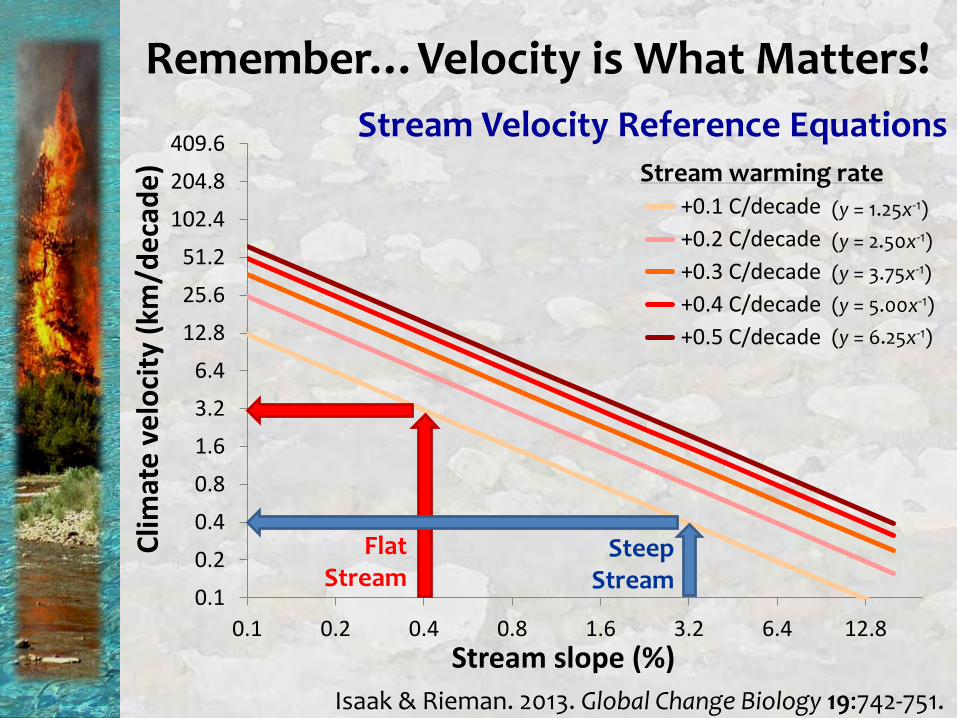
Stream Velocity Reference Equations
Steep Stream
Flat Stream
Stream warming rate
Isaak & Rieman. 2013. Global Change Biology 19:742-751.
Remember…Velocity is What Matters!
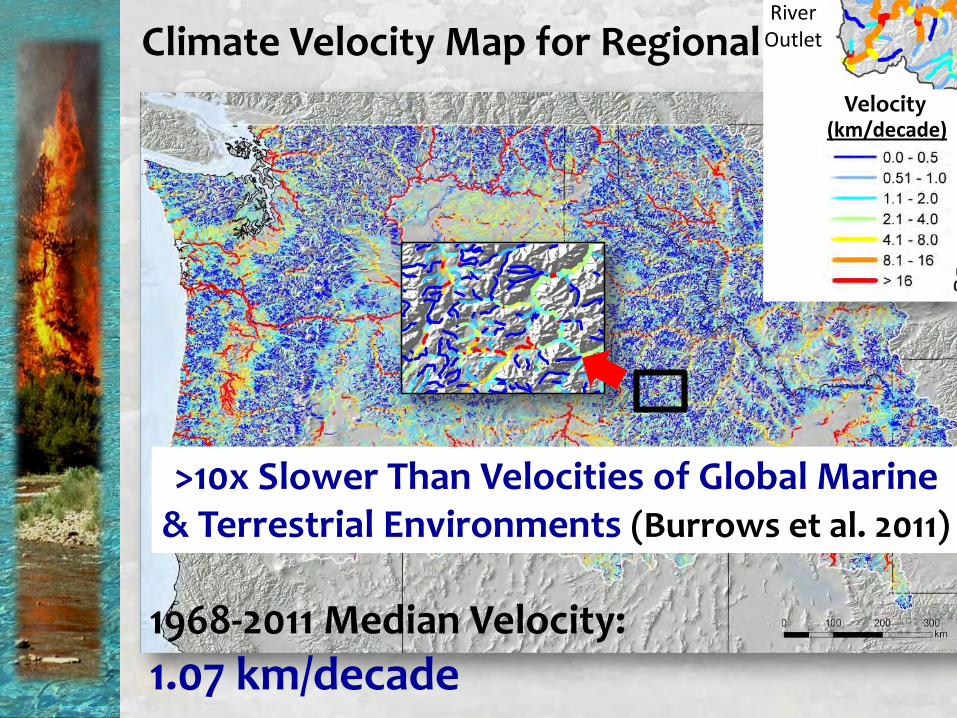
Climate Velocity Map for Regional Network
1968-2011 Median Velocity:
1.07 km/decade
>10x Slower Than Velocities of Global Marine & Terrestrial Environments (Burrows et al. 2011)
ISR (km/decade)
River Outlet
0
500
1000
1500
0.5 1 2 4 8 16 > 16ISR Category
Stre
am s
ites
Velocity
Isaak 2016. Slow climate velocities of mountain streams. PNAS 113:4374-4380.
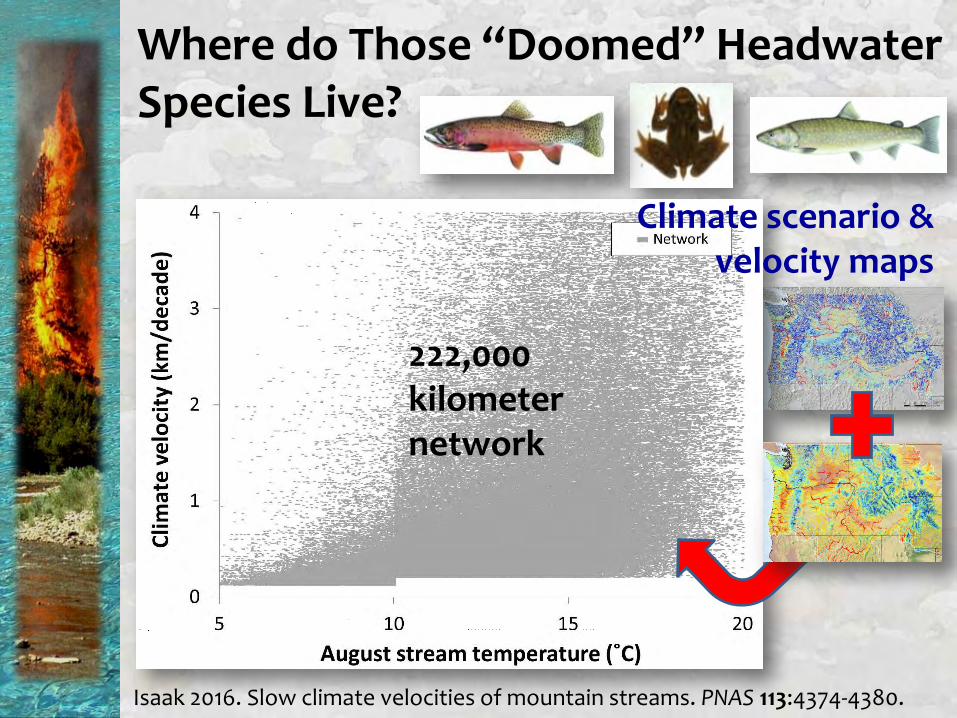
Where do Those “Doomed” Headwater Species Live?
Climate scenario & velocity maps
222,000 kilometer network
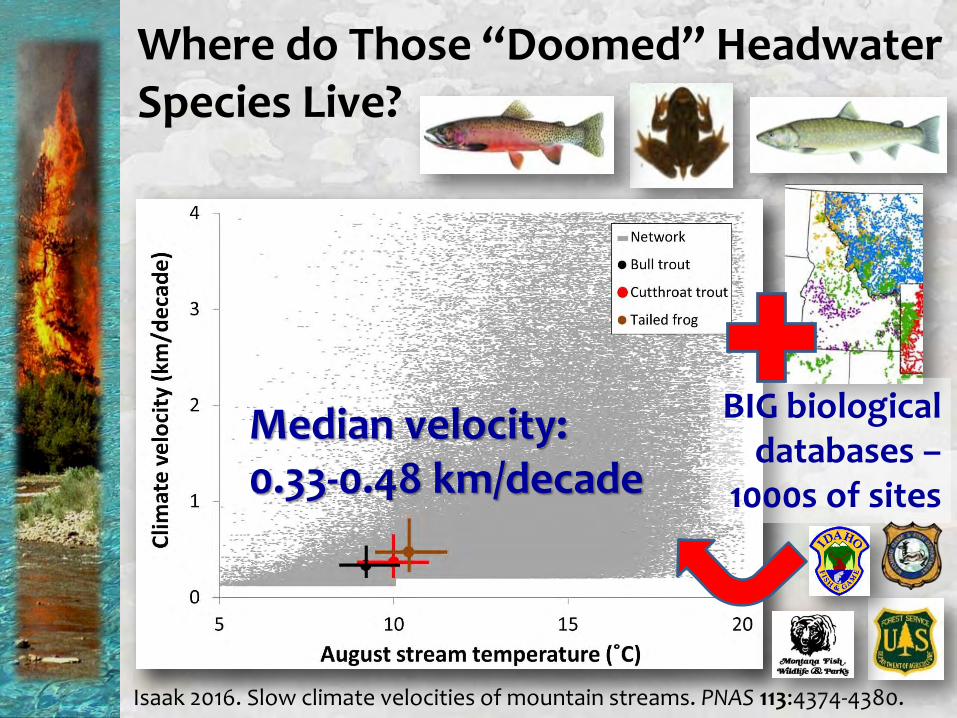
Isaak 2016. Slow climate velocities of mountain streams. PNAS 113:4374-4380.
Where do Those “Doomed” Headwater Species Live?
BIG biological databases –
1000s of sites
Median velocity: 0.33-0.48 km/decade
0
0.1
0.2
0.3
7 8 9 10 11 12 13 14 15 16
Pro
po
rtio
n o
f si
tes
spe
cie
s o
bse
rve
d
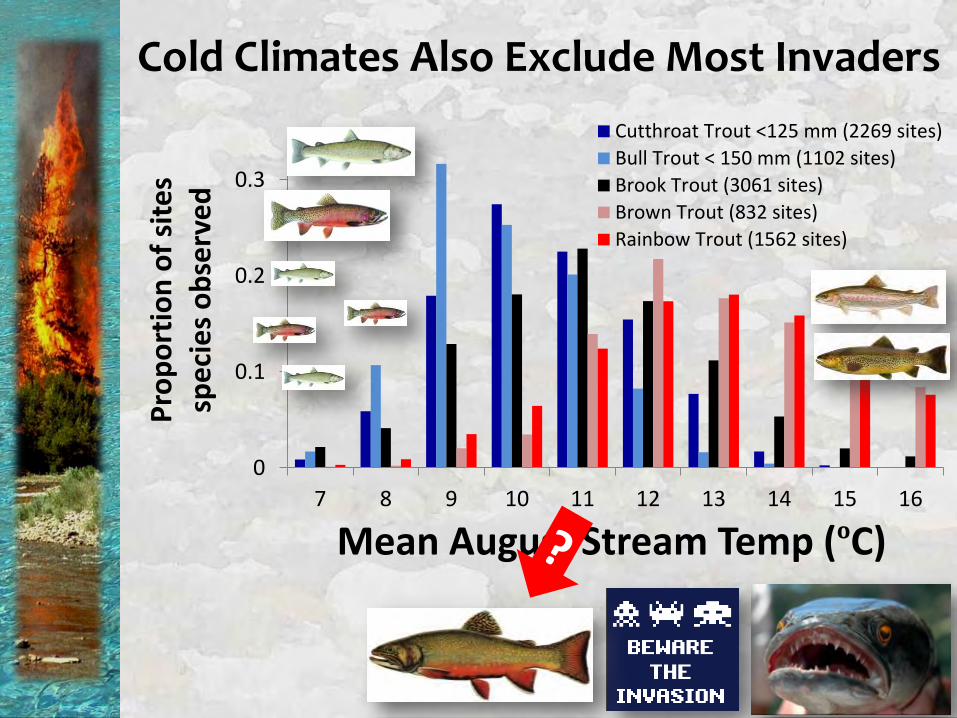
Cutthroat Trout <125 mm (2269 sites)
Bull Trout < 150 mm (1102 sites)
Brook Trout (3061 sites)
Brown Trout (832 sites)
Rainbow Trout (1562 sites)
Mean August Stream Temp (ºC)
Cold Climates Also Exclude Most Invaders
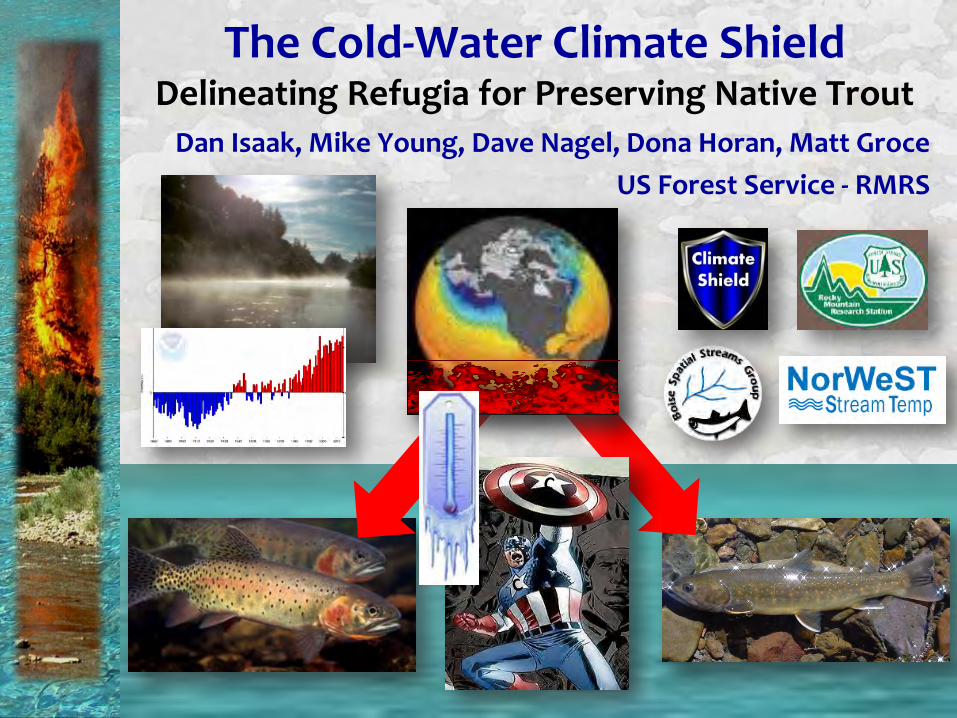
Dan Isaak, Mike Young, Dave Nagel, Dona Horan, Matt Groce
US Forest Service - RMRS
The Cold-Water Climate ShieldDelineating Refugia for Preserving Native Trout
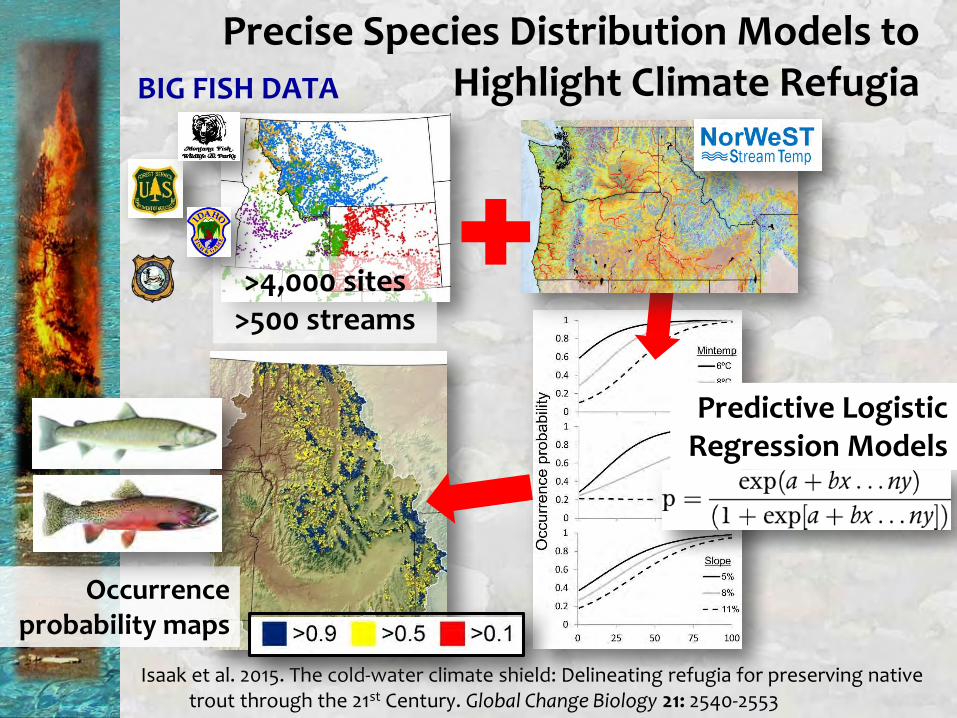
Precise Species Distribution Models to Highlight Climate RefugiaBIG FISH DATA
>4,000 sites>500 streams
Isaak et al. 2015. The cold-water climate shield: Delineating refugia for preserving native trout through the 21st Century. Global Change Biology 21: 2540-2553
Occurrence probability maps
Predictive Logistic Regression Models
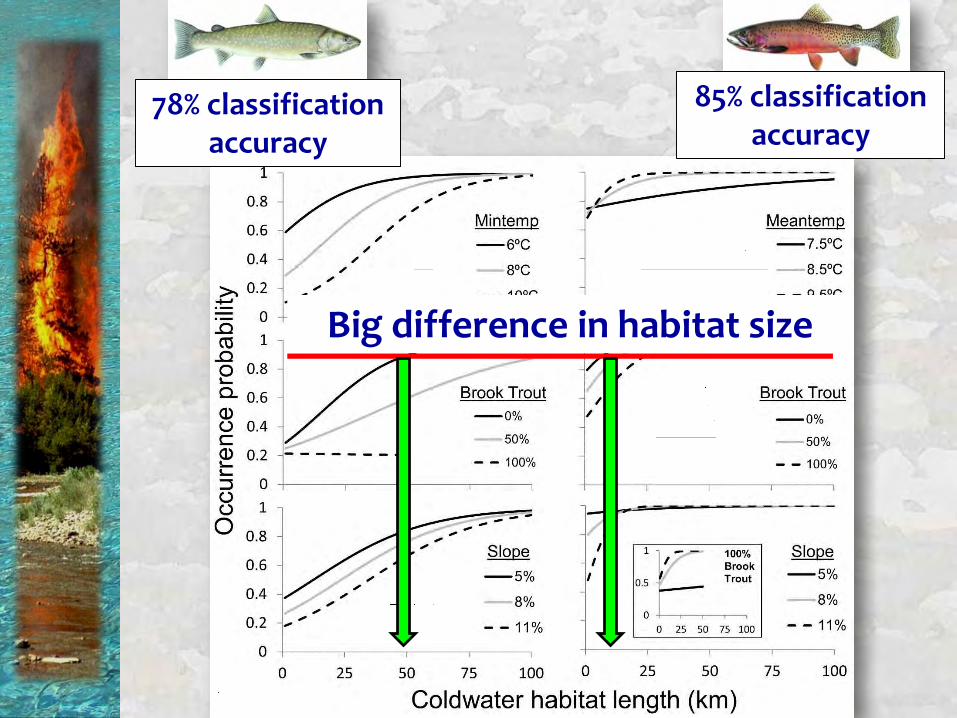
Big difference in habitat size
78% classification accuracy
85% classification accuracy
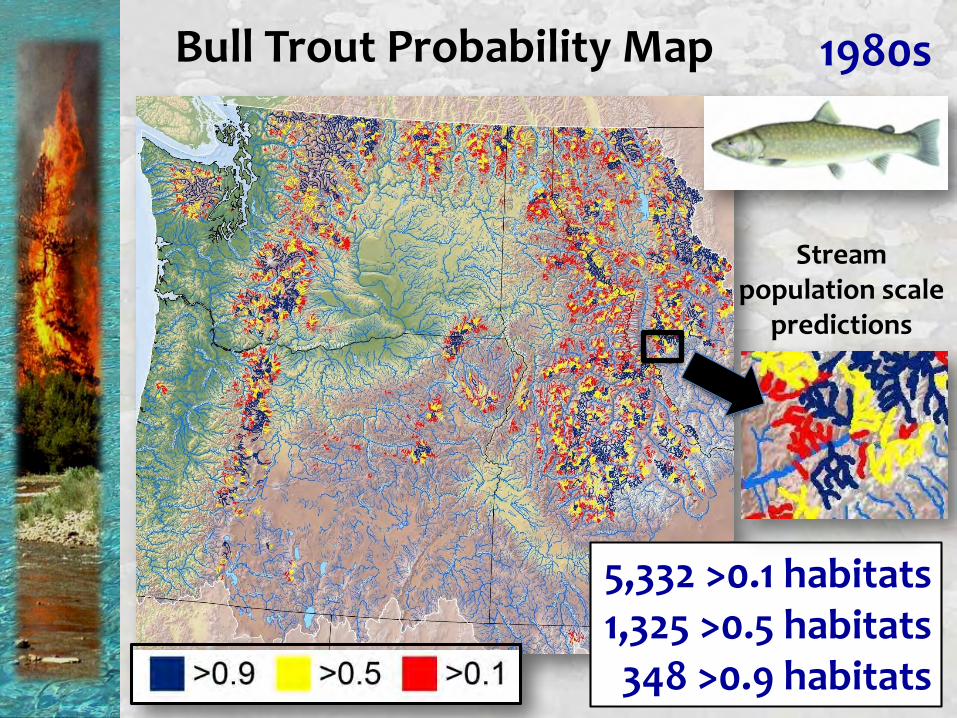
Bull Trout Probability Map
5,332 >0.1 habitats1,325 >0.5 habitats348 >0.9 habitats
1980s
Stream population scale
predictions
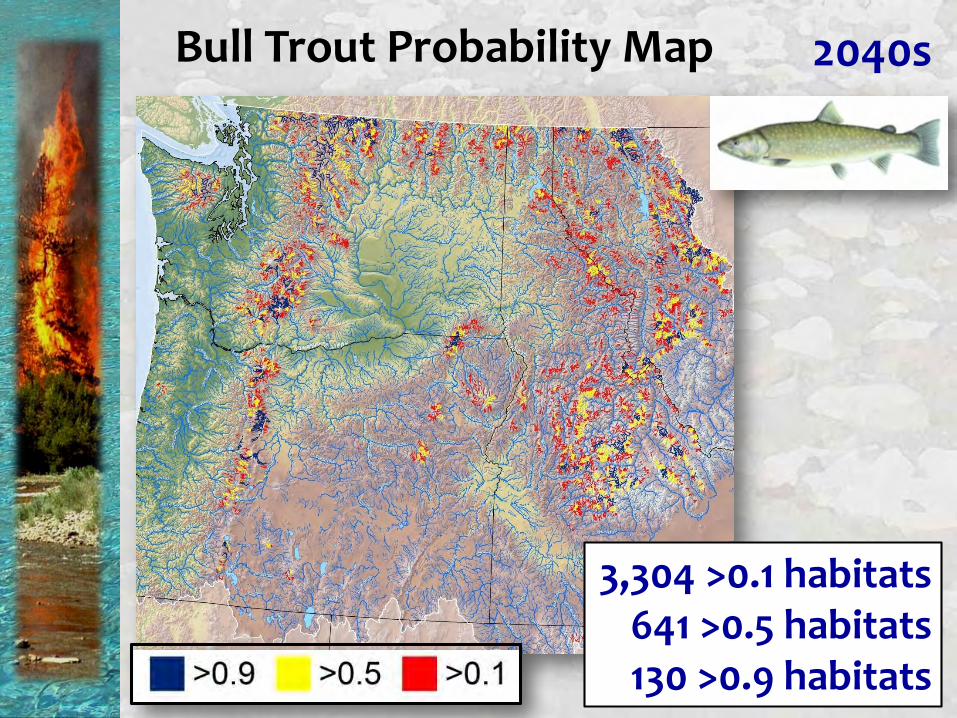
Bull Trout Probability Map
3,304 >0.1 habitats641 >0.5 habitats130 >0.9 habitats
2040s
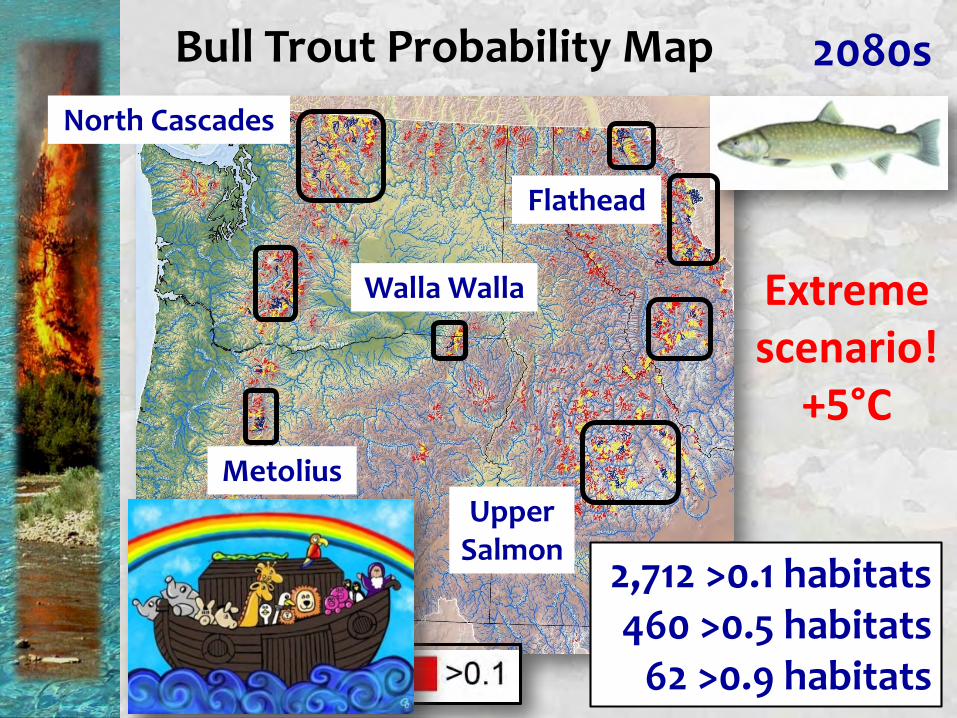
Bull Trout Probability Map
2,712 >0.1 habitats460 >0.5 habitats
62 >0.9 habitats
Metolius
Walla Walla
Flathead
Upper Salmon
North Cascades
2080s
Extreme scenario!
+5°C
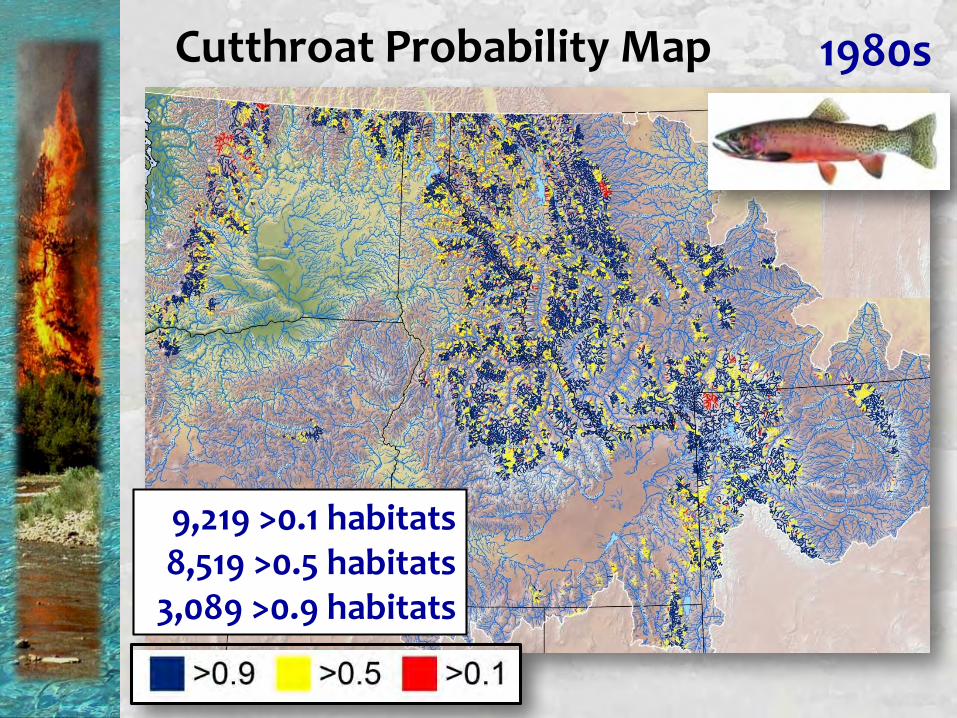
Cutthroat Probability Map 1980s
9,219 >0.1 habitats8,519 >0.5 habitats
3,089 >0.9 habitats
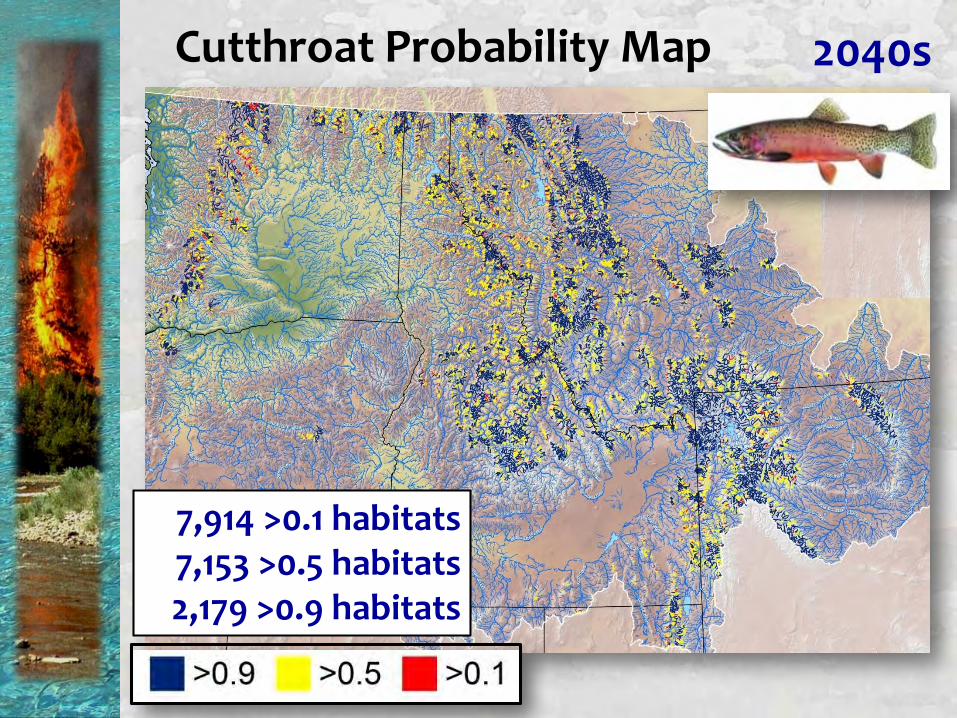
Cutthroat Probability Map 2040s
7,914 >0.1 habitats7,153 >0.5 habitats2,179 >0.9 habitats
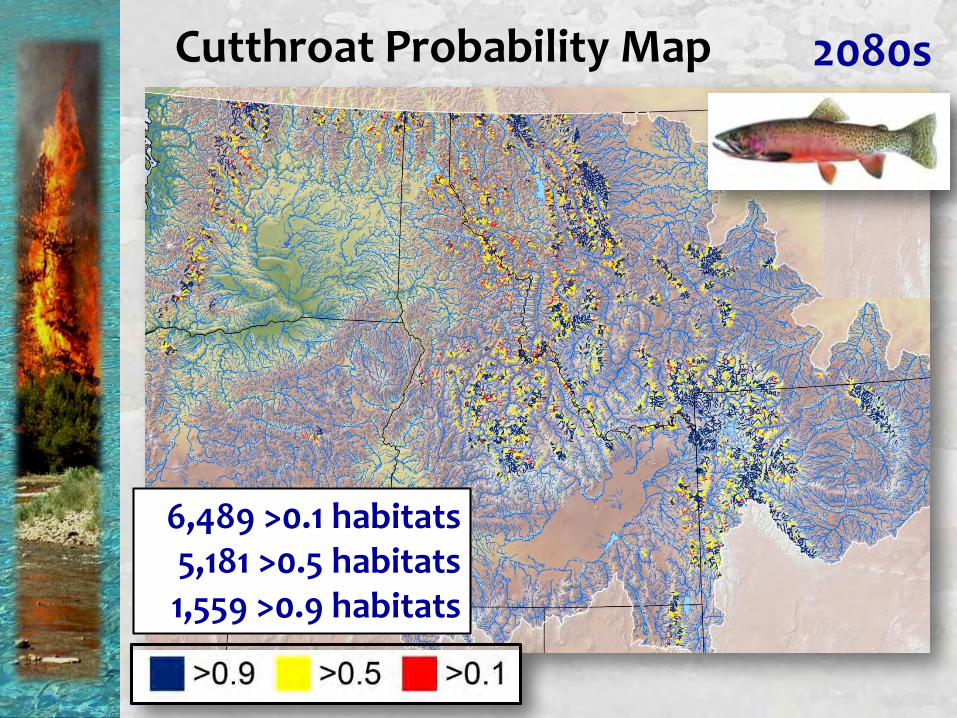
Cutthroat Probability Map 2080s
6,489 >0.1 habitats5,181 >0.5 habitats1,559 >0.9 habitats
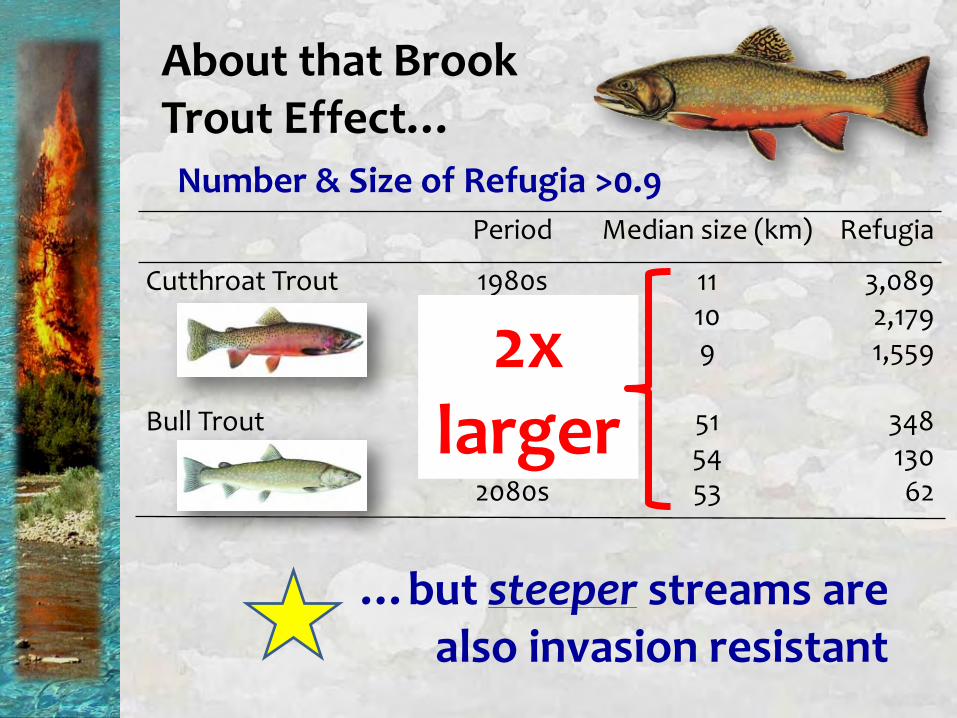
Period Median size (km) Refugia
Cutthroat Trout 1980s 11 3,0892040s 10 2,1792080s 9 1,559
Bull Trout 1980s 51 3482040s 54 1302080s 53 62
About that Brook Trout Effect…Number & Size of Refugia >0.9
…but steeper streams arealso invasion resistant
2x larger
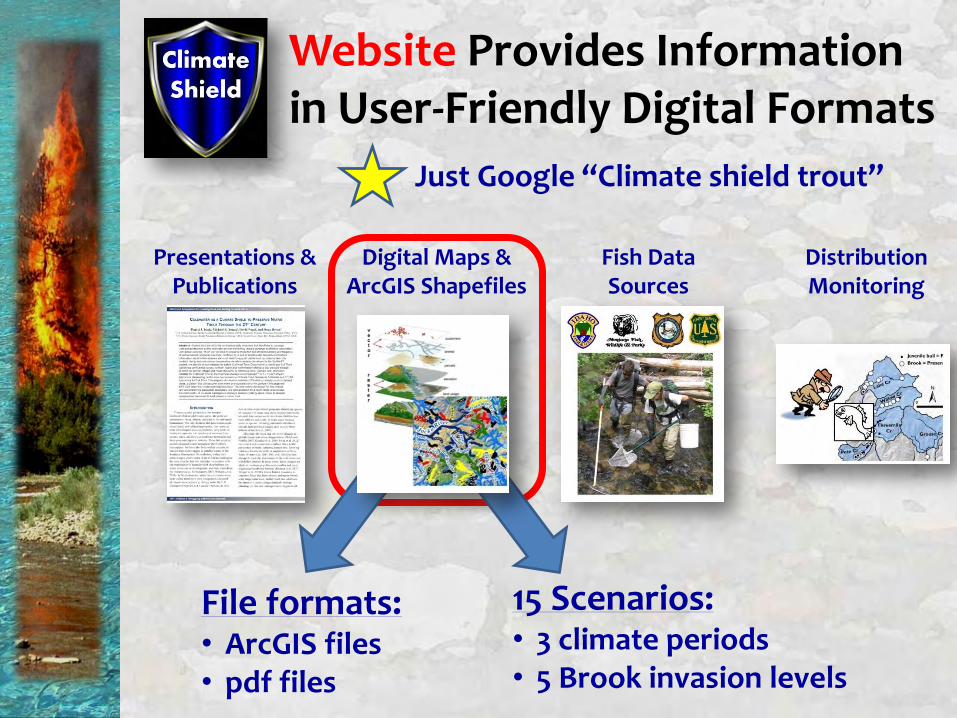
Website Provides Information in User-Friendly Digital Formats
File formats:• ArcGIS files• pdf files
15 Scenarios:• 3 climate periods• 5 Brook invasion levels
Presentations &Publications
Digital Maps & ArcGIS Shapefiles
Fish Data Sources
Distribution Monitoring
Just Google “Climate shield trout”
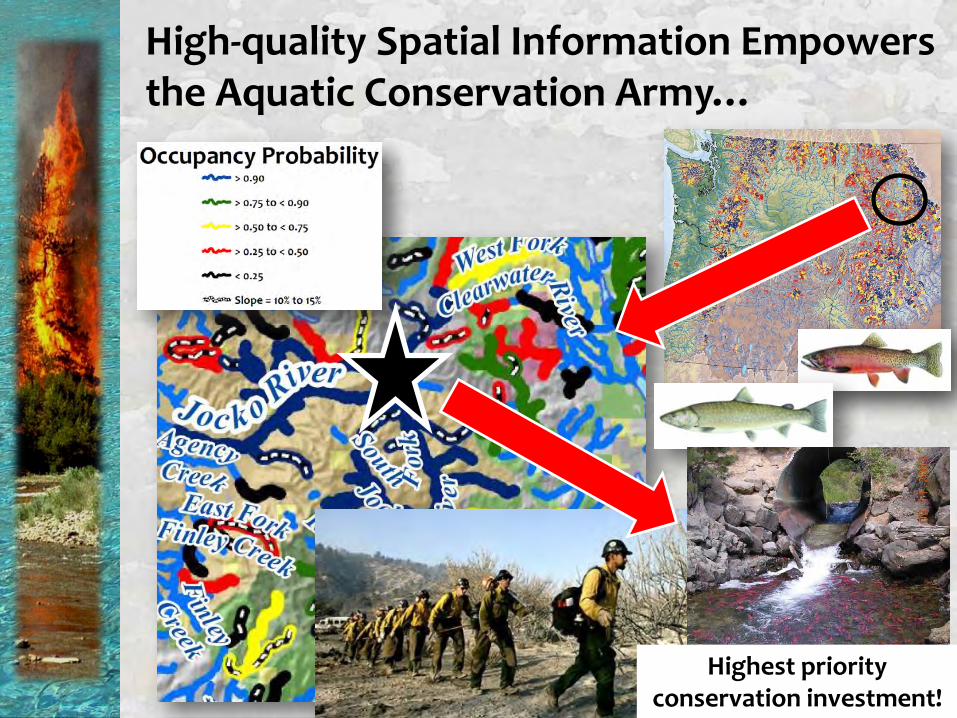
High-quality Spatial Information Empowers the Aquatic Conservation Army…
Highest priority conservation investment!
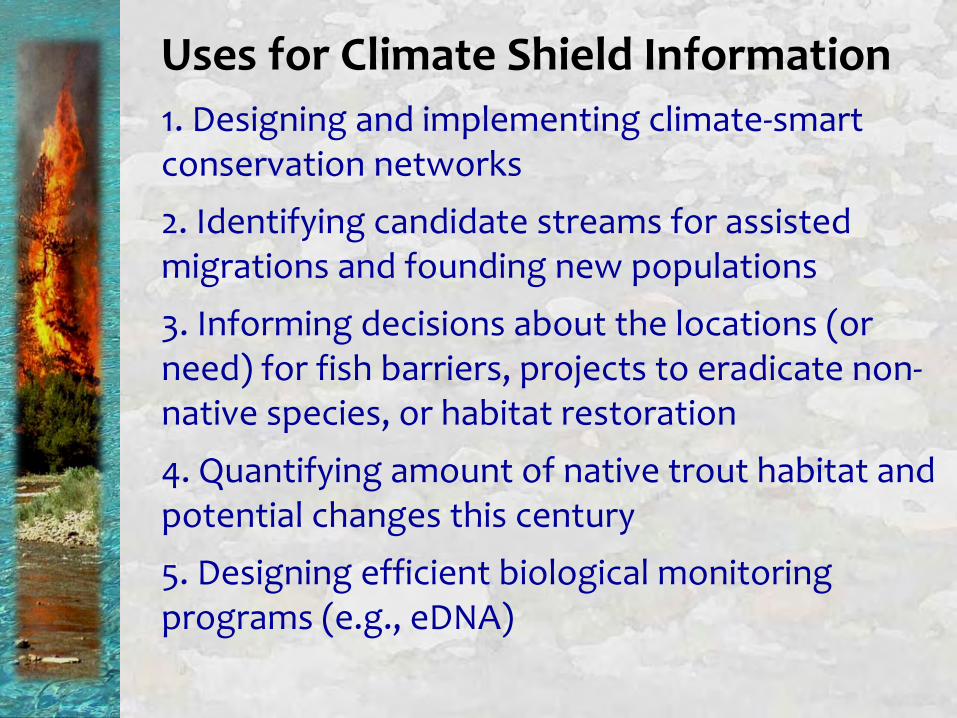
Uses for Climate Shield Information
1. Designing and implementing climate-smart conservation networks
2. Identifying candidate streams for assisted migrations and founding new populations
3. Informing decisions about the locations (or need) for fish barriers, projects to eradicate non-native species, or habitat restoration
4. Quantifying amount of native trout habitat and potential changes this century
5. Designing efficient biological monitoring programs (e.g., eDNA)
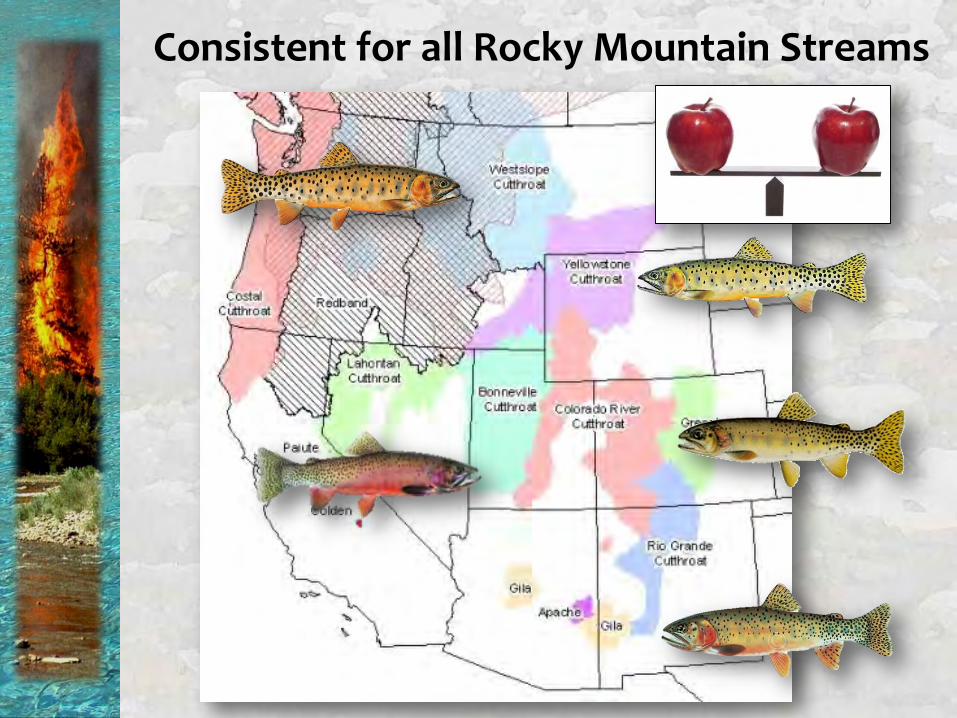
Consistent for all Rocky Mountain Streams
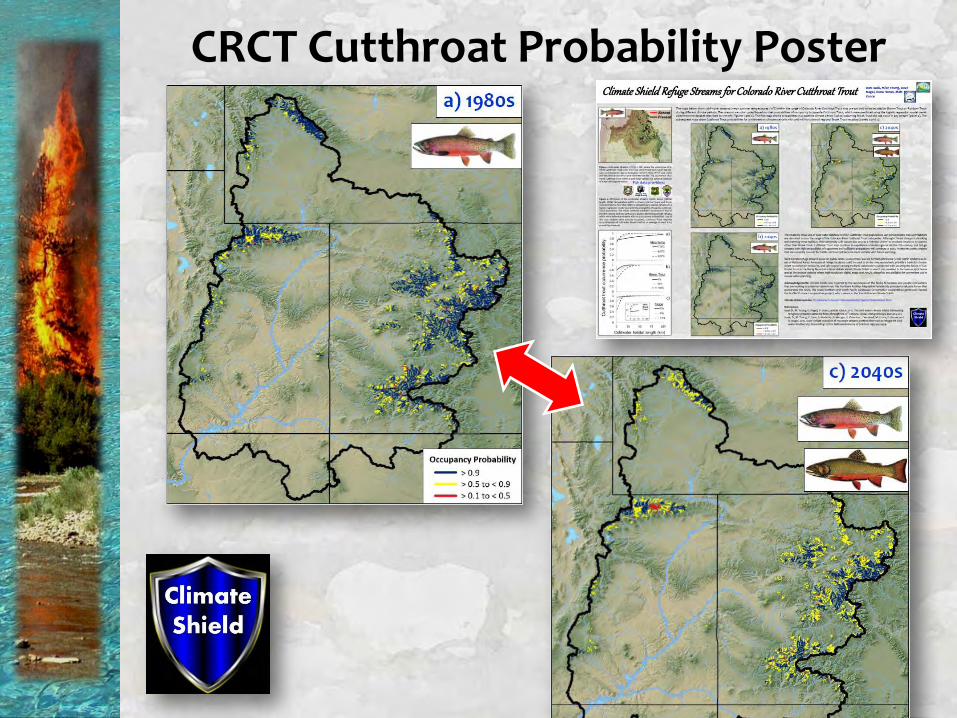
CRCT Cutthroat Probability Poster
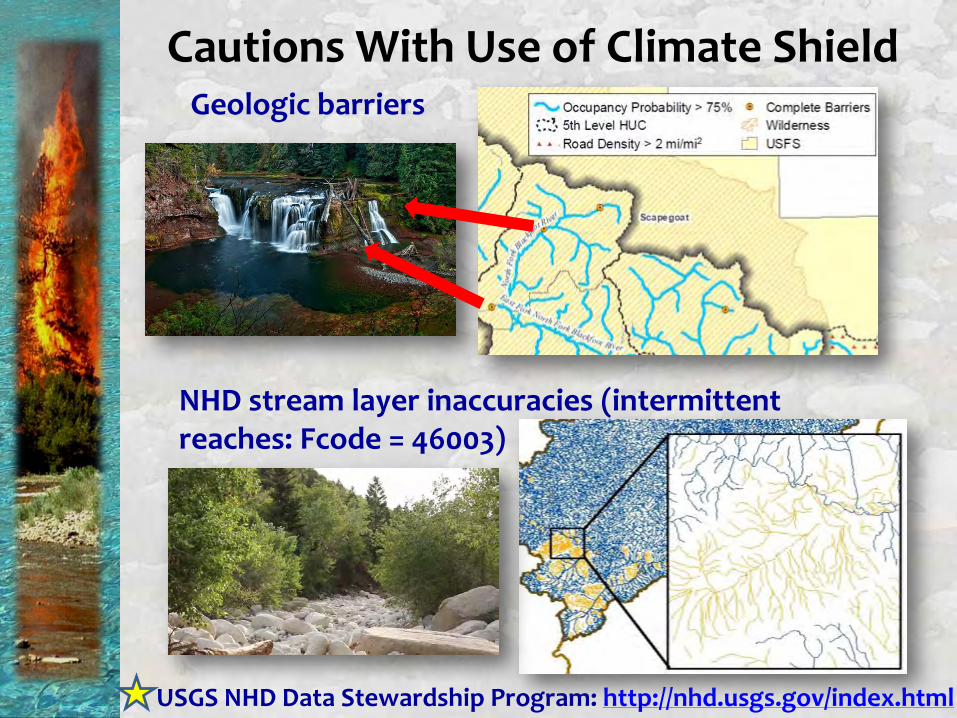
Cautions With Use of Climate Shield Geologic barriers
USGS NHD Data Stewardship Program: http://nhd.usgs.gov/index.html
NHD stream layer inaccuracies (intermittent reaches: Fcode = 46003)
Fish Data Acknowledgements:John Chatel & Scott Vuono - Sawtooth National Forest; Ralph Mitchell, Herb Roerick, & Mike Kellett -Boise National Forest; Bart Gamett - Salmon-Challis National Forest; James Brammer & Steven Kujala -Beaverhead-Deerlodge National Forest; Joan Louie -Lolo National Forest; Leslie Nyce - Montana Fish, Wildlife and Parks; Seth Wenger – University of Georgia; Kevin Meyer – Idaho Fish & Game
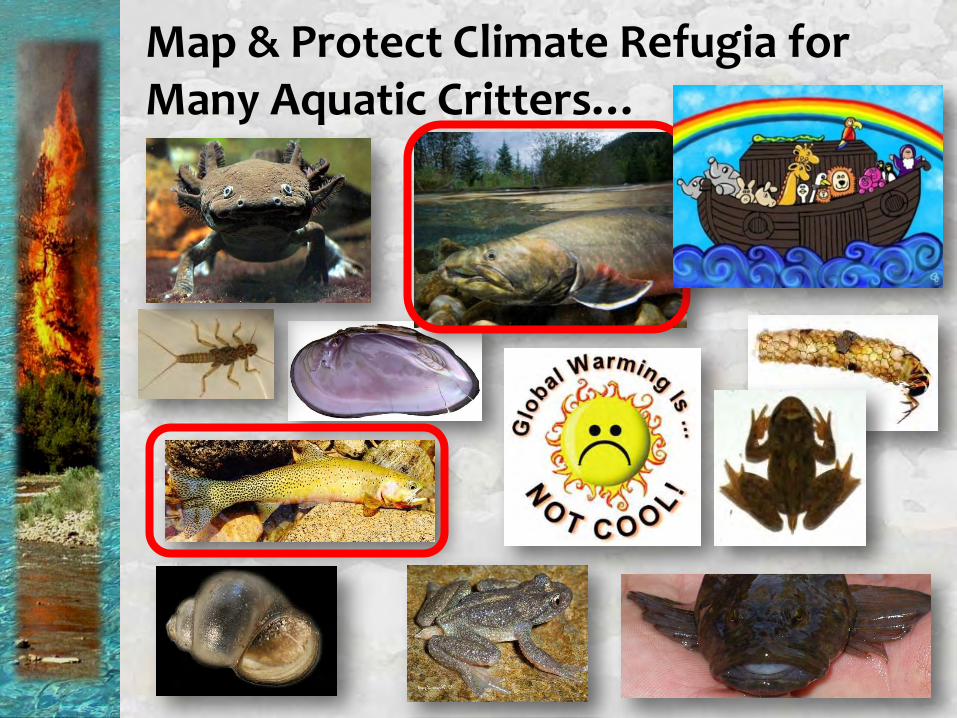
Map & Protect Climate Refugia for Many Aquatic Critters…
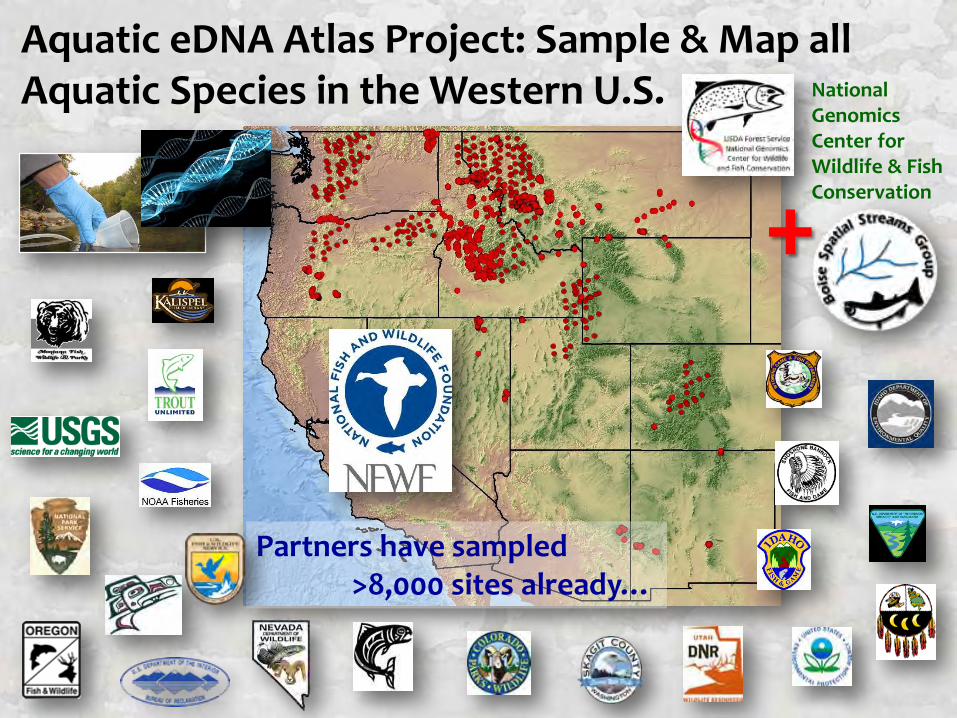
Partners have sampled>8,000 sites already…
Aquatic eDNA Atlas Project: Sample & Map all Aquatic Species in the Western U.S.
+
National Genomics Center for Wildlife & Fish Conservation
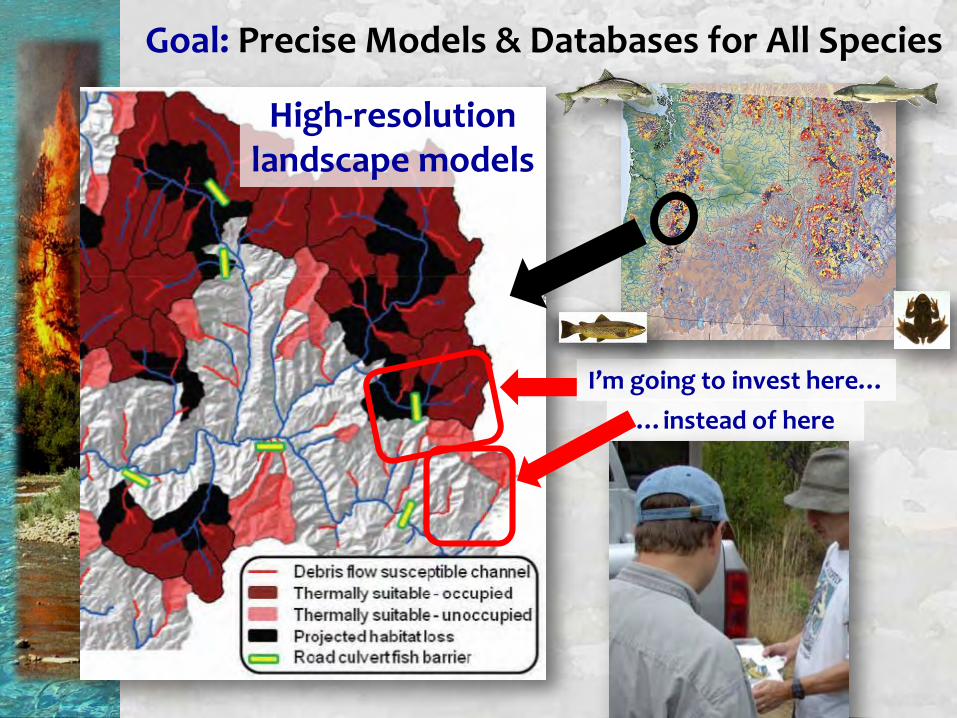
Goal: Precise Models & Databases for All Species
High-resolution landscape models
…instead of here
I’m going to invest here…