Embed Size (px)
Citation preview

Valuation of human lives
Presentation at an
Informal Joint Workshop of the Regulatory Policy Committee
and the Annual Meeting of Sustainable Development
Experts on
The Role of Impact Assessments in Policy Making
By
Nils Axel Braathen
OECD, Environment Directorate

Why do we need (explicit) VSL estimates?
• There is (and should be) increased use of Cost-Benefit
Analysis (CBA) in (environmental) decision-making.
• In times of scarce public resources, this can help secure
that money is spent where it is most useful.
• CBA measure costs and benefits in common units: money.
• For policies that affect mortality, this requires a „value of a
statistical life‟ (VSL), for measuring the relevant benefits.
• If VSL is not valued explicitly, it will in practice be valued
implicitly, through the policy-decisions actually made.
• These “revealed” VSLs will in practice vary between
contexts – and reflect a waste of resources.
explicit VSL estimates help develop consistent policies.

What is VSL?
• VSL is not the value of an identified person‟s life!
• It is an ex ante valuation of a small reduction in mortality risks
(over a given time period).
• There are two main methods to measure VSL:
– Hedonic Pricing (HP) methods, normally relying on studies of
differences in pay in jobs with different mortality risks.
• Focuses on men aged 40-50 years, assumes they understand their job risks.
– States Preference (SP) methods, where people are asked how much
they would be willing to pay for e.g. a drug that would reduce their risk
of dying from 3 in 10,000 to 2 in 10,000 during one year.
• Can address any age category, could be affected by „hypothetical bias‟, large
differences in the quality of surveys.
• Dividing the WTP (or the wage difference) by the risk change
gives a value for the VSL.
– USD 300 / 0.0001 = USD 3,000,000.
3

OECD’s meta-analysis of VSL estimates
• In order to help countries implement CBAs, OECD has
carried out a meta-analysis of all available mean VSL
estimates from SP surveys made using environmental,
health and traffic risk contexts.
• Excluded estimates based on „willingness-to-accept‟ (WTA).
• Meta-analysis: Attempting to explain the differences in
existing VSL estimates.
• Countries can draw on this analysis to do so-called „benefits
transfers‟:
– Estimating a VSL value to use in their policy assessments based on
VSL values already estimated in other countries, taking due account
of relevant differences between the countries concerned.
• A domestic SP study would be better – but also more costly.
4
5
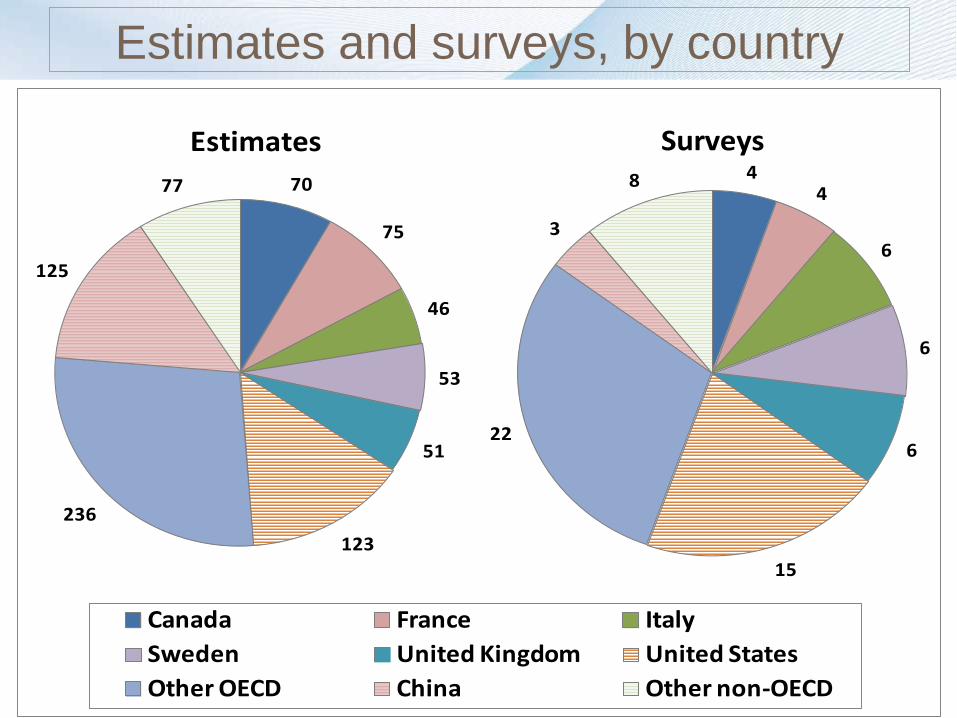
Estimates and surveys, by country
70
75
46
53
51
123
236
125
77
Estimates4
4
6
6
6
15
22
3
8
Surveys
Canada France Italy
Sweden United Kingdom United States
Other OECD China Other non-OECD

Screening of the sample of VSL estimates
• Started out with 856 unscreened VSL estimates from all
over the world.
• In order to base the final meta-analysis on „good quality‟
VSL estimates – well suited as a basis for policy
assessments, we excluded estimates that
– Provided no information on the size of the risk change valued
(231).
– Came from surveys where the full sample was <200 persons, or
was based on a sub-sample (e.g., age group) of <100 persons
(118).
– Came from samples clearly not representative of the general
population (e.g., only health personnel, or only students) (102).
– The original authors (also) recommended that we should exclude
(55).
6

Impacts of the screening on VSL distribution
7
0
20
40
60
80
100
120
Num
ber o
f mea
n V
SL e
stim
ates
2005 USD, PPP adjusted
Unscrened
Screened
Recommended

Impacts of the screening on the surveys included
8
0
10
20
30
40
50
60
70
80
90
Acc
um
ula
ted
nu
mb
er o
f su
rvey
s
Environment -- Excluded
Traffic -- ExcludedHealth -- Excluded
Environment -- Included
Traffic -- Included
Health -- Included

Impacts of the screening, by risk category
9 0
50
100
150
200
250
300
<1,000,000 1-3,000,000 3-6,000,000 6-10,000,000 10-20,000,000 More
Num
ber o
f est
imat
es in
eac
h in
terv
al
2005-USD, PPP adjusted
Traffic -- Excluded
Health -- Excluded
Environment -- Excluded
Traffic -- Included
Health -- Included
Environment -- Included

Impacts of the screening, by risk category II
10 0
2,000,000
4,000,000
6,000,000
8,000,000
10,000,000
12,000,000
Environment-- Included
Environment-- All
Health-- Included
Health-- All
Traffic-- Included
Traffic-- All
2005
-USD
, PPP
adj
uste
d
Standard Error
Mean
Median

Regressions on the “recommended” sample
11

Base VSL values
12
Full
sample
Trimmed
sample
‘Recom-
mended’
sample
OECD
countries
(screened)
EU-27
(screened)
Mean VSL 6.1 5.0 2.4 3.7 4.4
(standard error) (0.49) (0.32) (0.15) (0.22) (0.29)
Weighted mean VSL* 7.4 6.3 3.0
(standard error) (0.89) (0.3) (0.25)
Median 2.4 2.4 1.2 2.9 3.6
Observations 856 814 350 206 135
Million 2005-USD, PPP adjusted
*Weighted by the inverse of the number of observations from each SP survey.

Example: Calculating a VSL value for Israel
• VSLp‟ = VSLs (Yp / Ys)ß
• GDP per capita, 2009, PPP-adjusted:
– Israel (Yp): 27 661 USD
– OECD average (Ys): 33 054 USD
• Ratio: 27 661 / 33 054 = 0.83684
• Ratio to the power of 0.8 / 0.4 (ß): 0.86719 / 0.93123
– 0.86719 * 2.9 (VSLs) = 2.5 (million 2005-USD).
– 0.93123 * 2.9 (VSLs) = 2.7 (million 2005-USD).
• PPP-adjusted, 2005 exchange rate: 3.743627.
• VSLp‟ in 2005 money value: 9.4 / 10.1 million NIS.
• CPI, 1st quarter 2011 (2005=100): 116.5.
• VSLp‟ in 2011 money value: 11 / 12 million NIS.
13
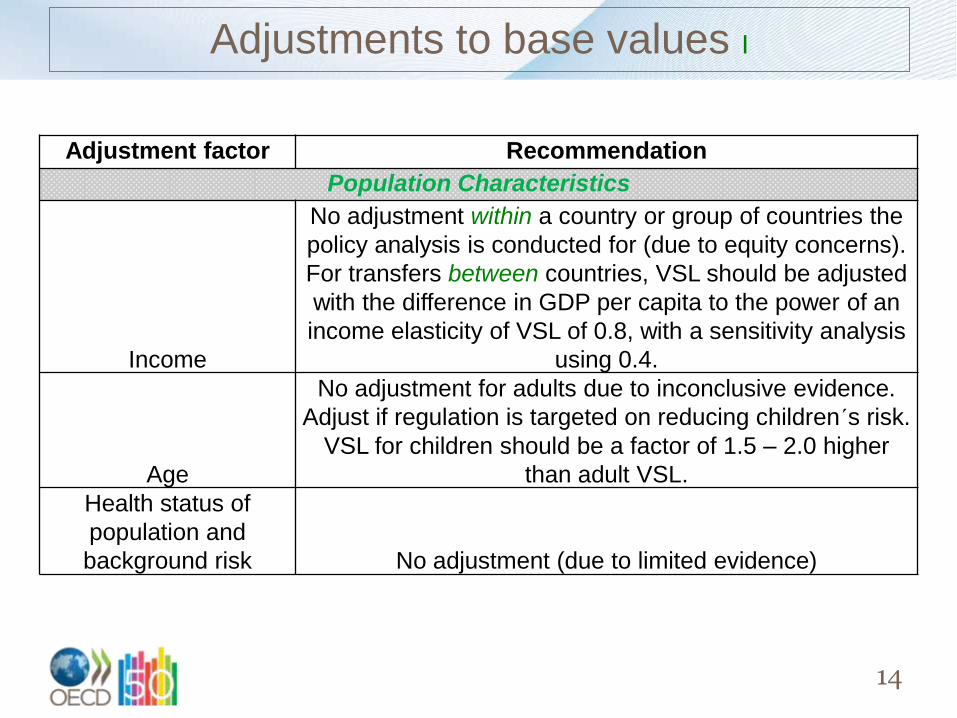
Adjustments to base values I
14
Adjustment factor Recommendation
Population Characteristics
Income
No adjustment within a country or group of countries the
policy analysis is conducted for (due to equity concerns).
For transfers between countries, VSL should be adjusted
with the difference in GDP per capita to the power of an
income elasticity of VSL of 0.8, with a sensitivity analysis
using 0.4.
Age
No adjustment for adults due to inconclusive evidence.
Adjust if regulation is targeted on reducing children´s risk.
VSL for children should be a factor of 1.5 – 2.0 higher
than adult VSL.
Health status of
population and
background risk No adjustment (due to limited evidence)

15
Adjustment factor Recommendation
Risk Characteristics
Timing of risk
(Latency) No adjustment (due to limited evidence).
Risk Perception
(source or cause)
No adjustment (due to inconclusive evidence). Sensitivity
analysis for lower values in the environment sector than in
health and traffic.
Cancer or Dread
(Morbidity prior to
death)
No adjustment if regulation is targeted on cancer risks and/or
risks that are dreaded due to morbidity prior to death. Morbidity
costs prior to death should be added separately.
Magnitude of risk
change
No adjustment. However, since the magnitude of the risk
change clearly affects the VSL, a sensitivity analysis based on
VSL calculated from a risk change similar in magnitude to the
policy context should be conducted. A risk change of 1 in
10,000 annually is suggested for calculating a VSL base value.
Adjustments to base values II

Adjustments to base values III
16
Adjustment factor Recommendation
Other adjustments
Altruism and Public vs.
Private risk
No adjustment (due to limited evidence and
unresolved issues). Use “Private risk” to
calculate a VSL base value. Provide illustrative
adjustments in sensitivity analysis.
Discount for hypothetical bias
in SP studies No adjustment (due to limited evidence)
Correction for inflation
Adjustment based on the national Consumer
Price Index (CPI).
Correction for increased real
income over time
Adjust VSL with same percentage as the
percentage increase in GDP per capita.


![[ PowerPoint Template ]](https://img.pdfslide.us/doc/110x75/56814853550346895db565d2/-powerpoint-template--5697ba40150e6.jpg)