Embed Size (px)
Citation preview
Dr. César Emiliano Hernández OchoaUndersecretary of Electricity
The new Power sector in Mexico: The Trans-boundary Impact on U. S. and Mexican
Transactions
University of HoustonDecember 2nd 2016
www.reformaenergetica.gob.mx

Impact of the Reform Objetives of the Reform New industry structure The new Electric Market Short Term Market/Clean Energy/Clean Energy
Certificates/Capacity/Long Term Auctions Development of new infrastructure The Transboundary Impact on U. S. and Mexican
Transactions. Universal Electric Service Fund (FSUE)
Index
2

Impactof the Reform
3
Electricity markets world map
4
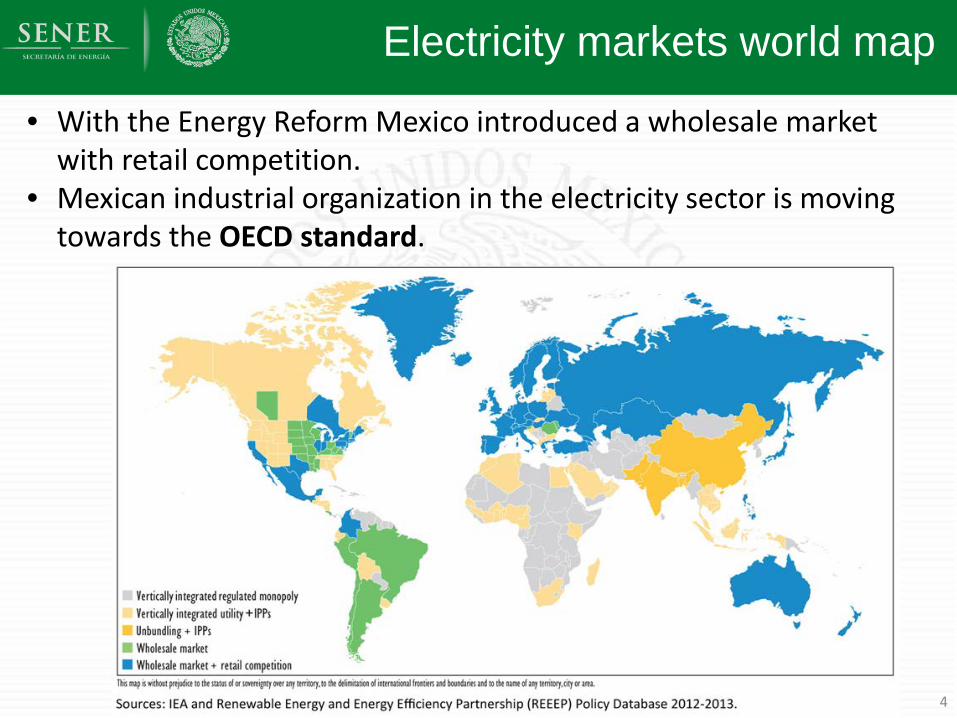
• With the Energy Reform Mexico introduced a wholesale market with retail competition.
• Mexican industrial organization in the electricity sector is moving towards the OECD standard.

Mexico's GDP will grow between 0.9 and 2.2% if electricity rates converge with US: IMF
Competition and lower costs: Improve the competitiveness of industry and commerce. Increase disposable income of the population in general. Create opportunities to export low-cost power.
5
Mexico's GDP will grow between 0.9 and 2.2% if electricity rates converge with US: IMF
Mexico's GDP will grow between 0.9 and 2.2% if electricity rates converge with US: IMF

Estimated Impact of the Reforms
6
Table 2. Impact of the reform on the level of GDP in the medium termOECD estimates of the reforms that have been legislated and those expected1
Effect after 5 years, assuming that implementation is immediate.
1. It is likely that the tax and education reforms will have significant effects on growth (the latter especially long-term), but these have not been included in the table because of the difficulty in quantifying these effects.Source: Bourles et al. (2010); Bassanini et al. (2009); Dougherty and Escobar (2014); Thévenon et al. (2012); IMF-OECD-World Bank (2014); Dougherty(2014).

Vertientes de la Reforma
7
Reform can reduce up to 29.5% of the system costs
100.0
70.5
5.6
13.5
6.3 0.7
3.5
50.055.060.065.070.075.080.085.090.095.0
100.0
Ingres
os po
r ven
tas CF
E
Susti
tución
de co
mbus
tóleo
por
gas n
atura
l
Optim
izació
n de c
ombu
stible
s
Redu
cción
de pé
rdida
s no t
écnic
as
Comp
romi
sos d
e gan
ancia
s en
eficie
ncia
opera
tiva
Eficie
ncia
oper
ativa
Ingres
os po
r ven
tas ta
rifas
reduc
idas
Composición a la Reducción de Tarifas Eléctricas
(% de la tarifa actual)
Composition of electricity rates reduction(% Of the current rate)
CFE
Sale
s rev
enue
fuel
subs
titut
ion
by
natu
ral g
as
Fuel
opt
imiz
atio
n
Redu
cing
non
-tec
hnic
al lo
sses
Gua
rant
ee co
mm
itmen
ts in
op
erat
iona
l effi
cien
cy
Ope
ratio
nal e
ffici
ency
Sale
s re
venu
e re
duce
d ra
tes
The areas with the greatest potential are:
• Reduction of energy losses in the network and fuel substitution and optimization.
WHAT IS THE ELECTRICITY MARKET?The Reform will create innovation
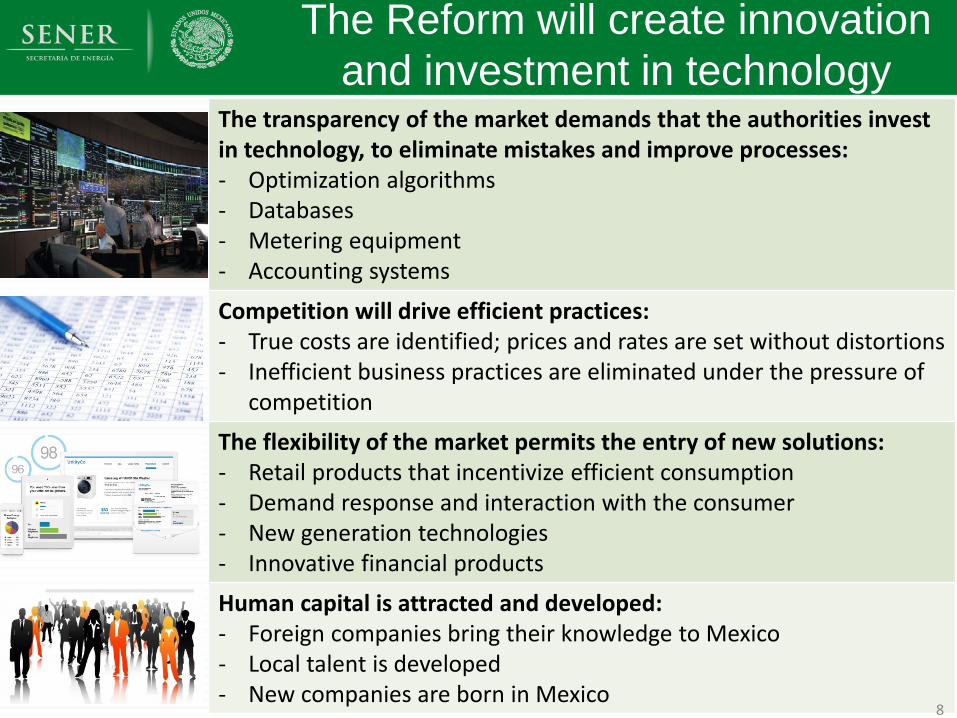
and investment in technologyThe transparency of the market demands that the authorities invest in technology, to eliminate mistakes and improve processes:- Optimization algorithms- Databases- Metering equipment- Accounting systems
Competition will drive efficient practices:- True costs are identified; prices and rates are set without distortions- Inefficient business practices are eliminated under the pressure of
competition
The flexibility of the market permits the entry of new solutions:- Retail products that incentivize efficient consumption- Demand response and interaction with the consumer- New generation technologies- Innovative financial products
Human capital is attracted and developed:- Foreign companies bring their knowledge to Mexico- Local talent is developed- New companies are born in Mexico
8

New industry structure
9
WHAT IS THE ELECTRICITY MARKET?Background:
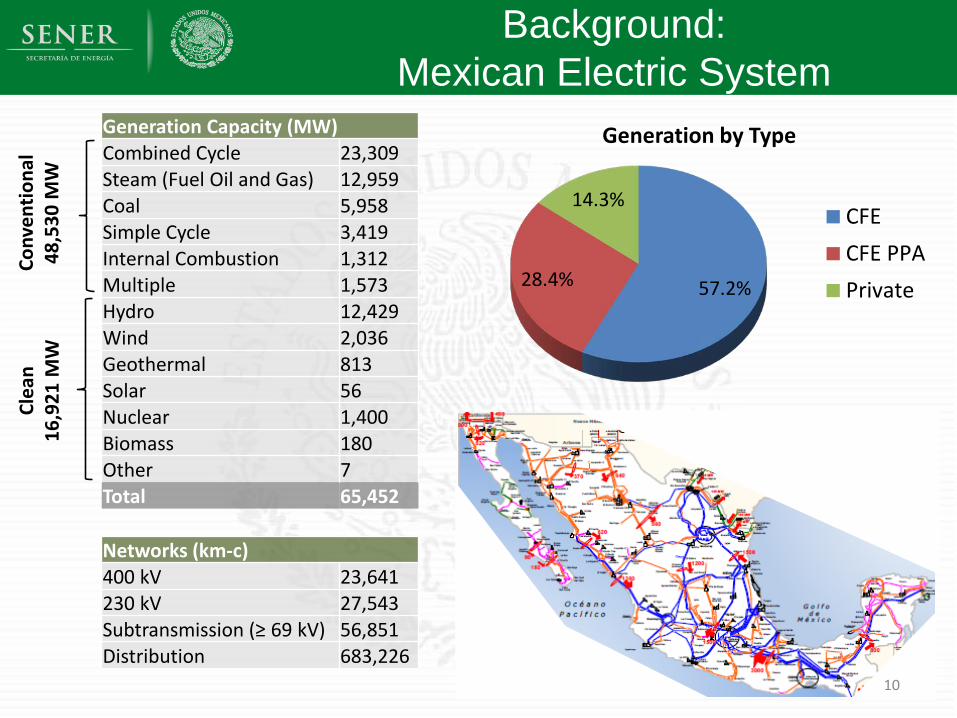
Mexican Electric SystemGeneration Capacity (MW)Combined Cycle 23,309Steam (Fuel Oil and Gas) 12,959Coal 5,958Simple Cycle 3,419Internal Combustion 1,312Multiple 1,573Hydro 12,429Wind 2,036Geothermal 813Solar 56Nuclear 1,400Biomass 180Other 7Total 65,452
57.2%28.4%
14.3%
Generation by Type
CFECFE PPAPrivate
Networks (km-c)400 kV 23,641230 kV 27,543Subtransmission (≥ 69 kV) 56,851Distribution 683,226
Conv
entio
nal
48,5
30M
WCl
ean
16,9
21 M
W
10

Electric Rates Pre-Reform
• Average rates: 25% higher than in the US
• Without subsidies: difference would be 73%
• Subsidies equal to 0.75% of GDP
Sources: Sistema de Información Energética (Mexico), Energy Information Administration (USA)
0
50
100
150
200
250
300
350
400
ResidencialAlto Consumo
Comercial Servicios Industrial Residencial Agrícola Promedio
Average rates, first quarter 2013 (centavos/ kWh)Subsidio
México
EE.UU.
SubsidizedRate
+73%Real Rate
+123%
+149%
+25%
-24%
+134%
+69%
+84%
Residential High Consumption Comercial Public
Services Industrial Residential Agriculture Average
Subsidy
Mexico
USA
11

Objectives of the Reform
121212
• Reduce costs and rates
• More clean energy
• Spread the benefits
Reform Objectives
Reform Principles
• Incentives for value creation and efficient operation
• Decisions through competitive processes
• Open access and non-discrimination
• Transparency
• Industry Restructuring
• Competitive Market
• Clean Portfolio Standard
• Independent Planning
Reform Elements
Mexico's GDP will grow between 0.9 and 2.2% if electricity rates converge with US: IMF
Mexico's GDP will grow between 0.9 and 2.2% if electricity rates converge with US: IMF
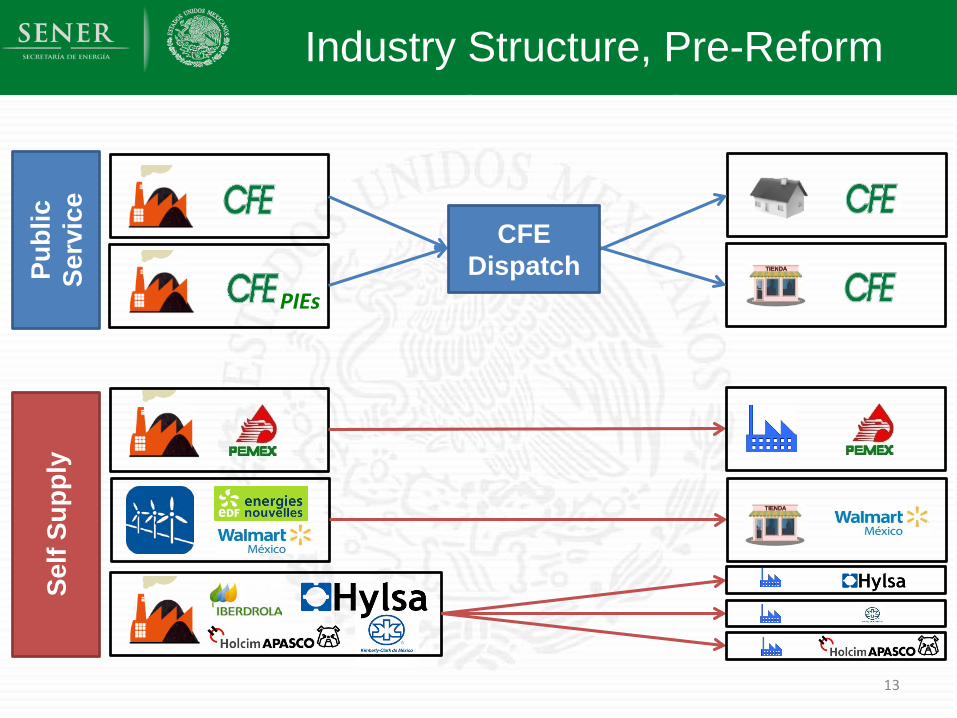
Industry Structure, Pre-Reform
CFE DispatchPubl
icSe
rvic
eSe
lf Su
pply
PIEs
13

Generation System Control and Power Market
Qualified Users
Basic Service Users
ConsumptionRetailing
Private Parties Regulated
SupplyLong Term Contracts
Spot Market
Auctions
Short Term Transactions
New Industry Structure: investment opportunities in markets and PPPs
and PPP Contracts
Transmission Distribution
Unregulated Supply
Subsidiary “B”
Subsidiary “A”
Subsidiary “C”
and PPP Contracts
14
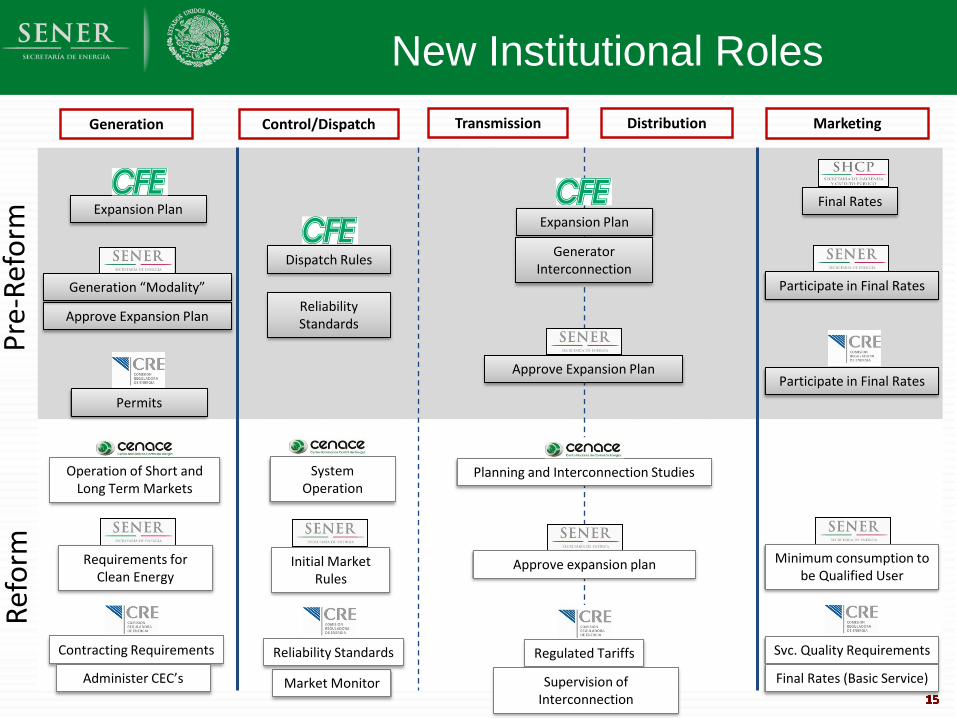
New Institutional Roles
15
Pre-
Refo
rmRe
form
Approve Expansion Plan
Permits
Generation “Modality”
Minimum consumption to be Qualified User
Market Monitor
Requirements for Clean Energy
Contracting Requirements
Administer CEC’s
Reliability Standards Svc. Quality Requirements
Final Rates (Basic Service)
Final Rates
Participate in Final Rates
Participate in Final Rates
Dispatch Rules
Reliability Standards
Expansion PlanExpansion Plan
Generator Interconnection
Approve Expansion Plan
Operation of Short and Long Term Markets
System Operation
Planning and Interconnection Studies
Regulated Tariffs
Approve expansion plan
MarketingControl/Dispatch TransmissionGeneration Distribution
Supervision of Interconnection
Initial Market Rules

Reestructuring of CFE
16

Characteristics
Benefits for the Market
Benefits for CFE
Vertical separation assures open access to networks for all generators and marketers
Horizontal separation of generation avoids market power
Specialized supervision of each activity
Clear information about the performance of each company
Planning and finance coordinated among companies
Restructuring Vertical Separation (G/T/D/S) 5 CFE Generation Companies Distribution in 16 unitsCorporate Governance Subsidiaries: 2 CFE, 1 SHCP, 1
SENER y 1 Independent CFE CEO presides boardsChinese Walls Separate employees/spaces No coordination between
competitive segments Separate marketing
Restructuring of CFE
17

CFE Terms of Strict Legal Separation
1 Transmission Subsidiary
5 Subsidiaries / Affiliates
(eventually) Own Generation
1 Subsidiary for Basic Retail Service
1 Affiliate "CFE Gas Natural"
1 Affiliate "CFE International"
State Control
1 Distribution Subsidiary (16 Business Units)
1 Affiliate to Administer
Legacy Interconnection
Contracts
1 Subsidiary to Administer PPA
Contracts
1 Affiliate for Qualified Retail
Vertical Separation
Horizontal Separation
Chinese Walls:- Information can only be
shared if it is made public
- No coordination of strategies between generators or generator-transmission
- Separate marketing- Investments evaluated
for their effect on the company that makes them
- Remuneration based on specific company results
18
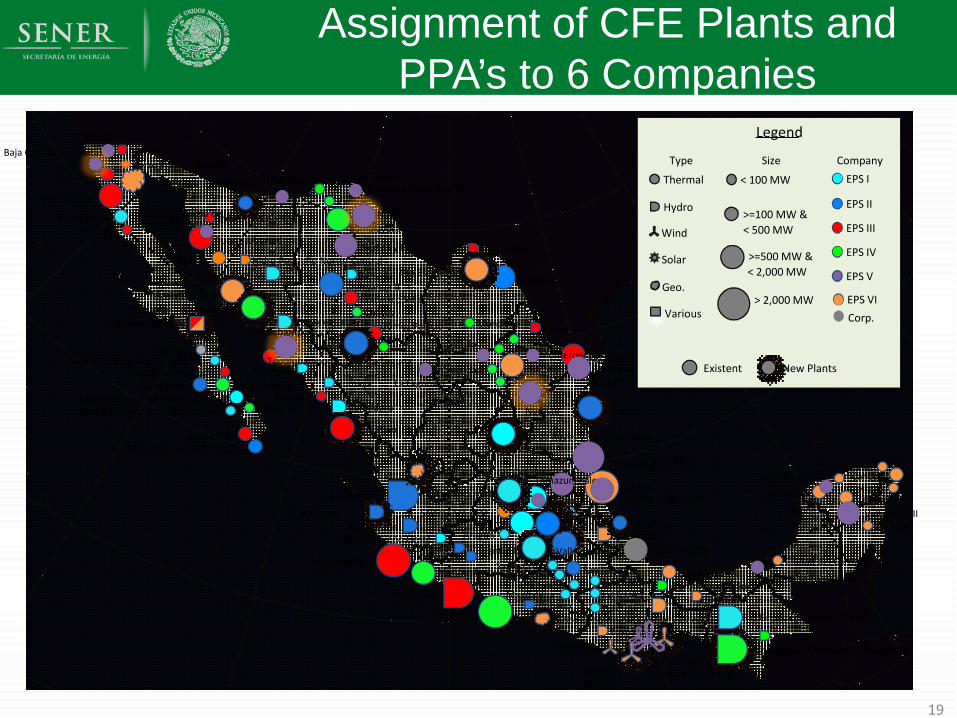
Assignment of CFE Plants and PPA’s to 6 Companies
19
Cerro Prieto - Solares
Cerro Prieto - Geotermica
Baja Calif. II
Bacurato
Ciprés
Mexicali
Pres. Juárez
Tijuana
Baja California Sur I -IV (Coromuel)
Baja California Sur I (Loreto TG)Ciudad Constitución
Los Cabos
Móviles
Punta Prieta IISan Carlos
U. Móvil CFE-T-30000 -1,2,3,4
ComederoCuliacán
Río Grijalva (Malpaso y Penitas)
El Novillo
Guaymas I y II
Hermosillo
Huites y El Fuerte
Humaya
Industrial Caborca
Mazatlán II y LIE
Puerto Libertad
Topolobampo II
Laguna VerdeAragón
Coapa
Río BalsasIztapalapa
Magdalena
Santa Cruz
Tula TC Agua Prieta
Río SantiagoSalamanca Fase I
Hidro Pequeño Oeste
Cóbano
ColimillaCupatitzio
El Sáuz
Villa de Reyes y San Luís Potosí
Varios Geotermicas Occidental
Sistema Mulegé
Manzanillo I
Petacalco
Manzanillo II
Salamanca y LIE
Zimapán
CancúnChankanaab
Ciudad del Carmen
Mérida IINachi - Cocom
NizucValladolid
Xul - Ha
Altamira
Carbón II
Hidro Pequeño Norte/ Central
FalcónFundidora
Huinalá
La Amistad
Leona
Monclova
Río Bravo
Río Escondido
TecnológicoUniversidad
Río Grijalva (Chicoasen y Angostura)
Chilapan
Dos Bocas
El RetiroEolicas Sur
MazatepecValle de México
Hidro Pequeño Sur
Poza Rica
San Lorenzo
Temascal
Tuxpan
Tuxpango
Boquilla
Chávez
Chihuahua IIFrancisco Villa
Gómez Palacio
Industrial Juárez
La LagunaLerdo
Parque
Samalayuca
Agua Prieta II
Baja California Sur V (Coromuel)
Centro I
Empalme II (Guaymas III)
Las Cruces
Sureste III
LyFC UA 1LyFC UA 2LyFC UA 3
SizeThermal
Hydro
Wind
Solar
Geo.
Various
< 100 MW
>=100 MW &< 500 MW
>=500 MW &
> 2,000 MW
Includes New PlantsExisting
Varios Geotermicas Central y Oriental
La Paz TG
Tula CC
Sureste II
< 2,000 MW
Legend
Type Size Company
Thermal
Hydro
Wind
Solar
Geo.
Various
< 100 MW
>=100 MW &< 500 MW
>=500 MW &
> 2,000 MW
EPS I
EPS II
EPS III
EPS IV
EPS V
New PlantsExistent
< 2,000 MW
EPS VICorp.
Mexicali
Fuerza y Energía deHermosillo
Naco Nogales
Mérida III Valladolid III
Transalta Campeche
Altamira II, III, IV, V
Monterrey IIIRío Bravo II, III y IV
Saltillo
Tamazunchale
La Venta III yOaxaca I, II, III y IV
Tuxpan II, III, IV y V
La Laguna II
Norte I y II
Transalta Chihuahua III
Baja Calif. III (La Jovita)
Norte III
Topolobampo II y III
Noreste
Sureste I.Fase II

The new Electric Market
20

Market Features
Market Periodicity Market TypeEnergy and Ancillary Services Daily, Hourly Cost Based
Capacity Yearly Administered
Clean Energy Certificates Yearly Unrestricted offers
Financial Transmission Rights Yearly / Monthly Unrestricted offers
CRE will set requirements for retailers to contract forward energy andassociated products.
Basic Service Retailers may only contract forward through auctionsoperated by CENACE.
Auctions and Long Term Contracts
21

The market adopts global best practices
22
Feature Other Markets
Nodal prices for the spot energy market
Argentina, Chile, Ireland, Russia, Singapore, New Zealand, PJM, ERCOT, CAISO, MISO
Cost-based capacity market for new generation with reserves demand curve
United Kingdom, Ireland, Russia, Colombia, PJM, NYISO, MISO
Clean Energy Certificates with clean portfolio requirements
Nordpool, Italy, CAISO, United Kingdom, Australia, Chile, India
Financial Transmission Rights with periodic auctions New Zealand, PJM, ERCOT, CAISO, MISO

Short Term Market
23

Short Term Market:General Characteristics
• Two-Settlement (Day Ahead and Real Time).• Nodal prices (approximately 2000 nodes).• Three part offers.• Co-optimization of energy and ancillary services.• Economic unit commitment by system operator.• Cost based offers and market monitoring.• Initial market based on existing CENACE software.
Objectives
• Efficient and reliable dispatch of the National Electric System.
• Correct signals for the location of new electric plants and the use of controllable demand.
Features
24

WHAT IS THE ELECTRICITY MARKET?Market Implementation Calendar
25
Milestone Baja California Interconnected System
Testing and Validation 5-22 January 2016Declaration of Market Start 25 January 2016 27 January 2016Day Ahead Market 26 January 2016 28 January 2016Real Time Market 27 January 2016 29 January 2016
Real Time Market in phases (quantities, prices and dispatch) Longer timeframe for initial billing and payment cycle Simplified participant registration during an initial period Credit requirements suspended until first billing cycle is complete
Transitory Rules for Gradual Implementation

WHAT IS THE ELECTRICITY MARKET?Market Participation to Date
26
2015
American Light & Power Mx, S. A. P. I.
de C. V.
Granja Generadora de Energía Solar, A. C.
2016Iberdrola Generación
S. A. de C. V.Iberdrola Clientes
S. A. de C. V.
Generator IntermediationGenerator
Qualified SupplyBasic Supply
Generadora Fénix, S. A. P. I. de C. V.
Suministro Sustentable de Energía en México,
S. A. P. I. de C. V.
Frontera México Generación, S. A. de
R. L. de C. V.
Energía Buenavista, S. de R. L. de C. V.
With a contract In the process of being signed
Rosch Latam México,S.A. de C. V.
Compañía Cervecera de Coahuila, S. de R.L. de C. V.
Energía Renovable del Istmo II, S.A. de C. V.
Energía del Valle de México,S.A.P.I. de C. V.
E2M Suministro Calificado, S.A.P.I. de C. V.
Intergen Soluciones Energéticas, S. de R. L. de C. V.
B-Energy Industries,S.A. de C. V.
Renovables Valor Agregado y Resultados Suministradora,
S.A.P.I. de C. V.
Hella Automotive México, S.A. de C.V.
Orden Cardinal, S.A.P.I. de C.V.
GPG Energía México S.A. de C.V.
Ammper Energía S.A.P.I. de C.V.

Day Ahead Market Results
* The average includes 2,130 nodes in this system
$820 a $865$866 a $911$912 a $957$958 a $1,003
600
650
700
750
800
850
900
950
1,000
1,050
1 2 3 4 5 6 7 8 9 10 11 12 13 14 15 16 17 18 19 20 21 22 23 24
$/M
Wh
Hours
Local Marginal PriceAverage Hourly from January 29th to September 23th, 2016.
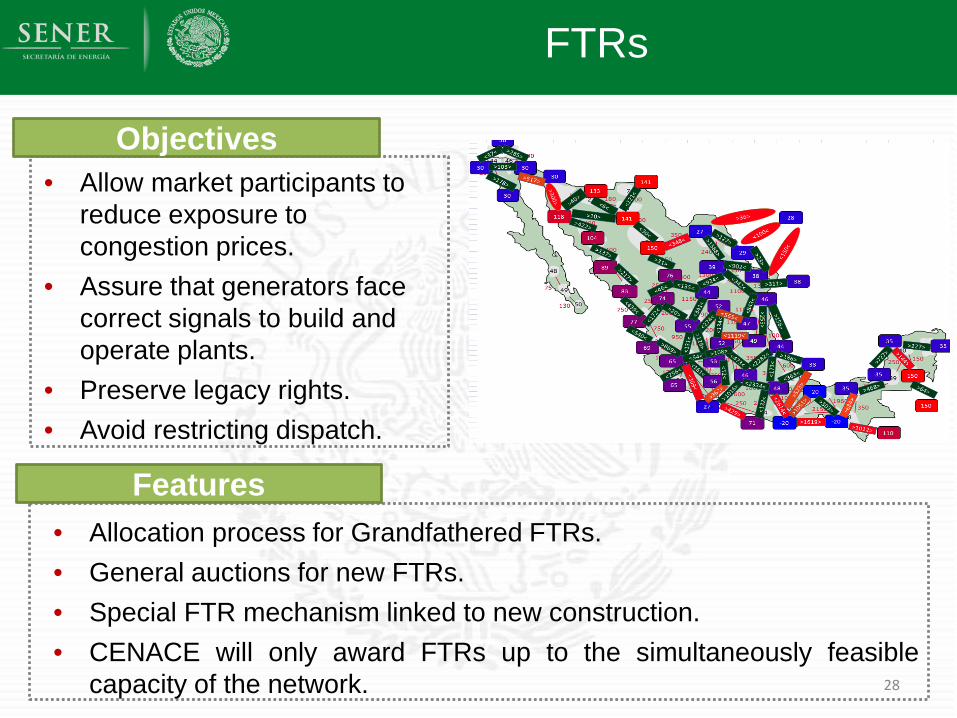
FTRs
• Allow market participants to reduce exposure to congestion prices.
• Assure that generators face correct signals to build and operate plants.
• Preserve legacy rights.• Avoid restricting dispatch.
• Allocation process for Grandfathered FTRs.• General auctions for new FTRs.• Special FTR mechanism linked to new construction.• CENACE will only award FTRs up to the simultaneously feasible
capacity of the network.
Features
Objectives
28

Clean Energy
29

Clean Energy Potential in Mexico
Renewable Energy PotentialInstalled Capacity2° semester 2014
(MW)
Actual GenerationYear 2013
(% of total GWh)
Actual Generation+ Proven Resources
Actual Generation+ Proven Resources+Probable Resource
Actual Generation+ Proven Resources
+Probable Resources+Possible Resource
Wind 1,900 1.4% 5.3% 5.3% 34.8%Geothermal 823 2.0% 2.2% 22.5% 40.0%Solar 64 0.01% 0.6% 0.6% 2,189.4%Mini Hydro 419 0.5% 1.7% 9.5% 24.4%Total 3,206 4.0% 9.9% 37.9% 2,288.6%
Clean Energy Goals:
35% in 2024, 40% in 2035 and 50% in 2050
Solar Resources Wind Resources Geothermal resources
30

Opening of Retailing and Distributed Generation
• Generation in small installations could not sell surplus.
• Credit was awarded toward consumption, but avoided rates were often lower than market values.
Before Reform After Reform• Regulated suppliers will pay a
regulated price for surplus energy.• Unregulated suppliers can buy
from all users at market prices.• Minimal regulation of on-site sales.
Only users on the highest rates had incentives to install distributed generation.
Distributed generation will earn a fair payment.
Specialized companies can market distributed generation.
31

WHAT IS THE ELECTRICITY MARKET?
Principal Increases in Capacity (MW)
• Tripled Clean Energy
• Increased 75% Combined Cycle
Cleaner Energy for the Future
42,643
6,905
7,627
15,101
16,976
24,043
56
583
2,805
12,489
CombinedCycle
Solar
EfficientCogeneration
Wind
Hydro 20152030

Clean Energy Certificates
33

Clean Energy CertificatesObjectives
Clean Energy Certificates
Income from Certificates
Levelized Cost
Energy Price
Gas CC WindTotal Cost Net Cost
34
• SENER establishes requirements to use a percentage of clean energy.• Retailers fulfill their requirements by buying Certificates.• CENACE operates a market once a year.• CRE verifies compliance and applies fines in case of non-compliance.
Features
• Solve the “missing money” problem for clean generators.
• Let the market make choices over technology
• Transparency regarding the cost of clean energy
• Maintain flexibility in case of cost surprises

dg
Mexico has adopted the global best practiceof clean energy certificates
• Mexico´s clean energy portfolio standard of 35% in 2024 is amongthe most ambitious in the world

Required Income from Clean Energy Certificates

Elasticity in the CEC Market
0102030405060708090
100
0 10 20 30 40 50 60 70 80 90 100 110 120 130
$/CE
L
CELs
CEC Market Without Storage
Demand is fixed at the level of the requirement, up to the fine.
Supply is inelastic at the amount produced.
0102030405060708090
100
0 10 20 30 40 50 60 70 80 90 100 110 120 130
$/CE
L
CELs
CEC Market With Storage
LSEs can defer up to 25% of their obligation; they will offer to buy CECs based on their expectation of future prices.
Generators will offer to sell CECs based on their expectation of future prices.
• Without storage of CECs or deferral of obligations, the price would alternate between zero and the value of the fine.
• CEC guidelines permit storage and deferral of up to 25% of obligations.
• The Energy Transition Law establishes cases where up to 50% can be deferred.
• Elasticity guarantees price stability.

Capacity
38
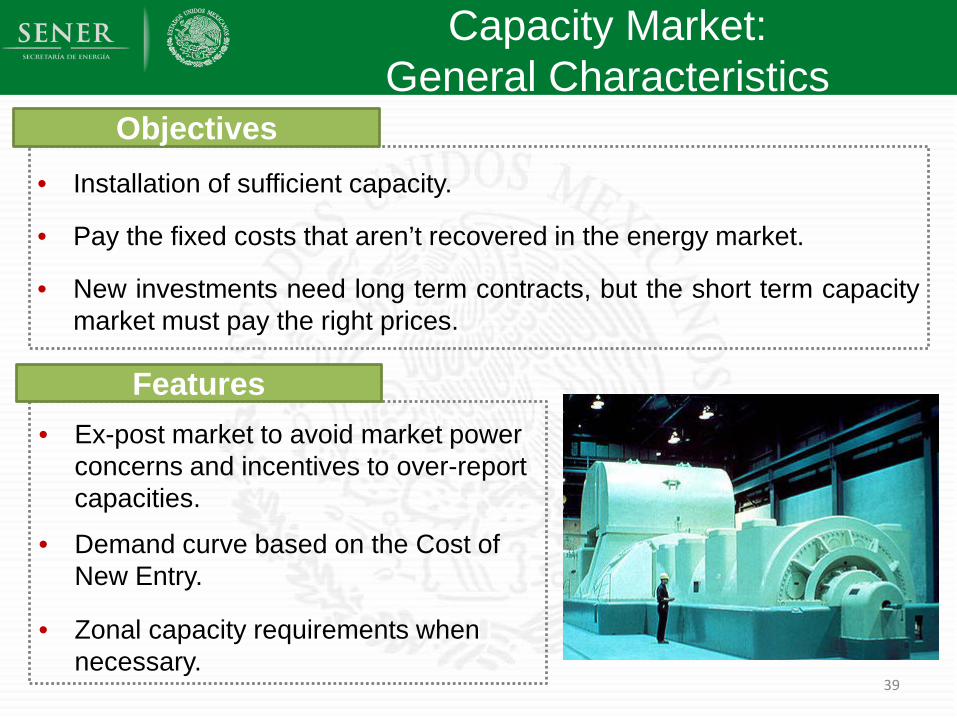
Capacity Market:General Characteristics
• Ex-post market to avoid market power concerns and incentives to over-report capacities.
• Demand curve based on the Cost of New Entry.
• Zonal capacity requirements when necessary.
Objectives• Installation of sufficient capacity.
• Pay the fixed costs that aren’t recovered in the energy market.
• New investments need long term contracts, but the short term capacitymarket must pay the right prices.
Features
39

Long Term Auctions
40

Auctions
41
Products Term Time to Contract
CapacityEnergy 3 years 4 months
Products Term Time to Contract
CapacityCECsEnergy
15 years (Cap / Energy)20 years (CEC)
3 years (or more)
Guarantee a stable cash flow that will cover fixed costs, reducing the risk of generation investment.
Long Term Auctions
Allow retailers to obtain an energy hedge prior to the short-term markets.
Medium Term Auctions

Long-Term Auctions
Objectives
Advance quickly toward Mexico’s clean energy goals.
Acquire clean energy at minimum cost for users.
Strategies
All technologies compete on a level playing field, recognizing the value of each one.
Reduce risk assigned to generators, to make projects more bankable.
Design
Bids for each product based on the Retailer's needs.
Sale offers by package according to each plant´s capabilities.
Adjustments for location and time of generation.
“Deploying a mix of technologies can:• Lead to more stable variable renewable energy, and• Reduce periods of variable renewable energy excess.
Hence boosting System Value.”IEA: Next Generation Wind and Solar Power (Overview of Mexico Auctions), June, 2016.
Outcome

WHAT IS THE ELECTRICITY MARKET?Simultaneous Auction for Clean
Energy and CapacityCapacity Package OffersCECs + Energy
Allocated Capacity by year
Individual product/technology auctions:
Geothermal Technology would not be competitive in Clean energy auctions, or Capacity auctions.
Package auction:
Geothermal technology is competitive and is a winner, based on its package price.
21,044 19,220
43,534
36,360
-
5,000
10,000
15,000
20,000
25,000
30,000
35,000
40,000
45,000
50,000
SOLAR WIND GEOTHERMAL COMBINEDCYCLE
USD
/ (M
W-y
ear)
Capacity Prices
31.9
35.8 37.3
(CEC,7.3
-
5.0
10.0
15.0
20.0
25.0
30.0
35.0
40.0
SOLAR WIND GEOTHERMAL HYDRO
USD
/ (M
wh
+ C
EC)
CEC + MWh Prices
CEC ENERGY (MWH)
4.9
3.8
0.2 -0.3
4.8
3.9
0.2 - -
184 128
25
850
-0
100
200
300
400
500
600
700
800
900
-
1.0
2.0
3.0
4.0
5.0
6.0
SOLAR WIND GEOTHERMAL COMBINEDCYCLE
HYDRO
USD
/ (MW
-year)
USD
-m
illio
ns/ (
Mw
h+
Cec
)
CEC ENERGY (MWH) Capacity (MW YEAR)

WHAT IS THE ELECTRICITY MARKET?Historical Context
2,861
2,085
2,804*
-
500
1,000
1,500
2,000
2,500
3,000
3,500
Capacity since1998 to 205
1st Long-TermAuction
2nd Long-Term Auction
MW
Installed Capacity: Solar & Wind
Wind Solar
AuctionsClean Energy: Solar & Wind
Assi
gned
Cap
acity
The First Auction acquired solar and wind capacity equal to 73% of the amount installed in the previous 18 years.
CECs covered 1.9% of annual energy consumption.
The Second Auction acquired solar and wind capacity equal to 98% of the amount installed in the previous 18 years.
CECs covered 3.2% of annual energy consumption.
* Does not include hydroelectric capacity (67 mw).

WHAT IS THE ELECTRICITY MARKET?1st + 2nd Long-Term Auctions
Investment by StateInvestment by source Breakdown per State
Approx. 6.6 billion dollars of totalinvestment.
15 states with investment in new projects.
State Investment Amount(USD thousands)
Investment(%) Technology
Tamaulipas 1,060,949 16% WindCoahuila 1,019,874 15% SOLARYucatán 895,561 14% SOLAR, Wind
Aguascalientes 790,426 12% SOLARGuanajuato 524,475 8% SOLAR
Sonora 517,297 8% SOLARSan Luis Potosí 389,732 6% SOLAR
Oaxaca 368,392 6% WindNuevo León 331,760 5% WindChihuahua 307,800 5% SOLAR
Jalisco 135,000 2% SOLARPuebla 97,828 1% HYDROMorelos 94,500 1% SOLAR
Baja California 50,535 1% SOLARBaja California Sur 31,050 0% SOLAR
Total 6,615,179 100%
SOLARWindHyDROsolar-Wind
Baja California
Tamaulipas
San Luis Potosí
Puebla
OaxacaMorelos
Aguascalientes
CoahuilaChihuahuaSonora
Nuevo León
Baja California sur
Jalisco
Guanajuato
Yucatán
Tamaulipas16%
Coahuila15%
Yucatán14%
Aguascalientes12%
Guanajuato8%
Sonora8%
San Luis Potosí6%
Oaxaca6%
Nuevo León5%
Chihuahua5%
Jalisco2%
Puebla1%
Morelos1% Baja California
1%Baja California Sur
0%
Investment per State (%)
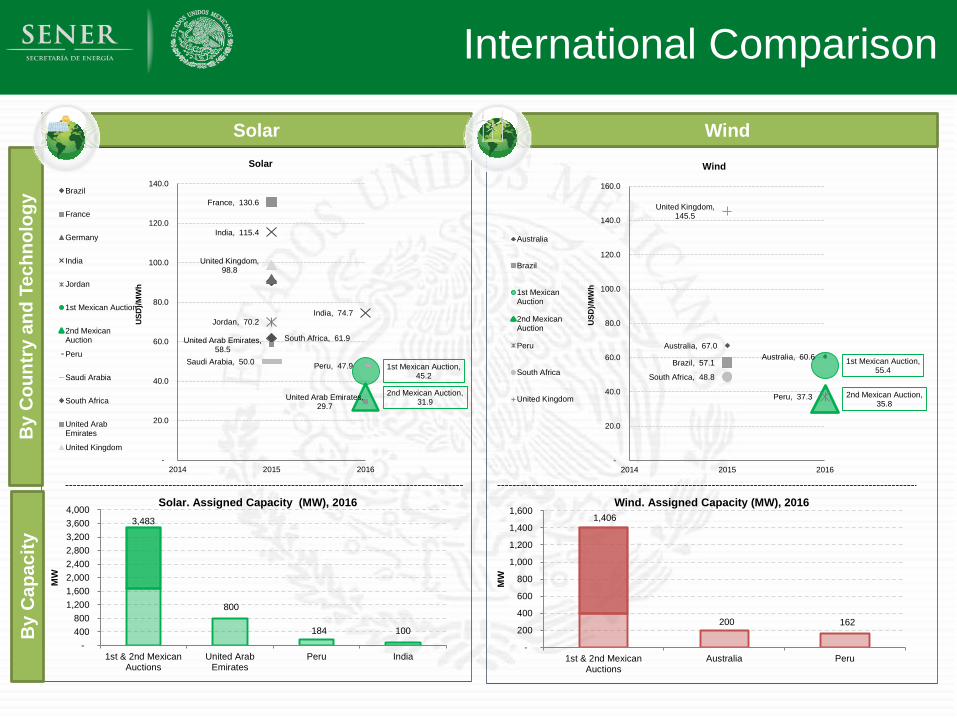
WHAT IS THE ELECTRICITY MARKET?International Comparison
WindSolar
By
Cou
ntry
and
Tec
hnol
ogy
By
Cap
acity
France, 130.6
India, 115.4
India, 74.7 Jordan, 70.2
1st Mexican Auction, 45.2
2nd Mexican Auction, 31.9
Peru, 47.9 Saudi Arabia, 50.0
South Africa, 61.9 United Arab Emirates, 58.5
United Arab Emirates, 29.7
United Kingdom, 98.8
-
20.0
40.0
60.0
80.0
100.0
120.0
140.0
2014 2015 2016
USD
)/MW
h
Solar
Brazil
France
Germany
India
Jordan
1st Mexican Auction
2nd MexicanAuction
Peru
Saudi Arabia
South Africa
United ArabEmirates
United Kingdom
Australia, 67.0 Australia, 60.6
Brazil, 57.1 1st Mexican Auction, 55.4
2nd Mexican Auction, 35.8
Peru, 37.3
South Africa, 48.8
United Kingdom, 145.5
-
20.0
40.0
60.0
80.0
100.0
120.0
140.0
160.0
2014 2015 2016
USD
)/MW
h
Wind
Australia
Brazil
1st MexicanAuction
2nd MexicanAuction
Peru
South Africa
United Kingdom
3,483
800
184 100 -
400 800
1,200 1,600 2,000 2,400 2,800 3,200 3,600 4,000
1st & 2nd MexicanAuctions
United ArabEmirates
Peru India
MW
Solar. Assigned Capacity (MW), 20161,406
200 162
-
200
400
600
800
1,000
1,200
1,400
1,600
1st & 2nd MexicanAuctions
Australia Peru
MW
Wind. Assigned Capacity (MW), 2016

Third Auction
Review
Learning analysis
• Study with International Experts
• Recommendations and observations
Compensation Chamber
• More buyer diversity
• Risk management mechanisms
• Greater bankability
Third Long Term Auction launch: April 2017.

48
Long Term Auctions; praised byobservers around the world

Development of new infrastructure
49

Strategy for the creation of a Natural Gas Market
Information
Production, Transactions Market-based prices
Access to Infrastructure
Open Seasons Capacity reservations
Moreparticipation
Liquid Market+ + =
50

Vertientes de la Reforma
51
Vertientes de la ReformaGas pipelines will guarantee supplyfor combined cycle generation
The 2015-2019 Five-Year Expansion of Natural Gas TransportationSystem will to capitalize on our strategic position through 13 projects.
Terminales de regasificación de GNL
Gasoductos en operación
Gasoductos concluidos en 2014 y 2015
Gasoductos actualmente en construcción (2015-2016)
Gasoductos estratégicos (instruidos)
Gasoductos sociales (instruidos)
Gasoductos comerciales (no instruidos)
Estación de compresión estratégica (instruida)
Gas Pipeline Expansion Plan. Summary
Projects (Number) 13
Length (km) 5,159
Estimated investment(Billions of dollars) 9,736

52Source: Pemex Institutional Database, 1997-2015; Energy Information System, SIE, 2016.
MMcf: Million cubic feet
Natural Gas Investment Opportunities
53
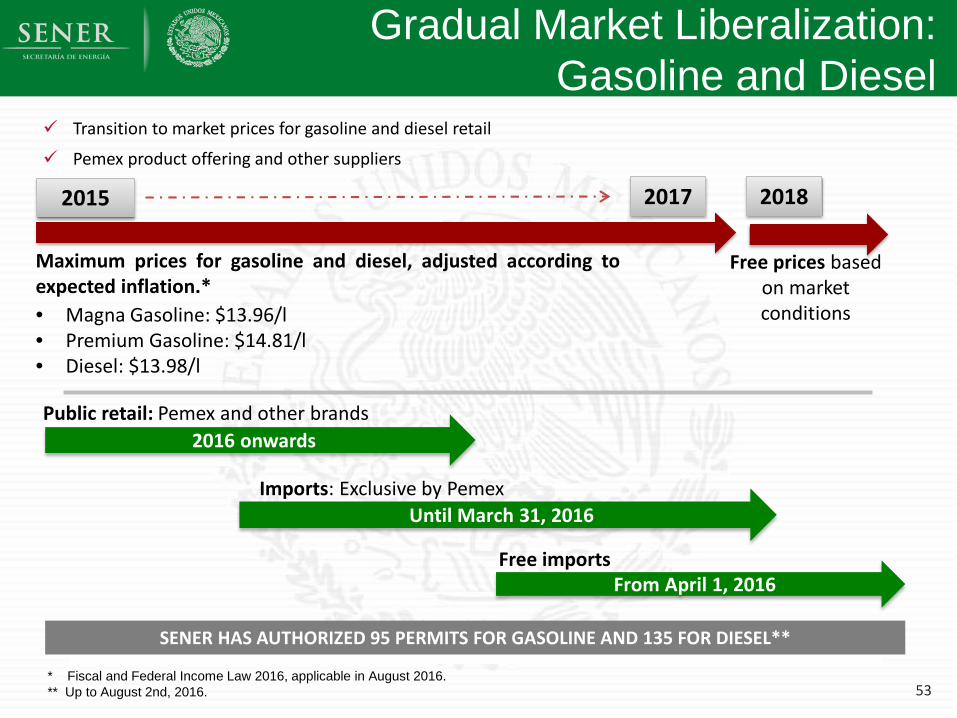
Gradual Market Liberalization:Gasoline and Diesel
Transition to market prices for gasoline and diesel retail
Pemex product offering and other suppliers
2015
* Fiscal and Federal Income Law 2016, applicable in August 2016.** Up to August 2nd, 2016.
2017 2018
Maximum prices for gasoline and diesel, adjusted according toexpected inflation.*• Magna Gasoline: $13.96/l• Premium Gasoline: $14.81/l• Diesel: $13.98/l
Free prices based on market conditions
Public retail: Pemex and other brands2016 onwards
Imports: Exclusive by PemexUntil March 31, 2016
From April 1, 2016Free imports
SENER HAS AUTHORIZED 95 PERMITS FOR GASOLINE AND 135 FOR DIESEL**

WHAT IS THE ELECTRICITY MARKET?
54
• According to the Program for the Development of the ElectricitySystem 2016-2030, Mexico will need to invest 131.6 Billiondollars in the next fifteen years.
Expected Investments 2016-2030
Total Investment (Billion dollars)Generation Transmission Distribution
98.686 15.264 17.662
Distribution13%
Generation 75%
Transmission13%

Indicative Generation Expansion Plan
• Total Clean Energy Capacity will Triple
• Clean Energy focused in Wind, Solar, and Efficient Cogeneration
• 75% growth in Combined Cycle capacity
55

WHAT IS THE ELECTRICITY MARKET?The Transmission Network will be
strenghtened in the next five years
Strengthening the network to interconnect the new power plants
56
23
5
6
1
Reinforcements.
Istmo de Tehuantepec -Valle de México.
1st HVDC Line2nd semester 2016
Cancún-Cozumel.
Angostura-Tapachula.
SE
Seri
Tijuana
Cucapah
Baja California-SIN Interconnection.2nd HVDC Line
1st semester 2017
Back to Back asynchronous link 150 MW in Nogales, Sonora-Arizona, USA.
Border Line.3rd HVDC Line
2nd semester 2017
Cumbres
Reinforcements.
Anticipating the new infrastructure required to take advantage of Clean Energy resources

Transmission investment will reduce congestion in the electric system
Network 2021Network 2015
• Through investment and expansion, the transmission network will guarantee the delivery of cheap and clean resources to the regions of high demand.
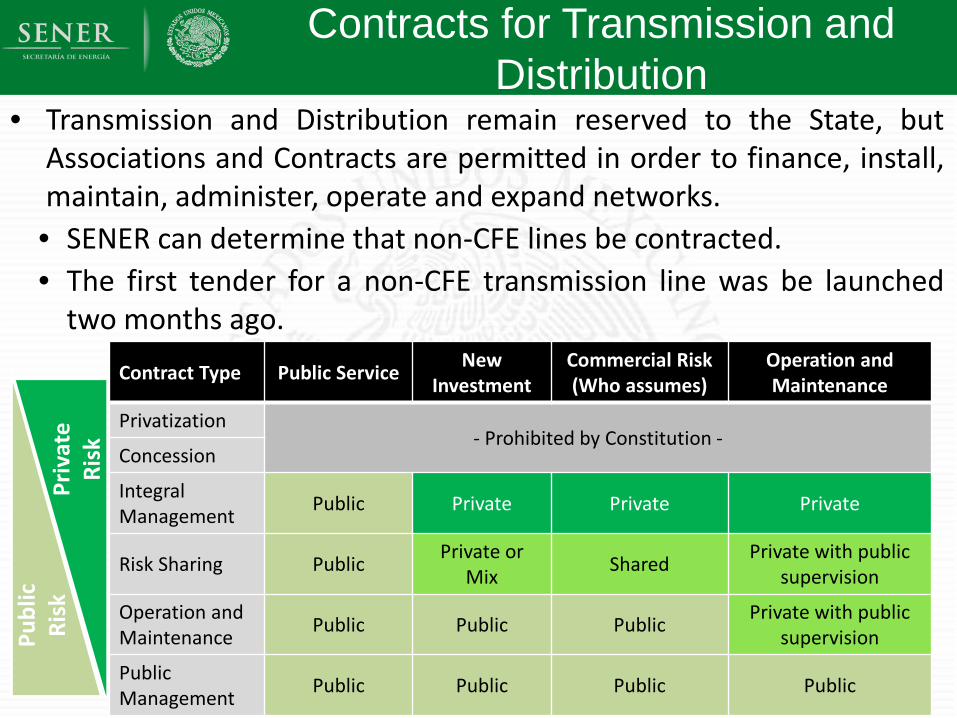
Contracts for Transmission and Distribution
• Transmission and Distribution remain reserved to the State, butAssociations and Contracts are permitted in order to finance, install,maintain, administer, operate and expand networks.• SENER can determine that non-CFE lines be contracted.• The first tender for a non-CFE transmission line was be launched
two months ago.
58
Contract Type Public Service New Investment
Commercial Risk (Who assumes)
Operation and Maintenance
Privatization- Prohibited by Constitution -
Concession
Integral Management Public Private Private Private
Risk Sharing Public Private or Mix Shared Private with public
supervision
Operation and Maintenance Public Public Public Private with public
supervision
Public Management Public Public Public Public
Publ
ic
Risk
Priv
ate
Risk

59
Calendar: Auctions and transmission lines

Transparency in the Planning Process
Complete planning database published by SENER

WHAT IS THE ELECTRICITY MARKET?Transparency in thePower Market
61
Building on the requirements in Law, the Market Rulesrequire the publication of a wide range of information
Offers and Local Marginal Prices for the Day-Ahead and Real Time Markets
Assigned quantities in the Day-Ahead and Real Time Markets
Real time information regarding demand, power plant performance and system conditions
Market results for the Capacity Market, Clean Energy Certificates Market and FTR auctions
Technical and non-technical losses assumptions used in the Wholesale Electricity Market, as well as observed data regarding such losses
Interconnection queues Opportunity cost models for hydroelectric energy Forecasts for:
aggregate level electric power demand; aggregate level generation; generation availability transmission availability
Complete Day Ahead and Real Time Market models
Complete models used to calculate start and stop instructions
National Electric System topology in a format that allows its use in common software for power system simulation
Financial Transmission Rights models
Detailed planning models
Complete calculation used for the National Electric System operating limits
List of specific contingencies considered in the security evaluation of the National Electric System
Capacity market models
Models used in the calculation of capacity zones
Scheduled outages
Public Information Market Participants and trusted entities
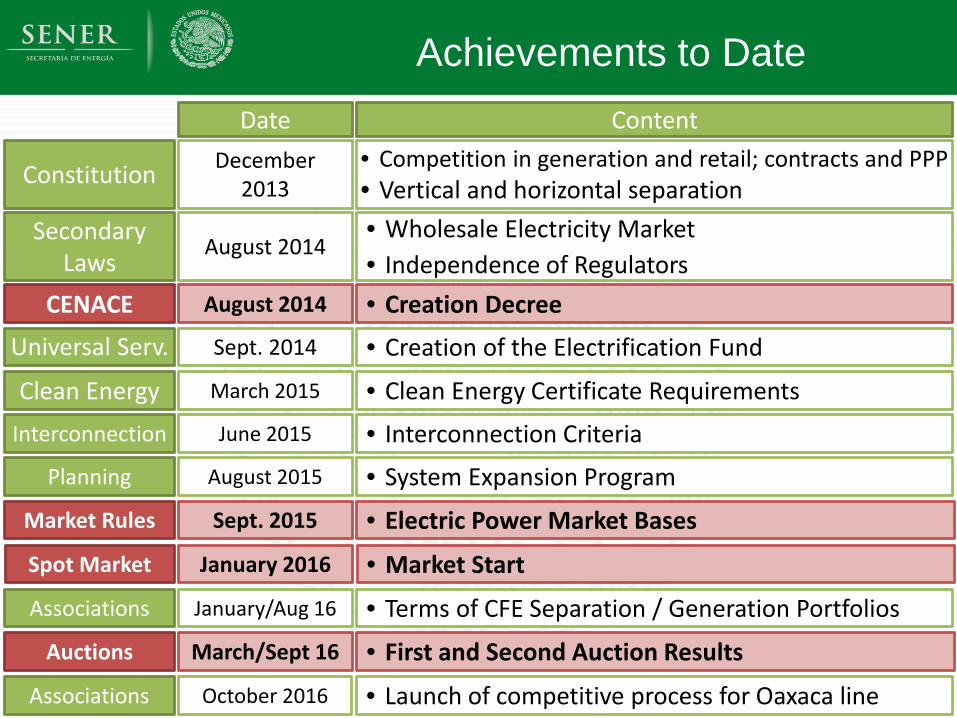
WHAT IS THE ELECTRICITY MARKET?Achievements to Date
• Competition in generation and retail; contracts and PPP• Vertical and horizontal separationConstitution
Secondary Laws
Date Content
• Wholesale Electricity Market• Independence of Regulators
December 2013
August 2014
CENACE • Creation DecreeAugust 2014
Universal Serv. • Creation of the Electrification FundSept. 2014
Interconnection • Interconnection CriteriaJune 2015
Clean Energy • Clean Energy Certificate RequirementsMarch 2015
Planning • System Expansion ProgramAugust 2015
Associations • Terms of CFE Separation / Generation PortfoliosJanuary/Aug 16
Market Rules • Electric Power Market BasesSept. 2015
Spot Market • Market StartJanuary 2016
Associations • Launch of competitive process for Oaxaca lineOctober 2016
Auctions • First and Second Auction ResultsMarch/Sept 16

Conclusions
63
• Independence of system operator• Market design and start of operations• System expansion plan and RFP for Oaxaca line• Terms of CFE separation
Milestones Reached
• Implementation of advanced market features• Auctions with more participants
• Implementation of CFE Restructuring
• Complete process for Oaxaca line contract
Next Steps
• Transparent market attracts investment• CFE adapts to compete and grow• Expansion of transmission and clean energy• CRE becomes the authority for the power market
Final Result

The Transboundary Impact on U. S. and Mexican Transactions
64

Cross-Border Interconnections
65
• Currently, Mexico-US trade occurs in two main regions:Baja California / California and Tamaulipas-Coahuila / Texas.
• 5 interconnections (1086 MW) in permanent operation.• 8 interconnections (788 MW) for emergency backup.
• In 2014, Mexico exported 1,910,238 MWh andimported 2,119,011 MWh over these interconnections.
• Additional interconnections could produce annual net savingsof 125 to 300 million dollars.
Tijuana-Miguel (CA)La Rosita-Imperial Valley (CA) Cd. Juárez-El Paso (TX)
Cd. Juárez-El Paso (TX)
Piedras Negras-Eagle Pass (TX). 36 MW.
Nuevo Laredo-Laredo (TX), 100 MW
Matamoros-Military H. (TX), 190 MWMatamoros-Brownsville (TX), 46 MW
Presa Falcón-Falcon (TX), 150 MW
800 MW
Nuevo Laredo- Laredo (TX), 100 MW.
200 MW
Cumbres-Planta Frontera (TX), 100 MWCumbres-Rail Road (TX), 150 MW
La Amistad-Amistad Dam(TX) 2 MW
Permanent operationEmergency only

Cross-Border Interconnections
66
The PRODESEN 2015-2029proposes a strongerinterconnection from NorthAmerica to Central America.
Mexico – California:• Interconnection of the National
System with Baja California (alreadyinterconnected to California)
• Pinacate-Cucapáh: 200 km• Seis de Abril-Pinacate: 205 km
• Interconnection of isolated systemson the Baja California Peninsula
Mexico – Central America:• Expansion of connection between
the Central and Southern regions ofthe National Interconnected System
• Back-to-back DC interconnectionsbetween Mexico and Guatemala

Cross-Border Transactions in the Power Market
67
Source Sink CRE Permits Market ParticipationSEN or
Foreign System
Foreign System
or SEN
No specific permit
• In any modality• Transactions in
competitive market
Standalone Foreign Plant SEN Authorization
only
• As Generator• Dispatch as any
other plant.
Foreign System Standalone Mexican Load
Authorizationonly
• Market participation not required.
StandaloneMexican Plant Foreign System Generation
Permit• Market participation
not required.
SEN StandaloneForeign Load
Authorizationonly
• In any modality• Transactions in
competitive market

Mexico's GDP will grow between 0.9 and 2.2% if electricity rates converge with US: IMF
Existing Capacity Market rules permit cross-border capacity transactions, as long as system
operators have agreed to honor the associated energy schedules. Systems will be able to reduce the need for investment in peaking plants,
taking advantage of differences in peak load hours.Energy and Ancillary Services Mexico is evaluating participation in the CAISO Imbalance Market. The co-optimization of dispatch in both systems will allow lower-cost
resources to be used more, replacing higher-cost resources.New Plants Low cost resources (geothermal and wind in Baja California, gas and wind in
Texas, wind in Tamaulipas) can be exported to load in other regions. Regional diversity will allow higher levels of intermittent resource penetration.
68
Mexico's GDP will grow between 0.9 and 2.2% if electricity rates converge with US: IMF
Regional integration will reduce costs on both sides of the border.
SENER estimates that 6000 MW of new interconnections would produce net savings of 125 to 300 million dollars per year.

Universal Electric Service Fund (FSUE)
69

• 98.53% of the national population has electricityservice.
• More than 1.8 million people do not have accessto electricity. Scattered throughout the nationalterritory, in isolated and difficult to access areas,and with different degrees of poverty.
• Of a total of 192 thousand towns, 41,697 do nothave electricity service (440 thousand homes).
• Nearly 31,000 villages have between one and twohomes only.
Fuente: Comisión Federal de Electricidad (CFE).
Mexico has a significant advance in electrification, but more than 440 thousand homes still do not have E.E.

The FSUE will make it possible to achieve universal coverage by addressing the 1.47%
The 1.5% coverage is a more difficult challenge than in the previousstages due to:
• A stronger instrument is needed in financing and moreagile and flexible in spending.
• This instrument is the FSUE.
Hence:
• Areas more distant and inaccessible.
• Unreliable information• Irregular settlements.• Unsafe zones.• More expensive provision and
with more uncertainty in recovery of investment and costs of supply.
• Unprofitable areas for suppliers.

FSUE is the social instrument of the Electric Reform and works with the contributions of the Market.
Universal Electric Service Fund (FSUE)
• Created in the Law of the Electrical Industry in 2014 *.
• Solidarity contribution of the electric industry, toreduce energy poverty.
Fundamental objective:
• Electrification of rural populations and marginalizedurban areas, providing lighting and electricity service.
* Articles 113, 114, 115, 116 and 166 of the LIE regulating FSUE.

Coverage of electrification and goals are inertial. It accelerates with FSUE
Percentage of electrified population
• Combat the inertial trend in coverage.• CHALLENGE: Universal access to electricity in the next 5 years.
FSUE challenge:
73.0%
77.5%
82.0%
86.5%
91.0%
95.5%
100.0%
1980 1990 2000 2010 2011 2012 2013 2014 2015 2016 2017 2018 2019 2020 2021 2022 2023 2024
FSUE
METAProg Sectorial
98.5%
99.0%
99.5%
100.0%
2016 2017 2018 2019 2020 2021 2022 2023 2024
Inercia
FSUE

FSUE strategy: Appropriate technical solutions
Others
Isolation
1,350,000
EstimatedPopulation
75%
Percentage
Expansion of the RGD
Component
450,000 25%Isolatedsystems*
Distance to the Distribution
Network
Minimumnumber
of homes
Up to 1 km DNA
> 1 km up to 3 km
7
> 3 km up to 5 km
12
Invitation to CFE
Instrument
Call for QualifiedExecutors
* Initially photovoltaic panels will be financed to electrify homes and eventually photovoltaic panels with Micro networks and othertechnological solutions will be used.