Embed Size (px)
Citation preview
A Prescription for Change The New Go-to-Market Model
for the Pharmaceutical Industry
Health & Life Sciences
2
Contents
Executive Summary 3
Introduction 4
Case for Change 5
The New Model 8
Market Demand: Managing for Total Value 9
Customers: Developing Value Driven Solution 10
Products: Developing Purpose Driven Approaches 11
Adherence Programs 12
Implications 13
Role of Networked Organization 15
Thoughts on Implementation 16
Summary 18
3
Executive Summary
The go-to-market model in the pharmaceutical industry is at a true inflection point; the model is no longer sustainable due to the convergence of market evolution and intense regulatory, policy and economic pressures.
The long-term viability of the healthcare market has led to outcomes overtaking a cost only perspective.
The customer demands and needs are changing; it’s not just about physicians and patients. The needs of payers and pharmacists should also be addressed.
The fear of change is great across the industry; no company wants to be perceived as the first mover and be at a market disadvantage.
Oliver Wyman’s view is that change is no longer a choice but a necessity. By any measure the existing model is seriously flawed and needs a new direction. It is time to let go of a 20th century sales model in a 21st century healthcare market.
4
The healthcare industry as a whole has changed and evolved constantly over the last five decades. From comprehensive care to the emergence of HMOs to con-
sumer directed plans and integrated health management, key players have redefined themselves to address a changing market environment. However, one segment of the healthcare market known for innovation of products has not been innovative with the business practices employed to reach the market.
Over the past 40 years, the pharmaceutical operating model has remained largely unchanged. For generations, pharmaceutical companies have embraced a traditional go-to-market approach of detailing doctors, tantamount to door-to-door sales. And while the world has changed a great deal—the invention of computers, the availabilty of overnight delivery, and landing a man on the moon—the model has remained the same. It is a situation that would make even Willy Loman proud.
In addition to the antiquated approach to direct selling, there is a confluence of fac-tors indicating that the current promotion model is not sustainable nor will it be viable in the healthcare market of tomorrow. The market is calling for a model that does a better job of reaching all of its constituencies with information and expertise that is valuable. In addition to the influence of physicians, patients are directing their care more while patients and payers both have a heightened focused on the relationship between cost and value. Meanwhile pharmacists have been filling a care management void for years but have been ignored by the industry.
So a new model must emerge—one that is focused on outcomes. To be successful it must provide major benefits to the pharmaceutical companies that must implement it. We believe that those benefits comes in the form of an expanded market and the ability to finance it with an orderly dismantling of what is not working today.
Introduction
5
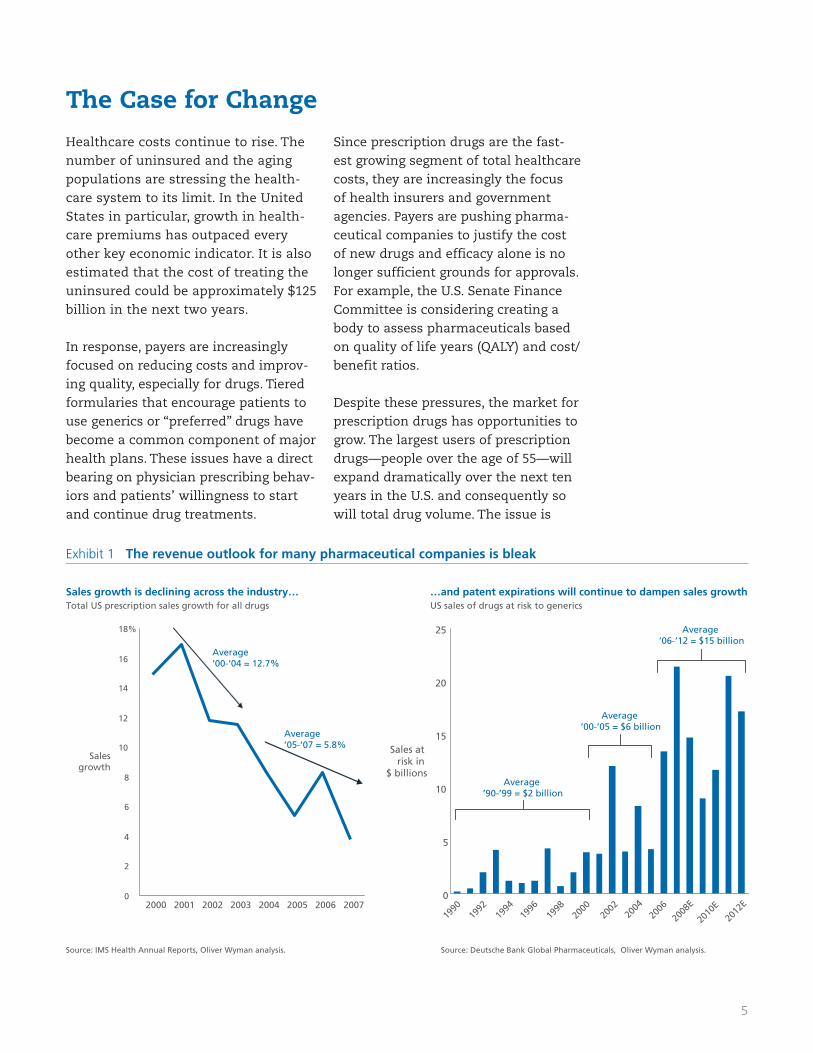
Exhibit 1 The revenue outlook for many pharmaceutical companies is bleak
Healthcare costs continue to rise. The number of uninsured and the aging populations are stressing the health-care system to its limit. In the United States in particular, growth in health-care premiums has outpaced every other key economic indicator. It is also estimated that the cost of treating the uninsured could be approximately $125 billion in the next two years.
In response, payers are increasingly focused on reducing costs and improv-ing quality, especially for drugs. Tiered formularies that encourage patients to use generics or “preferred” drugs have become a common component of major health plans. These issues have a direct bearing on physician prescribing behav-iors and patients’ willingness to start and continue drug treatments.
Since prescription drugs are the fast-est growing segment of total healthcare costs, they are increasingly the focus of health insurers and government agencies. Payers are pushing pharma-ceutical companies to justify the cost of new drugs and efficacy alone is no longer sufficient grounds for approvals. For example, the U.S. Senate Finance Committee is considering creating a body to assess pharmaceuticals based on quality of life years (QALY) and cost/benefit ratios.
Despite these pressures, the market for prescription drugs has opportunities to grow. The largest users of prescription drugs—people over the age of 55—will expand dramatically over the next ten years in the U.S. and consequently so will total drug volume. The issue is
Sales growth is declining across the industry…Total US prescription sales growth for all drugs
…and patent expirations will continue to dampen sales growth US sales of drugs at risk to generics
Average ’00-’05 = $6 billion
Average ’90-’99 = $2 billion
0
5
10
15
20
25
1990
1992
1994
1996
1998
2000
2002
2004
2006
2008
E
2010
E20
12E
Sales at risk in
$ billions
0
2
4
6
8
10
12
14
16
18%
2000 2001 2002 2003 2004 2005 2006 2007
Sales growth
Source: IMS Health Annual Reports, Oliver Wyman analysis. Source: Deutsche Bank Global Pharmaceuticals, Oliver Wyman analysis.
Average ’06-’12 = $15 billion
Average ’00-’04 = 12.7%
Average ’05-’07 = 5.8%
The Case for Change
6
whether this growth will be profitable, calling on the industry’s ability to deliver value and manage its costs.
Marketing and sales budgets are on aver-age the second-largest investment made by drug companies. In fact for most of the top companies, selling, general and administrative expenses rank above R&D as the single largest expense. But the marketplace has changed dramatically; the era of the blockbuster drug is over and the pipeline of drugs is not as robust as it once was.
The industry has been highly dependent on revenues from blockbuster drugs, which have always been the focus of most sales and marketing efforts. Add the demise of the blockbuster to the weakening of most companies’ pipelines and the out-look begins to become fairly bleak (Exhibit 1). Most organizations will not be able to replace revenues lost from expiring patents.
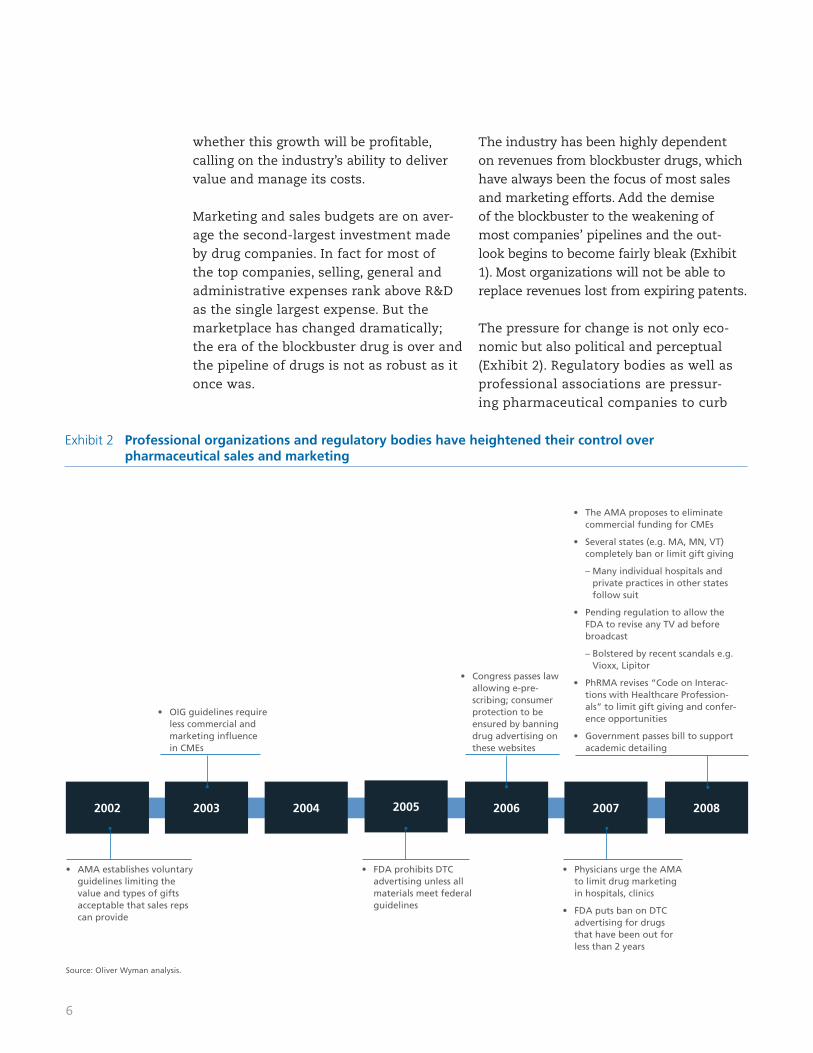
The pressure for change is not only eco-nomic but also political and perceptual (Exhibit 2). Regulatory bodies as well as professional associations are pressur-ing pharmaceutical companies to curb
Exhibit 2 Professional organizations and regulatory bodies have heightened their control over pharmaceutical sales and marketing
The AMA proposes to eliminate • commercial funding for CMEs
Several states (e.g. MA, MN, VT) • completely ban or limit gift giving
– Many individual hospitals and private practices in other states follow suit
Pending regulation to allow the • FDA to revise any TV ad before broadcast
– Bolstered by recent scandals e.g. Vioxx, Lipitor
PhRMA revises “Code on Interac-• tions with Healthcare Profession-als” to limit gift giving and confer-ence opportunities
Government passes bill to support • academic detailing
2002 2003 2004 2005 2006 2007 2008
Physicians urge the AMA • to limit drug marketing in hospitals, clinics
FDA puts ban on DTC • advertising for drugs that have been out for less than 2 years
Congress passes law • allowing e-pre-scribing; consumer protection to be ensured by banning drug advertising on these websites
FDA prohibits DTC • advertising unless all materials meet federal guidelines
OIG guidelines require • less commercial and marketing infl uence in CMEs
AMA establishes voluntary • guidelines limiting the value and types of gifts acceptable that sales reps can provide
Source: Oliver Wyman analysis.
7
gifts, continuing medical education cred-its and samples. The American Medical Association has established guidelines related to the value and types of accept-able gifts that sales representatives can offer physicians. The Food and Drug Administration is developing guidelines to restrict advertising on certain drugs and on drugs that have been in the mar-ket for less than two years. Most recent-ly the Pharmaceutical Research and Manufacturers of America is revising the “Code on Interactions with Healthcare Professionals.”
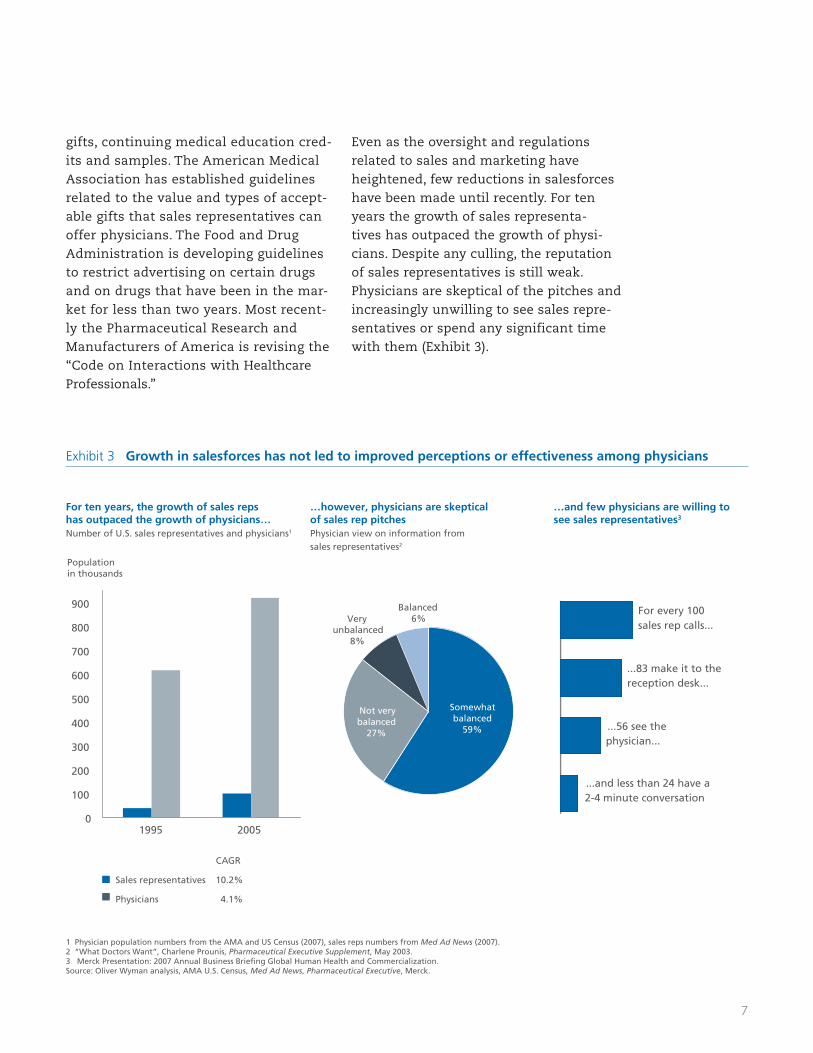
Even as the oversight and regulations related to sales and marketing have heightened, few reductions in salesforces have been made until recently. For ten years the growth of sales representa-tives has outpaced the growth of physi-cians. Despite any culling, the reputation of sales representatives is still weak. Physicians are skeptical of the pitches and increasingly unwilling to see sales repre-sentatives or spend any significant time with them (Exhibit 3).
Exhibit 3 Growth in salesforces has not led to improved perceptions or effectiveness among physicians
For ten years, the growth of sales reps has outpaced the growth of physicians…Number of U.S. sales representatives and physicians1
1 Physician population numbers from the AMA and US Census (2007), sales reps numbers from Med Ad News (2007).2 “What Doctors Want”, Charlene Prounis, Pharmaceutical Executive Supplement, May 2003. 3 Merck Presentation: 2007 Annual Business Briefing Global Human Health and Commercialization.Source: Oliver Wyman analysis, AMA U.S. Census, Med Ad News, Pharmaceutical Executive, Merck.
…however, physicians are skeptical of sales rep pitchesPhysician view on information from sales representatives2
…and few physicians are willing to see sales representatives3
10.2%Sales representatives
CAGR
4.1%Physicians
100
83
56
24
For every 100 sales rep calls...
...83 make it to the reception desk...
...56 see the physician...
...and less than 24 have a 2-4 minute conversation
0
100
200
300
400
500
600
700
800
900
1995 2005
Population in thousands
Somewhat balanced
59%
Not very balanced
27%
Very unbalanced
8%
Balanced6%
8
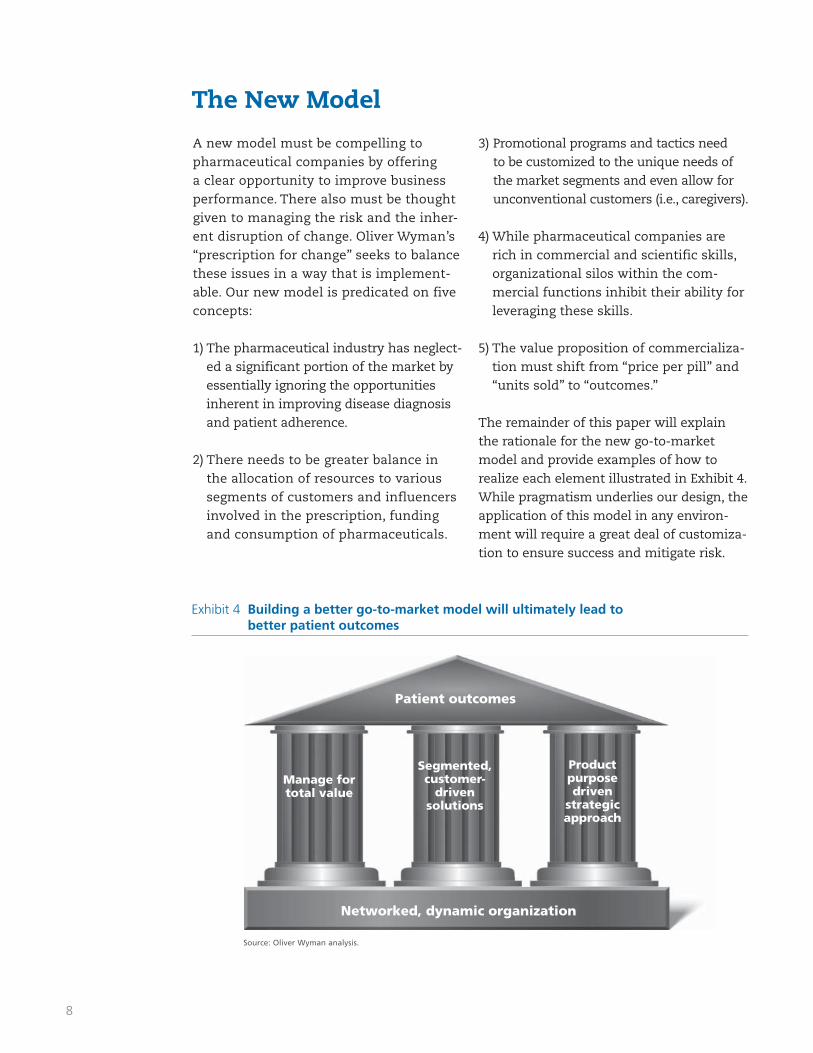
A new model must be compelling to pharmaceutical companies by offering a clear opportunity to improve business performance. There also must be thought given to managing the risk and the inher-ent disruption of change. Oliver Wyman’s “prescription for change” seeks to balance these issues in a way that is implement-able. Our new model is predicated on five concepts:
1) The pharmaceutical industry has neglect-ed a significant portion of the market by essentially ignoring the opportunities inherent in improving disease diagnosis and patient adherence.
2) There needs to be greater balance in the allocation of resources to various segments of customers and influencers involved in the prescription, funding and consumption of pharmaceuticals.
3) Promotional programs and tactics need to be customized to the unique needs of the market segments and even allow for unconventional customers (i.e., caregivers).
4) While pharmaceutical companies are rich in commercial and scientific skills, organizational silos within the com-mercial functions inhibit their ability for leveraging these skills.
5) The value proposition of commercializa-tion must shift from “price per pill” and “units sold” to “outcomes.”
The remainder of this paper will explain the rationale for the new go-to-market model and provide examples of how to realize each element illustrated in Exhibit 4. While pragmatism underlies our design, the application of this model in any environ-ment will require a great deal of customiza-tion to ensure success and mitigate risk.
The New Model
Patient outcomes
Networked, dynamic organization
Manage for total value
Segmented, customer-
drivensolutions
Product purpose driven
strategic approach
Exhibit 4 Building a better go-to-market model will ultimately lead to better patient outcomes
Source: Oliver Wyman analysis.
9
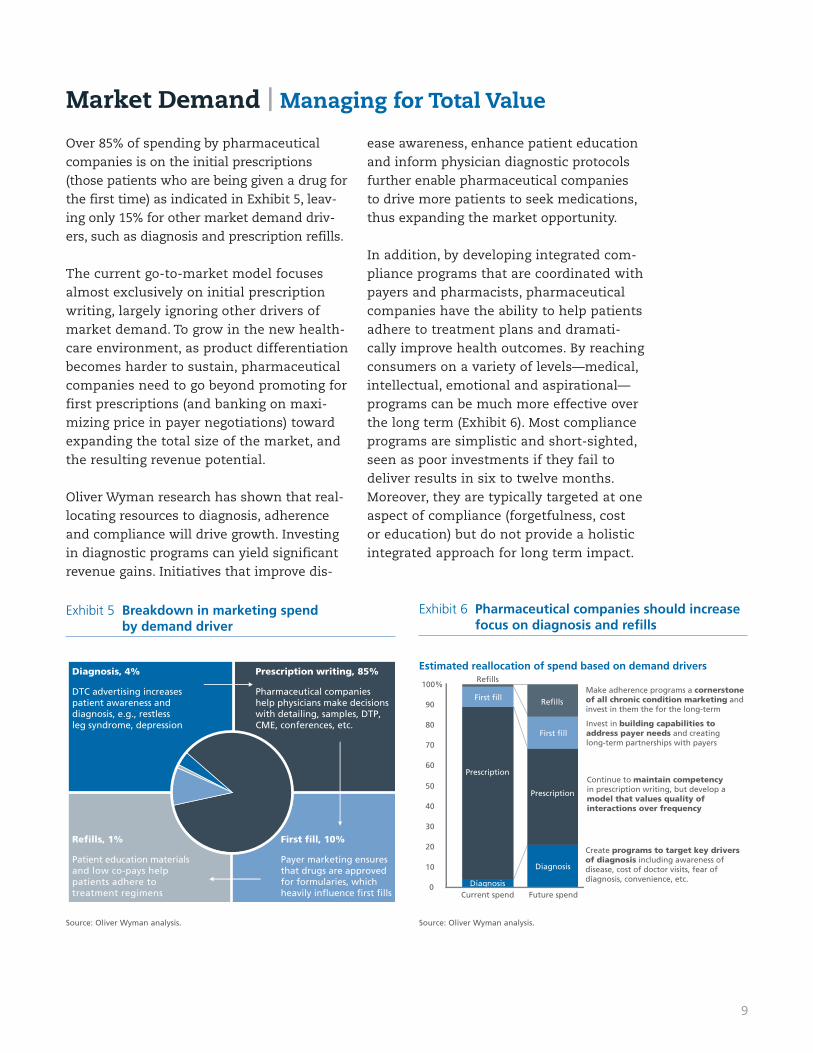
Over 85% of spending by pharmaceutical companies is on the initial prescriptions (those patients who are being given a drug for the first time) as indicated in Exhibit 5, leav-ing only 15% for other market demand driv-ers, such as diagnosis and prescription refills.
The current go-to-market model focuses almost exclusively on initial prescription writing, largely ignoring other drivers of market demand. To grow in the new health-care environment, as product differentiation becomes harder to sustain, pharmaceutical companies need to go beyond promoting for first prescriptions (and banking on maxi-mizing price in payer negotiations) toward expanding the total size of the market, and the resulting revenue potential.
Oliver Wyman research has shown that real-locating resources to diagnosis, adherence and compliance will drive growth. Investing in diagnostic programs can yield significant revenue gains. Initiatives that improve dis-
Market Demand | Managing for Total Value
Exhibit 5 Breakdown in marketing spend by demand driver
Refills, 1%
Patient education materials and low co-pays help patients adhere to treatment regimens
First fill, 10%
Payer marketing ensures that drugs are approved for formularies, which heavily influence first fills
Prescription writing, 85%
Pharmaceutical companies help physicians make decisionswith detailing, samples, DTP, CME, conferences, etc.
Diagnosis, 4%
DTC advertising increases patient awareness and diagnosis, e.g., restless leg syndrome, depression
ease awareness, enhance patient education and inform physician diagnostic protocols further enable pharmaceutical companies to drive more patients to seek medications, thus expanding the market opportunity.
In addition, by developing integrated com-pliance programs that are coordinated with payers and pharmacists, pharmaceutical companies have the ability to help patients adhere to treatment plans and dramati-cally improve health outcomes. By reaching consumers on a variety of levels—medical, intellectual, emotional and aspirational—programs can be much more effective over the long term (Exhibit 6). Most compliance programs are simplistic and short-sighted, seen as poor investments if they fail to deliver results in six to twelve months. Moreover, they are typically targeted at one aspect of compliance (forgetfulness, cost or education) but do not provide a holistic integrated approach for long term impact.
Exhibit 6 Pharmaceutical companies should increase focus on diagnosis and refi lls
Estimated reallocation of spend based on demand drivers
Prescription
First fill
First fill
Diagnosis
Refills
Diagnosis
Create programs to target key drivers of diagnosis including awareness of disease, cost of doctor visits, fear of diagnosis, convenience, etc.
Continue to maintain competency in prescription writing, but develop a model that values quality of interactions over frequency
Invest in building capabilities to address payer needs and creating long-term partnerships with payers
Make adherence programs a cornerstone of all chronic condition marketing and invest in them the for the long-term
0
10
20
30
40
50
60
70
80
90
100%
Current spend Future spend
Prescription
Refills
Source: Oliver Wyman analysis. Source: Oliver Wyman analysis.
10
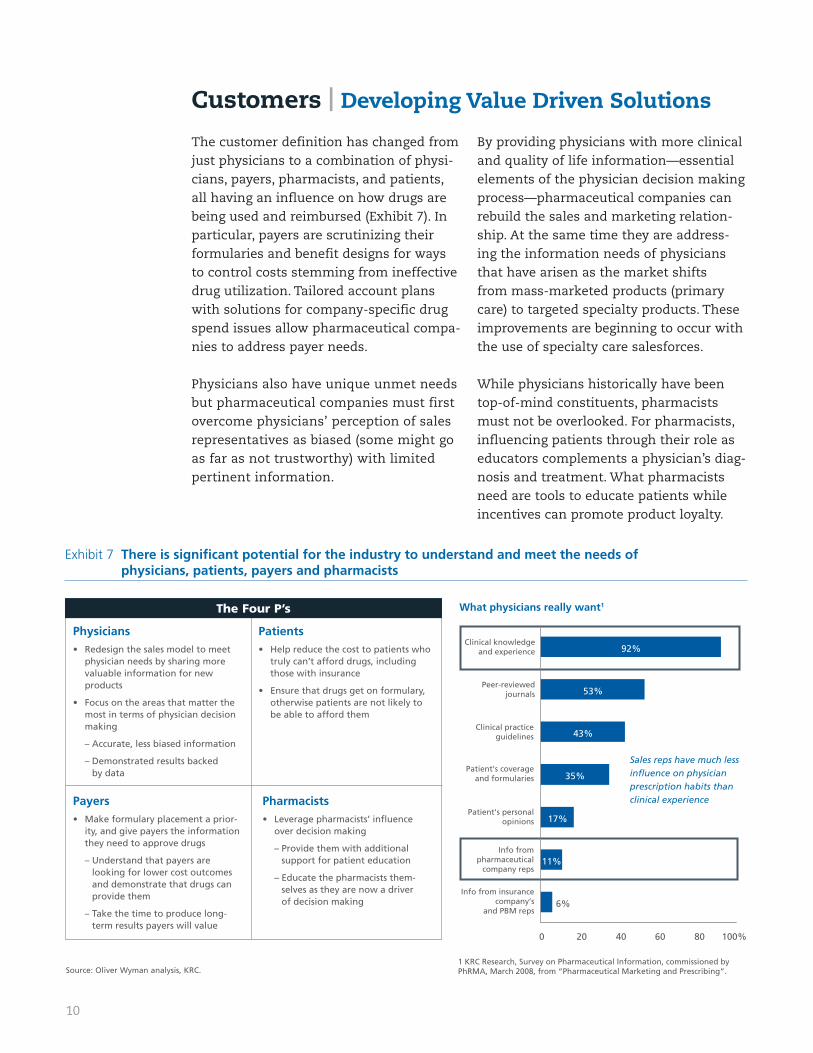
The customer definition has changed from just physicians to a combination of physi-cians, payers, pharmacists, and patients, all having an influence on how drugs are being used and reimbursed (Exhibit 7). In particular, payers are scrutinizing their formularies and benefit designs for ways to control costs stemming from ineffective drug utilization. Tailored account plans with solutions for company-specific drug spend issues allow pharmaceutical compa-nies to address payer needs.
Physicians also have unique unmet needs but pharmaceutical companies must first overcome physicians’ perception of sales representatives as biased (some might go as far as not trustworthy) with limited pertinent information.
By providing physicians with more clinical and quality of life information—essential elements of the physician decision making process—pharmaceutical companies can rebuild the sales and marketing relation-ship. At the same time they are address-ing the information needs of physicians that have arisen as the market shifts from mass-marketed products (primary care) to targeted specialty products. These improvements are beginning to occur with the use of specialty care salesforces.
While physicians historically have been top-of-mind constituents, pharmacists must not be overlooked. For pharmacists, influencing patients through their role as educators complements a physician’s diag-nosis and treatment. What pharmacists need are tools to educate patients while incentives can promote product loyalty.
Customers | Developing Value Driven Solutions
Exhibit 7 There is signifi cant potential for the industry to understand and meet the needs of physicians, patients, payers and pharmacists
Physicians Redesign the sales model to meet • physician needs by sharing more valuable information for new products
Focus on the areas that matter the • most in terms of physician decision making
– Accurate, less biased information
– Demonstrated results backed by data
The Four P’s
Patients Help reduce the cost to patients who • truly can’t afford drugs, including those with insurance
Ensure that drugs get on formulary, • otherwise patients are not likely to be able to afford them
Payers Make formulary placement a prior-• ity, and give payers the information they need to approve drugs
– Understand that payers are looking for lower cost outcomes and demonstrate that drugs can provide them
– Take the time to produce long-term results payers will value
Pharmacists Leverage pharmacists’ infl uence • over decision making
– Provide them with additional support for patient education
– Educate the pharmacists them-selves as they are now a driver of decision making
What physicians really want1
Sales reps have much less influence on physician prescription habits than clinical experience
11%
17%
35%
43%
53%
92%
6%
0 20 40 60 80 100%
Info from insurancecompany’s
and PBM reps
Info frompharmaceutical
company reps
Patient's personalopinions
Patient's coverageand formularies
Clinical practiceguidelines
Peer-reviewedjournals
Clinical knowledgeand experience
1 KRC Research, Survey on Pharmaceutical Information, commissioned by PhRMA, March 2008, from “Pharmaceutical Marketing and Prescribing”.Source: Oliver Wyman analysis, KRC.
11
Products | Developing Purpose Driven Approaches
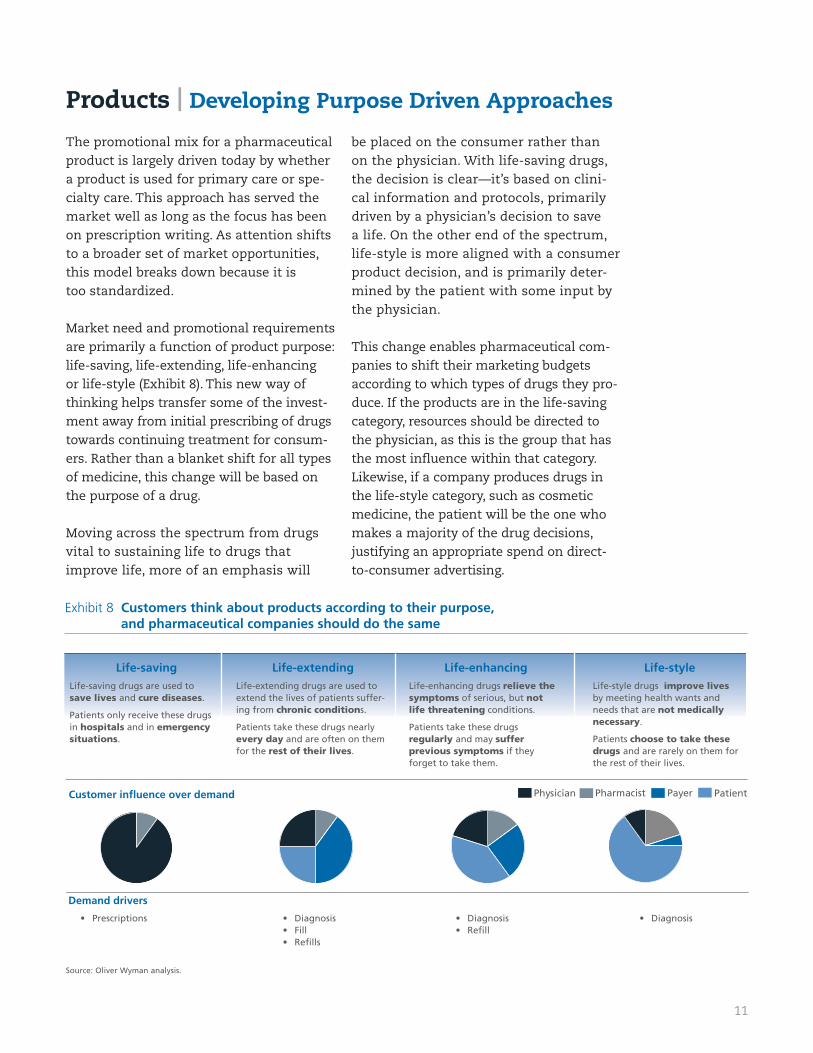
Exhibit 8 Customers think about products according to their purpose, and pharmaceutical companies should do the same
Life-savingLife-saving drugs are used to save lives and cure diseases.
Patients only receive these drugs in hospitals and in emergency situations.
Life-styleLife-style drugs improve lives by meeting health wants and needs that are not medically necessary.
Patients choose to take these drugs and are rarely on them for the rest of their lives.
Life-enhancing Life-enhancing drugs relieve the symptoms of serious, but not life threatening conditions.
Patients take these drugs regularly and may suffer previous symptoms if they forget to take them.
Life-extendingLife-extending drugs are used to extend the lives of patients suffer-ing from chronic conditions.
Patients take these drugs nearly every day and are often on them for the rest of their lives.
Customer influence over demand PatientPharmacistPhysician Payer
Demand drivers
Prescriptions• Diagnosis• Diagnosis• Refi ll•
Diagnosis• Fill • Refi lls•
The promotional mix for a pharmaceutical product is largely driven today by whether a product is used for primary care or spe-cialty care. This approach has served the market well as long as the focus has been on prescription writing. As attention shifts to a broader set of market opportunities,this model breaks down because it is too standardized.
Market need and promotional requirements are primarily a function of product purpose: life-saving, life-extending, life-enhancing or life-style (Exhibit 8). This new way of thinking helps transfer some of the invest-ment away from initial prescribing of drugs towards continuing treatment for consum-ers. Rather than a blanket shift for all types of medicine, this change will be based on the purpose of a drug.
Moving across the spectrum from drugs vital to sustaining life to drugs that improve life, more of an emphasis will
be placed on the consumer rather than on the physician. With life-saving drugs, the decision is clear—it’s based on clini-cal information and protocols, primarily driven by a physician’s decision to save a life. On the other end of the spectrum, life-style is more aligned with a consumer product decision, and is primarily deter-mined by the patient with some input by the physician.
This change enables pharmaceutical com-panies to shift their marketing budgets according to which types of drugs they pro-duce. If the products are in the life-saving category, resources should be directed to the physician, as this is the group that has the most influence within that category. Likewise, if a company produces drugs in the life-style category, such as cosmetic medicine, the patient will be the one who makes a majority of the drug decisions, justifying an appropriate spend on direct-to-consumer advertising.
Source: Oliver Wyman analysis.
12
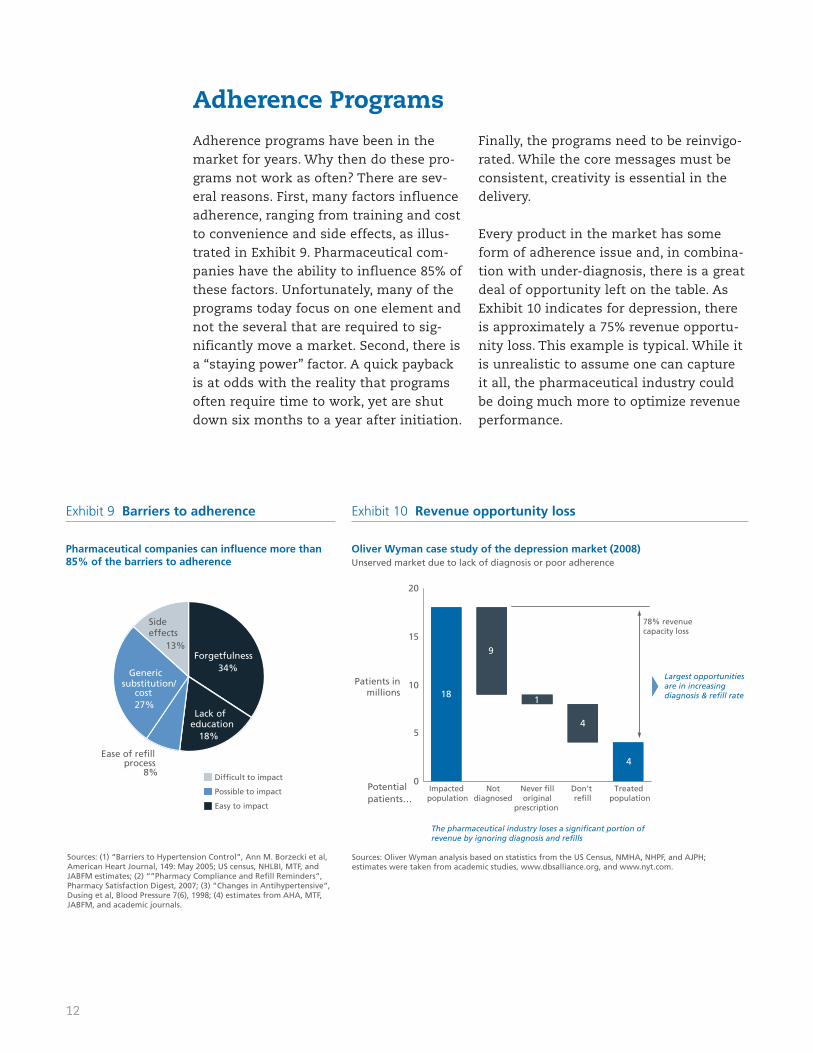
Adherence programs have been in the market for years. Why then do these pro-grams not work as often? There are sev-eral reasons. First, many factors influence adherence, ranging from training and cost to convenience and side effects, as illus-trated in Exhibit 9. Pharmaceutical com-panies have the ability to influence 85% of these factors. Unfortunately, many of the programs today focus on one element and not the several that are required to sig-nificantly move a market. Second, there is a “staying power” factor. A quick payback is at odds with the reality that programs often require time to work, yet are shut down six months to a year after initiation.
Finally, the programs need to be reinvigo-rated. While the core messages must be consistent, creativity is essential in the delivery.
Every product in the market has some form of adherence issue and, in combina-tion with under-diagnosis, there is a great deal of opportunity left on the table. As Exhibit 10 indicates for depression, there is approximately a 75% revenue opportu-nity loss. This example is typical. While it is unrealistic to assume one can capture it all, the pharmaceutical industry could be doing much more to optimize revenue performance.
Adherence Programs
Exhibit 9 Barriers to adherence Exhibit 10 Revenue opportunity loss
Pharmaceutical companies can influence more than 85% of the barriers to adherence
Sources: Oliver Wyman analysis based on statistics from the US Census, NMHA, NHPF, and AJPH; estimates were taken from academic studies, www.dbsalliance.org, and www.nyt.com.
Oliver Wyman case study of the depression market (2008)Unserved market due to lack of diagnosis or poor adherence
Sources: (1) “Barriers to Hypertension Control”, Ann M. Borzecki et al, American Heart Journal, 149: May 2005; US census, NHLBI, MTF, and JABFM estimates; (2) “”Pharmacy Compliance and Refill Reminders”, Pharmacy Satisfaction Digest, 2007; (3) ”Changes in Antihypertensive”, Dusing et al, Blood Pressure 7(6), 1998; (4) estimates from AHA, MTF, JABFM, and academic journals.
Difficult to impact
Easy to impact
Possible to impact
Lack of education
18%
Ease of refill process
8%
Side effects
13%Forgetfulness
34%Generic substitution/
cost27%
Potential patients…
Patients inmillions
78% revenue capacity loss
9
1
4
18
4
0
5
10
15
20
Impacted population
Notdiagnosed
Never filloriginal
prescription
Don't refill
Treated population
Largest opportunities are in increasing diagnosis & refill rate
The pharmaceutical industry loses a significant portion of revenue by ignoring diagnosis and refills
13
Pharmaceutical companies have been reluctant to make these changes out of fear that by being the ”first mover” they will be at a competitive disadvantage. However, the new economic climate presents a prime opportunity to make these shifts. The his-torical reluctance has arisen from the gen-erally conservative nature of the industry and the extended product development lifecycle. Most decisions that pharmaceuti-cal companies make today will not see the light of day for at least a decade.
But this reluctance and conservatism needs to be overcome. Pharmaceutical companies should first aim to cut their overall marketing and sales budget by at least 25% in order to right-size to the cur-
rent marketplace and reduce the empha-sis on the traditional physician-first prescription focus. This includes not only reduced visits by representatives to physi-cians but also a reduction in marketing those drugs that have an established track record. These changes could be accom-plished in as short a timeframe as nine months allowing for an early return of savings to the company before it proceeds to revamp the sales system.
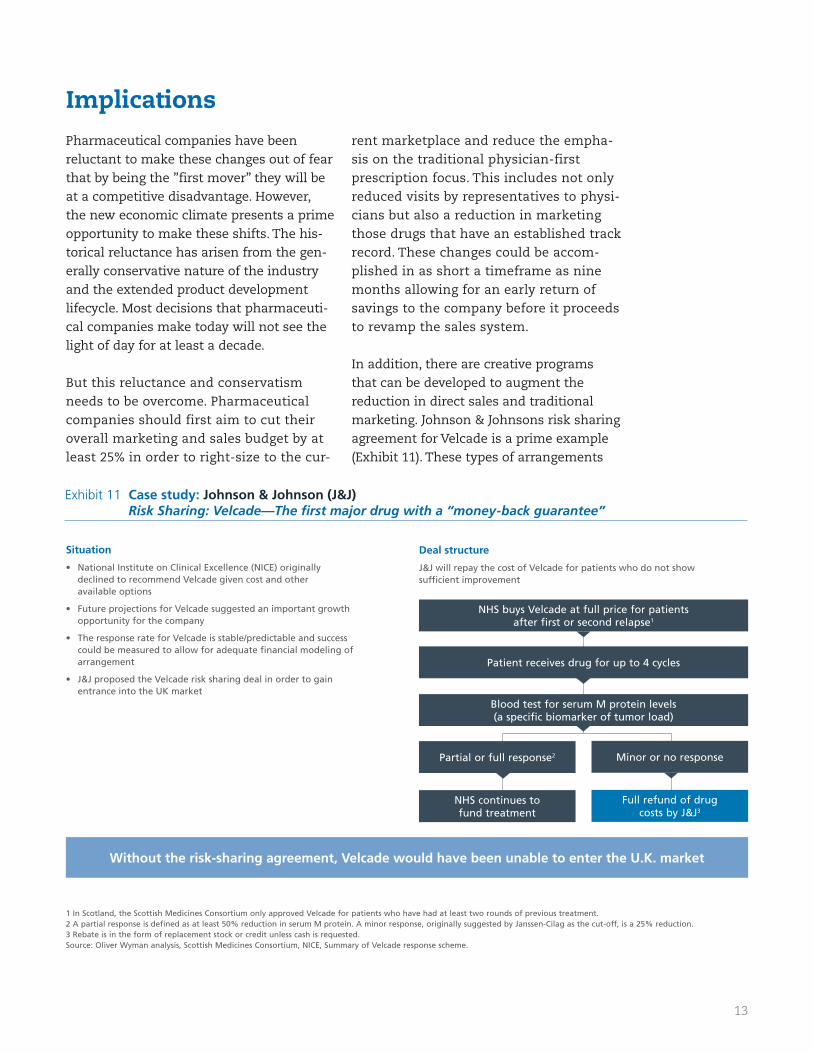
In addition, there are creative programs that can be developed to augment the reduction in direct sales and traditional marketing. Johnson & Johnsons risk sharing agreement for Velcade is a prime example (Exhibit 11). These types of arrangements
Implications
Exhibit 11 Case study: Johnson & Johnson (J&J)Risk Sharing: Velcade—The fi rst major drug with a “money-back guarantee”
Situation
National Institute on Clinical Excellence (NICE) originally • declined to recommend Velcade given cost and other available options
Future projections for Velcade suggested an important growth • opportunity for the company
The response rate for Velcade is stable/predictable and success • could be measured to allow for adequate fi nancial modeling of arrangement
J&J proposed the Velcade risk sharing deal in order to gain • entrance into the UK market
Deal structure
J&J will repay the cost of Velcade for patients who do not show suffi cient improvement
NHS buys Velcade at full price for patients after first or second relapse1
Patient receives drug for up to 4 cycles
Blood test for serum M protein levels (a specific biomarker of tumor load)
Partial or full response2 Minor or no response
NHS continues to fund treatment
Full refund of drug costs by J&J3
1 In Scotland, the Scottish Medicines Consortium only approved Velcade for patients who have had at least two rounds of previous treatment.2 A partial response is defined as at least 50% reduction in serum M protein. A minor response, originally suggested by Janssen-Cilag as the cut-off, is a 25% reduction.3 Rebate is in the form of replacement stock or credit unless cash is requested.Source: Oliver Wyman analysis, Scottish Medicines Consortium, NICE, Summary of Velcade response scheme.
Without the risk-sharing agreement, Velcade would have been unable to enter the U.K. market
14
have allowed companies to enter new mar-kets and garner critical efficacy informa-tion. Other innovative programs include supporting enrollment in Medicare for elderly patients and promoting ‘No Pay Co-Pay’ programs for people dependent on life-saving medicines. The pharmaceutical industry can build on these efforts, finding additional ways to get patients involved in their medical treatment plans.
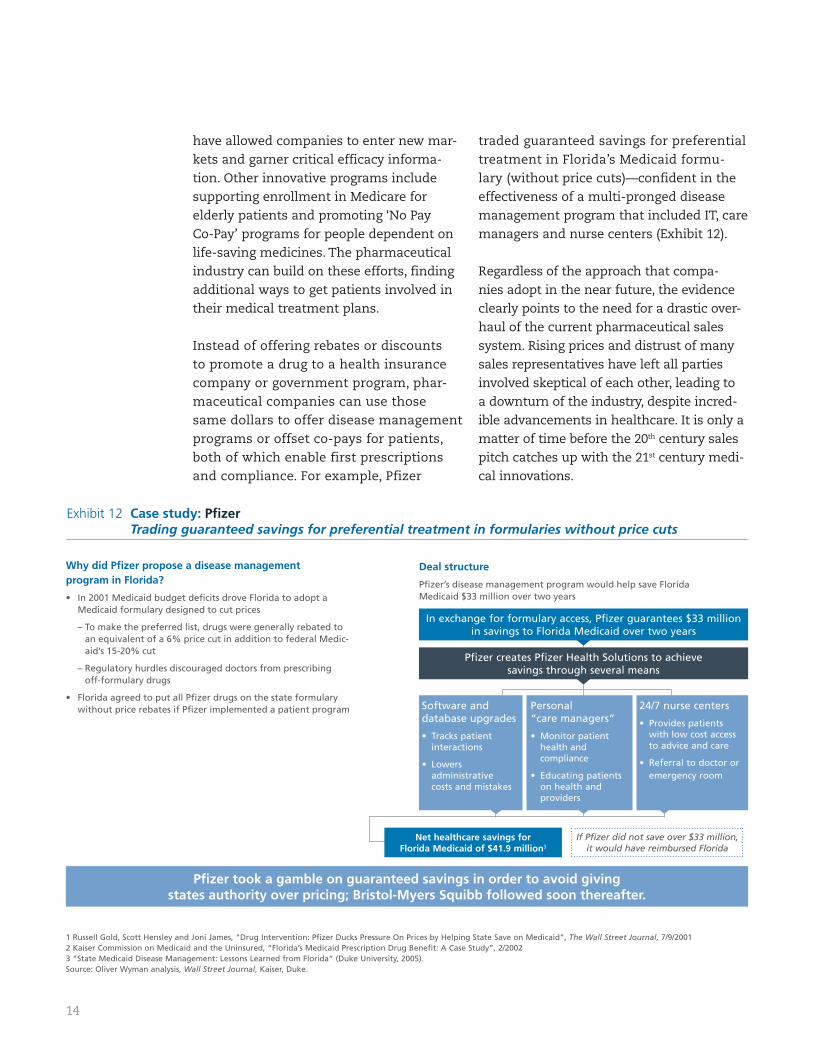
Instead of offering rebates or discounts to promote a drug to a health insurance company or government program, phar-maceutical companies can use those same dollars to offer disease management programs or offset co-pays for patients, both of which enable first prescriptions and compliance. For example, Pfizer
traded guaranteed savings for preferential treatment in Florida’s Medicaid formu-lary (without price cuts)—confident in the effectiveness of a multi-pronged disease management program that included IT, care managers and nurse centers (Exhibit 12).
Regardless of the approach that compa-nies adopt in the near future, the evidence clearly points to the need for a drastic over-haul of the current pharmaceutical sales system. Rising prices and distrust of many sales representatives have left all parties involved skeptical of each other, leading to a downturn of the industry, despite incred-ible advancements in healthcare. It is only a matter of time before the 20th century sales pitch catches up with the 21st century medi-cal innovations.
Exhibit 12 Case study: Pfi zerTrading guaranteed savings for preferential treatment in formularies without price cuts
Why did Pfi zer propose a disease management program in Florida?
In 2001 Medicaid budget defi cits drove Florida to adopt a • Medicaid formulary designed to cut prices
– To make the preferred list, drugs were generally rebated to an equivalent of a 6% price cut in addition to federal Medic-aid’s 15-20% cut
– Regulatory hurdles discouraged doctors from prescribing off-formulary drugs
Florida agreed to put all Pfi zer drugs on the state formulary • without price rebates if Pfi zer implemented a patient program
Deal structure
Pfi zer’s disease management program would help save Florida Medicaid $33 million over two years
In exchange for formulary access, Pfizer guarantees $33 million in savings to Florida Medicaid over two years
Pfizer creates Pfizer Health Solutions to achieve savings through several means
1 Russell Gold, Scott Hensley and Joni James, “Drug Intervention: Pfizer Ducks Pressure On Prices by Helping State Save on Medicaid”, The Wall Street Journal, 7/9/20012 Kaiser Commission on Medicaid and the Uninsured, “Florida’s Medicaid Prescription Drug Benefit: A Case Study”, 2/20023 “State Medicaid Disease Management: Lessons Learned from Florida” (Duke University, 2005).Source: Oliver Wyman analysis, Wall Street Journal, Kaiser, Duke.
Pfi zer took a gamble on guaranteed savings in order to avoid giving states authority over pricing; Bristol-Myers Squibb followed soon thereafter.
If Pfizer did not save over $33 million, it would have reimbursed Florida
Software and database upgrades
Tracks patient • interactions
Lowers • administrative costs and mistakes
Personal “care managers”
Monitor patient • health and compliance
Educating patients • on health and providers
24/7 nurse centers
Provides patients • with low cost access to advice and care
Referral to doctor or • emergency room
Net healthcare savings for Florida Medicaid of $41.9 million3
15
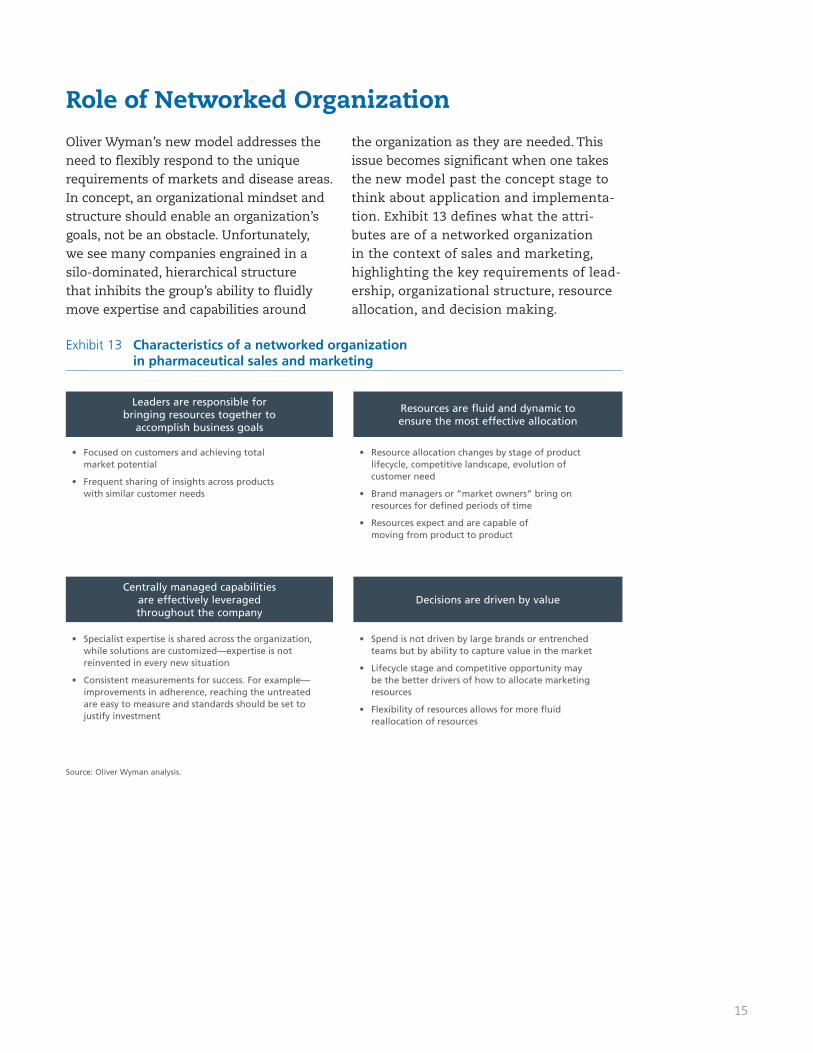
Oliver Wyman’s new model addresses the need to flexibly respond to the unique requirements of markets and disease areas. In concept, an organizational mindset and structure should enable an organization’s goals, not be an obstacle. Unfortunately, we see many companies engrained in a silo-dominated, hierarchical structure that inhibits the group’s ability to fluidly move expertise and capabilities around
the organization as they are needed. This issue becomes significant when one takes the new model past the concept stage to think about application and implementa-tion. Exhibit 13 defines what the attri-butes are of a networked organization in the context of sales and marketing, highlighting the key requirements of lead-ership, organizational structure, resource allocation, and decision making.
Role of Networked Organization
Exhibit 13 Characteristics of a networked organization in pharmaceutical sales and marketing
Resource allocation changes by stage of product • lifecycle, competitive landscape, evolution of customer need
Brand managers or “market owners” bring on • resources for defi ned periods of time
Resources expect and are capable of • moving from product to product
Focused on customers and achieving total • market potential
Frequent sharing of insights across products • with similar customer needs
Leaders are responsible for bringing resources together to
accomplish business goals
Resources are fluid and dynamic to ensure the most effective allocation
Spend is not driven by large brands or entrenched • teams but by ability to capture value in the market
Lifecycle stage and competitive opportunity may • be the better drivers of how to allocate marketing resources
Flexibility of resources allows for more fl uid • reallocation of resources
Specialist expertise is shared across the organization, • while solutions are customized—expertise is not reinvented in every new situation
Consistent measurements for success. For example—• improvements in adherence, reaching the untreated are easy to measure and standards should be set to justify investment
Centrally managed capabilities are effectively leveraged throughout the company
Decisions are driven by value
Source: Oliver Wyman analysis.
16
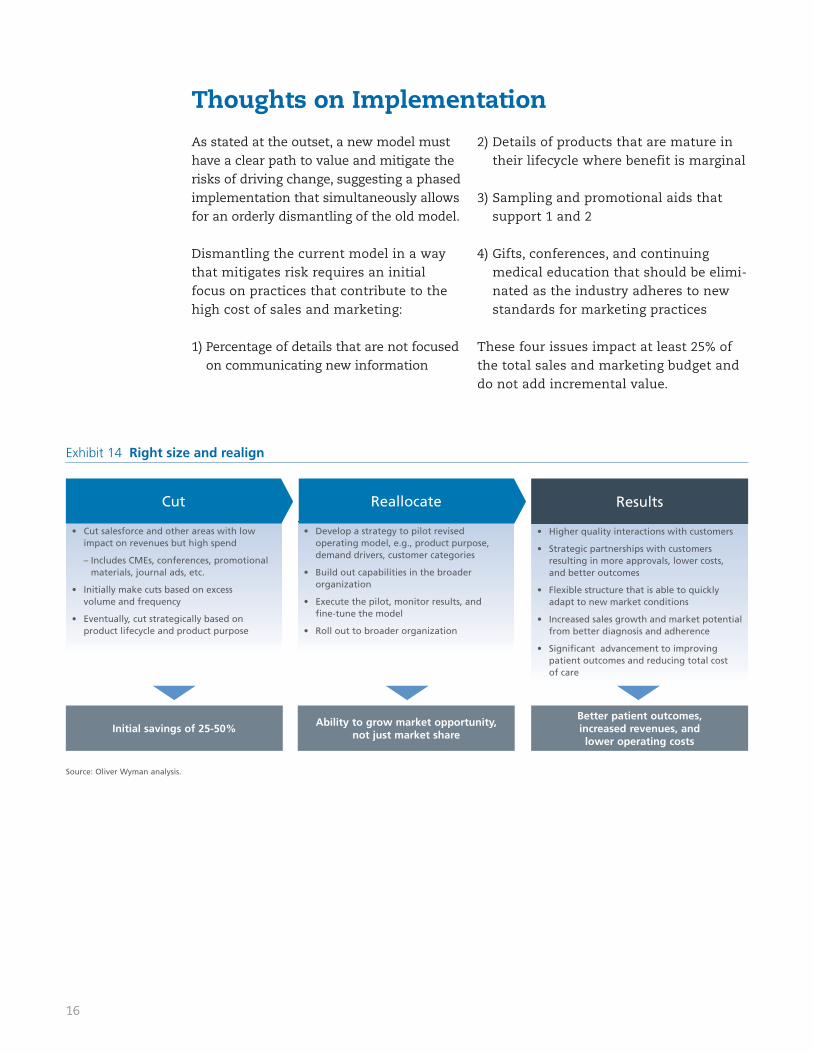
As stated at the outset, a new model must have a clear path to value and mitigate the risks of driving change, suggesting a phased implementation that simultaneously allows for an orderly dismantling of the old model.
Dismantling the current model in a way that mitigates risk requires an initial focus on practices that contribute to the high cost of sales and marketing:
1) Percentage of details that are not focused on communicating new information
2) Details of products that are mature in their lifecycle where benefit is marginal
3) Sampling and promotional aids that support 1 and 2
4) Gifts, conferences, and continuing medical education that should be elimi-nated as the industry adheres to new standards for marketing practices
These four issues impact at least 25% of the total sales and marketing budget and do not add incremental value.
Thoughts on Implementation
Exhibit 14 Right size and realign
Develop a strategy to pilot revised • operating model, e.g., product purpose, demand drivers, customer categories
Build out capabilities in the broader • organization
Execute the pilot, monitor results, and • fi ne-tune the model
Roll out to broader organization •
Cut salesforce and other areas with low • impact on revenues but high spend
– Includes CMEs, conferences, promotional materials, journal ads, etc.
Initially make cuts based on excess • volume and frequency
Eventually, cut strategically based on • product lifecycle and product purpose
Higher quality interactions with customers•
Strategic partnerships with customers • resulting in more approvals, lower costs, and better outcomes
Flexible structure that is able to quickly • adapt to new market conditions
Increased sales growth and market potential • from better diagnosis and adherence
Signifi cant advancement to improving • patient outcomes and reducing total cost of care
Initial savings of 25-50%Ability to grow market opportunity,
not just market share
Better patient outcomes, increased revenues, and lower operating costs
Cut Reallocate Results
Source: Oliver Wyman analysis.
17
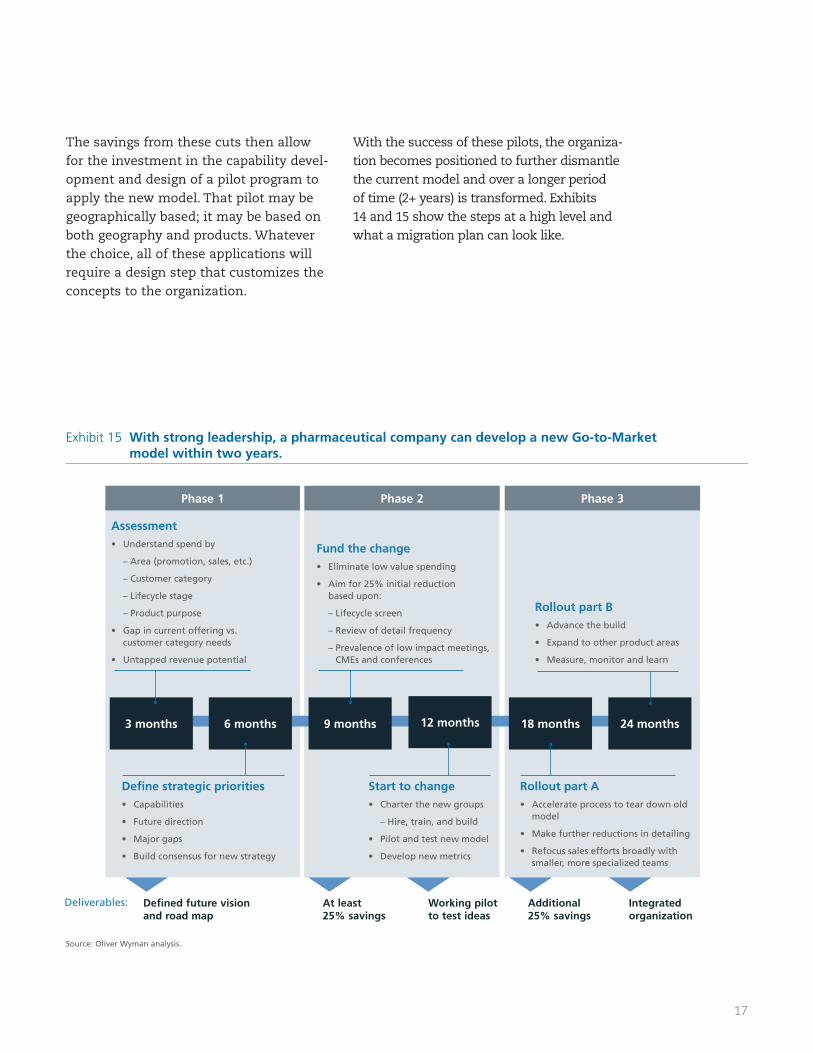
Phase 1
Exhibit 15 With strong leadership, a pharmaceutical company can develop a new Go-to-Market model within two years.
Rollout part BAdvance the build •
Expand to other product areas •
Measure, monitor and learn •
3 months 6 months 9 months 12 months 18 months 24 months
Rollout part A Accelerate process to tear down old • model
Make further reductions in detailing •
Refocus sales efforts broadly with • smaller, more specialized teams
Fund the changeEliminate low value spending•
Aim for 25% initial reduction • based upon:
– Lifecycle screen
– Review of detail frequency
– Prevalence of low impact meetings, CMEs and conferences
Start to change Charter the new groups•
– Hire, train, and build
Pilot and test new model •
Develop new metrics•
AssessmentUnderstand spend by•
– Area (promotion, sales, etc.)
– Customer category
– Lifecycle stage
– Product purpose
Gap in current offering vs. • customer category needs
Untapped revenue potential •
Defi ne strategic priorities Capabilities•
Future direction•
Major gaps•
Build consensus for new strategy •
Defined future vision and road map
At least 25% savings
Working pilot to test ideas
Additional 25% savings
Integrated organization
Deliverables:
Phase 2 Phase 3
The savings from these cuts then allow for the investment in the capability devel-opment and design of a pilot program to apply the new model. That pilot may be geographically based; it may be based on both geography and products. Whatever the choice, all of these applications will require a design step that customizes the concepts to the organization.
With the success of these pilots, the organiza-tion becomes positioned to further dismantle the current model and over a longer period of time (2+ years) is transformed. Exhibits 14 and 15 show the steps at a high level and what a migration plan can look like.
Source: Oliver Wyman analysis.
18
An industry known for innovation in sci-ence now has to innovate in the world of sales and marketing. The writing is now clearly on the wall for the pharmaceuti-cal industry to change the way it views its market and the tactics employed to reach that market. Pursuing a market approach that addresses untreated populations and adherence will open up opportunity for pharmaceutical companies as well as result in better outcomes for patients. Attention paid to other segments of cus-tomers with growing influence will result in better allocated resources and better relationships with payers and patients.
Locked in the concepts of a new model is the need to accomplish two very impor-tant goals:
Pragmatically approaching implementa-tion by an orderly attack on the waste in the existing model
Understanding how networked resourc-es and flexible capabilities meet the specific needs of a multitude of geogra-phies and markets they serve
The changes suggested by this model are transforming, yet implementation must be staged in a manner where risks to current operations are mitigated. Oliver Wyman firmly believes that the industry is now ready for the transformation and that the market clearly has been ready for these changes for a long time.
Summary
About the Authors, all of whom are members of the Health and Life Sciences practice at Oliver Wyman:
Jim Hall is a Partner in the Boston office. He has extensive experience in strate-gic planning, marketing planning, new business creation, R&D optimization and product development across the biotechnology, medical devices and pharmaceu-tical industries.
Mark Mozeson is a Partner in the New York office. He has 22 years of experience consulting to pharmaceutical and biotechnology companies and has directed numerous transformation engagements over the course of his career.
Terry Stone is a Partner in the Boston office and has worked across the payer, pharmaceutical, healthcare technology, provider and health management indus-tries. Her experience includes growth strategies, product and pricing design, sales force effectiveness, and operational performance improvement.
Elizabeth Kiernan is an Associate in the San Francisco office. She has experience consulting to health plan and pharmaceutical companies.
www.oliverwyman.com
About Oliver Wyman
With more than 2,900 professionals in over 40 cities around the globe, Oliver Wyman is an international management consulting firm that combines deep industry knowledge with specialized expertise in strategy, operations, risk management, organizational trans-formation, and leadership development. The firm helps clients optimize their businesses, improve their operations and risk profile, and accelerate their organizational performance to seize the most attractive opportunities. Oliver Wyman is part of Marsh & McLennan Companies [NYSE: MMC].
Oliver Wyman’s Health & Life Science’s practice serves clients in the pharmaceutical, biotechnology, medical devices, and payer sectors with strategic, operational, and organizational advice. Deep healthcare knowledge and capabilities allow the practice to deliver fact-based solutions.
For more information please contact:
Jim Hall, 617.424.3571, [email protected]
Mark Mozeson, 212.345.3048, [email protected]
Terry Stone, 617.424.3982, [email protected]
Copyright © Oliver Wyman. All rights reserved.