Embed Size (px)
Citation preview
This report has been prepared for the Toronto Office Coalition, March 18, 2011.
Prepared by: Canadian Urban Institute 555 Richmond St. W., Suite 402, PO Box 612 Toronto, ON M5V 3B1 Canada 416-365-0816 416-365-0650 [email protected] http://www.canurb.org
The New Geography of Office Location
and the Consequences of
Business as Usual in the GTA March 2011
This report has been prepared for the Toronto Office Coalition, March 18, 2011.
Research Team:
Canadian Urban Institute
Glenn R. Miller, Vice President, Education & Research, FCIP, RPP
Iain Myrans, Senior Planner, MCIP, RPP
Juan Carlos Molina, Geospatial Analyst, MSA
Thomas Sullivan, GIS & Policy Analyst, B Sc
Danielle Berger, GIS Research Assistant
Mike Dror, GIS Research Assistant
Real Estate Search Corporation
Iain Dobson, Principal & Senior Associate, Canadian Urban Institute
Hammersmith Communications
Philippa Campsie, Principal & Senior Associate, Canadian Urban Institute
All photography in this document by Iain Myrans.
Canadian Urban Institute
Contents
Executive Summary .......................................................................................................................................... 1
Summary of Recommendations.............................................................................................................. 7
1. Business Competitiveness in the GTA, Five Years On............................................................................. 9
2. Changes and trends since 2005 .............................................................................................................. 10
The Difference Between Intensified Office Employment and Other Forms Of Employment ............ 10
City of Toronto: Little Progress on the Agenda for Prosperity ............................................................. 12
The City of Toronto's Dependence on the Financial Services Sector ................................................ 13
Tax Differentials Still Create Inequities, But Change is Slow and Difficult to Achieve ..................... 14
Congestion is Currently the Biggest Threat to Competitiveness ........................................................ 15
The Transfer of Risk from Entrepreneurs to Institutional Developers Affects Development
Decisions ............................................................................................................................................... 16
Amenities that Attract and Retain Talent are Unevenly Distributed in the Region ........................... 16
Demand for “Green” Development is Growing ................................................................................... 17
Other Developments Since 2005 ........................................................................................................ 18
3. Change in the Geography of Offices since the 1950s .......................................................................... 18
Pre-1950 Distribution ........................................................................................................................... 19
1950-1980 ............................................................................................................................................ 20
1980s-1990s ........................................................................................................................................ 21
2000-2010 ............................................................................................................................................ 22
4. Realty Taxes: a Situation Largely at a Standstill ................................................................................... 25
Ontario‟s 2007 Plan to Balance Business Education Tax .................................................................. 25
The Toronto-Regional Tax Imbalance .................................................................................................. 25
Rebalancing the Commercial-Residential Tax Burden ....................................................................... 26
Caps and Clawbacks in the Commercial Sector ................................................................................. 28
5. The Consequences of Business-As-Usual Approaches ......................................................................... 29
The Financial Core ................................................................................................................................ 31
Toronto Transit-Oriented Office Clusters ............................................................................................. 33
Toronto Non-Transit Office Clusters ..................................................................................................... 35
Suburban Car-Dependent Office Clusters ........................................................................................... 37
6. Recommendations: Supporting Competitiveness in the GTA ............................................................. 41
Works Cited ...................................................................................................................................................... 45
Appendix 1: Large Format Maps .................................................................................................................. 46
Canadian Urban Institute
List of Figures
Figure 1 - Urban Growth Centres Relative to Office Floor Space in the GTA ......................................... 11
Figure 2 - Geographic Distribution of Office Space by Employment Sector .......................................... 14
Figure 3 - Change in Employment Sectors Over-Time ............................................................................ 19
Figure 4 - Office Space Distribution, 1950 .............................................................................................. 20
Figure 5 - Office Space Distribution, 1980 .............................................................................................. 21
Figure 6 - Office Space Distribution, 1999 .............................................................................................. 22
Figure 7 - Office Space Distribution, 2010 .............................................................................................. 24
Figure 8 - Realty Tax Differential between Toronto and the Rest of the Region, 2004-2009 ............. 26
Figure 9 - Tax Levy Increases Relative to Assessment Base Growth, Toronto 2003-2007 ................. 27
Figure 10 - Commercial Office Space Growth, 1965-2010 ................................................................... 29
Figure 11 - Downtown Toronto Block Redevelopment, 2002-2010 ...................................................... 30
Figure 12 - Office Space in the Financial Core ........................................................................................ 31
Figure 13 - Toronto Transit-Oriented Submarket .................................................................................... 34
Figure 14 - Toronto “Non-Transit” Submarket ........................................................................................ 36
Figure 15 - The Suburban Municipalities - the 905 ................................................................................ 38
Figure 16 - Shangri-la development on University Avenue ..................................................................... 39
List of Tables
Table 1 - Commercial Office Tax Ratios ................................................................................................... 27
Table 2 - Impact of Moving to Full CVA Taxes (eliminating caps & clawbacks) .................................... 28
Canadian Urban Institute - Page | 1
Executive Summary
One-third of all the jobs in the Greater Toronto Area (GTA) are office jobs, and growth in office
employment is essential for the regional economy. Competitiveness in the office sector has three
main components:
a choice of locations that are cost-effective, accessible, and appropriate for the particular
type of business and the needs of employees;
a working environment (both within the office itself and in the surrounding area) that will
attract and retain workers with the necessary skills;
the ability to add new floor space in a relatively short period of time to meet growing demand.
The office sector has changed dramatically over the past few decades. Thirty years ago, office
employment was heavily concentrated in Toronto's downtown core, which housed a wide range of
businesses, from engineering offices to publishing firms to the head offices of manufacturing
companies to financial and legal services.
Today, the office landscape is very different. Only about 20% of the region‟s office capacity is in
Toronto‟s downtown core, and the downtown has a much narrower range of types of business. The
head offices, publishing firms, and engineering companies have largely moved out to suburban
areas, sometimes elsewhere in the City of Toronto, but mostly in the “905” region. For the most part,
what remains are businesses in or affiliated with the financial services sector. The GTA as a whole
recently passed the milestone of 200,000,000 sq ft of built office space, making it one of only four
such regions in North America. Thirty years ago, 63% of the region's office space was located in the
Financial District or directly on subway lines. In 2010, that has changed and the majority of office
space (54%) is located beyond the reach of higher-order transit. This may be the most significant
change to the geography of the region since the mid-1970s, when some major institutions relocated
from Montréal to Toronto.
The emergence of the 905 as a significant factor in the competitiveness of office clusters in the last
30 years has resulted in a new geography, consisting of four submarkets. These submarkets have
been shaped by a combination of disruptive differentials in commercial tax rates between 416 and
905; stark differences across the region in terms of land use policy; and decades of under-
investment in public transit:
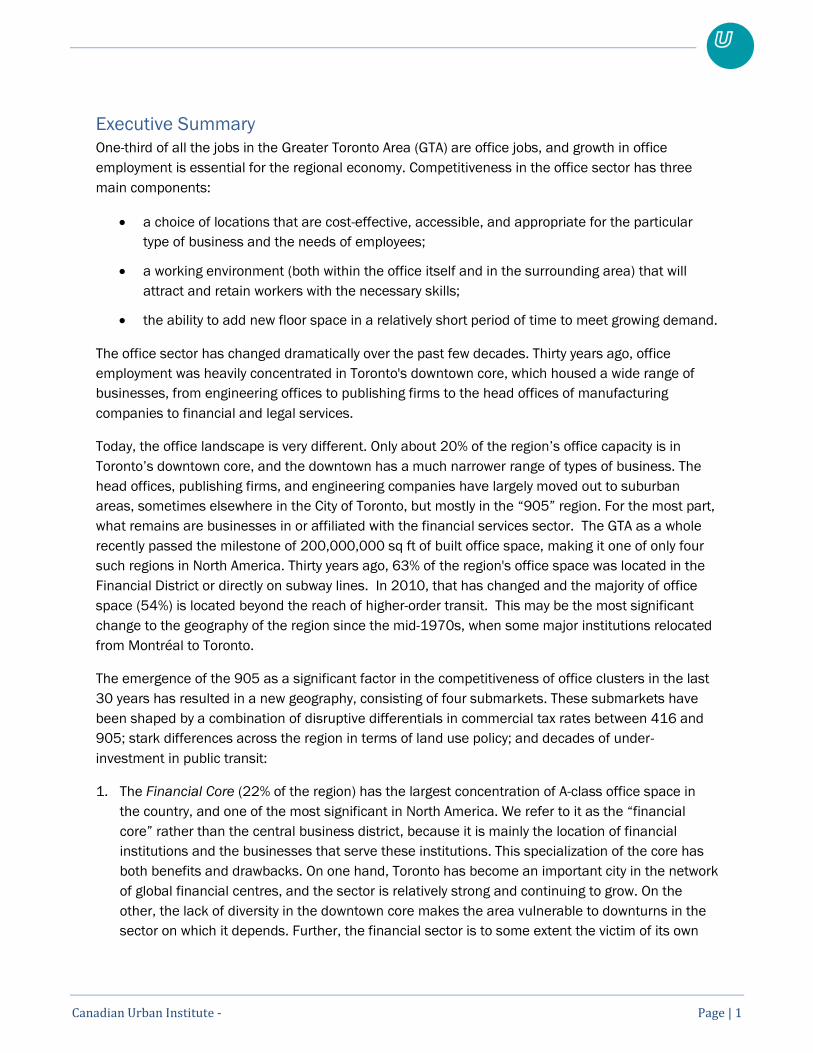
1. The Financial Core (22% of the region) has the largest concentration of A-class office space in
the country, and one of the most significant in North America. We refer to it as the “financial
core” rather than the central business district, because it is mainly the location of financial
institutions and the businesses that serve these institutions. This specialization of the core has
both benefits and drawbacks. On one hand, Toronto has become an important city in the network
of global financial centres, and the sector is relatively strong and continuing to grow. On the
other, the lack of diversity in the downtown core makes the area vulnerable to downturns in the
sector on which it depends. Further, the financial sector is to some extent the victim of its own
Canadian Urban Institute - Page | 2
stability and success; it has been largely taken for granted as a driver of growth and prosperity
and does not benefit from government support or special programs to help maintain its global
status. Although a report prepared for the Toronto Financial Services Alliance by the Boston
Consulting Group (2009) stated that the sector ought to add 40,000 new jobs, there is no
accompanying strategy to create the office space (approximately 8 million sq ft) needed to
accommodate these jobs within the financial district.
See Appendix 1 for enlargements
Canadian Urban Institute - Page | 3
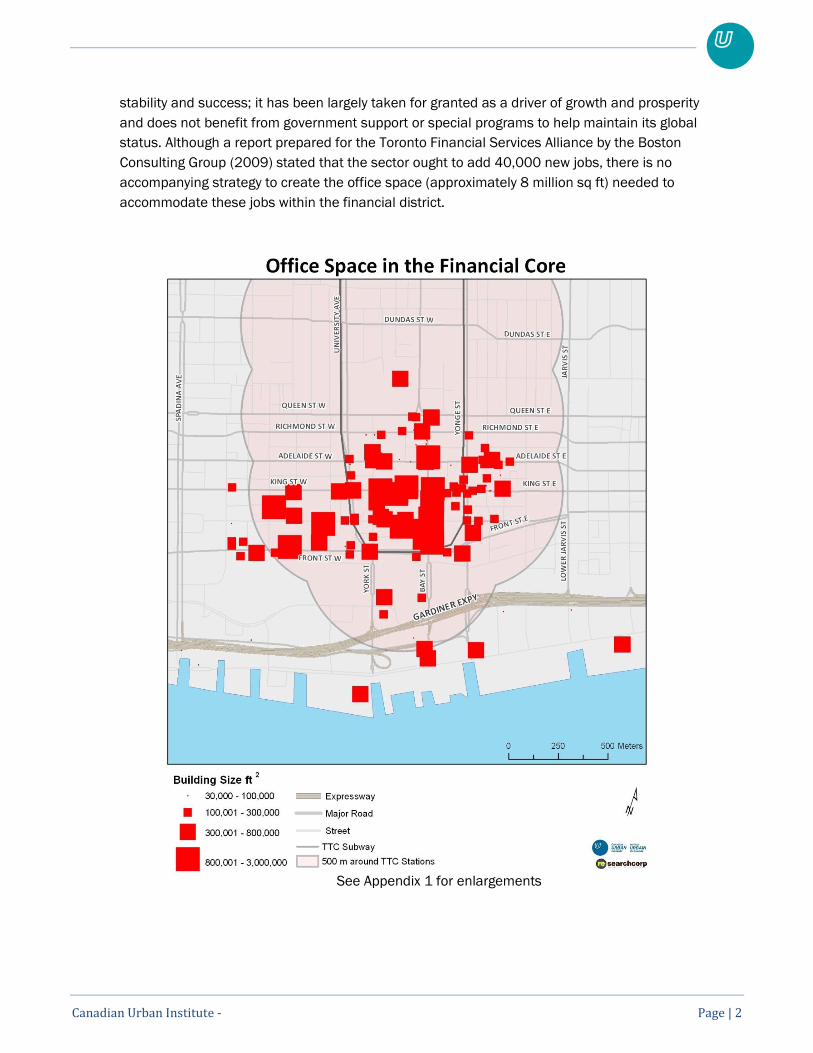
2. The Toronto transit-oriented submarket (24% of the region) has many of the same attributes as
the financial core in terms of access to higher-order transit, dining, culture, educational and
recreational amenities, but in a secondary location. This market includes a range of office
buildings with easy access to rapid transit, located along the Yonge Street subway as far as North
York and adjacent to the University Avenue subway as far as Bloor Street, as well as a small part
of the “Brick and Beam” buildings located east and west of the Financial District and newer sites
south of Union Station. Many areas of this sub-market - most notably midtown - have not seen
significant growth in 30 years. Growth has occurred in the Brick and Beam areas, some in North
York and some on the Waterfront. Significant attention needs to be paid to creating the
conditions under which this submarket is able to expand.
Canadian Urban Institute - Page | 4
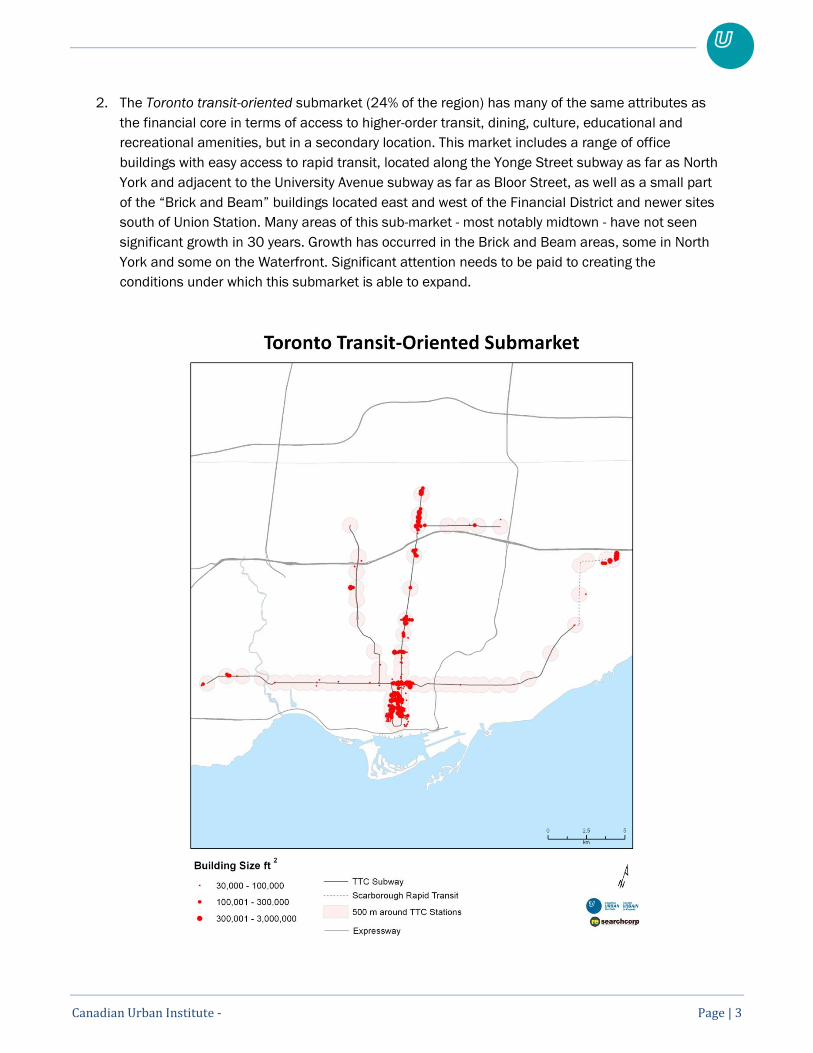
3. The Toronto non-transit submarket (21% of the region) evolved in the 1970s and 1980s and has
remained effectively unchanged since then. Areas like Don Mills, Scarborough and Etobicoke
grew rapidly in advance of the conversion of industrial parks on the 400-series highways. With
the exception of the Brick and Beam districts, which came online in the 1990s as a result of
radical changes in planning policy, this 45-million ft2 submarket has effectively been stalled for
more than 20 years. Few tenants looking to relocate consider these areas as viable options,
particularly in sufficient numbers to justify new construction. Many office buildings in these areas
have since been converted to residential use. Highway and arterial road congestion, the absence
of higher-order transit, tax rates twice as high as suburban markets and the continued spread of
the labour force beyond the City of Toronto have all contributed to the lack of competitiveness in
this area.
Canadian Urban Institute - Page | 5
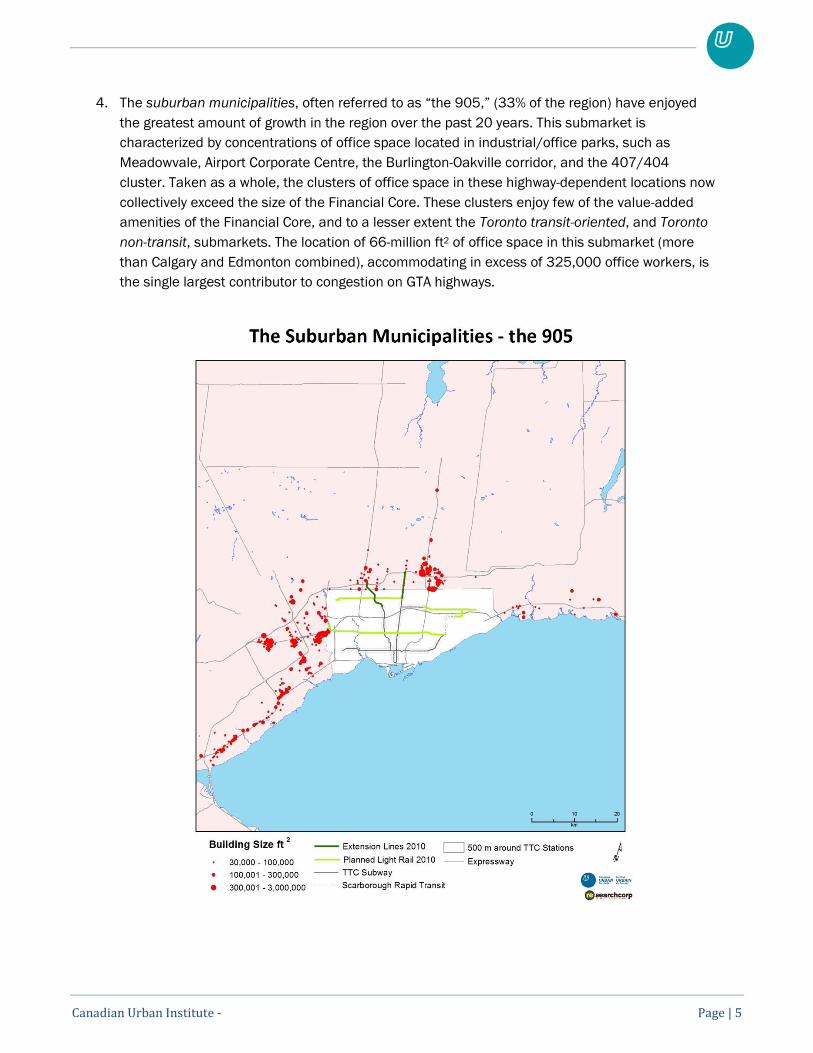
4. The suburban municipalities, often referred to as “the 905,” (33% of the region) have enjoyed
the greatest amount of growth in the region over the past 20 years. This submarket is
characterized by concentrations of office space located in industrial/office parks, such as
Meadowvale, Airport Corporate Centre, the Burlington-Oakville corridor, and the 407/404
cluster. Taken as a whole, the clusters of office space in these highway-dependent locations now
collectively exceed the size of the Financial Core. These clusters enjoy few of the value-added
amenities of the Financial Core, and to a lesser extent the Toronto transit-oriented, and Toronto
non-transit, submarkets. The location of 66-million ft2 of office space in this submarket (more
than Calgary and Edmonton combined), accommodating in excess of 325,000 office workers, is
the single largest contributor to congestion on GTA highways.
Canadian Urban Institute - Page | 6
Over time, the momentum of growth has shifted to the 905, as developers and tenants responded to
the tax differential between Toronto and surrounding suburbs, and the ease of creating office
developments in a timely manner by selecting locations that best meet their diverse needs. This
transition has occurred because of land use and tax policies that have made it harder and more
expensive to add new flexible office space in the core. At the same time, in a trend that has
accelerated over the past decade, the number of sites suitable and available for office development
in the core has shrunk dramatically, in contrast to the 905 where approval timeframes are quicker,
and where sites are available in abundance and less constrained in terms of construction
challenges.
The land use policies of documents such as Places to Grow are unlikely to make much difference to
this pattern, as they are intended to focus development in intensification areas that do not coincide
with current clusters of office space. Furthermore, property tax policies continue to incent the
development of commercial space outside the City of Toronto.
Businesses of all kinds need space in which to grow. In the current policy environment, and despite
the recent creation of some new office buildings in downtown Toronto after years of inactivity, most
businesses see that opportunity in the GTA‟s suburbs, not in the City of Toronto.
Policies are needed that will attract both established and start-up businesses to locate in areas close
to transit and urban amenities. This happened in the 1990s when the City of Toronto opened up the
“Kings” (King-Spadina and King-Parliament areas) to development, which resulted in the
rehabilitation of heritage buildings and the conversion of former industrial buildings to accommodate
the creation of millions of square feet of new office space. Similar initiatives in other areas could
support sustainable growth in office space and office employment, without contributing further to
road congestion.
Notwithstanding the recent construction of new office towers in downtown Toronto, the momentum
of job growth in the region is into locations that are almost completely dependent on the automobile.
The resulting impact of traffic congestion on longer commuting times and lost productivity seriously
affects the quality of working life for a large number of GTA residents.
The long-term impacts of business-as-usual trends need to be acknowledged as a competitive threat.
Close to 108 million ft2 of office space is located beyond the reach of higher-order transit at present,
and following the implementation of current transit plans, approximately 98 million ft2 will still be
beyond the reach of higher-order transit1. This problem must be addressed to protect the long-term
competitiveness of the region.
The economic fortunes of a region‟s core and the rest of the region are inextricably intertwined. A
strong core will stimulate the region, just as success in the suburbs can benefit the core. Accordingly,
this study sets out a rationale for addressing the strengths and weaknesses in the four distinct
submarkets in GTA in ways that help improve their interconnectedness - and, by extension, the
competitiveness of the Greater Toronto Area employment market as a whole.
1 The precise amount depends on assumptions regarding walking distance from higher order transit.
Canadian Urban Institute - Page | 7
Summary of Recommendations
The study makes the following recommendations aimed at facilitating a more competitive
environment for GTA office employment across all four submarkets defined in the report, and the
development sector that supports it.
General Recommendations Related to The Region’s Competitiveness
1. The gap between high commercial realty taxes and low residential tax rates in the City of
Toronto must be narrowed. The City recognized this in 2005 and has begun the process. This
process should be accelerated.
2. Tax and land use policy must recognize that office jobs are the only form of high density
employment, representing more than one third of all jobs (estimated at 1 million jobs) in the
region. Steps need to be taken to modify public policy to create a competitive environment
for office development in all four sub-markets identified in this report.
3. The Growth Plan should be amended to recognize that significant concentrations of office
space exist outside of the designated Growth Centres, and need to be integrated into the
strategy for creating Growth Centres.
4. The province should work with local municipalities in the GTA to adjust priorities and fine
tune the planned roll-out of rapid transit projects to better connect to approximately 108
million square feet of office space that is currently dependent on automobile access2.
5. The province should create the legislation necessary to require binding commitments for
transit-supportive development along transportation corridors in advance of transit
construction.
Protecting and Enhancing the Primacy of Toronto’s Financial Core
6. The City of Toronto, supported by the Province of Ontario, should explicitly acknowledge the
primacy and key role played by the Financial Core beyond statements in the Official Plan and
take the steps to identify and designate, through new zoning and other planning initiatives,
office building development sites to ensure an adequate long-term supply of high quality,
transit-oriented sites for future development.
7. The City of Toronto and the province should work to accelerate the progress towards
balancing the commercial tax burden and making commercial property taxes more
competitive in Toronto‟s commercial sector.
8. The City of Toronto is at present heavily dependent on a single major employment sector -
Financial Services; it is paramount that steps be taken to enhance and foster the continued
prosperity of this sector in order to ensure the economic health and future competitiveness
of the region.
2 The precise amount depends on assumptions regarding walking distance from higher order transit.
Canadian Urban Institute - Page | 8
Reinforcing the Attractiveness of Toronto’s Transit-Oriented Submarket
9. The City of Toronto should encourage high-intensity office development along the existing
subway system by re-evaluating land use policy within a five-minute walk of subway stations
and designating sites appropriate for office employment development.
10. Land use policy and the development approvals process for the creation of office buildings
must acknowledge that the maximum time for employers to make a commitment to new
facilities through to occupancy is three years.
Re-evaluating Development Priorities in Toronto’s Non-Transit Submarket
11. Relying on the successful precedent in “the Kings” (otherwise known as the "Brick and
Beam" districts either side of the financial core), the City of Toronto should focus on creating
better value for existing and new investors by planning for a variety of new, high-intensity,
multi-function uses in the Toronto non-transit submarket compatible with existing office
buildings which take advantage of existing or proposed infrastructure investments.
12. As part of the upcoming Official Plan Review, the City of Toronto should consider expanding
the range of permitted uses in selected employment areas while increasing opportunities for
office development in others.
13. The City of Toronto should recognize that prime development land currently being absorbed
by residential condominium builders must be balanced by a similar designation for office
building intensification in corridors where future higher-order transit is planned.
Consolidating the Strengths and Reinforcing the Long-Term Viability of Suburban Car-dependent
Office Clusters
14. Working collaboratively with affected municipalities, the Province of Ontario should amend its
Provincial Policy Statement (currently under review) to preclude the development of
additional suburban office sites that do not fall within existing “suburban office nodes.”
15. In the spirit of intensification advocated in the provincial Growth Plan, suburban
municipalities should work to actively expand the range of uses and functions permitted in
suburban office nodes in order to improve their "functionality" and develop an environment
more conducive to pedestrian activity and transit use.

Canadian Urban Institute - Page | 9
1. Business Competitiveness in the GTA, Five Years On
In 2005 the Canadian Urban Institute (CUI) was retained to prepare a report for the Toronto Office
Coalition (TOC) examining the competitiveness of the office market in Toronto and the surrounding
urban region. Business Competitiveness in the GTA examined a wide range of issues affecting the
office market. There were four key findings:
the GTA has the largest inventory of office space in Canada;
tax inequities between Toronto and suburban municipalities have affected Toronto‟s ability to
attract new tenants relative to the rest of the region;
Toronto has lost tenancies and jobs to the suburban municipalities and as a result the City‟s
share of new growth has been diminishing;
new office space built in the suburban municipalities has been developed in auto-dependent
locations.
Since that report was published, and despite certain changes in public policies that affect office
location, the trends that were apparent in 2005 are still shaping the development of the office
sector. The outcome is a distinctive geography of offices in the GTA that has implications not only for
the office sector‟s competitiveness, but also for the long-term competitiveness of the regional
economy.
The findings in this report are based on the analysis of data supplied by Real Estate Search
Corporation, other available data, and augmented by the results of interviews conducted with office
tenants, landlords, and developers.
The purpose of this report is to examine the causes and implications of this geography, and explore
what the continuation of business-as-usual policies and trends ― including the perpetuation of tax
differentials between 416 and 905 ― will mean for these areas, for those who run businesses or
work in them, and for the region as a whole. The policy recommendations are targeted at addressing
the two main effects of current regional policy, sprawl and highway congestion.
Canadian Urban Institute - Page | 10
2. Changes and trends since 2005
Several important policy decisions have been made by various levels of government since 2005 that
affect the market for office development, ranging from provincial initiatives that potentially influence
location decisions and access to office clusters, to local actions that affect the costs of doing
business in the GTA. At the same time, the economic downturn that began in 2008, growing
congestion on the GTA‟s roads and highways, energy costs and environmental concerns, and
changes to the risk profile of the development industry are shaping the geography of office-based
employment.
The Difference Between Intensified Office Employment and Other Forms Of
Employment
The provincial initiative to establish a growth plan for the Greater Golden Horseshoe addressed the
need to concentrate both residential and employment growth. At present, the plan does not
differentiate between two distinct types of employment. Jobs located in office buildings are highly
intensified. Other types of employment are dispersed. For example, First Canadian Place houses
approximately 10,000 jobs on less than one acre of land, while a logistics centre in an industrial
park may have less than five jobs per acre.
The most significant provincial policy in relation to office location is the adoption of the Growth Plan
for the Greater Golden Horseshoe (GGH), which came into effect in June 2006. (The GTA is the core
of the larger GGH.) This plan requires municipalities to amend their official plans to be in conformity
with the Growth Plan.
The plan directs growth to 25 mixed-use Urban Growth Centres across the GGH. These centres are a
combination of existing or emerging downtowns, for which density targets have been set. There are
three levels of centres; those in Toronto are required to meet the highest density of residents and
jobs per hectare.
The Growth Plan identifies four growth centres in the City of Toronto in addition to downtown. These
are Yonge/Eglinton, North York, Etobicoke, and Scarborough. Ironically, these four clusters have
seen little or no office employment growth for between 15 and 25 years. The plan identifies a further
10 Urban Growth Centres in the Greater Toronto Area and Hamilton (downtown Hamilton, downtown
Burlington, mid-town Oakville, Mississauga City Centre, downtown Brampton, Vaughan Metropolitan
Centre, Richmond Hill, downtown Markham, downtown Pickering and downtown Oshawa).
The plan, by mixing together residents and jobs in its targets, does not provide clear guidance for
intensifying employment in Urban Growth Centres. It directs “major office” uses (defined as
freestanding office buildings of 10,000 m2 or greater, or with 500 jobs or more) to Urban Growth
Centres, but nonetheless provides for 60% of new development in greenfield areas. As shown in
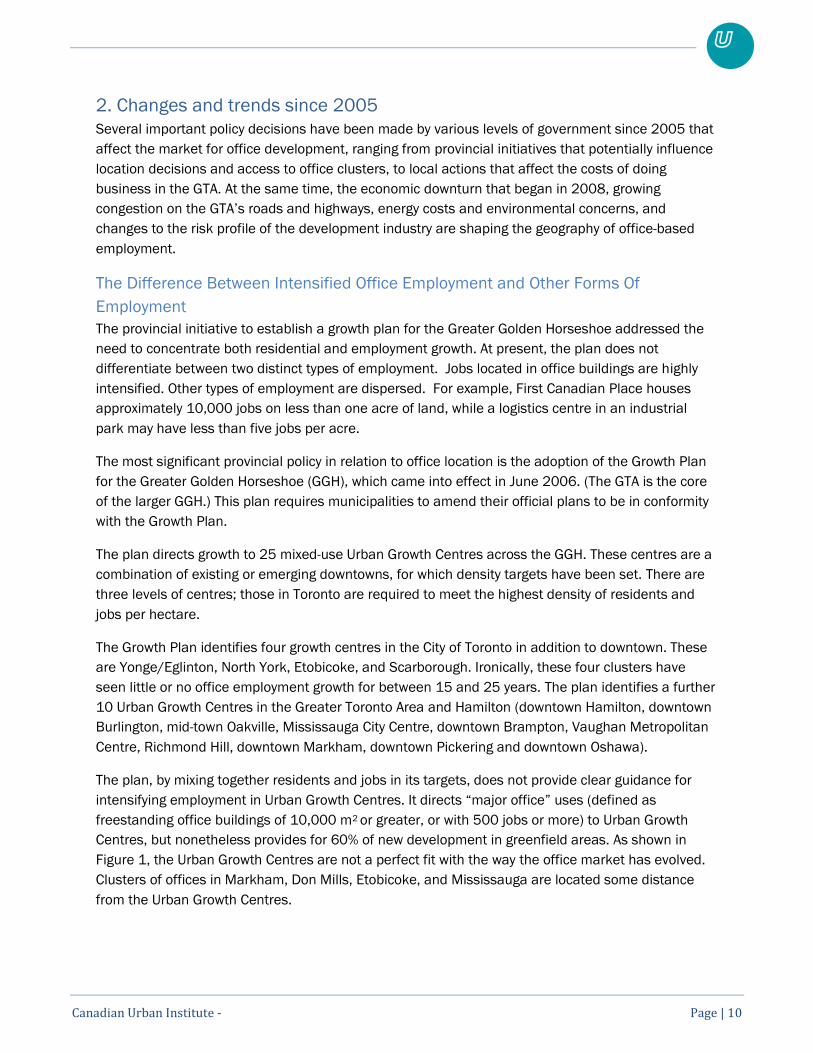
Figure 1, the Urban Growth Centres are not a perfect fit with the way the office market has evolved.
Clusters of offices in Markham, Don Mills, Etobicoke, and Mississauga are located some distance
from the Urban Growth Centres.
Canadian Urban Institute - Page | 11
Figure 1 - Urban Growth Centres Relative to Office Floor Space in the GTA
Source: maps by CUI, office data provided by Real Estate Search Corporation and information adapted from "Places to Grow."
Aligning the locations of Growth Centres more closely with existing concentrations of high density
office employment would improve their chances of success and enhance their effectiveness. As one
observer put it, "Existing office clusters outside of the reach of higher order transit house 500,000
jobs. These buildings are not moving, why create or stimulate new growth centres?"
In 2007, the government also established a regional transportation authority to prepare and
implement a regional transportation plan in support of the Growth Plan. The organization now known
as Metrolinx published the “Big Move” transportation plan in November 2008. In addition to setting
out the vision for a significant expansion of the public transit network in the GTA and Hamilton, the
plan identifies “mobility hubs” that dovetail with the Growth Plan‟s Urban Growth Centres. Mobility
hubs are “major station areas…and places of connectivity…[that]…have or are planned to have an
attractive, intensive concentration of employment, living, shopping.” The vision is that by 2020, 81%
of the population in the GTAH will be living within two kilometers of rapid transit, the problem is that
those transit lines do not connect the majority of these individuals to their places of work.
Figure 1 shows the elements of the Big Move plan3. This too is not an ideal fit with the GTA‟s existing
office clusters, and leaves some of the most important clusters unserved, including those in
Markham, Don Mills, and Mississauga. We estimate that even after build-out of the planned rapid
3 As planned in 2010.

Canadian Urban Institute - Page | 12
transit network expansion, about 98 million ft2 of office development will still be beyond the reach of
higher order transit.4
Finally, the provincial government has set in place a process to rebalance the business education tax
(BET) across the province in order to bring those municipalities with higher-than-average BET down
to the provincial mean. While the education tax makes up only a small amount of total occupancy
costs, employers in the City of Toronto and other mature urban centres are paying more per square
foot than many newer suburban municipalities. This policy will have the effect of bringing Toronto in
line with the provincial average, although the drop from 1.976% of assessed value to 1.6% will still
leave Toronto with an education tax rate above that of some surrounding jurisdictions (Vaughan has
a tax rate of 1.29%, for example). By 2014 the province projects total tax cuts for the business
education tax, as it relates to commercial uses, will total over $200-million (Province of Ontario,
2007).
The education tax rate decrease will not affect existing buildings in Toronto until 2012
(municipalities with the highest rates are being rebalanced first). In the meantime, new buildings
receive a temporary competitive advantage as the new rate applies to them immediately.
City of Toronto: Little Progress on the Agenda for Prosperity
One of the most significant municipal interventions since 2005 began with support from the province
– a new City of Toronto Act, designed to provide the City with more autonomy and revenue-
generating opportunities. Bill 53, the Stronger City of Toronto for a Stronger Ontario Act, was passed
on January 1, 2007. Perhaps the most controversial outcomes were the introduction of a municipal
land transfer tax and a personal vehicle tax (the latter has been cancelled, as one of the first acts of
the new administration at City Hall), which raised concerns at the time that the costs of doing
business in Toronto will further erode the City‟s competiveness. Our interviewees, however, did not
cite these new taxes among their concerns.
In 2006, the City of Toronto committed to gradually narrowing the gap between commercial tax
classes and residential classes. Problems related to the capping of assessments were not, however,
addressed by these measures.
One of the issues raised in CUI‟s 2005 report was a concern about lack of support from the City for
the office sector. Two specific initiatives were already under way at this time―gradually reducing the
tax burden and addressing the education portion of the tax. These are addressed in more detail
elsewhere in this report.
In the months following release of the 2005 report on offices, the Mayor convened a multi-sector
task force of business leaders and other leaders to provide advice on the competitiveness of the
City.
4 These figures are conservative -- the estimate of office space left unserved by higher order transit depends on assumptions concerning
pedestrian walking distances. If measurements were taken from transit access points (stations), rather than measuring a 5-minute walk
from the line itself, the estimate would likely be higher. The corridor measurement has been used since access points have not been
defined for planned transit lines at the time of writing this report.
Canadian Urban Institute - Page | 13
Further to the City‟s Action Plan, in June 2006, the City of Toronto released an economic
development strategy titled Agenda for Prosperity (City of Toronto, 2008). The following targets and
policies were set to reduce and rebalance taxes. As it relates to the office sector, the Agenda sets
policy to:
Promote job creation and expansion of the municipal tax base, including the commercial
property tax base.
Implement an industrial and commercial tenant attraction strategy that would include a new
industrial and office base rate, reducing taxes by 20%; and introduce new time-limited
incentive packages for environmental improvements and upgrades and brownfield
rehabilitation.
In the Agenda for Prosperity, the City recognized the need to expand the tax base in order to
generate the additional tax revenue needed to rebalance the tax ratios without dramatically affecting
residential taxpayers. The City also showed that it is aware of the tax burden placed on commercial
office tenants and that this burden is affecting the competitiveness of the sector, as demonstrated
by the proposed lower tax rate for new buildings.
At the same time, some in the industry expressed concern about providing breaks to some
properties and not others, suggesting it would be detrimental to the market in the long run as it
creates temporary false demand, leading to tenants moving around within the city with only limited
new floor space being leased. In the end, this suggestion was not followed up.
In addition to reiterating a general commitment to reducing the tax burden for the Toronto office
sector, one of the key recommendations of the Agenda for Prosperity was to develop a tenant-
attraction strategy, acknowledging the need to support the market viability of B and C class building
stock. No progress has been made on this initiative.
The City has enacted strong policies in its official plan on the importance of supporting the City‟s
downtown – and the Financial District in particular – as the nation‟s primary concentration of
economic, cultural and related activity. With the exception of Union Station investments, which have
involved contributions from senior governments, these policy statements do not appear to be
connected to or in synch with capital spending plans to explicitly enhance the financial core. As one
interviewee put it, “We are relying too heavily on our laurels and past investments.” Competitiveness
cannot be taken for granted; the City needs to keep promoting its assets and adding to them with
investment and support.
The City of Toronto's Dependence on the Financial Services Sector
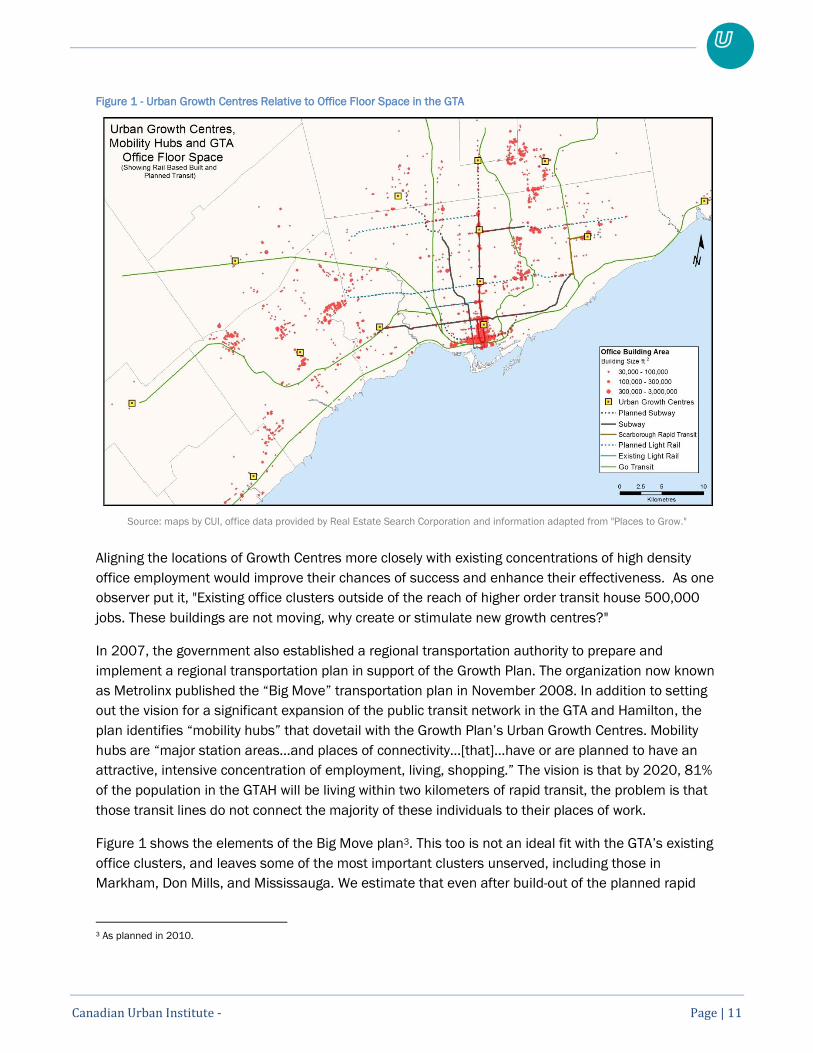
When the majority of office space in the region was in the Financial Core, prior to 1980, many
different businesses such as mining, engineering, publishing, and data services were located there.
The rapid growth of the tech sector and medical sciences, and the movement of the mining and
resource sector away from the region has resulted in significant changes to the functionality of the
Financial Services cluster. Whereas at one time all offices unrelated to Financial Services located
anywhere else but the core, today, few do.
Canadian Urban Institute - Page | 14
Figure 2 - Geographic Distribution of Office Space by Employment Sector
Tax Differentials Still Create Inequities, But Change is Slow and Difficult to Achieve
Real estate taxes form a relatively small but important component of total occupancy costs, but
represent the largest single differential in markets. Sophisticated tenants take into account the gross
costs of occupancy, which include the costs associated with how employees access their place of
work and the need to provide amenities and services where these are lacking. Realty taxes continue
to be enough of a cost driver where access to labour markets and amenities are relatively similar, for
example, on either side of Steeles Avenue (Toronto vs. Vaughan or Markham) or in Etobicoke relative
to neighbouring Mississauga.
The tax inequities between properties in the City of Toronto and properties in the surrounding region,
differences in educational tax rates across the region, the tax burden placed on the commercial
office sector in Toronto, and the impact of caps and clawbacks on the office market in general have
all been the subjects of past studies. A series of recommendations made by CUI (and others) have
indicated the importance of re-examining the tax burden placed on different sectors across the
region as well as in regard to the respective municipal tax rates in each jurisdiction of the GTA.
In October 2005, the City of Toronto introduced an action plan, Enhancing Toronto’s Business
Climate that was intended to promote the competitiveness of the City‟s office sector (City of Toronto,
2005). The plan addressed a range of issues and inequities affecting business in the GTA, in
particular issues associated with the introduction of market value assessment in the late 1990s.
Through Enhancing Toronto’s Business Climate, Toronto City Council set out to correct the imbalance
in tax ratios (the tool used to adjust the tax burden borne by different tax classes); push for
reductions in Toronto‟s business education tax rate to bring it in line with the surrounding region; and
accelerate the phasing out of assessment growth caps.
Canadian Urban Institute - Page | 15
Despite the stated intention to lower realty taxes in Toronto to make the City more competitive
relative to the rest of the region, little has actually changed.
Why not? First, the impact of policy related to the business education tax has not come into effect for
Toronto and will not affect most of the surrounding region. Second, providing tax rate incentives for
new construction, as outlined in the Agenda for Prosperity, will not affect the overall average for the
City for some time, considering the amount of floor space constructed since 2005 is very small
relative to the total. Third, lowering the commercial tax rate in Toronto would require increasing the
tax rates associated with other classes.
Our interviews suggested that many business owners are becoming resigned to the tax problems and
the persistent tax differentials between Toronto and the 905 region. One noted, “With respect to the
tax gap, it is only part of a much larger equation, and governments are severely constrained [in their
ability] to alter the situation. Face it, tax differentials aren‟t about to change.” Another said, “Toronto
is broke and it will not likely be, any time soon, competitive on the tax front – it‟s not a reality.”
Congestion is Currently the Biggest Threat to Competitiveness
The stark differences in commercial property taxes between the City of Toronto and neighbouring
jurisdictions remain a concern for office owners, developers, and tenants in Toronto, but, based on
interviews conducted for this report, appear to have been superseded as a pressing concern by the
urgent need to deal with traffic congestion.
Estimates of the cost of congestion vary and are hard to pin down, but a provincial press release
titled "Move Ontario 2020" (2007) put the annual cost at $2.2 billion for the GTA and some
estimates are even higher. The actual figure is probably less important than the fact that it is known
to be large and is continuing to grow over time. The various figures put forward presumably represent
the extra time wasted by workers stuck in traffic and by those moving goods in the region (a
particular issue for businesses that depend on just-in-time deliveries). They may not include the
hidden costs of additional greenhouse gas emissions or of the stress experienced by those who are
delayed on their journeys to home or work. The danger, in terms of the impact of congestion on
competitiveness, is that companies rarely signal their intention to relocate or publicly complain about
the effects of congestion: they simply "vote with their feet," and leave.
Companies today are starting to consider road congestion in their location decisions. For some, this
means choosing a location in the Toronto core with access to both subway and commuter rail, and
the amenities of downtown, while others opt for less costly office park locations closer to where their
workers live, although one interviewee noted that such locations can sometimes require additional
expenditures by the employer to create building-specific amenities.
Despite a certain amount of debate about the way in which wireless communication technologies
can “free” workers from fixed-location offices, our research suggests that many companies are using
technology as a way to solve the problems created by congestion in a form of Transportation
Demand Management, rather than shaping their business practices around the opportunities
presented by technology.

Canadian Urban Institute - Page | 16
The Transfer of Risk from Entrepreneurs to Institutional Developers Affects
Development Decisions
In the heyday of speculative office development (1980s) the decision to build was largely made by
private companies backed by pools of readily available debt capital. Decisions to build with little or
no pre-leasing placed the risk squarely with the developer. The developer could invest years in
transforming many pieces of land into potential development sites. The recession of the 1990s
transferred the decision-making process into the hands of more risk-averse pools of capital who
viewed development as a business rather than a credit. Now more than ever before, tenants choose
both the location and the building form based on their business cycle, not that of the local
municipalities. Developing new sites has largely become more difficult without a commitment from a
major tenant. This change is having an impact on all decisions, notably where to build and when.
From a public policy perspective, the shift in the risk of development significantly affects not only
where the jobs will be located but the ability of public policy to affect the location decisions of private
companies. The key point is that the development cycle has now been extended so that it is no
longer compatible with the business cycle - making it more difficult to reach critical mass in terms of
leasing within a timeframe that is acceptable to prospective tenants.
Of the 360 buildings constructed in the region in the last ten years, only 15 proceeded with less than
60% of space pre-leased. Virtually no major building has been built without a lead tenant committed
to a significant amount of space since the early 1990s. Average building sizes have dropped
substantially since 1993. In the same time period the suburban office market has grown
dramatically. The requirement for pre-lease commitments has shifted the risk from the developer to
the tenant.
The result of this trend has been the creation of smaller buildings with fewer tenants in suburban
municipalities on readily available, inexpensive land, where the planning approvals timeframe is
relatively short. The realities of needing to prelease a significant proportion of floor space in order to
initiate new construction therefore creates a bias in favour of new office construction in the 905
where tenants can be guaranteed that their space requirements can be delivered in a timely
manner. Our research shows that, with few exceptions, tenants must be guaranteed delivery of new
office space in a period of less than three years in order to make a commitment to the developer.
Amenities that Attract and Retain Talent are Unevenly Distributed in the Region
In today‟s creative economy, the old model of people moving to find jobs has been turned upside
down. Creative workers (a broad term used to describe workers who are paid to think) are today just
as likely to decide where to live and work based on quality of life factors than a specific job
opportunity. In particular, clusters of cultural amenities can serve as powerful attractors for a
creative talent pool. People are attracted to areas characterized by upscale shopping, restaurants,
performing arts venues and art galleries, and the preservation and adaptation of heritage
architecture, especially when these are mixed into the fabric of a lively, inviting urban environment.
As Richard Florida (2004) of the University of Toronto, Rotman School of Business, suggested, “what
creative people look for in communities are abundant high-quality amenities and experiences.”
Canadian Urban Institute - Page | 17
In light of this change, many municipal governments in the United States are taking action to provide
high-quality pedestrian-oriented public spaces, cultural amenities, transportation and other
infrastructure, because they have found that these investments can attract creative and
knowledgeable talent in an increasingly mobile world. This trend is highlighted by such investments
as the closure of Broadway to automobiles through New York‟s downtown, the creation of Millennium
Park and other parks improvements in Chicago, and the development of transit and cycling systems
in Portland.
With an attractive public realm, convenient pedestrian access, higher densities, and a mix of uses
also come restaurants, designer boutiques, fitness clubs, theatres and other urban amenities that
meet the expectations of the new generation of highly mobile talent. The presence of these types of
amenities close to office locations can help to attract pools of talent to live and work in the same
neighbourhood giving talent easy access to the workplace. This can help mitigate the impact of lost
productivity resulting from congestion, a dissatisfied labour force, and limited access to
professionals in related fields, among a range of other factors.
As detailed in our interviews, employers are now taking into account the costs associated with
attracting, training, and retaining talent in their calculations of per-square-foot occupancy cost.
Therefore amenities and transportation will play an increasingly important role in reducing costs.
Furthermore, as the employment base of the GTA continues to trend toward office employment,
creating the conditions to facilitate a mix of uses and intensification throughout the region will
become increasingly important.
Demand for “Green” Development is Growing
Since the CUI‟s 2005 report, both landlords and tenants have become increasingly interested in the
promise of “green” development. What began with a focus on investing in designs that reduce
energy costs has become an important element in the competition for both customers and skilled
employees. Tenants are increasingly demanding that new buildings incorporate the latest
technologies and approaches in building science to ensure that that new workspace is
environmentally sustainable. One interviewee called green development “the new normal.”
Investing in a green building or in green building technologies does not necessarily imply certification
under one of the many available green building standards – such as Leadership in Energy and
Environmental Design (LEED). Although green building techniques are becoming more and more
common, typically only flagship buildings in the downtown or large purpose-built offices in the
suburbs are certified to the highest standards.
Since tenants typically pick up utility costs, developers have little incentive to build green unless the
market demands green floor space. However, as more and more tenants consider long-term energy
price trends, demand has been increasing. One interviewee suggested that “failing to invest in green
technology today is like failing to invest in air conditioning in the 1960s – it will be the fastest way to
become the owner of C-class office space.” While lead tenants often demand that new buildings be
built with a high level of energy performance, smaller tenants in the building do not make the
investment to ensure that their interiors are meeting the same level of energy efficiency.
Canadian Urban Institute - Page | 18
The City of Toronto has worked with the Toronto City Summit Alliance (TCSA) - now known as Civic
Action - and others to support initiatives for “greening” commercial offices. The City is an active
member of the TCSA‟s Commercial Building Energy Leadership Council. The City‟s Better Buildings
Partnership has also been active in this area, and provides a direct connection to any available
funding opportunities with the federal government‟s energy conservation programs.
In terms of the shift towards "green" in suburban locations, several interviewees noted a growing
demand for "high performance" buildings, particularly from tenants with employees housed in green
buildings elsewhere. Several developers also remarked on the incongruity of constructing LEED
Silver buildings in a sea of parking.
Other Developments Since 2005
Employers in the financial core, the transit-oriented areas of Toronto, and the Brick and Beam
districts also see the Island Airport as an important economic development asset for the City. With its
exponential growth in commercial flights (from 25,000 passengers a year in 2005 to a projected 1
million in 2010), there is little doubt that it has begun to provide these sectors of the office market
with a competitive advantage – both over other submarkets in the GTA as well as other cities in
Canada. Since 2006, Porter has captured 23% of the Toronto-Ottawa market and 17% of the
Toronto-Montreal market (Centre for Aviation, 2010). “The Island Airport certainly makes Toronto
much more attractive. Use of Porter by [our firm] has skyrocketed – especially for our business in
Chicago and Montreal – it gets used for almost every flight,” one employer told the research team.
While the major financial institutions had mixed opinions about the airport‟s value to them directly,
they did indicate that “the Island Airport is proving to be an excellent asset for downtown businesses
and is viewed as a distinct competitive advantage for Toronto.” With Air Canada instituting service
from the Island Airport, service levels are likely to continue to increase. It is no accident that air travel
and office employment clusters are often found side by side. The growth around the Pearson Airport
and Buttonville in Markham is no co-incidence, although the latter may not be around for long.
Canadian Urban Institute - Page | 19
3. Change in the Geography of Offices since the 1950s
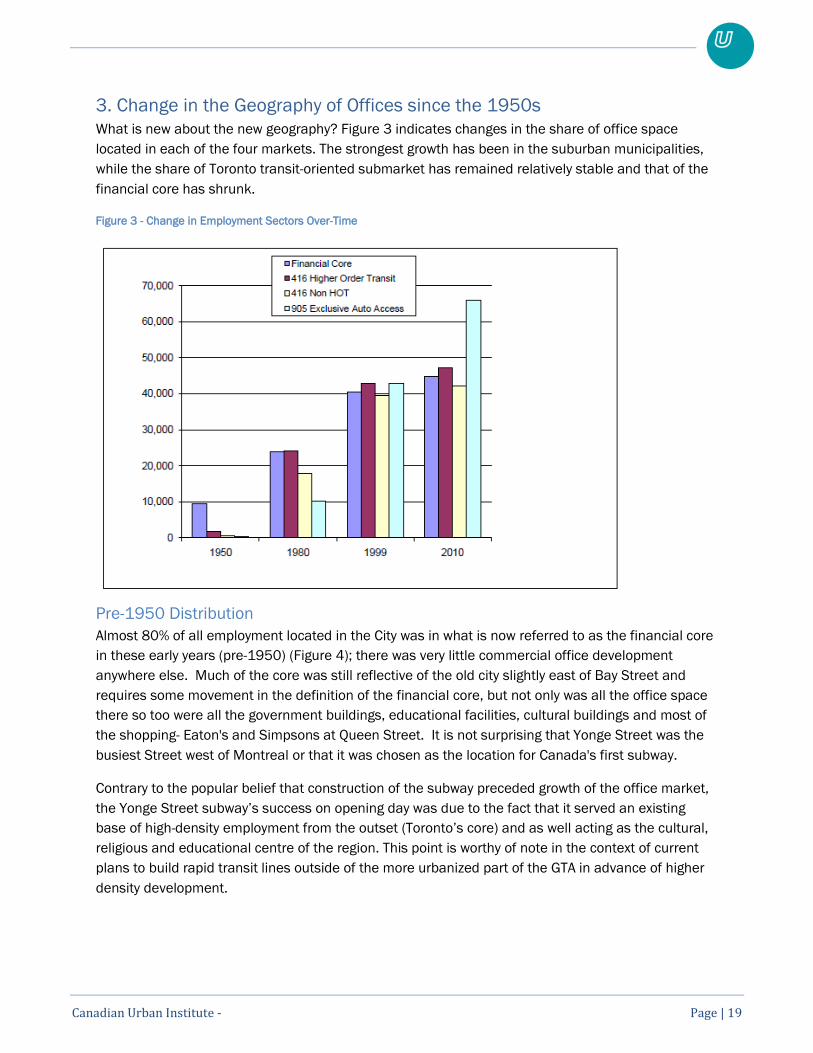
What is new about the new geography? Figure 3 indicates changes in the share of office space
located in each of the four markets. The strongest growth has been in the suburban municipalities,
while the share of Toronto transit-oriented submarket has remained relatively stable and that of the
financial core has shrunk.
Figure 3 - Change in Employment Sectors Over-Time
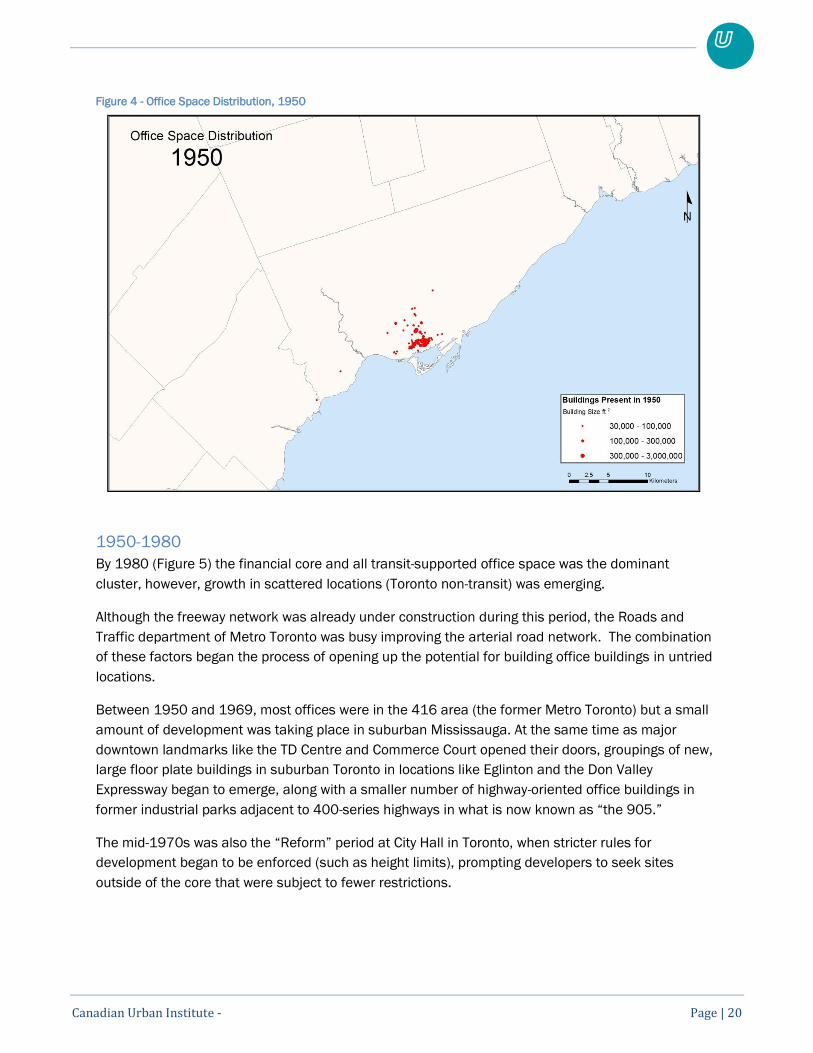
Pre-1950 Distribution
Almost 80% of all employment located in the City was in what is now referred to as the financial core
in these early years (pre-1950) (Figure 4); there was very little commercial office development
anywhere else. Much of the core was still reflective of the old city slightly east of Bay Street and
requires some movement in the definition of the financial core, but not only was all the office space
there so too were all the government buildings, educational facilities, cultural buildings and most of
the shopping- Eaton's and Simpsons at Queen Street. It is not surprising that Yonge Street was the
busiest Street west of Montreal or that it was chosen as the location for Canada's first subway.
Contrary to the popular belief that construction of the subway preceded growth of the office market,
the Yonge Street subway‟s success on opening day was due to the fact that it served an existing
base of high-density employment from the outset (Toronto‟s core) and as well acting as the cultural,
religious and educational centre of the region. This point is worthy of note in the context of current
plans to build rapid transit lines outside of the more urbanized part of the GTA in advance of higher
density development.
Canadian Urban Institute - Page | 20
Figure 4 - Office Space Distribution, 1950
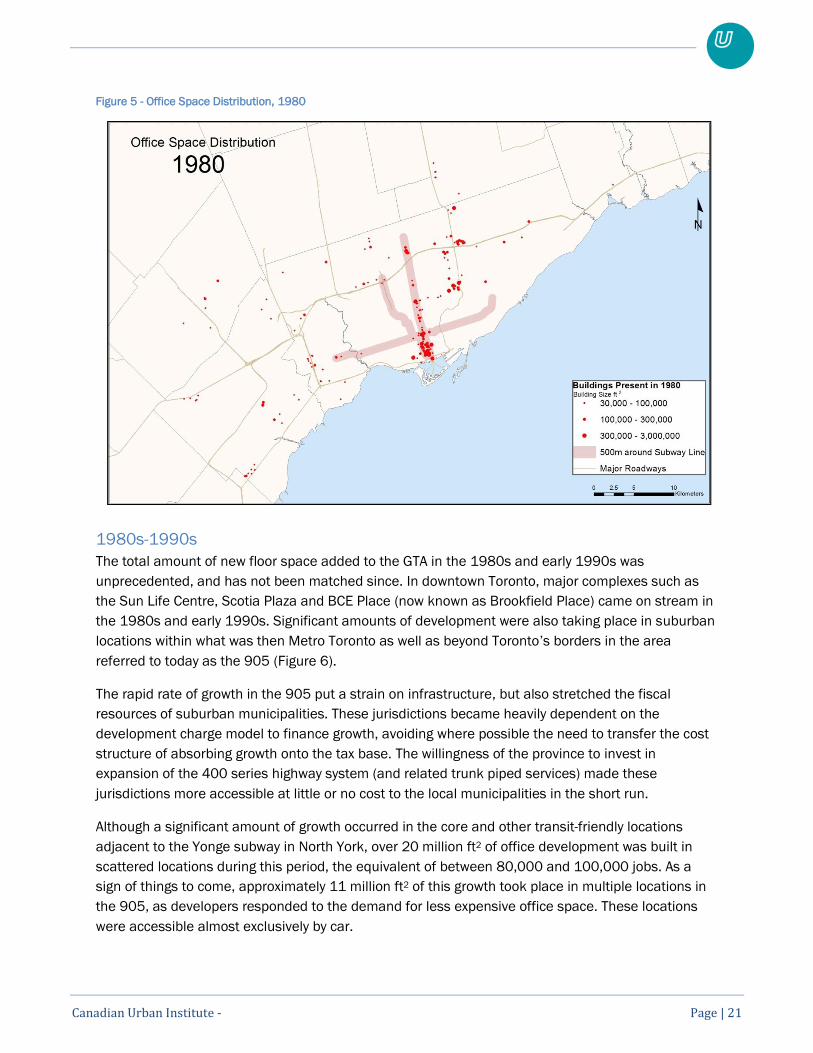
1950-1980
By 1980 (Figure 5) the financial core and all transit-supported office space was the dominant
cluster, however, growth in scattered locations (Toronto non-transit) was emerging.
Although the freeway network was already under construction during this period, the Roads and
Traffic department of Metro Toronto was busy improving the arterial road network. The combination
of these factors began the process of opening up the potential for building office buildings in untried
locations.
Between 1950 and 1969, most offices were in the 416 area (the former Metro Toronto) but a small
amount of development was taking place in suburban Mississauga. At the same time as major
downtown landmarks like the TD Centre and Commerce Court opened their doors, groupings of new,
large floor plate buildings in suburban Toronto in locations like Eglinton and the Don Valley
Expressway began to emerge, along with a smaller number of highway-oriented office buildings in
former industrial parks adjacent to 400-series highways in what is now known as “the 905.”
The mid-1970s was also the “Reform” period at City Hall in Toronto, when stricter rules for
development began to be enforced (such as height limits), prompting developers to seek sites
outside of the core that were subject to fewer restrictions.
Canadian Urban Institute - Page | 21
Figure 5 - Office Space Distribution, 1980
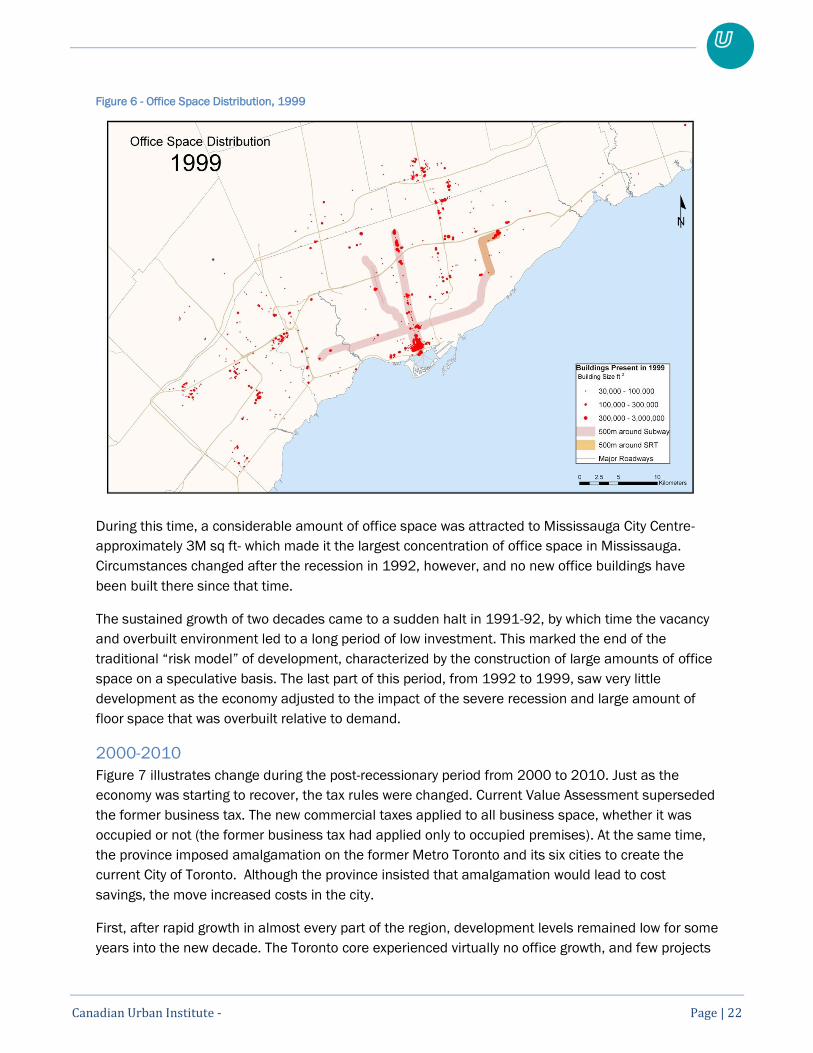
1980s-1990s
The total amount of new floor space added to the GTA in the 1980s and early 1990s was
unprecedented, and has not been matched since. In downtown Toronto, major complexes such as
the Sun Life Centre, Scotia Plaza and BCE Place (now known as Brookfield Place) came on stream in
the 1980s and early 1990s. Significant amounts of development were also taking place in suburban
locations within what was then Metro Toronto as well as beyond Toronto‟s borders in the area
referred to today as the 905 (Figure 6).
The rapid rate of growth in the 905 put a strain on infrastructure, but also stretched the fiscal
resources of suburban municipalities. These jurisdictions became heavily dependent on the
development charge model to finance growth, avoiding where possible the need to transfer the cost
structure of absorbing growth onto the tax base. The willingness of the province to invest in
expansion of the 400 series highway system (and related trunk piped services) made these
jurisdictions more accessible at little or no cost to the local municipalities in the short run.
Although a significant amount of growth occurred in the core and other transit-friendly locations
adjacent to the Yonge subway in North York, over 20 million ft2 of office development was built in
scattered locations during this period, the equivalent of between 80,000 and 100,000 jobs. As a
sign of things to come, approximately 11 million ft2 of this growth took place in multiple locations in
the 905, as developers responded to the demand for less expensive office space. These locations
were accessible almost exclusively by car.
Canadian Urban Institute - Page | 22
Figure 6 - Office Space Distribution, 1999
During this time, a considerable amount of office space was attracted to Mississauga City Centre-
approximately 3M sq ft- which made it the largest concentration of office space in Mississauga.
Circumstances changed after the recession in 1992, however, and no new office buildings have
been built there since that time.
The sustained growth of two decades came to a sudden halt in 1991-92, by which time the vacancy
and overbuilt environment led to a long period of low investment. This marked the end of the
traditional “risk model” of development, characterized by the construction of large amounts of office
space on a speculative basis. The last part of this period, from 1992 to 1999, saw very little
development as the economy adjusted to the impact of the severe recession and large amount of
floor space that was overbuilt relative to demand.
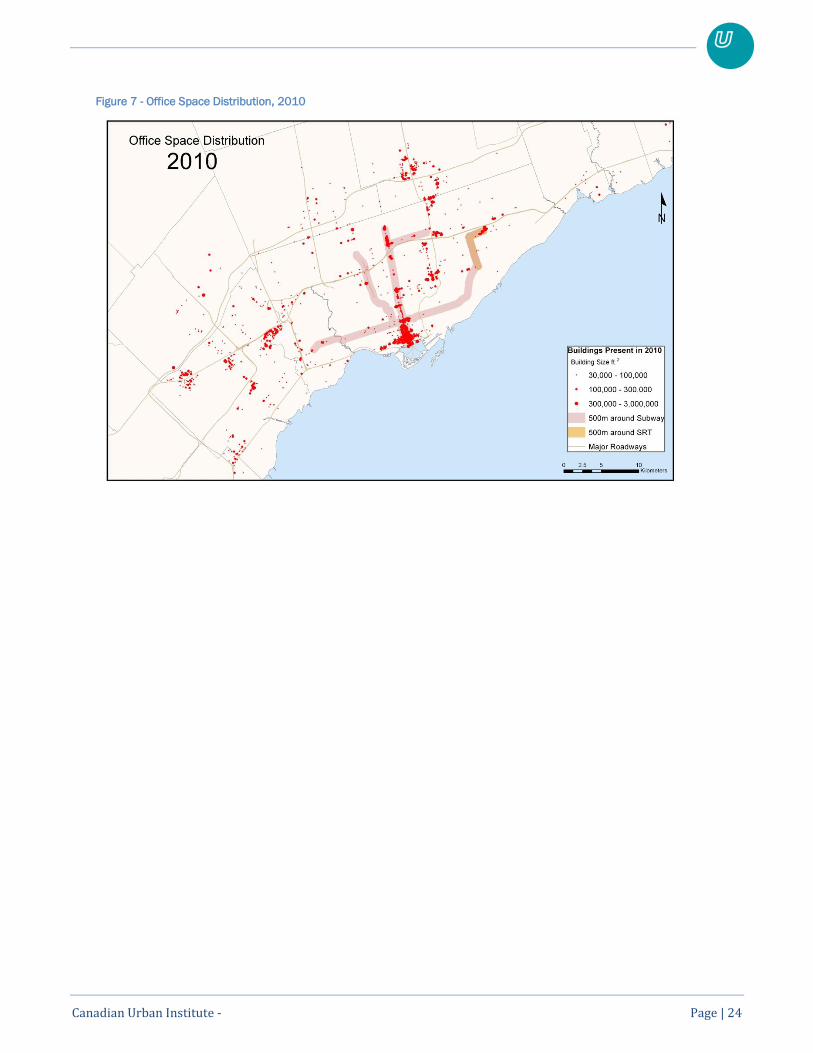
2000-2010
Figure 7 illustrates change during the post-recessionary period from 2000 to 2010. Just as the
economy was starting to recover, the tax rules were changed. Current Value Assessment superseded
the former business tax. The new commercial taxes applied to all business space, whether it was
occupied or not (the former business tax had applied only to occupied premises). At the same time,
the province imposed amalgamation on the former Metro Toronto and its six cities to create the
current City of Toronto. Although the province insisted that amalgamation would lead to cost
savings, the move increased costs in the city.
First, after rapid growth in almost every part of the region, development levels remained low for some
years into the new decade. The Toronto core experienced virtually no office growth, and few projects
Canadian Urban Institute - Page | 23
were initiated anywhere in the 416. Much of the new office space was created through the
renovation of former industrial buildings in the “Brick and Beam” areas either side of downtown
Toronto (see discussion below).
New developments appeared also in Mississauga – notably the Airport Corporate Centre – and in
scattered “non-cluster” locations throughout the 905. In the post-recession, major tenants drove
development decisions, primarily through design-build deals with developers who no longer had an
appetite for building “on spec.” The average size of each new building in the 905 was smaller than in
the financial core. These changes were attributable to changes in parking ratios that limited the
amount of parking that could be provided and the requirement by financers that new projects could
proceed only with a high percentage of the space committed.
This period also saw the beginnings of growth in the “Brick and Beam” districts on either side of the
financial core. In 1996, the City of Toronto took the bold step of “deregulating” two areas of
industrial development either side of the central business district known as the “Kings.” The
breakthrough occurred when politicians and planners acknowledged that the practice of maintaining
historic industrial zoning in order to “preserve” the industrial function was a lost cause. The Kings
were re-designated as “reinvestment” areas.
Since that time, these two areas, bounded by Queen Street on the north and Front Street to the
south, have attracted new investment as landlords and tenants responded to the new rules. “King-
Spadina” and “King-Parliament” make no distinction between commercial, industrial and residential
use – provided that the uses are not noxious – and the principal planning mechanism is site plan
approval, provided that buildings fit within prescribed built-form guidelines.
Over the past 15 years, more than 3 million ft2 of office space has been introduced into the two
zones. Characterized as “Brick-and-Beam” development, the two areas have also attracted many
new condominium units [more than 100,000 units have been added in the central area of Toronto
during this time], primarily as new build construction, although there have been some conversions of
former factory buildings to “lofts.”
After more than a decade of little or no activity in this sector, commercial office project cranes
returned to the downtown skyline. The bulk of this growth is accounted for in just six buildings – the
much-delayed Bay-Adelaide complex, the RBC-Dexia tower, Telus House, Maritime Life, the
Mackenzie Investments building, and a tower anchored by Price Waterhouse Coopers.
Although volume was reduced in the 905, momentum continued with development primarily
occurring in Mississauga‟s Airport Corporate Centre and Meadowvale.
Of 4.8 million ft2 of new floor space built in the City of Toronto since January 2005, all but 200,000
ft2 was built near higher-order transit (subway). However, floor space data alone cannot indicate how
the region is evolving or how it will continue to evolve. Most of the new floor space was made
available in a single year, 2009, and does not indicate a change in existing trends.
Canadian Urban Institute - Page | 24
Figure 7 - Office Space Distribution, 2010
Canadian Urban Institute Page | 25
4. Realty Taxes: a Situation Largely at a Standstill
Real estate taxes form a relatively small component of total occupancy costs (but are still the largest
single differential within markets), and decisions about location are largely based on function and
the ability to tap specific labour pools. Sophisticated tenants take into account the gross costs of
occupancy that includes the costs associated with how employees access their place of work.
Nevertheless, the office sector still suffers from tax inequities between properties in the City of
Toronto and properties in the surrounding region, differences in educational tax rates across the
region, the tax burden placed on the commercial office sector in Toronto, and caps and clawbacks on
the office market. Despite the existence of numerous reports on these issues, it is worth
summarizing the situation to date.
Ontario‟s 2007 Plan to Balance Business Education Tax
At the provincial level, the government set in place a process to rebalance the business education
tax (BET) across the province in order to bring those municipalities with higher than average BET
down to the provincial mean. While the education tax makes up only a small amount of total
occupancy costs, employers in the City of Toronto and other mature urban centres are paying more
per square foot than many newer suburban municipalities. This policy will have the effect of bringing
Toronto in line with the provincial average, although the drop from 1.976% of assessed value to
1.6% will still leave Toronto with an education tax rate above that of some surrounding jurisdictions
(Vaughan has a tax rate of 1.29% for example). By 2014 the province projects that total tax cuts for
the business education tax, as it relates to commercial uses, will total over $200 million (Province of
Ontario, 2007).
The education tax rate decrease will not affect existing buildings in Toronto until 2012
(municipalities with the highest rates are being rebalanced first). In the meantime, new buildings
receive a temporary competitive advantage as the new rate applies to them immediately.
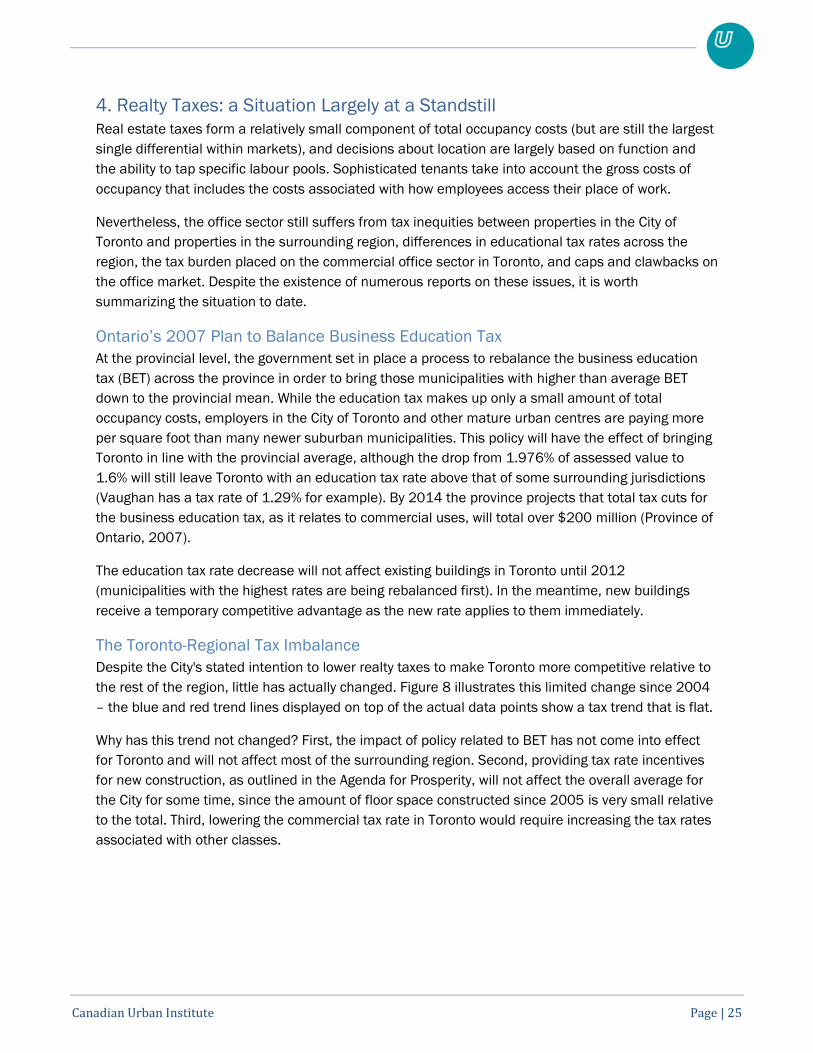
The Toronto-Regional Tax Imbalance
Despite the City's stated intention to lower realty taxes to make Toronto more competitive relative to
the rest of the region, little has actually changed. Figure 8 illustrates this limited change since 2004
– the blue and red trend lines displayed on top of the actual data points show a tax trend that is flat.
Why has this trend not changed? First, the impact of policy related to BET has not come into effect
for Toronto and will not affect most of the surrounding region. Second, providing tax rate incentives
for new construction, as outlined in the Agenda for Prosperity, will not affect the overall average for
the City for some time, since the amount of floor space constructed since 2005 is very small relative
to the total. Third, lowering the commercial tax rate in Toronto would require increasing the tax rates
associated with other classes.
Canadian Urban Institute Page | 26
Figure 8 - Realty Tax Differential between Toronto and the Rest of the Region, 2004-2009
Rebalancing the Commercial-Residential Tax Burden
Rebalancing the commercial and residential tax burden is likely to remain one of the most
substantial challenges the City of Toronto will face as it strives to set tax policy in the future. This
rebalancing was referred to by one executive as “a shell game that will not solve the underlying
problem.” Loading the burden onto residents can also be counter-productive, drive some talent out
beyond City limits and other workers to cities with lower costs of living outside the region, which
would lead to increased costs for the employer. Some interviewees cited this rebalancing as “unfair”
while others indicated that residential taxes in Toronto are very reasonable compared to other
municipalities.
The only way to accelerate the rebalancing of the burden is to substantially increase the commercial
assessment in the city – which is made more difficult by higher tax rates – or to obtain funding from
higher levels of government to help offset costs that were downloaded to the City by the province in
the late 1990s. In addition to social services, “the City is burdened with more than its fair share of
infrastructure costs,” one interviewee suggested. There is a balancing act that must be achieved
between reducing the burden on commercial office, increasing commercial assessment, increasing
the burden on residents, lowering municipal costs, and ramping up senior government funding to
Toronto that must carefully managed.
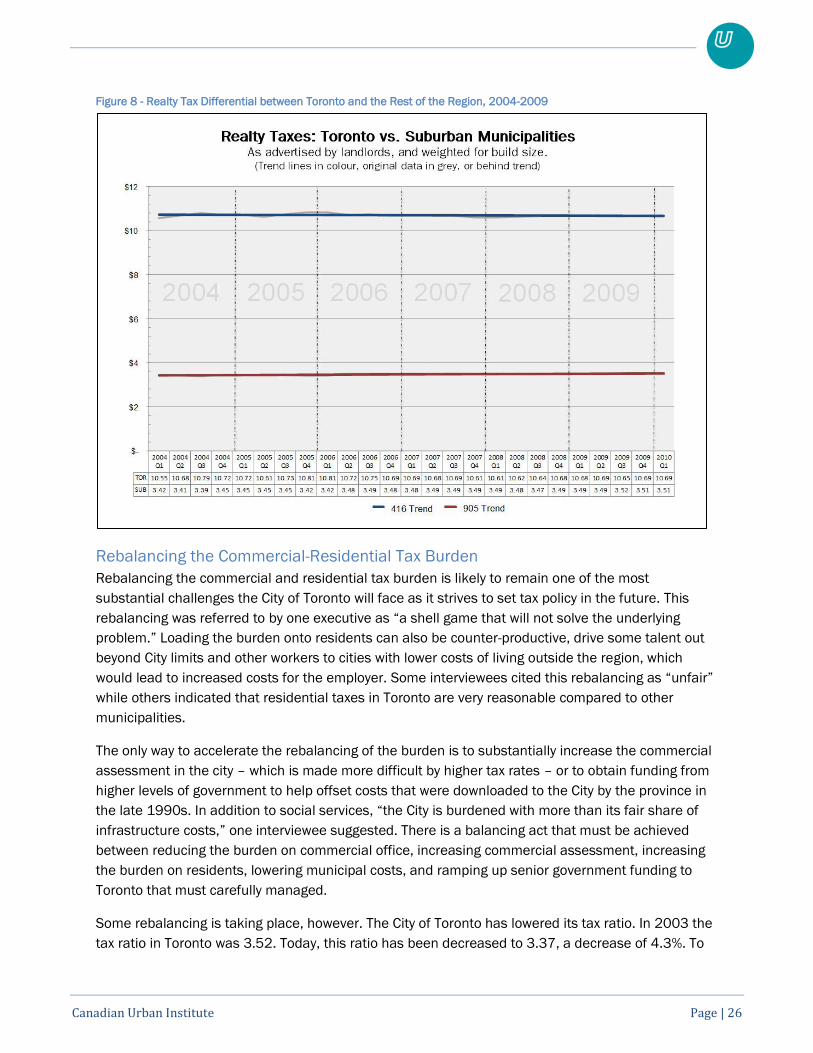
Some rebalancing is taking place, however. The City of Toronto has lowered its tax ratio. In 2003 the
tax ratio in Toronto was 3.52. Today, this ratio has been decreased to 3.37, a decrease of 4.3%. To
Canadian Urban Institute Page | 27
put this in perspective, Oakville‟s ratio remained constant while Markham‟s increased and
Mississauga‟s decreased (see Table 1).
Table 1 - Commercial Office Tax Ratios
Commercial Office Tax Ratios (rounded to two-decimals)
20032 20093 % change
Toronto 3.52 3.37 -4.3%
Markham 1.10 1.21 10.0%
Mississauga 1.30 1.21 -6.9%
Oakville1 1.46 1.46 0.0%
Note 1: Oakville‟s 2009 tax ratio represents 2008 published value
Note 2: Source: Office Competitiveness in the GTA, Canadian Urban Institute, 2005
Note 3: Sources: published sources from Toronto and select suburban municipalities
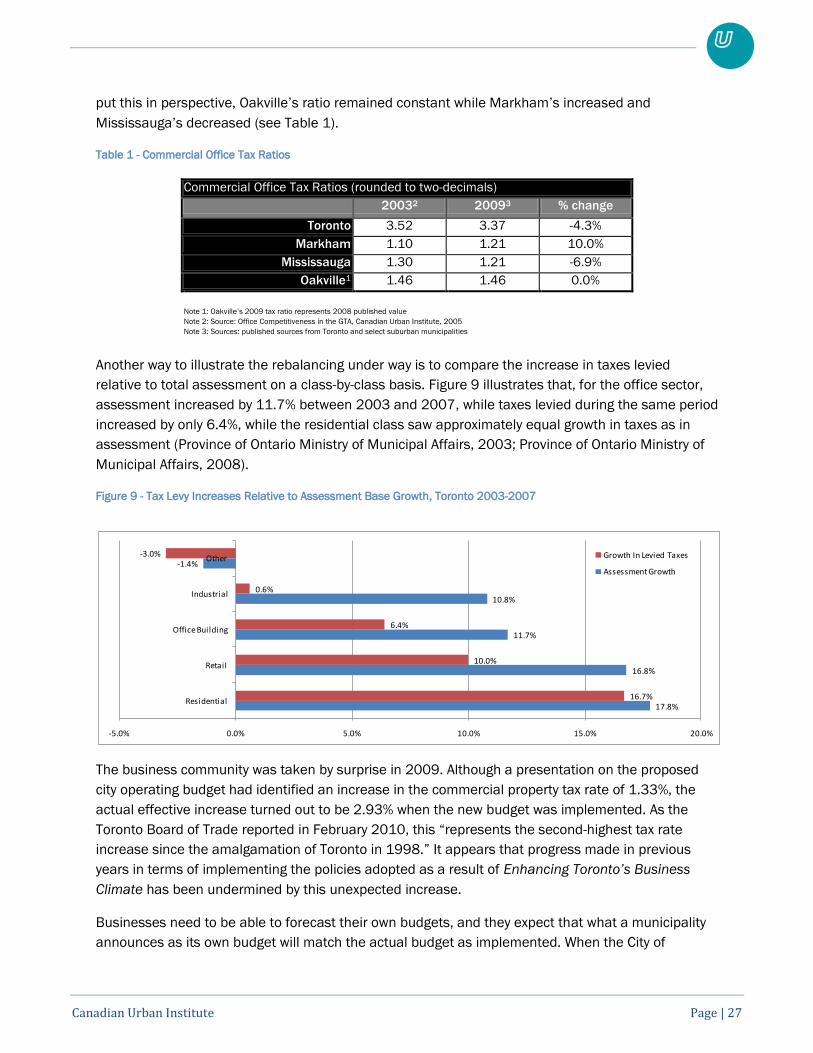
Another way to illustrate the rebalancing under way is to compare the increase in taxes levied
relative to total assessment on a class-by-class basis. Figure 9 illustrates that, for the office sector,
assessment increased by 11.7% between 2003 and 2007, while taxes levied during the same period
increased by only 6.4%, while the residential class saw approximately equal growth in taxes as in
assessment (Province of Ontario Ministry of Municipal Affairs, 2003; Province of Ontario Ministry of
Municipal Affairs, 2008).
Figure 9 - Tax Levy Increases Relative to Assessment Base Growth, Toronto 2003-2007
The business community was taken by surprise in 2009. Although a presentation on the proposed
city operating budget had identified an increase in the commercial property tax rate of 1.33%, the
actual effective increase turned out to be 2.93% when the new budget was implemented. As the
Toronto Board of Trade reported in February 2010, this “represents the second-highest tax rate
increase since the amalgamation of Toronto in 1998.” It appears that progress made in previous
years in terms of implementing the policies adopted as a result of Enhancing Toronto’s Business
Climate has been undermined by this unexpected increase.
Businesses need to be able to forecast their own budgets, and they expect that what a municipality
announces as its own budget will match the actual budget as implemented. When the City of
17.8%
16.8%
11.7%
10.8%
-1.4%
16.7%
10.0%
6.4%
0.6%
-3.0%
-5.0% 0.0% 5.0% 10.0% 15.0% 20.0%
Residential
Retail
Office Building
Industrial
Other Growth In Levied Taxes
Assessment Growth
Canadian Urban Institute Page | 28
Toronto's projections prove to be unreliable, the City appears to be less competitive in the eyes of the
business community.
Caps and Clawbacks in the Commercial Sector
Caps and clawbacks have introduced new inequities whereby some office buildings carry an unfair
portion of the commercial tax burden. While the tax burden is usually defined as the inequity
between residential and non-residential tax classes, caps (and their by-product, clawbacks) have
created a new problem between sectors of the commercial class itself. However, evaluating the
impacts associated with these programs is difficult, because they are determined on a property-by-
property basis and as a result the information is confidential.
Because caps affect only buildings previously assessed below actual market value, a “tax gap” is
created in the total amount of tax revenue the City would otherwise collect if the cap were not in
place. To make up for this gap, those properties that were previously over-assessed when Current
Value Assessment (CVA) was introduced, are required to offset the tax shortage through clawbacks –
i.e. they continue to be taxed based on their previously over-assessed value.
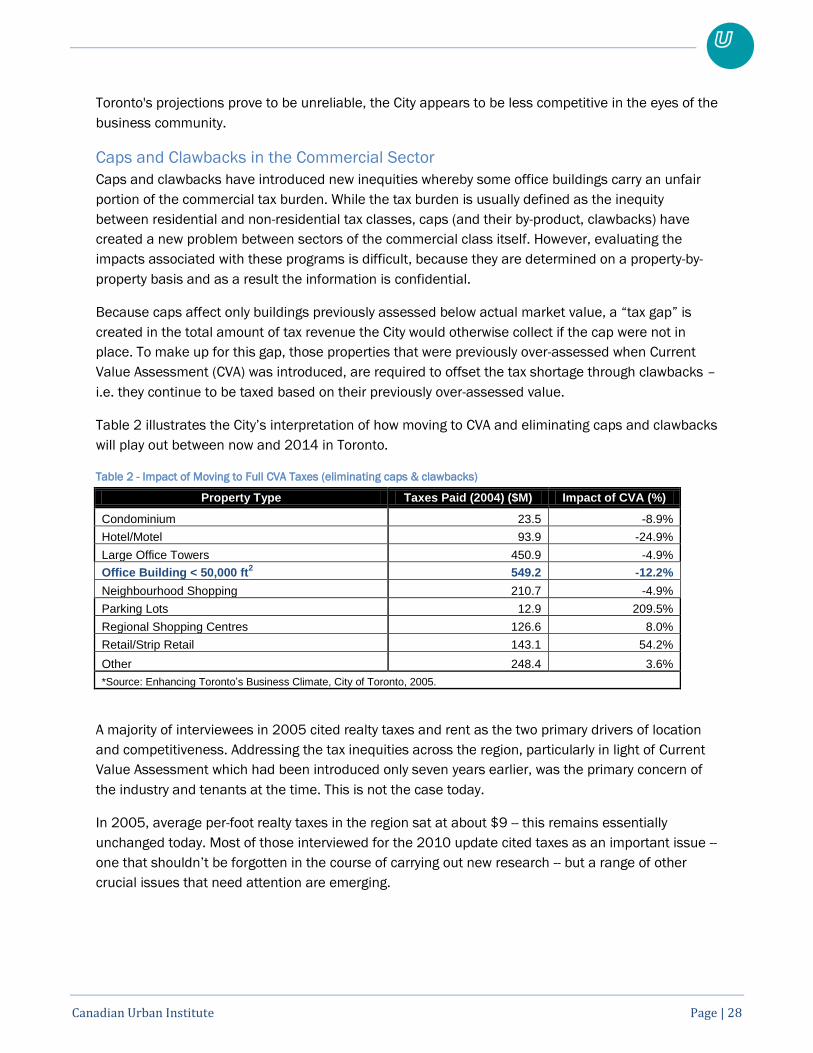
Table 2 illustrates the City‟s interpretation of how moving to CVA and eliminating caps and clawbacks
will play out between now and 2014 in Toronto.
Table 2 - Impact of Moving to Full CVA Taxes (eliminating caps & clawbacks)
Property Type Taxes Paid (2004) ($M) Impact of CVA (%)
Condominium 23.5 -8.9%
Hotel/Motel 93.9 -24.9%
Large Office Towers 450.9 -4.9%
Office Building < 50,000 ft2 549.2 -12.2%
Neighbourhood Shopping 210.7 -4.9%
Parking Lots 12.9 209.5%
Regional Shopping Centres 126.6 8.0%
Retail/Strip Retail 143.1 54.2%
Other 248.4 3.6%
*Source: Enhancing Toronto’s Business Climate, City of Toronto, 2005.
A majority of interviewees in 2005 cited realty taxes and rent as the two primary drivers of location
and competitiveness. Addressing the tax inequities across the region, particularly in light of Current
Value Assessment which had been introduced only seven years earlier, was the primary concern of
the industry and tenants at the time. This is not the case today.
In 2005, average per-foot realty taxes in the region sat at about $9 -- this remains essentially
unchanged today. Most of those interviewed for the 2010 update cited taxes as an important issue --
one that shouldn‟t be forgotten in the course of carrying out new research -- but a range of other
crucial issues that need attention are emerging.
Canadian Urban Institute Page | 29
5. The Consequences of Business-As-Usual Approaches
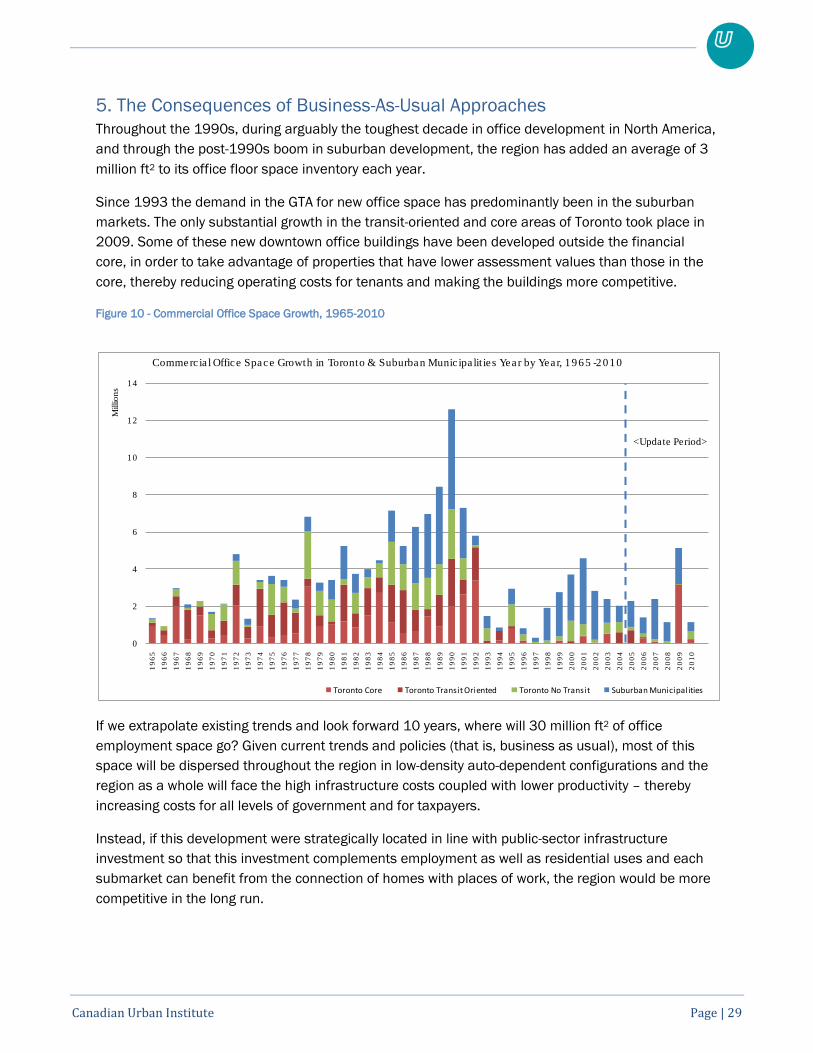
Throughout the 1990s, during arguably the toughest decade in office development in North America,
and through the post-1990s boom in suburban development, the region has added an average of 3
million ft2 to its office floor space inventory each year.
Since 1993 the demand in the GTA for new office space has predominantly been in the suburban
markets. The only substantial growth in the transit-oriented and core areas of Toronto took place in
2009. Some of these new downtown office buildings have been developed outside the financial
core, in order to take advantage of properties that have lower assessment values than those in the
core, thereby reducing operating costs for tenants and making the buildings more competitive.
Figure 10 - Commercial Office Space Growth, 1965-2010
If we extrapolate existing trends and look forward 10 years, where will 30 million ft2 of office
employment space go? Given current trends and policies (that is, business as usual), most of this
space will be dispersed throughout the region in low-density auto-dependent configurations and the
region as a whole will face the high infrastructure costs coupled with lower productivity – thereby
increasing costs for all levels of government and for taxpayers.
Instead, if this development were strategically located in line with public-sector infrastructure
investment so that this investment complements employment as well as residential uses and each
submarket can benefit from the connection of homes with places of work, the region would be more
competitive in the long run.
0
2
4
6
8
10
12
14
19
65
19
66
19
67
19
68
19
69
19
70
19
71
19
72
19
73
19
74
19
75
19
76
19
77
19
78
19
79
19
80
19
81
19
82
19
83
19
84
19
85
19
86
19
87
19
88
19
89
19
90
19
91
19
92
19
93
19
94
19
95
19
96
19
97
19
98
19
99
20
00
20
01
20
02
20
03
20
04
20
05
20
06
20
07
20
08
20
09
20
10
Millio
ns
Commerc ia l Office Space Growth in Toronto & Suburban Munic ipa lit ie s Year by Year, 1965 -2010
Toronto Core Toronto Transit Oriented Toronto No Transit Suburban Municipalities
<Update Period>
Canadian Urban Institute Page | 30
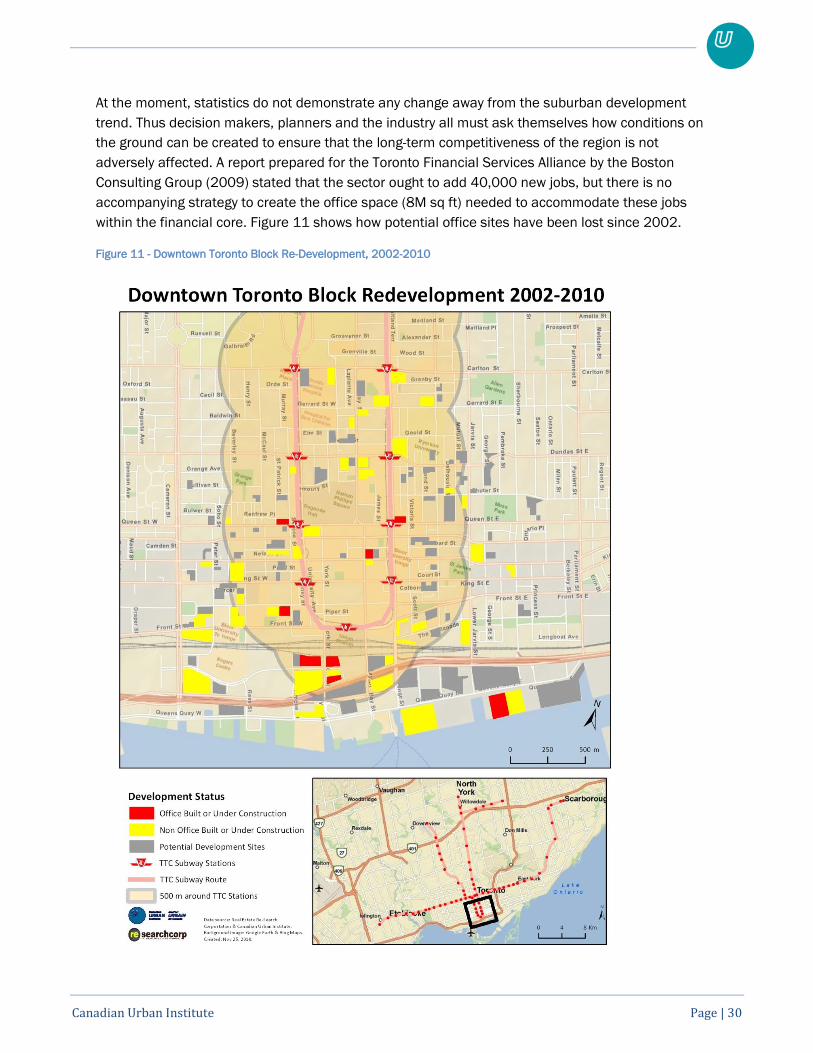
At the moment, statistics do not demonstrate any change away from the suburban development
trend. Thus decision makers, planners and the industry all must ask themselves how conditions on
the ground can be created to ensure that the long-term competitiveness of the region is not
adversely affected. A report prepared for the Toronto Financial Services Alliance by the Boston
Consulting Group (2009) stated that the sector ought to add 40,000 new jobs, but there is no
accompanying strategy to create the office space (8M sq ft) needed to accommodate these jobs
within the financial core. Figure 11 shows how potential office sites have been lost since 2002.
Figure 11 - Downtown Toronto Block Re-Development, 2002-2010
Canadian Urban Institute Page | 31
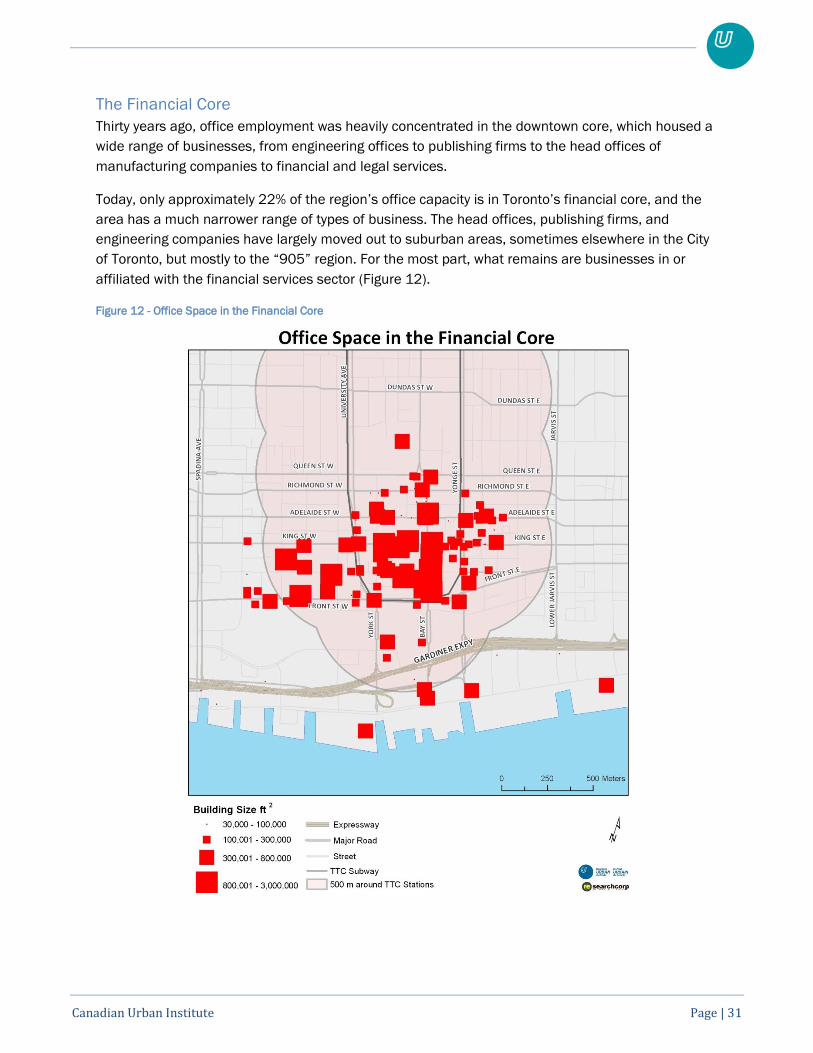
The Financial Core
Thirty years ago, office employment was heavily concentrated in the downtown core, which housed a
wide range of businesses, from engineering offices to publishing firms to the head offices of
manufacturing companies to financial and legal services.
Today, only approximately 22% of the region‟s office capacity is in Toronto‟s financial core, and the
area has a much narrower range of types of business. The head offices, publishing firms, and
engineering companies have largely moved out to suburban areas, sometimes elsewhere in the City
of Toronto, but mostly to the “905” region. For the most part, what remains are businesses in or
affiliated with the financial services sector (Figure 12).
Figure 12 - Office Space in the Financial Core
Canadian Urban Institute Page | 32
This specialization of the downtown core has both benefits and drawbacks. On one hand, Toronto
has become an important city in the network of global financial centres; the sector is relatively strong
and continuing to grow. On the other, the lack of diversity in the downtown core makes the area
vulnerable to downturns in the sector on which it depends.
Largely, this situation has developed because of land use and tax policy shifts that have made it
harder and more expensive to add new or flexible office space in the core. In recent decades, the
reallocation of developable sites to residential and other uses in the core has reduced the number of
available sites close to transit that could be developed for offices. At the same time, the length of the
approvals process required to bring a site to development readiness has increased to the point at
which developers are often unable to meet the expectations of tenants seeking large amounts of
contiguous space.
The cost of land assembly is possibly the most significant component of office development. Sites in
the financial core are much more expensive than those elsewhere in the region. Factored into these
costs is the zoning attached to the lands. Zoning determines the cost of each buildable foot, which
influences land value. Since developers often wish to increase their permitted density, the cost and
time required to gain such approvals can be extensive, ranging between three and four years
depending on the complexity of the site. Even for sites that notionally have “as of right” zoning, two
years for site plan approval is not uncommon.
Hard costs, or the actual cost to construct, vary principally in terms of the construction method
relative to its size. High-rise office towers cost more to construct not only because more materials
are involved, but also because construction methods are more sophisticated. Downtown sites are
considerably more constrained than those in greenfield sites, adding costs as well as complexity. For
example, busy roads must be closed to bring in equipment, and infrastructure may need to be re-
routed. As a result, the time needed to construct a new office tower in Toronto is – by definition –
considerably longer than in the suburbs.
Despite the recent recession, Toronto‟s housing market continues to be relatively strong with new
condominium starts occurring almost monthly. All around the downtown core cranes reach into the
sky – the bulk of which have nothing to do with the office industry (see Figure 11). Condominium
development in Toronto continues to outpace many major North American cities and this has caught
the attention of the office sector. When sites for other non-office use are added into the equation
(such as hotels or entertainment venues), the cumulative impact on the number of suitable sites for
office is considerable.
At present, there are relatively few large development parcels remaining in Toronto‟s downtown and,
in some cases, available sites are being filled by residential developments. Two such examples are
the Shangri-la site on University Avenue and the Trump site in the heart of the financial district on
Bay Street. At the same time, the office market is moving into areas that have traditionally been the
territory of residential developers – both in the "Brick and Beam" district and south of the Union
Station rail corridor.
Canadian Urban Institute Page | 33
Despite the desire to create 40,000 new jobs in the financial services sector, if Toronto is to remain
competitive as a global financial centre, there is no accompanying plan for where these jobs are to
be housed. Just as municipalities act to protect derelict industrial parks for employment uses, there
is a need to protect scarce prime office sites in the downtown, or at least signal that office uses have
priority.
At the same time, protecting space for offices without supporting their occupants is similar to
preserving farmland without protecting farmers. The financial sector is to some extent the victim of
its own stability and success; it has been largely taken for granted as a driver of growth and
prosperity and does not benefit from government support and special programs to help maintain its
global status.
What would be the consequences of business as usual for the financial core?
Given the constraints on expansion in the financial core, any new jobs added will have to be
accommodated elsewhere in the region, further reducing the downtown‟s share of office space and
jobs relative to the rest of the region. Scarcity of space will also likely drive up prices and occupancy
costs, so that only the largest companies will be able to afford space in the core.
As the core becomes less diverse, it will inevitably depend more and more heavily on the financial
sector. If Toronto can maintain and strengthen its position as a leader in the global financial sector,
the core will prosper, but if that position is weakened in any way, it will affect the health of this
central area.
Without greater recognition of the value of the financial sector, Toronto risks losing some of the key
financial companies in the core of the city. An industry executive quoted in the Boston Consulting
Group report Partnership and Action (2009) noted, "If any one of Toronto's major financial
institutions relocated, it would be a devastating blow, but nothing is being done to encourage us to
stay." (p. 30). The report includes a menu of strategies that would encourage the existing firms to
stay, and the Toronto Financial Services Working Group will, it is hoped, follow up on the
recommendations.
Toronto Transit-Oriented Office Clusters
Of all the changes in the office market since the 1950s, perhaps the most worrying is that the share
of the market in transit-oriented locations is smaller today than it was at the middle of the previous
century, despite massive growth in market share through to the 1980s. In 1950, transit-oriented
development was focused in the core and on street railway lines. By 1980, the subway system had
dramatically expanded the share of the transit-oriented submarket, with a major proportion of new
development attracted to locations within a five-minute walk of the subway. However, between 1980
and today the transit-oriented share of the market has fallen below 1950 levels.
The only substantial growth in the transit-oriented and core areas of Toronto took place in 2009.
Some of these new downtown office buildings have been developed outside the financial core, in
order to take advantage of properties with lower assessment values than those in the core, thereby
reducing operating costs for tenants and making the buildings more competitive (see Figure 11).
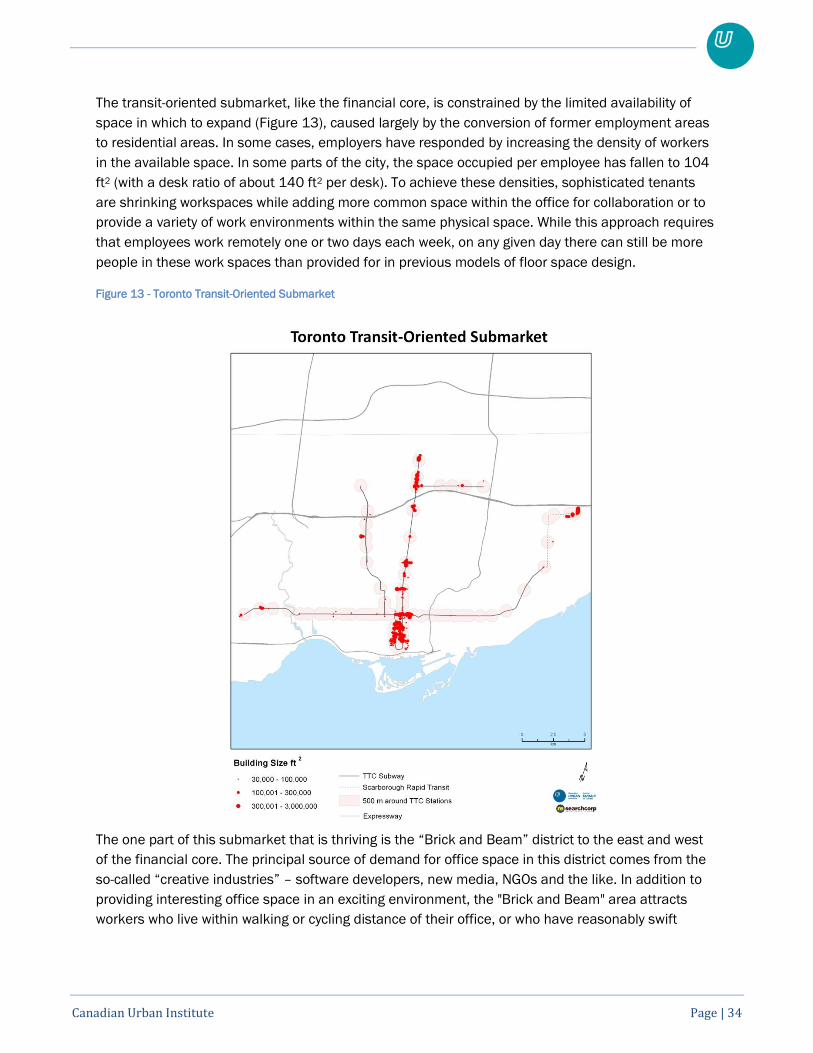
Canadian Urban Institute Page | 34
The transit-oriented submarket, like the financial core, is constrained by the limited availability of
space in which to expand (Figure 13), caused largely by the conversion of former employment areas
to residential areas. In some cases, employers have responded by increasing the density of workers
in the available space. In some parts of the city, the space occupied per employee has fallen to 104
ft2 (with a desk ratio of about 140 ft2 per desk). To achieve these densities, sophisticated tenants
are shrinking workspaces while adding more common space within the office for collaboration or to
provide a variety of work environments within the same physical space. While this approach requires
that employees work remotely one or two days each week, on any given day there can still be more
people in these work spaces than provided for in previous models of floor space design.
Figure 13 - Toronto Transit-Oriented Submarket
The one part of this submarket that is thriving is the “Brick and Beam” district to the east and west
of the financial core. The principal source of demand for office space in this district comes from the
so-called “creative industries” – software developers, new media, NGOs and the like. In addition to
providing interesting office space in an exciting environment, the "Brick and Beam" area attracts
workers who live within walking or cycling distance of their office, or who have reasonably swift
Canadian Urban Institute Page | 35
access by public transit. Thus there is a clear relationship between the surge in residential growth in
Toronto‟s central area and the demand for office space.
The role of the "Brick and Beam" area in the Toronto office market should not be underestimated. In
addition to filling an important niche in the market, the "Brick and Beam" redevelopment process
places considerably less pressure on prospective landlords. The former industrial structures are
often built out at densities that exceed all but the largest office projects. The floor plates also lend
themselves to the assembly of many smaller tenancies rather than requiring that the landlord secure
a single large tenant. Although an elite group of developers have created significant portfolios of
high-quality renovated space, there are also properties in the area that offer “the look” of exposed
brick at lower cost but without upgraded services.
What would be the consequences of business as usual for the transit-oriented submarket?
The lack of growth in the Toronto transit-oriented submarket represents a wasted infrastructure
asset. Despite municipal policies to encourage development along Toronto‟s “Avenues” (major
streets with transit access), many parts of the existing system are underused. Some stations on the
Bloor-Danforth and Spadina subway lines are surrounded by medium or low-density residential
areas. At the same time, expansions of the subway and streetcar lines have been planned for
underserved residential areas rather than office employment clusters. Attempts to create new
"downtowns" within Toronto (such as those in Scarborough and Etobicoke) have not found favour
with the office market and the North York Centre has stalled in terms of attracting new offices.
If increasing road congestion starts to stall development in suburban locations, the development
potential of Toronto‟s transit-oriented office clusters may be recognized, even in the absence of
policies to promote their growth. However, developers would have to contend with restrictive zoning
regulations in these areas that might continue to thwart the growth of this submarket.
Despite the success of the "Brick and Beam" district, the City is not at present moving to reproduce
the same approach in other areas in need of revitalization. The same approach could benefit areas
of the city in which there are underused industrial buildings, but to date there are no plans to create
new "Brick and Beam" districts elsewhere in the City.
Toronto Non-Transit Office Clusters
There has been no new growth to speak of in this submarket for more than 25 years (Figure 14). This
is the submarket in which tax inequities are most keenly felt by landlords and tenants, because
higher taxes are not matched with benefits such as a rapid transit and access to amenities.
This situation exists because the commercial tax class applies uniformly to all existing office
buildings in the City of Toronto, regardless of whether or not they are served by rapid transit. For
buildings in clusters near municipal borders, landlords and tenants bear a particularly unfair burden,
because office buildings in the same cluster located on the other side of the border benefit from
considerably lower tax rates. This situation discourages landlords from investing in their properties,
because they are forced to accept lower net rents in order to be competitive.
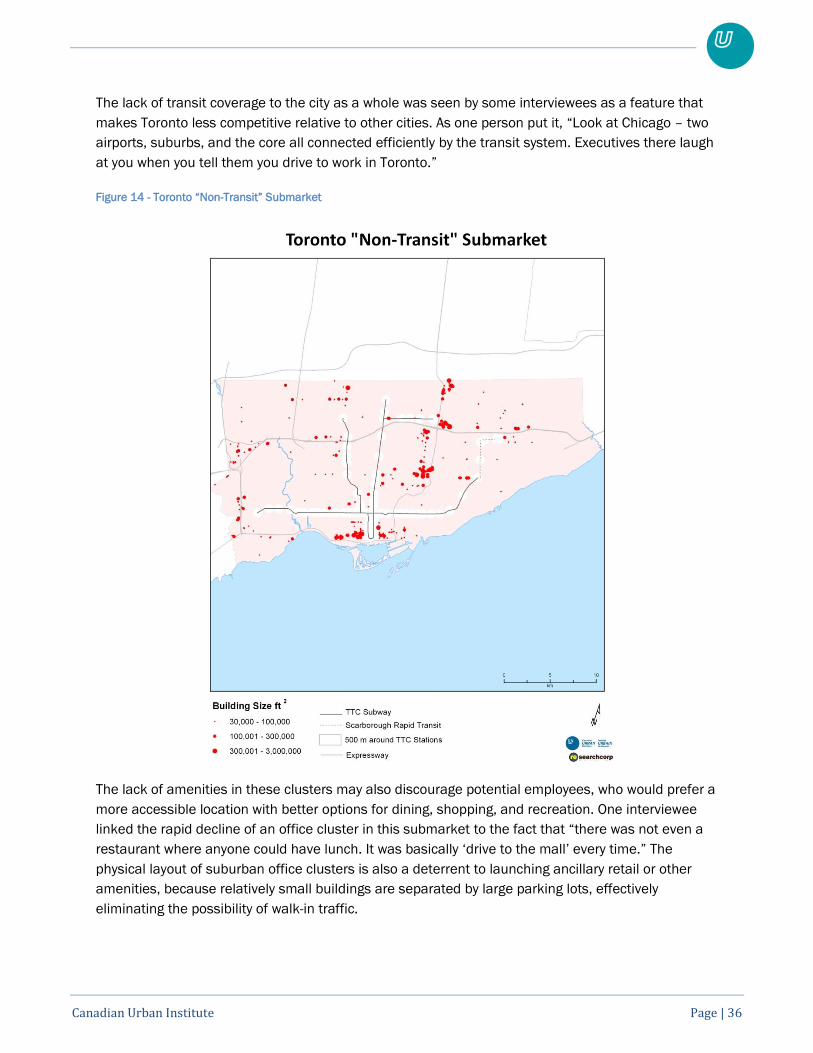
Canadian Urban Institute Page | 36
The lack of transit coverage to the city as a whole was seen by some interviewees as a feature that
makes Toronto less competitive relative to other cities. As one person put it, “Look at Chicago – two
airports, suburbs, and the core all connected efficiently by the transit system. Executives there laugh
at you when you tell them you drive to work in Toronto.”
Figure 14 - Toronto “Non-Transit” Submarket
The lack of amenities in these clusters may also discourage potential employees, who would prefer a
more accessible location with better options for dining, shopping, and recreation. One interviewee
linked the rapid decline of an office cluster in this submarket to the fact that “there was not even a
restaurant where anyone could have lunch. It was basically „drive to the mall‟ every time.” The
physical layout of suburban office clusters is also a deterrent to launching ancillary retail or other
amenities, because relatively small buildings are separated by large parking lots, effectively
eliminating the possibility of walk-in traffic.
Canadian Urban Institute Page | 37
Although these areas are perhaps the least competitive in the region, and can perhaps be expected
to shrink over time, there is nonetheless a need to protect the existing investment in large office
clusters in this submarket. Ideally, the expansion of transit services to underserved office clusters
would mean that they would eventually be classified as "transit-oriented areas." Diversifying land
uses in office-only areas would also allow for the addition of amenities that would make them more
appealing to workers.
What would be the consequences of business as usual for the non-transit submarket?
If the City‟s transit plans do not reconnect these areas with the rest of the City, and the areas are not
revitalized to add amenities, the future likely holds only further stagnation and decline in this
submarket.
The inability to improve conditions in this submarket will contribute to a loss of competitiveness
relative to other North American cities such as Chicago, where wages are higher, the cost of living is
lower, the transit system effectively connects all parts of the city and connects people both to the
type of lifestyle they want at home and the amenities they value for their time off. One interviewee
noted: “We send employees there [to Chicago] to work – tens of thousands, but I‟ve never once been
able to bring one back.”
Suburban Car-Dependent Office Clusters
The rapid growth of office clusters adjacent to the 400-series and other highways (Figure 15) has
created important new commercial assets, but called into question the long-term effects of car
dependence.
One major tenant with offices in all four submarkets explained that mode-split is polarized between
the car-dependent suburbs and transit-oriented locations in the City of Toronto: only 15% of its
employees commuting to downtown use their cars, while virtually all employees in the suburban
locations drive because of a lack of alternatives, leading to increased road congestion.
Congestion has been increasing over the past four decades for a variety of reasons. First, car
ownership has increased dramatically, brought on by ongoing suburbanization and the creation of
auto-dependent neighbourhoods. This has been coupled with an increase in car ownership and a
decrease in the number of passengers per vehicle. Commuting patterns are also becoming more
complex as employment has become spread across suburban municipalities (Miller & Shalaby,
2003). Congestion issues are seen as a problem primarily in the suburbs. “Increasing suburban
office growth is the worst thing we can do to limit congestion or promote green,” one tenant
suggested.
At the same time, interviewees noted that some municipalities in the GTA are considering
introducing maximum parking standards. Some employers fear that combined with the trend to
increase the employee density within offices, this move will limit flexibility and lead to a shortage of
employee parking, unless transit is introduced at the same time to offer a reasonable alternative. As
one interviewee put it, “When parking standards are too restrictive, this can affect pre-leasing and
stifle development.”
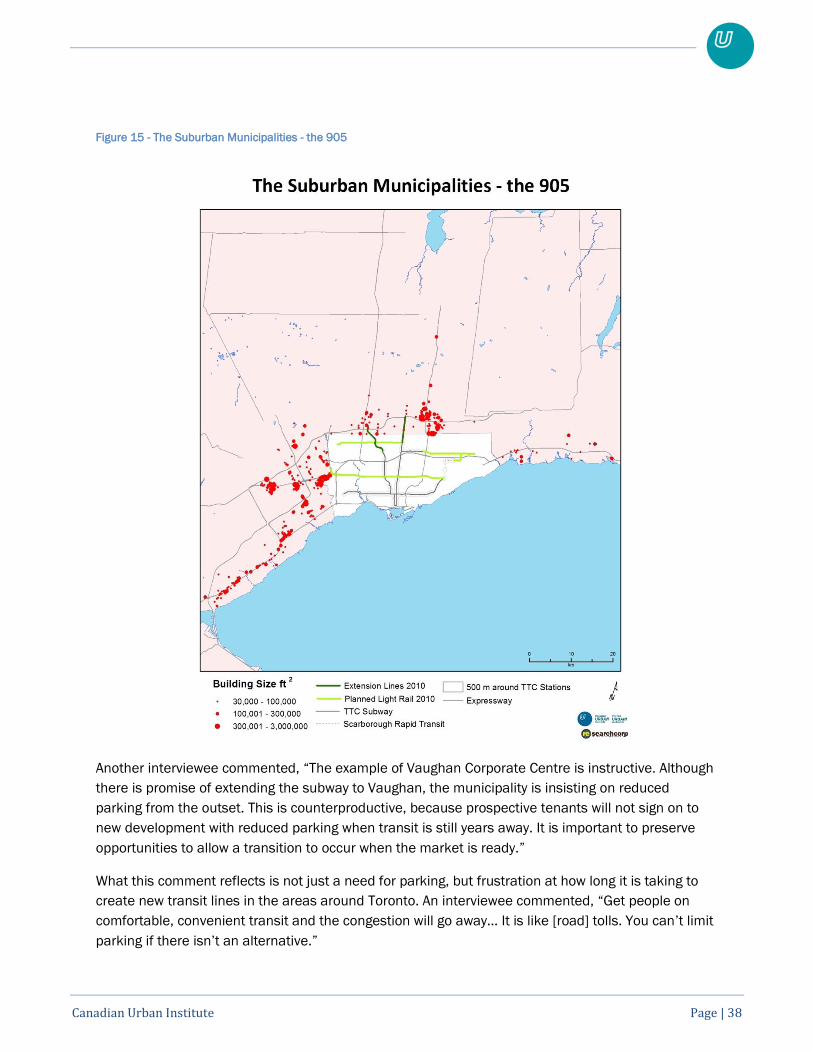
Canadian Urban Institute Page | 38
Figure 15 - The Suburban Municipalities - the 905
Another interviewee commented, “The example of Vaughan Corporate Centre is instructive. Although
there is promise of extending the subway to Vaughan, the municipality is insisting on reduced
parking from the outset. This is counterproductive, because prospective tenants will not sign on to
new development with reduced parking when transit is still years away. It is important to preserve
opportunities to allow a transition to occur when the market is ready.”
What this comment reflects is not just a need for parking, but frustration at how long it is taking to
create new transit lines in the areas around Toronto. An interviewee commented, “Get people on
comfortable, convenient transit and the congestion will go away… It is like [road] tolls. You can‟t limit
parking if there isn‟t an alternative.”
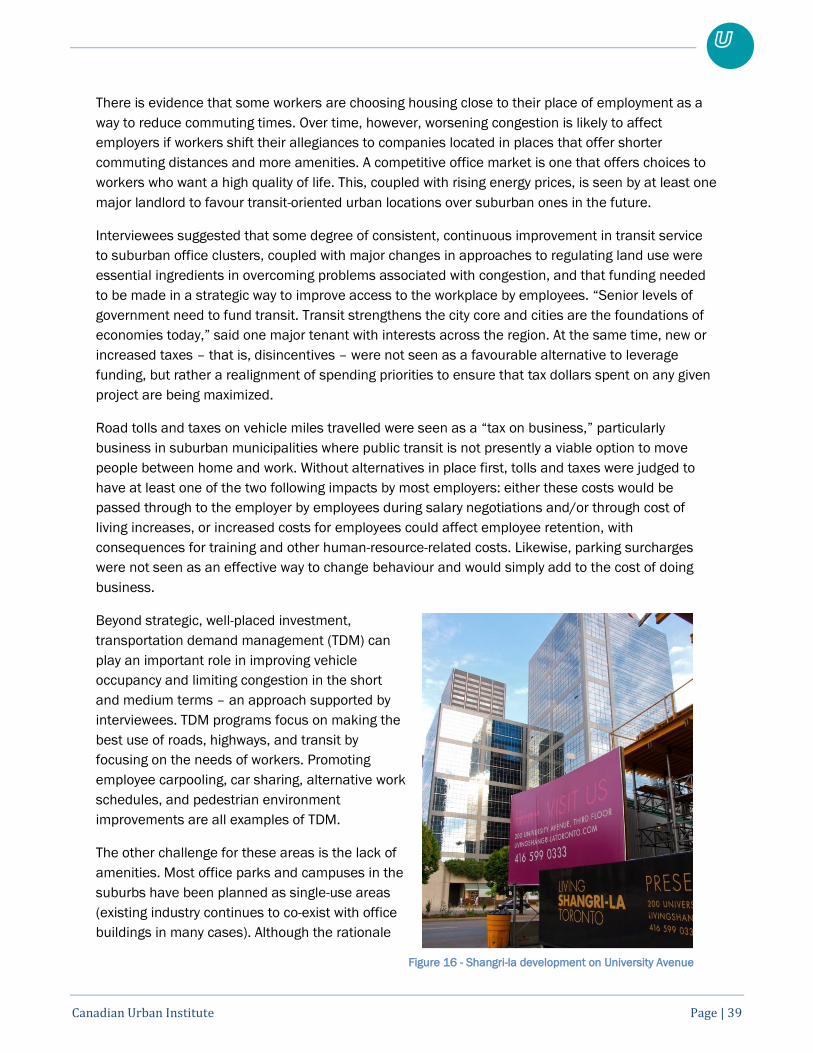
Canadian Urban Institute Page | 39
There is evidence that some workers are choosing housing close to their place of employment as a
way to reduce commuting times. Over time, however, worsening congestion is likely to affect
employers if workers shift their allegiances to companies located in places that offer shorter
commuting distances and more amenities. A competitive office market is one that offers choices to
workers who want a high quality of life. This, coupled with rising energy prices, is seen by at least one
major landlord to favour transit-oriented urban locations over suburban ones in the future.
Interviewees suggested that some degree of consistent, continuous improvement in transit service
to suburban office clusters, coupled with major changes in approaches to regulating land use were
essential ingredients in overcoming problems associated with congestion, and that funding needed
to be made in a strategic way to improve access to the workplace by employees. “Senior levels of
government need to fund transit. Transit strengthens the city core and cities are the foundations of
economies today,” said one major tenant with interests across the region. At the same time, new or
increased taxes – that is, disincentives – were not seen as a favourable alternative to leverage
funding, but rather a realignment of spending priorities to ensure that tax dollars spent on any given
project are being maximized.
Road tolls and taxes on vehicle miles travelled were seen as a “tax on business,” particularly
business in suburban municipalities where public transit is not presently a viable option to move
people between home and work. Without alternatives in place first, tolls and taxes were judged to
have at least one of the two following impacts by most employers: either these costs would be
passed through to the employer by employees during salary negotiations and/or through cost of
living increases, or increased costs for employees could affect employee retention, with
consequences for training and other human-resource-related costs. Likewise, parking surcharges
were not seen as an effective way to change behaviour and would simply add to the cost of doing
business.
Beyond strategic, well-placed investment,
transportation demand management (TDM) can
play an important role in improving vehicle
occupancy and limiting congestion in the short
and medium terms – an approach supported by
interviewees. TDM programs focus on making the
best use of roads, highways, and transit by
focusing on the needs of workers. Promoting
employee carpooling, car sharing, alternative work
schedules, and pedestrian environment
improvements are all examples of TDM.
The other challenge for these areas is the lack of
amenities. Most office parks and campuses in the
suburbs have been planned as single-use areas
(existing industry continues to co-exist with office
buildings in many cases). Although the rationale
Figure 16 - Shangri-la development on University Avenue
Canadian Urban Institute Page | 40
behind restricting development to employment uses made sense during the early years of growth,
today few of these areas offer much in the way of amenities or services.
As one business owner noted, “905 sites have challenges with providing amenities. The costs of
providing amenities have to be borne privately until there is sufficient critical mass to support retail
and related amenity development. Tenants and landlords tend to invest in suburban amenities to
compensate for a sterile environment.” This means that a company that locates in a suburban
location will have added costs for providing the kind of amenities needed to attract the employees
they want – such as exercise facilities, cafeterias, and the like.
Other interviewees said that they simply avoid the 905 submarket, because the employees they want
are young knowledge workers who would find the suburban office campus a deterrent. These
workers want easy access to the amenities of downtown or midtown Toronto, including nightlife,
upscale shopping, and cultural institutions.
As the GTA office market continues to mature, the time has come to build a more attractive and
ultimately more sustainable, pedestrian-friendly working environment in these suburban office
clusters.
What would be the consequences of business as usual for the suburban submarket?
Office parks that provide office employment uses only, and do not include the kind of shops and
services offered in urban areas, will remain auto-dependent and become increasingly less
competitive as congestion in suburban locations worsens. Moreover, new office development in
isolated suburban areas, away from existing clusters with unused development potential will lead to
further employment sprawl.
Current initiatives intended to mitigate congestion and improve mobility within the region by
expanding the rapid transit network are well intentioned, but as currently configured will not extend
higher-order transit service to several significant clusters of jobs in car-dependent office locations.
Over the long-term, this will negatively affect the region‟s competitiveness by exacerbating
congestion, worsening air quality and consigning hundreds of thousands of office workers to lengthy
and unproductive commutes by automobile. Interviewees also noted the need to dramatically
improve the physical environment within these office clusters, which are characterized by long,
unsheltered walks between buildings and the lack of shops and restaurants. Transforming such
areas into pedestrian-friendly work environments will require a new approach to land-use decision-
making as well as a commitment to extend rapid transit to these clusters.
With respect to the millions of square feet of office space that would remain unconnected from
higher order transit under current plans, interviewees typically felt that transit dollars should be
spent in a way that would better promote the long-term competitiveness of the GTA. To some that
meant subways, while to others it meant connecting LRT lines to suburban clusters. “We should
review the Big Move to ensure that value for dollars spent is maximized,” one interviewee suggested.
Canadian Urban Institute Page | 41
6. Recommendations: Supporting Competitiveness in the GTA
The study makes the following recommendations aimed at facilitating a more competitive
environment for GTA office employment across all four submarkets defined in the report, and the
development sector that supports it.
General Recommendations Related to the Region’s Competitiveness
The GTA enjoys a solid reputation in North America and elsewhere as a well-run, asset-rich
commercial hub, and has grown to become Canada’s largest and most diverse concentration of high
quality office space. There is also evidence of a growing commitment within the development
community to construct “green” office buildings on a significant scale. Over time this trend should
enhance the region’s reputation abroad as an attractive place to invest. But these efforts will fall
short of the mark if the momentum of future growth continues to be in locations completely
dependent on car access. Current initiatives intended to mitigate congestion and improve mobility
within the region by expanding the rapid transit network are well intentioned, but as currently
configured will not extend higher-order transit to all the major clusters of jobs in car-dependent
office locations. Over the long-term, this omission will negatively affect the region’s competitiveness
by exacerbating congestion, worsening air quality and consigning hundreds of thousands of office
workers to lengthy commutes by automobile.
The provincial Places to Grow legislation has provided a much needed focus on higher-intensity,
compact, mixed-use development in the Greater Golden Horseshoe, and in particular, clear direction
for the future development of the Greater Toronto Area. A shortcoming of the present plans is that
even after build-out of the planned rapid transit network expansion, about 98 million ft2 of office
development will still be beyond the reach of higher order transit.
In 2005, the City and province both recognized the problems with the current realty taxation system.
Since then, both governments have been taking steps to address them, but progress has been slow
and limited.
1. The gap between high commercial realty taxes and low residential tax rates in the City of
Toronto must be narrowed. The City recognized this in 2005 and has begun the process. This
process should be accelerated.
2. Tax and land use policy must recognize that office jobs are the only form of high density
employment, representing more than one third of all jobs (estimated at 1 million jobs) in the
region. Steps need to be taken to modify public policy to create a competitive environment
for office development in all four sub-markets identified in this report.
3. The Growth Plan should be amended to recognize that significant concentrations of office
space exist outside of the designated Growth Centres, and need to be integrated into the
strategy for creating Growth Centres.
4. The province should work with local municipalities in the GTA to adjust priorities and fine
tune the planned roll-out of rapid transit projects to better connect 108 million square feet of
office space that is currently dependent on automobile access.
Canadian Urban Institute Page | 42
5. The province should create the legislation necessary to require binding commitments for
transit-supportive development along transportation corridors in advance of transit
construction.
Protecting and Enhancing the Primacy of Toronto’s Financial Core
Downtown Toronto, and in particular, the area that encompasses the high value commercial office
towers of the financial core, provides essential services and amenities to firms in the Financial
Services sector and associated businesses. The businesses in the financial core are constrained by
the limited availability of space for new office development, caused by the conversion of sites to
residential use. As well, there is a very limited supply of available development sites for office uses.
A further constraint on growth in this area is that the timeframe for development approvals is
seriously out of synch with the business cycle, which forces companies to consider relocating to the
suburbs.
It is critical to acknowledge the importance that the financial services sector plays with respect to
the long-term prosperity of the region, as there are many examples in other centres across the world
that have experienced serious impacts as a result of over-reliance on a single source of employment
and wealth creation.
6. The City of Toronto, supported by the Province of Ontario, should explicitly acknowledge the
primacy and key role played by the Financial Core beyond statements in the Official Plan and
take the steps to identify and designate, through new zoning and other planning initiatives,
office building development sites to ensure an adequate long-term supply of high quality,
transit-oriented sites for future development.
7. The City of Toronto and the province should work to accelerate the progress towards
balancing the commercial tax burden and making commercial property taxes more
competitive in Toronto‟s commercial sector.
8. The City of Toronto is at present heavily dependent on a single major employment sector -
financial services. It is paramount that steps be taken to enhance and foster the continued
prosperity of this sector in order to ensure the economic health and future competitiveness
of the region.
Reinforcing the Attractiveness of Toronto’s Transit-Oriented Submarket
Some commercial concentrations on existing higher-order transit lines have remained stagnant for
the past 20 years. Further growth in these areas is restrained by high cost and restrictive zoning
regulations. New policies need to be developed to encourage development in these areas. The
synergy between private-sector development interests and public investment in essential
transportation infrastructure has been one of the hallmarks of success supporting growth of the
office market in the GTA, particularly in the financial core and the City’s transit-oriented submarket.
9. The City of Toronto should encourage high-intensity office development along the existing
subway system by re-evaluating land use policy within a five-minute walk of subway stations
and designating sites appropriate for office employment development.

Canadian Urban Institute Page | 43
10. Land use policy and the development approvals process for the creation of office buildings
must acknowledge that the maximum time for employers to make a commitment to new
facilities through to occupancy is three years.
Re-Evaluating Development Priorities in Toronto’s Non-Transit Submarket
The commercial tax class applies uniformly to all existing office buildings in the City of Toronto,
regardless of whether or not they are served by higher order transit; for buildings located in market
clusters in proximity to the municipal borders, this places an unfair burden on both landlord and
tenant in such buildings, because office buildings in the same cluster located on the other side of
the municipal border benefit from considerably lower tax rates. An important negative effect of this
condition is that it discourages landlords from investing in their properties, because they are forced
to accept lower net rents in order to be competitive in the local market.
The viability of existing office buildings in Toronto’s non-transit submarket is called into question
when local conditions preclude the development of new office buildings – a market that does not
grow risks atrophy. There has been no new growth to speak of in this submarket for more than 25
years. A new approach is needed. The success of policy changes in the “Brick and Beam” district
offers a precedent for revitalizing stagnant employment areas in the city. Acknowledging that tax
disparities are an economic reality for the foreseeable future, efforts should be made to enhance
the value proposition for existing landlords and tenants as well as to attract new investment.
11. Relying on the successful precedent in “the Kings” (otherwise known as the "Brick and
Beam" districts either side of the financial core), the City of Toronto should focus on creating
better value for existing and new investors by planning for a variety of new, high-intensity,
multi-function uses in the Toronto non-transit submarket compatible with existing office
buildings which take advantage of existing or proposed infrastructure investments.
12. As part of the upcoming Official Plan Review, the City of Toronto should consider expanding
the range of permitted uses in selected employment areas while increasing opportunities for
office development in others.
13. The City of Toronto should recognize that prime development land currently being absorbed
by residential condominium builders must be balanced by a similar designation for office
building intensification in corridors where future higher-order transit is planned.
Consolidating the Strengths and Reinforcing the Long-Term Viability of Suburban Car-Dependent
Office Clusters
This report has described how the rapid growth of office clusters near the 400-series and other
major highways has created important new commercial assets, but reinforced car dependence and
led to unacceptably high levels of traffic congestion in the suburbs. Recognizing that there are a
number of office clusters with significant intensification potential in suburban areas of the GTA, and
acknowledging that further sprawl in the office market is not in the public interest, the province
should integrate these clusters with its regional development plans.
Office parks that provide for only office employment, and neglect the demand for a range of
retailing, services and amenities which exist in urban areas, will remain auto-dependent and
Canadian Urban Institute Page | 44
become increasingly less competitive as congestion in suburban locations worsens. Moreover, new
office development in isolated suburban areas, away from existing clusters with further development
potential will encourage further employment sprawl.
14. Working collaboratively with affected municipalities, the Province of Ontario should amend its
Provincial Policy Statement (currently under review) to preclude the development of
additional suburban office sites that do not fall within existing “suburban office nodes.”
15. In the spirit of intensification advocated in the provincial Growth Plan, suburban
municipalities should work to actively expand the range of uses and functions permitted in
suburban office nodes in order to improve their "functionality" and develop an environment
more conducive to pedestrian activity and transit use.
Canadian Urban Institute Page | 45
Works Cited
Boston Consulting Group. (1995). The Fourth Era: The Economic Challenges of the GTA.
Boston Consulting Group. (2009). Partnership and Action: Mobilizing Toronto's Financial Sector for
Global Advantage. Prepared for the Toronto Financial Services Working Group.
Canadian Urban Institute (2005). Business Competitiveness in the GTA: Why Toronto is Losing
Ground, prepared for the Toronto Office Coalition
Centre for Aviation. (2010). Porter Airlines IPO. Retrieved June 2010, from Centre for Aviation:
http://www.centreforaviation.com/news/2010/04/30/porter-airlines-ipo-document-reveals-red-ink-
but-management-sees-lots-of-blue-sky/page1
City of Toronto. (2005). Enhancing Toronto’s Business Climate: It’s Everybody’s Business. City of
Toronto, City Manager‟s Office. Toronto: City of Toronto.
City of Toronto. (2007). Toronto’s Business Climate - Update. Staff Report, City of Toronto, Office of
the City Manager, Toronto.
City of Toronto. (2008). Agenda for Prosperity. City of Toronto, Mayor‟s Economic Competitiveness
Advisory Committee. Toronto: City of Toronto.
Florida, R. (2004). The Rise of the Creative Class. New York: Basic Books.
Miller, E., & Shalaby, A. (2003). Evolution of Personal Travel in Toronto Area and Policy Implications.
Journal of Planning and Development , 129 (1), 1-26.
Province of Ontario. (2007). Move Ontario 2020 Press Release. Toronto: Province of Ontario.
Province of Ontario. Ministry of Finance (2007). Business Education Tax Reductions.
http://www.fin.gov.on.ca/en/budget/ontariobudgets/2007/table1.html
Province of Ontario. Ministry of Municipal Affairs. (2003). 2004 Financial Information Return.
Toronto: City of Toronto.
Province of Ontario. Ministry of Municipal Affairs. (2008). 2008 Financial Information Return .
Toronto: City of Toronto.
Toronto Board of Trade. (2009). Toronto as a Global City: Scorecard on Prosperity. Sponsored by the
Certified Management Accountants of Ontario.
Toronto Board of Trade. (2010). The Growing Chasm: An Analysis and Forecast of the City of
Toronto’s Finances.

Canadian Urban Institute Page | 46
Appendix 1: Large Format Maps

Canadian Urban Institute Page | 47
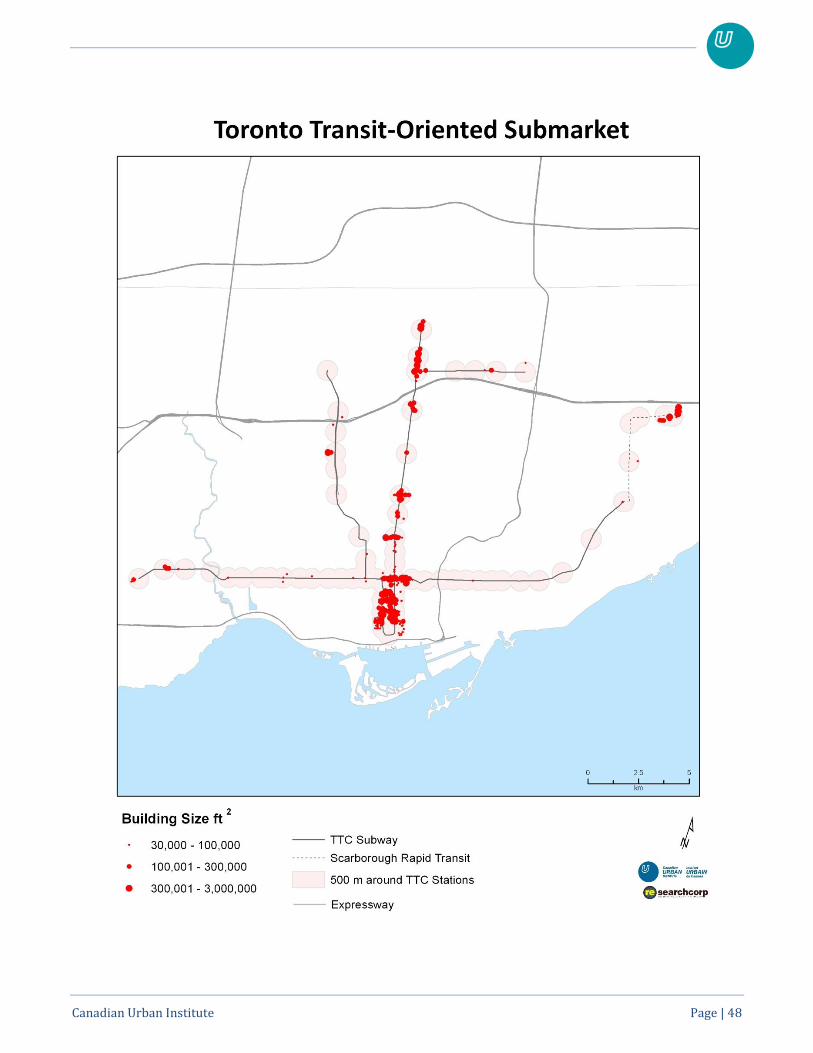
Canadian Urban Institute Page | 48
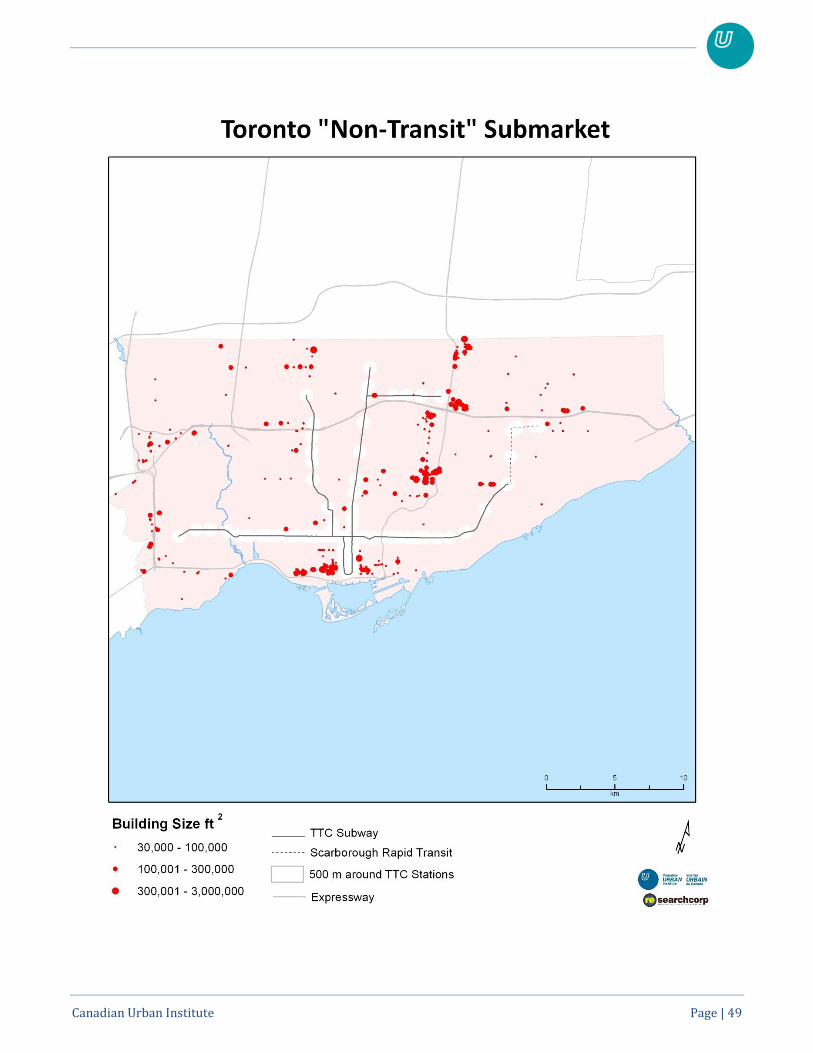
Canadian Urban Institute Page | 49
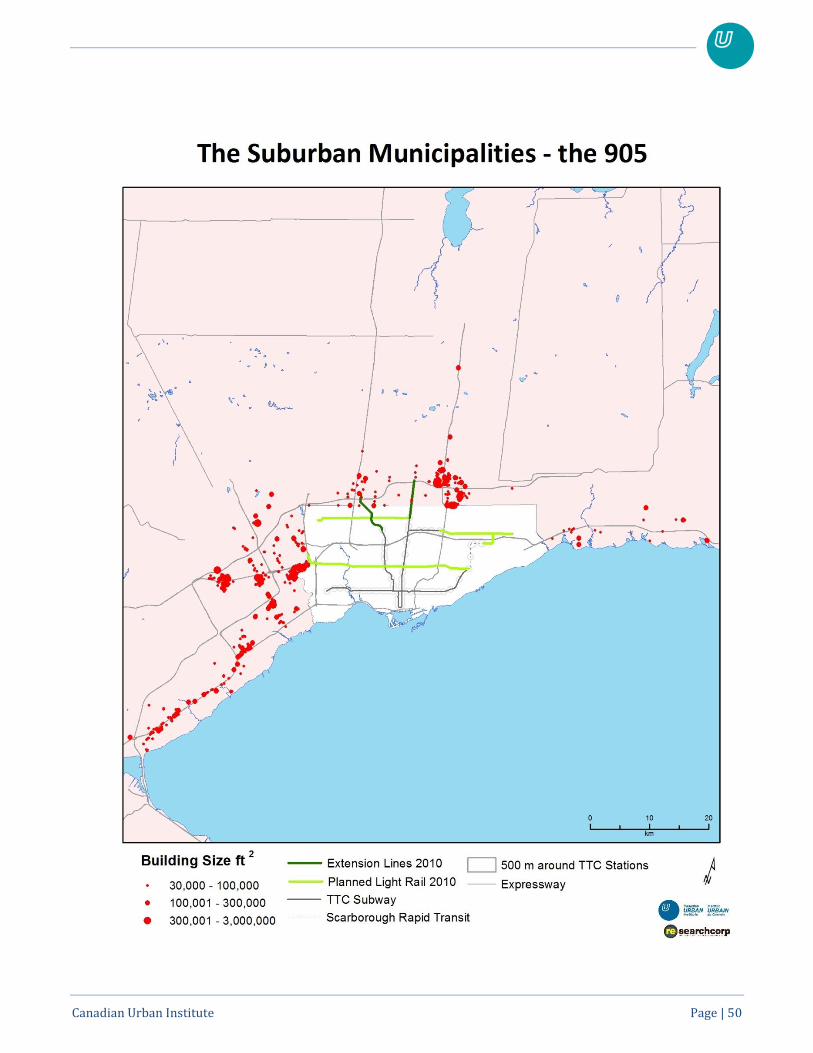
Canadian Urban Institute Page | 50
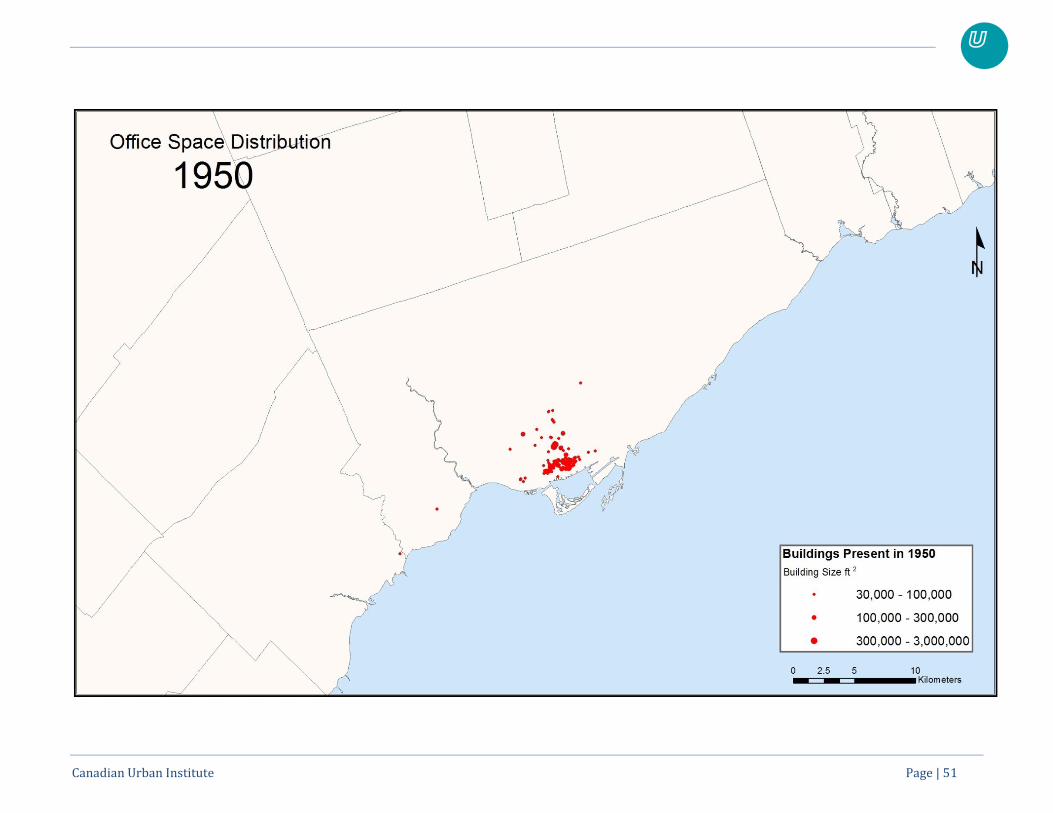
Canadian Urban Institute Page | 51
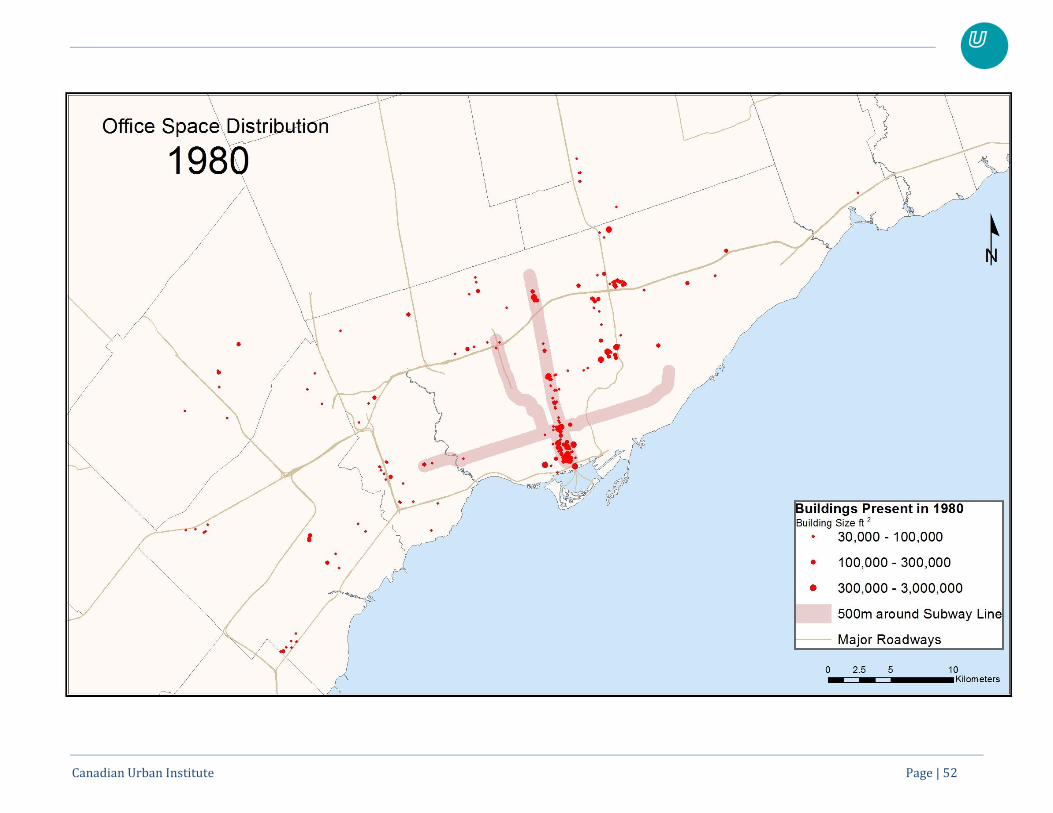
Canadian Urban Institute Page | 52
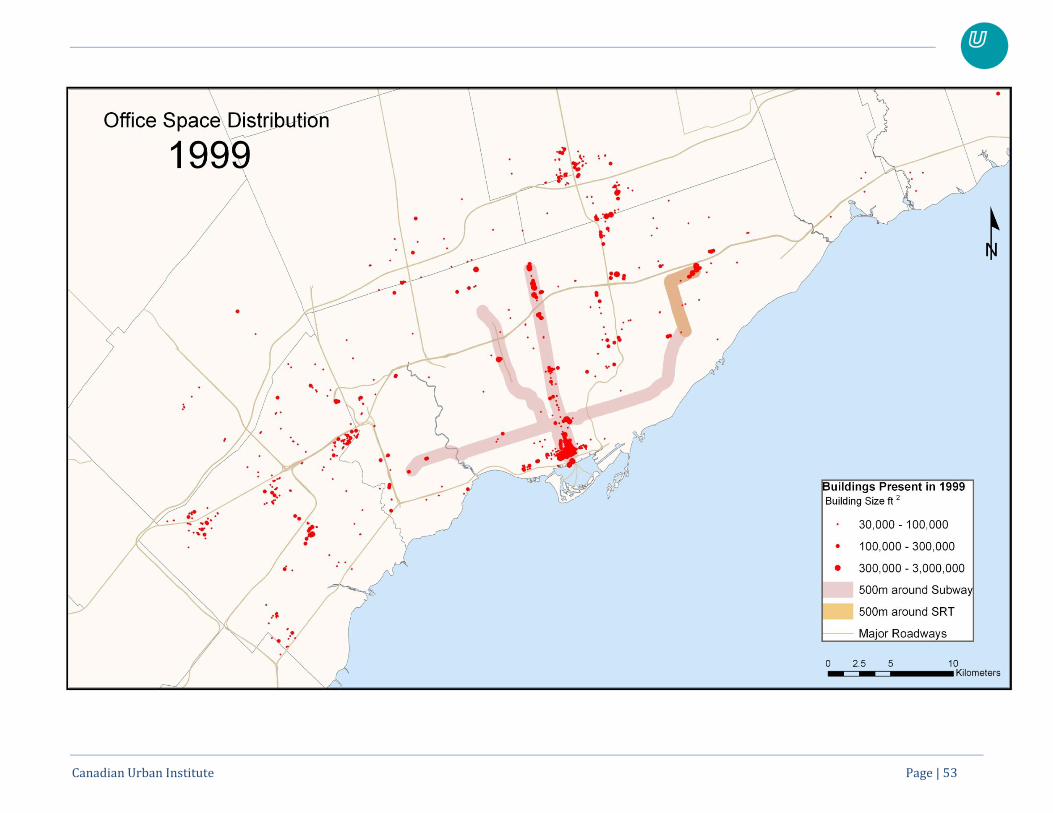
Canadian Urban Institute Page | 53
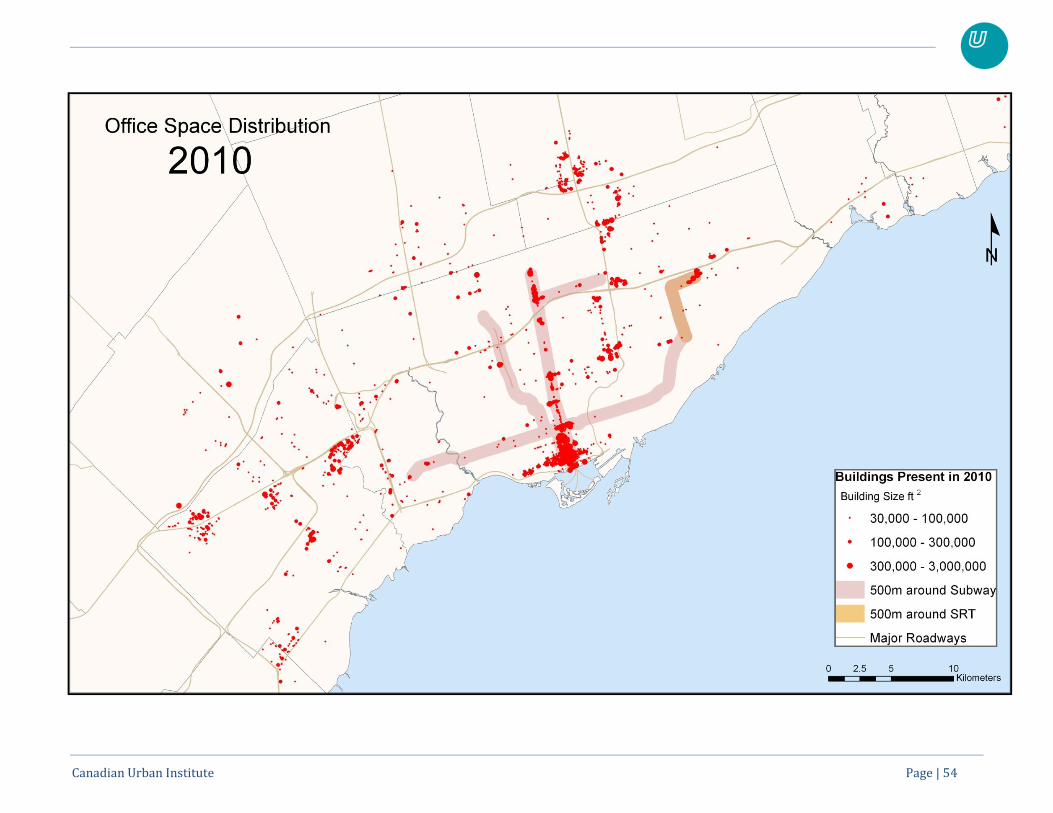
Canadian Urban Institute Page | 54
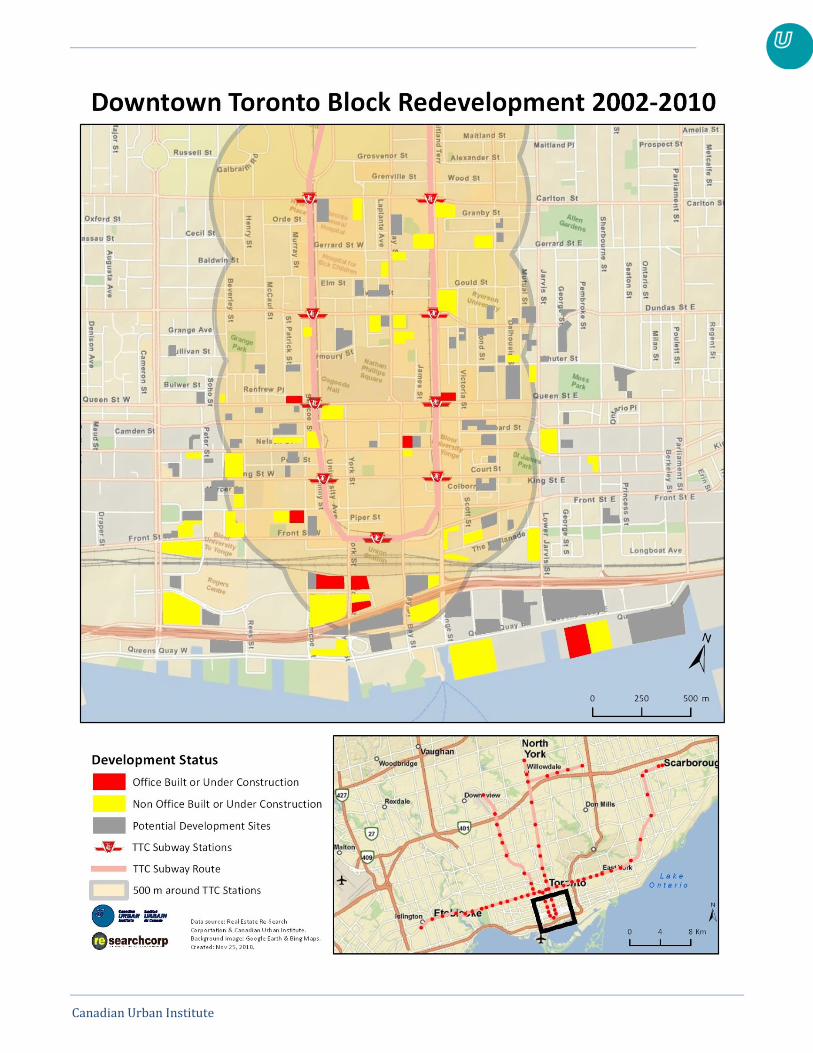
Canadian Urban Institute Page | 55


![[Geography] Location](https://img.pdfslide.us/doc/110x75/563db88b550346aa9a94a84c/geography-location.jpg)