Embed Size (px)
Citation preview
1
The New Geography of Capital Flows
SIEMS Issue ReportSKOLKOVO Institute for Emerging Market Studies
Abstract: Low and Middle income countries have become more prominent in the global geography of capital flows in recent years both as a source and des-tination. The BRICs but also Malaysia and South Africa are among the drivers for this recent phenomenon. This paper attempts to draw a general picture of recent trends in global capital flows and on FDI in particular. To address this last issue we use the database of Merger & Acquisitions from Thomson Financial. In the last decade, the South has emerged both as a destination and a source of M&A flows. The South is also directing a large proportion of its deals to the South, suggesting a greater economic integration among develop-ing economies. The weighted average income per capita of southern countries in South-North deals is considerably lower than those in South-South deals. This suggests a distinction between South-South and South-North integration. The evidence suggests that the 2008 crisis has not only not reversed the trend of increasing South participation in cross-border M&A deals but further ac-centuated it due to the relative better economic performance of the emerging economies during this period. Even if the pace of M&As were to slow down, the effects of cross-border activity brings an opportunity for the private sector in developing economies to tap into new markets, to access new technologies and resources, to spread risks, to reduce costs, and to increase competitive-ness. For that reason we also look to the allocation of M&A deals across eco-nomic sectors. Gains to developing economies may come in the form of lower prices and broader access to quality products and services. The challenge is to see how different sectors and economies can benefit from this new wave of cross-border activity.
E-mail: [email protected]. I would like to thank Irene Depetris Chauvin for access to the M&A data, Mhamed Biygautane for assistance with the tables in section II, and William Wilson for useful comments. All remain-ing errors are mine.
Author:Nicolás M. Depetris Chauvin, Ph.D.(Visiting Senior Research Fellow at SIEMS & Dubai School of Government, [email protected])
Editor-in-Chief: Sam Park, Ph.D. ([email protected])
1SIEMS ISSuE REpoRt
Executive Summary 2
Introduction 4
I. MappING CapITaL FLOwS: SaVERS VS. SpENdERS IN ThE GLObaL ECONOMy 5
II. aNaLySIS OF ThE MaIN ExTERNaL CapITaL FLOwS STRuCTuRE 13
III. FOREIGN dIRECT INVESTMENT aNd MERGERS aNd aCquISITIONS: ThE EMER-
GENCE OF ThE SOuTh 17
IV. ThE pOTENTIaL EFFECTS OF SOuTh FdI 47
V. CONCLuSIONS 50
Appendix 54
References 62
Content
2 The New GeoGraphy of CapiTal flows
Executive Summary
This study draws a general picture of recent trends in global capital flows. The data shows a changing world economic dynamic where a new pattern of cross-border financial and trade flows is emerging. While it is not clear whether this new wave is going to last, the emergence of these flows and their implications for growth and employment creation are already bringing new challenges to the formulation of national economic policies both in developed and develop-ing countries.
Global macro imbalances are at the core of the surge in excess savings (or current account surpluses) in a group of commodity-producing countries and China. The examination of the data suggests that the official sector in this group of countries has become a key player in the allocation of assets across countries and has helped finance the global imbalances. However, we also find that the private sector in the same group of countries has become an important source of capital. In 2009, middle income countries were responsible for about 8.1 % of the total amount of capital outflows, which is almost three times as large a share as it was in year 2000. The conciliation of both outflows and inflows data by income groups suggests that middle income countries have became more important not only as a source but also as a destination of capital flows.
The analysis of the aggregate data does not allow us to fully understand the increasing relevance of a group of emerging economies. For that reason, we decided to map and study the participation of the southern economies in global cross-border merger and acquisition activity over an extended period of time. We draw on M&A data from Thomson Financial Database. The study looked at the participation of the South by focusing largely on the number of deals.
Our findings suggest that the South has in the last decade emerged as a destination but also as a source of M&A flows. South-South deals have soared suggesting greater integration of the region. Although the share of southern deals directed to the North are getting smaller relatively to the share of south-ern deals directed to the South, the weighted average income per capita of
3
southern countries in South-North deals are considerably lower than those in South-South deals suggesting that relatively poorer countries among the South are pushing the increase in the South-North integration. Overall the BRICs (Brazil, Russia, India, and China) and a reduced set of emerging countries, including Malaysia and South Africa, are behind this new phenomenon of the South as a source of foreign direct investments. The same set of countries plus Ukraine, Indonesia, and Mexico are the favourite destination among the M&A deals targeting the South.
Overall, the priority sector for firms in the South seems to be similar whether they reach a firm in the South or the North. Investments in materi-als, financial, and industrial sectors account for 45% to 50% of the number of deals. However, there are important differences when looking to the sectors that are not among the top in terms of the number of deals. Consumer staples and energy and power have a higher share among South-South than among South-North deals while the opposite happens in more advanced sectors such as high technology, healthcare, and media and communications. This suggests that South firms reach North companies to both access new markets and tech-nology, and target South companies for raw materials and traditional markets.
The recent increase in the participation of the South in global cross-border M&A activity raises a number of questions. First, is the increase in the South participation a lasting phenomenon? Considering that some possible triggers were the boom in commodity prices pushing profits of commodity suppliers in emerging economies to unprecedented levels, the increase in stock market valuation in emerging markets amplifying the funding options of local enterprises, and the prevalent availability of cheap credit until mid 2008, it is quite possible that the upswing in M&A activity both coming from and targeting the South was a temporary incident. While it is too early to fully understand the effect of the crisis, the M&A deal data for 2010 suggests a faster recovery in the number and value of the deals targeting or having the South as a source in comparison with the North counterpart.
Even if the pace of South involvement in cross-border M&As were to slow down, the global and transnational production networks initiated by these M&As are unlikely to go away, suggesting that the effects of cross-border activity bring an opportunity for the private sector in developing economies to tap into new markets, to access new technologies and resources, to spread risks, to reduce costs, and to increase competitiveness. Gains to citizens in developing economies may come in the form of lower prices and broader access to quality products and services. The challenge is to see how different sectors and economies can benefit from this new wave of cross-border activity and how countries’ national policies should respond to this new challenge.
4 The New GeoGraphy of CapiTal flows
Introduction
This study attempts to draw a general picture of recent trends in global capital flows. While detailed data is scarce, our analysis suggests that middle and low income countries have become more prominent in the global geography of capital flows in recent years. China, Russia, Malaysia, South Africa and Brazil are among the middle income countries and India and Nigeria are among the low income countries driving this recent phenomenon.
The recent growth in FDI flows to and from developing countries raises a number of questions. First, is the growth in FDI flows from the South a lasting phenomenon? What are the implications of the development of global and transnational production networks initiated by recent M&A transactions? Even if the pace of M&As were to slow down, the effects of cross-border activity brings an opportunity for the private sector in developing economies to tap into new markets, to access new technologies and resources, to spread risks, to reduce costs, and to increase competitiveness. The challenge is to see how different sectors and economies can benefit from this new wave of cross-border activity and, whether regional trade agreements (RTAs), preferred trade and investment agreements (PTIAs) and other types of trade and investment agreements could be used as useful vehicles for increasing investment coop-eration of this kind.
This paper is structured in six sections. In the next section we characterize the global imbalances by identifying the main importers and exporters of capi-tal in recent years. Section 3 studies the structure of the main external capital flows, which include FDI and portfolio equity and debt. We also describe the increasing importance of the private sector as a source of external resource flows. Section 4 presents a detailed analysis of the number and value of merger and acquisition deals since 1989 and of the role played by the South using the Thomson Financial database. The importance of FDI to developing countries and the potential benefits of South-South FDI are discussed in section 5. Sec-tion 6 finishes with some concluding remarks.
5MappING CapITaL FLOwS: SaVERS VS. SpENdERS IN ThE GLObaL ECONOMy/ SIEMS ISSuE REpORT
MappING CapITaL FLOwS: SaVERS VS.
SpENdERS IN ThE GLObaL ECONOMy
1
6 The New GeoGraphy of CapiTal flows
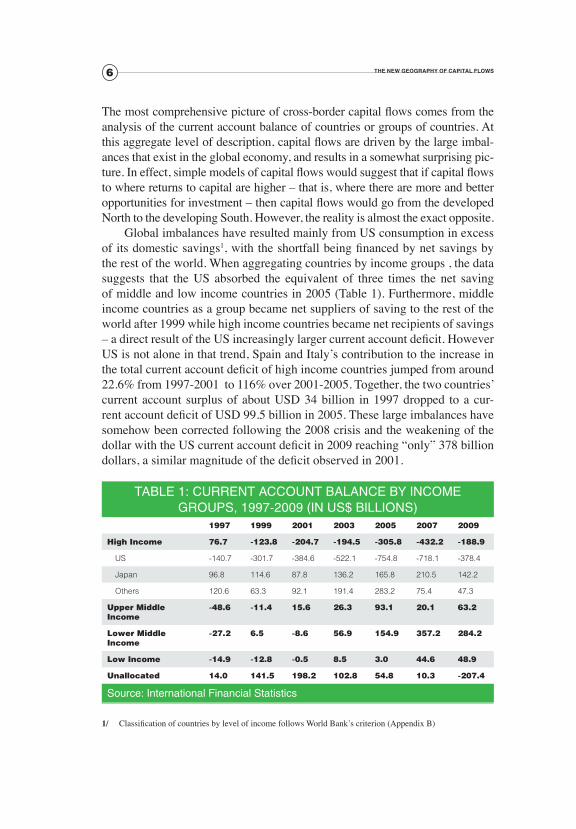
The most comprehensive picture of cross-border capital flows comes from the analysis of the current account balance of countries or groups of countries. At this aggregate level of description, capital flows are driven by the large imbal-ances that exist in the global economy, and results in a somewhat surprising pic-ture. In effect, simple models of capital flows would suggest that if capital flows to where returns to capital are higher – that is, where there are more and better opportunities for investment – then capital flows would go from the developed North to the developing South. However, the reality is almost the exact opposite.
Global imbalances have resulted mainly from US consumption in excess of its domestic savings1, with the shortfall being financed by net savings by the rest of the world. When aggregating countries by income groups , the data suggests that the US absorbed the equivalent of three times the net saving of middle and low income countries in 2005 (Table 1). Furthermore, middle income countries as a group became net suppliers of saving to the rest of the world after 1999 while high income countries became net recipients of savings – a direct result of the US increasingly larger current account deficit. However US is not alone in that trend, Spain and Italy’s contribution to the increase in the total current account deficit of high income countries jumped from around 22.6% from 1997-2001 to 116% over 2001-2005. Together, the two countries’ current account surplus of about USD 34 billion in 1997 dropped to a cur-rent account deficit of USD 99.5 billion in 2005. These large imbalances have somehow been corrected following the 2008 crisis and the weakening of the dollar with the US current account deficit in 2009 reaching “only” 378 billion dollars, a similar magnitude of the deficit observed in 2001.
1/ Classification of countries by level of income follows World Bank’s criterion (Appendix B)
TabLE 1: CuRRENT aCCOuNT baLaNCE by INCOME GROupS, 1997-2009 (IN uS$ bILLIONS)
1997 1999 2001 2003 2005 2007 2009
High Income 76.7 -123.8 -204.7 -194.5 -305.8 -432.2 -188.9
US -140.7 -301.7 -384.6 -522.1 -754.8 -718.1 -378.4
Japan 96.8 114.6 87.8 136.2 165.8 210.5 142.2
Others 120.6 63.3 92.1 191.4 283.2 75.4 47.3
upper Middle Income
-48.6 -11.4 15.6 26.3 93.1 20.1 63.2
Lower Middle Income
-27.2 6.5 -8.6 56.9 154.9 357.2 284.2
Low Income -14.9 -12.8 -0.5 8.5 3.0 44.6 48.9
unallocated 14.0 141.5 198.2 102.8 54.8 10.3 -207.4
Source: International Financial Statistics
7MappING CapITaL FLOwS: SaVERS VS. SpENdERS IN ThE GLObaL ECONOMy/ SIEMS ISSuE REpORT
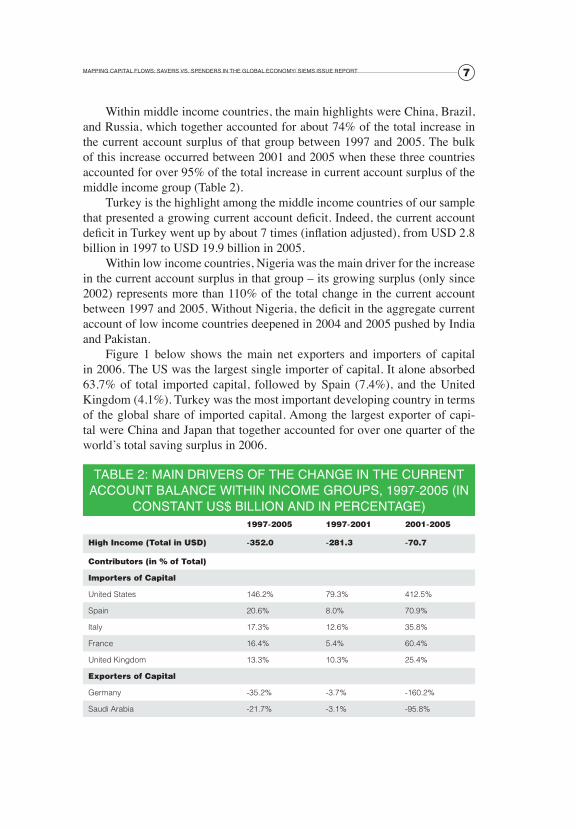
Within middle income countries, the main highlights were China, Brazil, and Russia, which together accounted for about 74% of the total increase in the current account surplus of that group between 1997 and 2005. The bulk of this increase occurred between 2001 and 2005 when these three countries accounted for over 95% of the total increase in current account surplus of the middle income group (Table 2).
Turkey is the highlight among the middle income countries of our sample that presented a growing current account deficit. Indeed, the current account deficit in Turkey went up by about 7 times (inflation adjusted), from USD 2.8 billion in 1997 to USD 19.9 billion in 2005.
Within low income countries, Nigeria was the main driver for the increase in the current account surplus in that group – its growing surplus (only since 2002) represents more than 110% of the total change in the current account between 1997 and 2005. Without Nigeria, the deficit in the aggregate current account of low income countries deepened in 2004 and 2005 pushed by India and Pakistan.
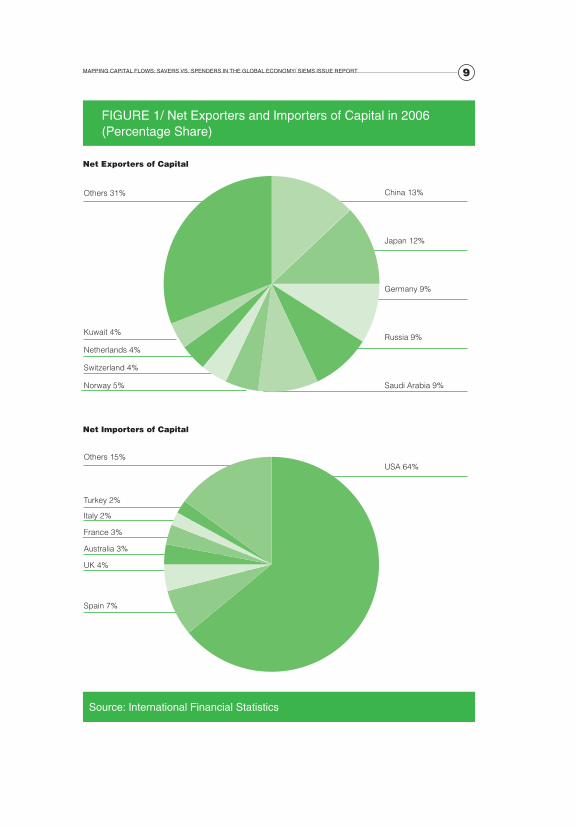
Figure 1 below shows the main net exporters and importers of capital in 2006. The US was the largest single importer of capital. It alone absorbed 63.7% of total imported capital, followed by Spain (7.4%), and the United Kingdom (4.1%). Turkey was the most important developing country in terms of the global share of imported capital. Among the largest exporter of capi-tal were China and Japan that together accounted for over one quarter of the world’s total saving surplus in 2006.
TabLE 2: MaIN dRIVERS OF ThE ChaNGE IN ThE CuRRENT aCCOuNT baLaNCE wIThIN INCOME GROupS, 1997-2005 (IN
CONSTaNT uS$ bILLION aNd IN pERCENTaGE)1997-2005 1997-2001 2001-2005
High Income (total in uSD) -352.0 -281.3 -70.7
Contributors (in % of total)
Importers of Capital
United States 146.2% 79.3% 412.5%
Spain 20.6% 8.0% 70.9%
Italy 17.3% 12.6% 35.8%
France 16.4% 5.4% 60.4%
United Kingdom 13.3% 10.3% 25.4%
Exporters of Capital
Germany -35.2% -3.7% -160.2%
Saudi Arabia -21.7% -3.1% -95.8%
8 The New GeoGraphy of CapiTal flows
Japan -12.0% 6.6% -86.0%
Switzerland -7.6% 1.9% -45.1%
Norway -8.6% -5.7% -20.2%
Canada -8.4% -8.8% -6.8%
Others -20.4% -2.7% -90.9%
Middle Income (total in uSD) 300.1 88.2 211.9
Contributors (in % of total)
Importers of Capital
Turkey -5.7% 6.9% -11.0%
South Africa -1.9% 3.1% -4.0%
Exporters of Capital
China 34.0% -25.8% 58.9%
Russia 24.8% 37.5% 19.6%
Brazil 15.1% 11.5% 16.6%
Malaysia 8.0% 15.3% 5.0%
Venezuela 6.2% -2.4% 9.7%
Argentina 6.0% 10.6% 4.1%
Others 13.5% 43.2% 1.1%
Low Income (total in uSD) 18.7 15.6 3.1
Contributors (in % of total)
Nigeria 110.8% 11.7% 605.2%
Others -10.8% 88.3% -505.2%
Source: International Financial Statistics
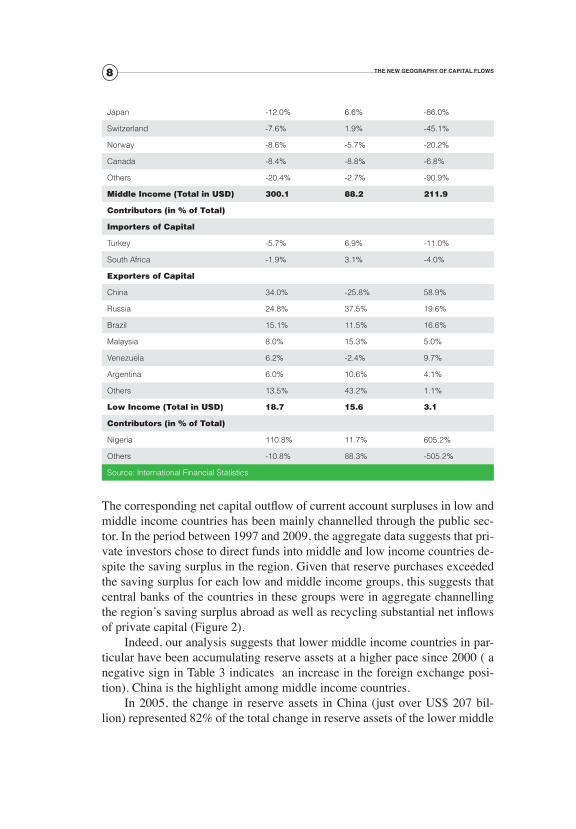
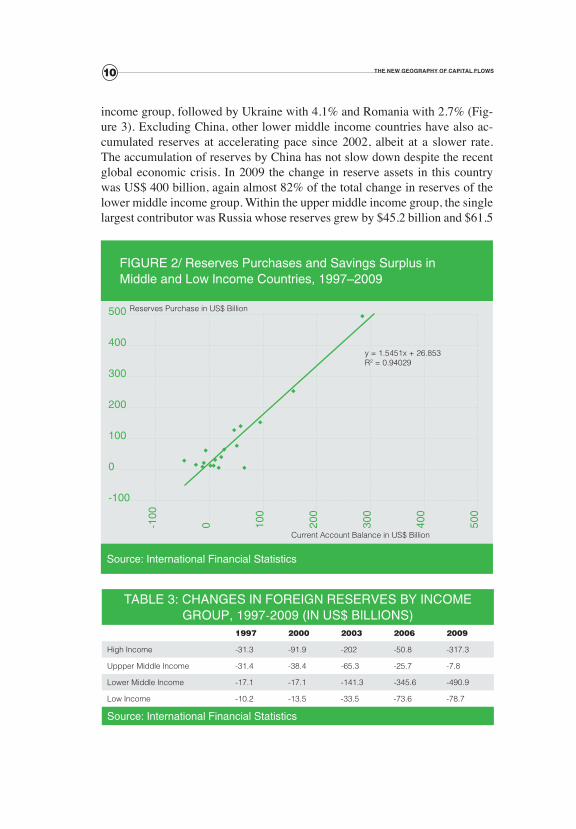
The corresponding net capital outflow of current account surpluses in low and middle income countries has been mainly channelled through the public sec-tor. In the period between 1997 and 2009, the aggregate data suggests that pri-vate investors chose to direct funds into middle and low income countries de-spite the saving surplus in the region. Given that reserve purchases exceeded the saving surplus for each low and middle income groups, this suggests that central banks of the countries in these groups were in aggregate channelling the region’s saving surplus abroad as well as recycling substantial net inflows of private capital (Figure 2).
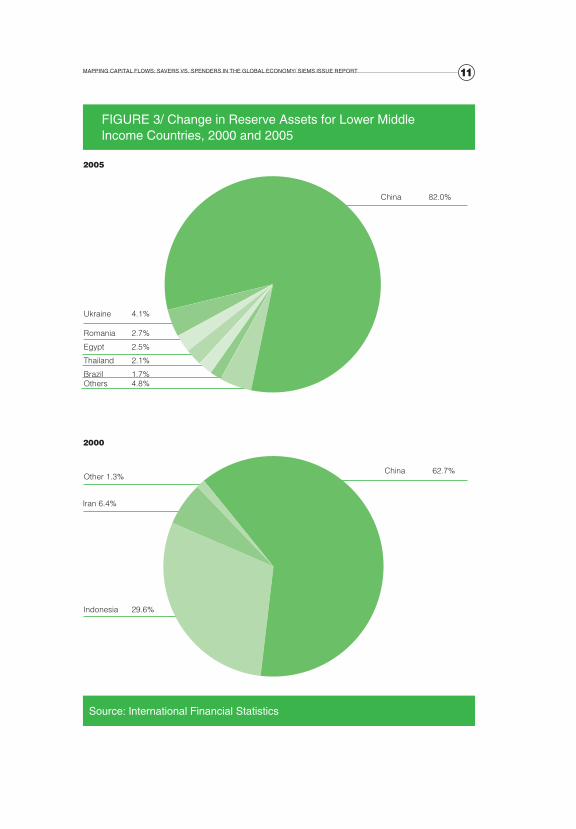
Indeed, our analysis suggests that lower middle income countries in par-ticular have been accumulating reserve assets at a higher pace since 2000 ( a negative sign in Table 3 indicates an increase in the foreign exchange posi-tion). China is the highlight among middle income countries.
In 2005, the change in reserve assets in China (just over US$ 207 bil-lion) represented 82% of the total change in reserve assets of the lower middle
9MappING CapITaL FLOwS: SaVERS VS. SpENdERS IN ThE GLObaL ECONOMy/ SIEMS ISSuE REpORT
Source: International Financial Statistics
FIGuRE 1/ Net Exporters and Importers of Capital in 2006 (percentage Share)
China 13%
Japan 12%
Germany 9%
Russia 9%
Saudi Arabia 9%
USA 64%
Kuwait 4%
Netherlands 4%
Switzerland 4%
Norway 5%
Turkey 2%
Italy 2%
Others 31%
Others 15%
France 3%
Australia 3%
UK 4%
Spain 7%
Net Exporters of Capital
Net Importers of Capital
10 The New GeoGraphy of CapiTal flows
income group, followed by Ukraine with 4.1% and Romania with 2.7% (Fig-ure 3). Excluding China, other lower middle income countries have also ac-cumulated reserves at accelerating pace since 2002, albeit at a slower rate. The accumulation of reserves by China has not slow down despite the recent global economic crisis. In 2009 the change in reserve assets in this country was US$ 400 billion, again almost 82% of the total change in reserves of the lower middle income group. Within the upper middle income group, the single largest contributor was Russia whose reserves grew by $45.2 billion and $61.5
Source: International Financial Statistics
FIGuRE 2/ Reserves purchases and Savings Surplus in Middle and Low Income Countries, 1997–2009
500
400
300
200
100
0
-100
-100
0 100
200
300
400
500
y = 1.5451x + 26.853R2 = 0.94029
Current Account Balance in US$ Billion
Reserves Purchase in US$ Billion
TabLE 3: ChaNGES IN FOREIGN RESERVES by INCOME GROup, 1997-2009 (IN uS$ bILLIONS)
1997 2000 2003 2006 2009
High Income -31.3 -91.9 -202 -50.8 -317.3
Uppper Middle Income -31.4 -38.4 -65.3 -25.7 -7.8
Lower Middle Income -17.1 -17.1 -141.3 -345.6 -490.9
Low Income -10.2 -13.5 -33.5 -73.6 -78.7
Source: International Financial Statistics
11MappING CapITaL FLOwS: SaVERS VS. SpENdERS IN ThE GLObaL ECONOMy/ SIEMS ISSuE REpORT
Source: International Financial Statistics
FIGuRE 3/ Change in Reserve assets for Lower Middle Income Countries, 2000 and 2005
China 62.7%
Ukraine 4.1%
Other 1.3%
Iran 6.4%
Indonesia 29.6%
China 82.0%
Romania 2.7%
Egypt 2.5%
Thailand 2.1%
Brazil 1.7%Others 4.8%
2005
2000
12 ThE pROduCTIVITy pRIzE aCCOuNTING FOR RECENT ECONOMIC GROwTh aMONG ThE bRICS: MiraCle or MiraGe?
billion in 2003 and 2004 respectively, before jumping to $107 and $148 bil-lion in 2007 and 2008. Russia only accumulated an average of $8.6 billion in reserve assets between 1997 and 2002.
In summary, the surge in excess savings (or current account surpluses) that took place before the crisis appears to have been concentrated in the commodity-producing countries and China. Our data suggests that the official sector has become a key player in the allocation of assets across countries and has helped finance the global imbalances. A similar conclusion is reached by the Global Financial Stability Report (IMF 2007). Using a different aggrega-tion criterion, the report concludes that emerging market countries are now a net supplier of capital to mature market countries through portfolio debt flows. In particular, this movement of capital between emerging and mature countries is primarily channelled through central banks and sovereign wealth funds. China, for instance, which was also the largest exporter of capital in 2006, is estimated to have held in the end of 2005, around 28% of reserves in US treasuries.
In the next section we will turn our focus to the analysis of the evolution of the main external capital flows.
13aNaLySIS OF ThE MaIN ExTERNaL CapITaL FLOwS STRuCTuRE/ SIEMS ISSuE REpORT
aNaLySIS OF ThE MaIN ExTERNaL CapITaL
FLOwS STRuCTuRE
2
14 The New GeoGraphy of CapiTal flows
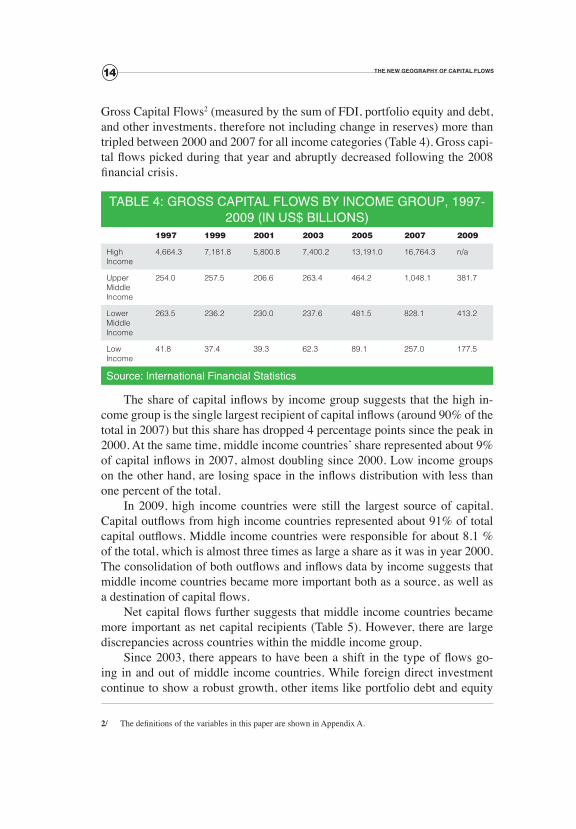
Gross Capital Flows2 (measured by the sum of FDI, portfolio equity and debt, and other investments, therefore not including change in reserves) more than tripled between 2000 and 2007 for all income categories (Table 4). Gross capi-tal flows picked during that year and abruptly decreased following the 2008 financial crisis.
TabLE 4: GROSS CapITaL FLOwS by INCOME GROup, 1997-2009 (IN uS$ bILLIONS)
1997 1999 2001 2003 2005 2007 2009
High Income
4,664.3 7,181.8 5,800.8 7,400.2 13,191.0 16,764.3 n/a
Upper Middle Income
254.0 257.5 206.6 263.4 464.2 1,048.1 381.7
Lower Middle Income
263.5 236.2 230.0 237.6 481.5 828.1 413.2
Low Income
41.8 37.4 39.3 62.3 89.1 257.0 177.5
Source: International Financial Statistics
The share of capital inflows by income group suggests that the high in-come group is the single largest recipient of capital inflows (around 90% of the total in 2007) but this share has dropped 4 percentage points since the peak in 2000. At the same time, middle income countries’ share represented about 9% of capital inflows in 2007, almost doubling since 2000. Low income groups on the other hand, are losing space in the inflows distribution with less than one percent of the total.
In 2009, high income countries were still the largest source of capital. Capital outflows from high income countries represented about 91% of total capital outflows. Middle income countries were responsible for about 8.1 % of the total, which is almost three times as large a share as it was in year 2000. The consolidation of both outflows and inflows data by income suggests that middle income countries became more important both as a source, as well as a destination of capital flows.
Net capital flows further suggests that middle income countries became more important as net capital recipients (Table 5). However, there are large discrepancies across countries within the middle income group.
Since 2003, there appears to have been a shift in the type of flows go-ing in and out of middle income countries. While foreign direct investment continue to show a robust growth, other items like portfolio debt and equity
2/ The definitions of the variables in this paper are shown in Appendix A.
15aNaLySIS OF ThE MaIN ExTERNaL CapITaL FLOwS STRuCTuRE/ SIEMS ISSuE REpORT
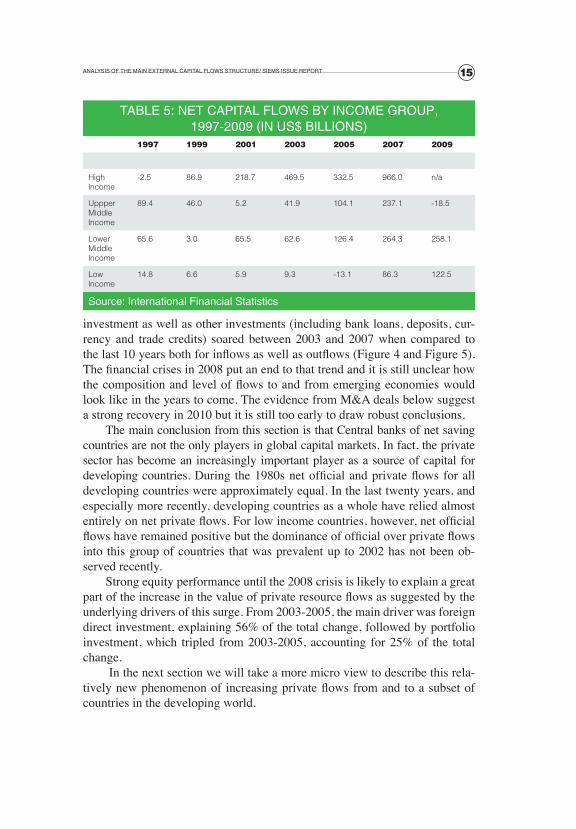
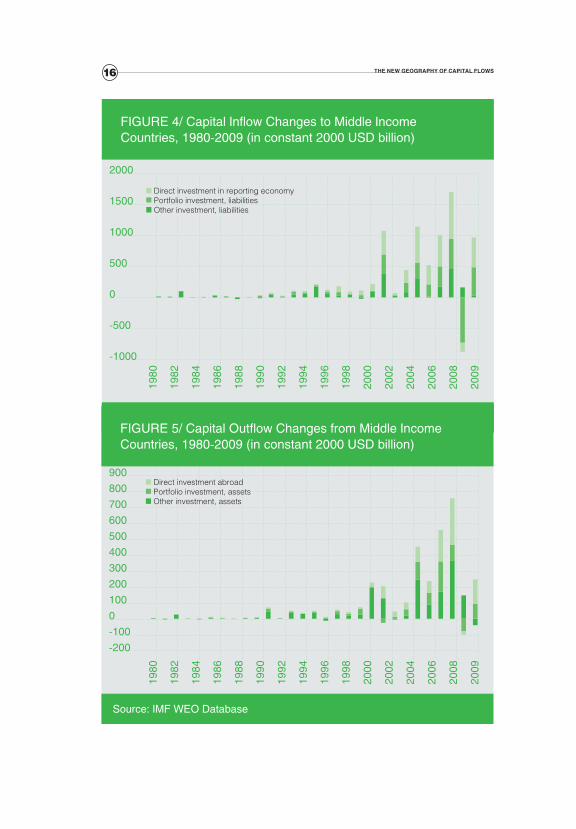
investment as well as other investments (including bank loans, deposits, cur-rency and trade credits) soared between 2003 and 2007 when compared to the last 10 years both for inflows as well as outflows (Figure 4 and Figure 5). The financial crises in 2008 put an end to that trend and it is still unclear how the composition and level of flows to and from emerging economies would look like in the years to come. The evidence from M&A deals below suggest a strong recovery in 2010 but it is still too early to draw robust conclusions.
The main conclusion from this section is that Central banks of net saving countries are not the only players in global capital markets. In fact, the private sector has become an increasingly important player as a source of capital for developing countries. During the 1980s net official and private flows for all developing countries were approximately equal. In the last twenty years, and especially more recently, developing countries as a whole have relied almost entirely on net private flows. For low income countries, however, net official flows have remained positive but the dominance of official over private flows into this group of countries that was prevalent up to 2002 has not been ob-served recently.
Strong equity performance until the 2008 crisis is likely to explain a great part of the increase in the value of private resource flows as suggested by the underlying drivers of this surge. From 2003-2005, the main driver was foreign direct investment, explaining 56% of the total change, followed by portfolio investment, which tripled from 2003-2005, accounting for 25% of the total change.
In the next section we will take a more micro view to describe this rela-tively new phenomenon of increasing private flows from and to a subset of countries in the developing world.
TabLE 5: NET CapITaL FLOwS by INCOME GROup, 1997-2009 (IN uS$ bILLIONS)
1997 1999 2001 2003 2005 2007 2009
High Income
-2.5 86.9 218.7 469.5 332.5 966.0 n/a
Uppper Middle Income
89.4 46.0 5.2 41.9 104.1 237.1 -18.5
Lower Middle Income
65.6 3.0 65.5 62.6 126.4 264.3 258.1
Low Income
14.8 6.6 5.9 9.3 -13.1 86.3 122.5
Source: International Financial Statistics
16 The New GeoGraphy of CapiTal flows
Source: IMF wEO database
FIGuRE 4/ Capital Inflow Changes to Middle Income Countries, 1980-2009 (in constant 2000 uSd billion)
2000
1500
1000
500
0
-500
-1000
1980
1982
1984
1986
1988
1990
1992
1994
1996
1998
2000
2002
2004
2006
2008
2009
Direct investment in reporting economyPortfolio investment, liabilitiesOther investment, liabilities
Source: IMF wEO database
FIGuRE 5/ Capital Outflow Changes from Middle Income Countries, 1980-2009 (in constant 2000 uSd billion)
9008007006005004003002001000-100-200
1980
1982
1984
1986
1988
1990
1992
1994
1996
1998
2000
2002
2004
2006
2008
2009Direct investment abroadPortfolio investment, assetsOther investment, assets
17FOREIGN dIRECT INVESTMENT aNd MERGERS aNd aCquISITIONS: ThE EMERGENCE OF ThE SOuTh/ SIEMS ISSuE REpORT
FOREIGN dIRECT INVESTMENT
aNd MERGERS aNd aCquISITIONS:
ThE EMERGENCE OF ThE SOuTh
3
18 The New GeoGraphy of CapiTal flows
The data on capital flows presented in the previous two sections describe a changing world economic dynamic where a new pattern of cross-border fi-nancial and trade flows is emerging. In this section we want to describe the new wave of FDI from and to developing economies that has occurred in the last decade. While it is not clear whether this new wave is going to last, the emergence of these flows and their implications for growth and employment creation are already bringing new challenges to the formulation of national economic policies. Sauvant (2007), for instance, warns about the increased tendency towards FDI protectionism that is accompanying the growth of FDI.
Overall, financial and trade flows suggest that the southern economies (i.e., middle and low income economies)3 are, as a group, becoming increas-ingly more prominent in the geographic distribution of global flows both as a source and as a destination. In particular, the South has become increasingly more important as a source of FDI flows in recent years and even more after the recent financial crisis. Indeed, negligible or small until the mid-1980s, FDI outflows from the South are estimated to have totalled over USD 174 billion in 2006, corresponding to some 14.3% of the world total. Such trends are not restricted to FDI flows, Çiğdem and Kose (2007), for instance, highlight the increasing importance of the South, and the Emerging South4 in particular, in total world trade: from 1985 to 2005 the share of total world trade flows to the Emerging South jump from 14% to 25%.
The rapid growth of investments outside their borders by emerging com-panies through mergers and acquisitions (M&A) has been a large contributor to the surge in outward FDI flows from the South. Using the available value data on M&A we estimate, for instance, that those M&A flows falling under the definition of FDI accounted for at least half of the increase in FDI outflows from the South in the period between 2005 and 2009. This recent trend in cross-border M&A activity deserves particular attention and is the focus of this section where we map the evolution of recent cross-border M&A activity by origin and destination.
Because of data limitations, few recent studies have attempted to map M&A activity. Sauvant’s (2005) study on outward FDI from Brazil, Russia, India and China includes an analysis of M&A activity in those countries. Mork, Yeung, and Zhao (2007) include a study of the size, target, locations, and the most important players of outward FDI in China. UNCTAD’s 2007
3/ South and North are determined according to a country’s income group. Upper middle, lower middle, and low income groups are defined as south. North is the high income group. Classification of countries by income level follows the World Bank’s Global Development Finance 2006, Statistical Appendix, Table A.30.
4/ According to Çiğdem and Kose (2007) the Emerging South corresponds to roughly “those included in the MSCI Emerging Markets Index. The main differences are that we drop the transition economies because of limited data availability and add Hong Kong SAR, Singapore and Venezuela”
19FOREIGN dIRECT INVESTMENT aNd MERGERS aNd aCquISITIONS: ThE EMERGENCE OF ThE SOuTh/ SIEMS ISSuE REpORT
World Investment Report (WIR) includes the latest and most comprehensive study on cross-border M&A activity and draws on M&A data from Thomson Financial database. While this database is one of the most comprehensive da-tabases on M&A activity, there are potentially significant data problems due to the large proportion of M&A deals for which the database does not report a deal value. For instance, in the 3-year period between 2007 and 2009, almost 25,000 cross-border M&A deals were reported, but deal values are given for less than half of them. According to Thomson One, it cannot be assumed that the deals for which no value is reported are either small in size or a similar share of the total value of deals in each year of the study period.
This means that conclusions about M&A flows based on an analysis of re-ported values of deals must be taken with scepticism. Such analyses understate the total value of M&A activity, depending on the value of the very significant number of deals for which value information is missing. Problems with the data on values of deals therefore cast doubt on statements about both magni-tudes and trends in the value of global M&A activity. Prominent reports such as UNCTAD’s 2007 WIR ignore this issue and offer more definitive sounding conclusions than is warranted on the basis of this dataset.
While options to circumvent this problem are limited, in this section of the paper, beyond treating conclusions based on deal value data with the ap-propriate caution, we centre our analysis on the evolution of the number of the deals rather than their value as in Marone (2007). While, working with the same database, we cannot discount the possibility that the reporting of the number of deals may also be unreliable. This, however, at least gets around the more serious problems in the deal value data.
As we will show below, our results corroborate some of the trends ob-served in general FDI data while allowing for more specific conclusions about the matrix of source and destination that cannot be drawn from the more ag-gregated general FDI data. The M&A data suggest that the South is indeed emerging as a destination and also as a source of M&A flows. Among the new emergent M&A participants in the South, the BRICs and Malaysia stand out, driving large part of the shift of M&A activity toward the South.
The eMerGeNCe of The souTh iN Global
M&a Cross-border aCTiviTy
In order to map sources and destinations of cross-border M&A deals, like the UNCTAD’s WIR, we define the source country to be that of the acquirer’s
20 The New GeoGraphy of CapiTal flows
ultimate parent company to avoid problems5 such as of “round-tripping.” Many purchases from high income countries are undertaken through a firm’s local or regional subsidiaries, potentially inflating the apparent flows from the South. For instance, Marone (2007) shows that if we include cases where the acquirer is in the South, but the ultimate parent of the acquirer is in the North, the total value of South cross-border purchases would go up by approximately 33% in the 3-year period starting in 2004. We also exclude from the analysis observations for which the country of the parent company is unknown or a supranational entity.
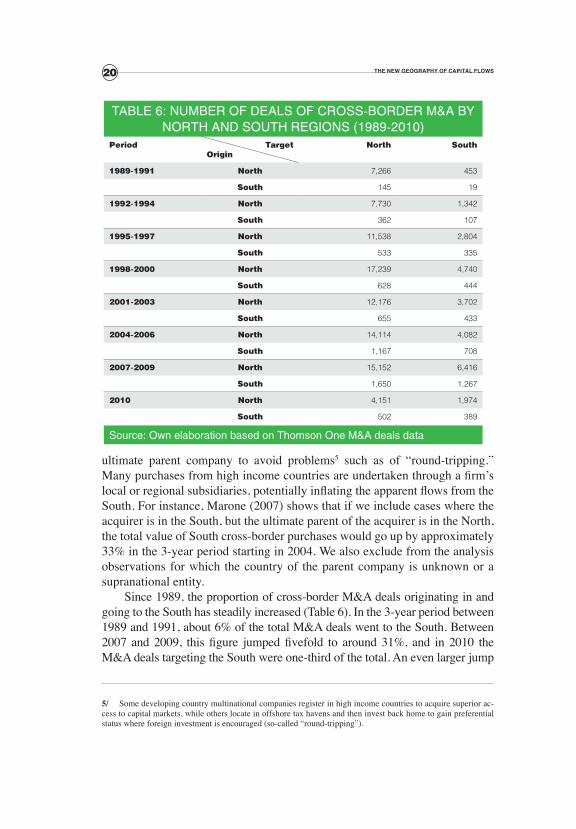
Since 1989, the proportion of cross-border M&A deals originating in and going to the South has steadily increased (Table 6). In the 3-year period between 1989 and 1991, about 6% of the total M&A deals went to the South. Between 2007 and 2009, this figure jumped fivefold to around 31%, and in 2010 the M&A deals targeting the South were one-third of the total. An even larger jump
5/ Some developing country multinational companies register in high income countries to acquire superior ac-cess to capital markets, while others locate in offshore tax havens and then invest back home to gain preferential status where foreign investment is encouraged (so-called “round-tripping”).
TabLE 6: NuMbER OF dEaLS OF CROSS-bORdER M&a by NORTh aNd SOuTh REGIONS (1989-2010)
period targetorigin
North South
1989-1991 North 7,266 453
South 145 19
1992-1994 North 7,730 1,342
South 362 107
1995-1997 North 11,538 2,804
South 533 335
1998-2000 North 17,239 4,740
South 628 444
2001-2003 North 12,176 3,702
South 655 433
2004-2006 North 14,114 4,082
South 1,167 708
2007-2009 North 15,152 6,416
South 1,650 1,267
2010 North 4,151 1,974
South 502 389
Source: Own elaboration based on Thomson One M&a deals data
21FOREIGN dIRECT INVESTMENT aNd MERGERS aNd aCquISITIONS: ThE EMERGENCE OF ThE SOuTh/ SIEMS ISSuE REpORT
100 %
90
80
70
60
50
100 %
90
80
70
60
50
1989
-199
1
1992
-199
4
1995
-199
7
1998
-200
0
2001
-200
3
2004
-200
6
2007
-200
9
2010
Source: Own elaboration based on Thomson One M&a deals data
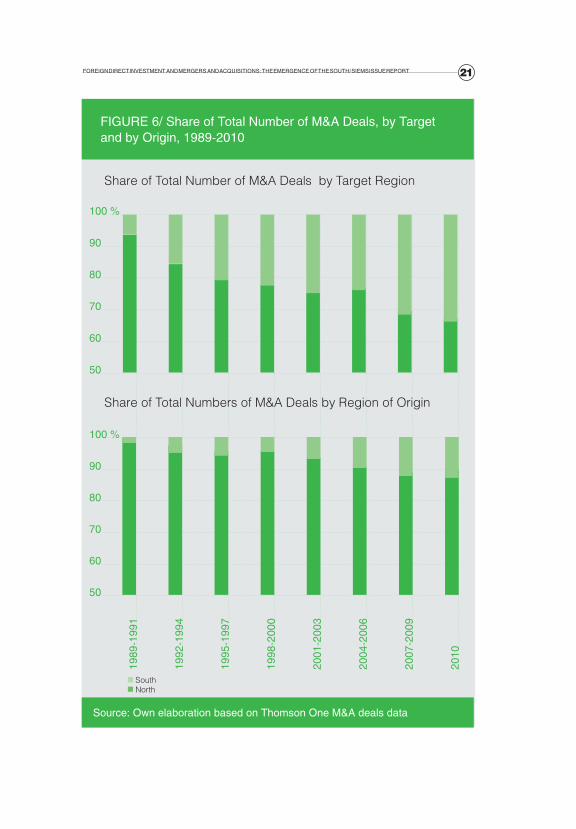
FIGuRE 6/ Share of Total Number of M&a deals, by Target and by Origin, 1989-2010
SouthNorth
Share of Total Number of M&A Deals by Target Region
Share of Total Numbers of M&A Deals by Region of Origin
22 The New GeoGraphy of CapiTal flows
100 %
90
80
70
60
50
100 %
90
80
70
60
50
1989
-199
1
1992
-199
4
1995
-199
7
1998
-200
0
2001
-200
3
2004
-200
6
2007
-200
9
2010
Source: Own elaboration based on Thomson One M&a deals data
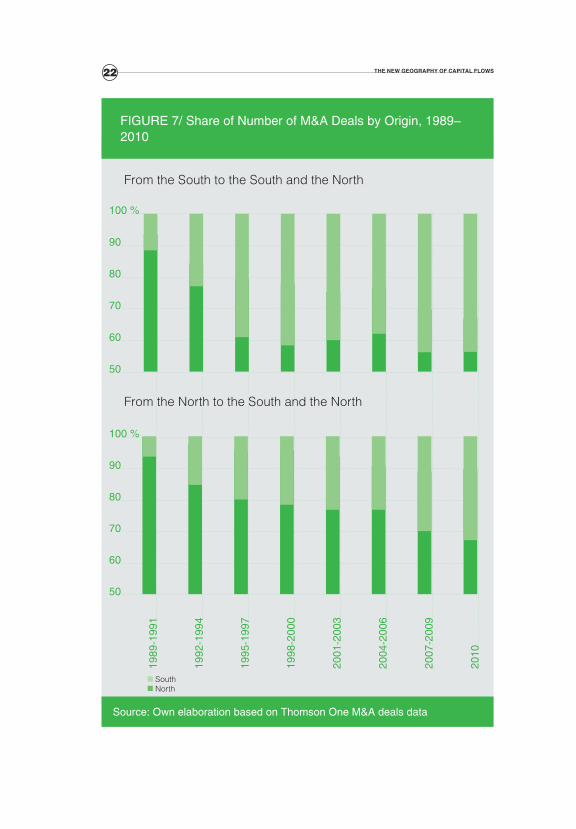
FIGuRE 7/ Share of Number of M&a deals by Origin, 1989–2010
SouthNorth
From the South to the South and the North
From the North to the South and the North
23FOREIGN dIRECT INVESTMENT aNd MERGERS aNd aCquISITIONS: ThE EMERGENCE OF ThE SOuTh/ SIEMS ISSuE REpORT
was observed for the deals originating in the South: almost 12% of the total deals were originated in the South in the period of 2007-2009 against 2% in the period between 1989 and 1991 (Figure 6). Moreover, South-South relationships are increasing, as suggested by the progressively larger share of southern cross-border investment directed to other southern countries: 43.4% in 2007-2009 versus 11.6% in 1989-1991; in contrast to the decline in the share of southern cross-border investment directed to northern economies (Figure 7).
In 2010, the number of deals originating in the South totalled 891, amount-ing to 12.7% of the total M&A activity in that year. Moreover, more than 43% of these deals stayed within the southern region showing a larger integration among developing economies.
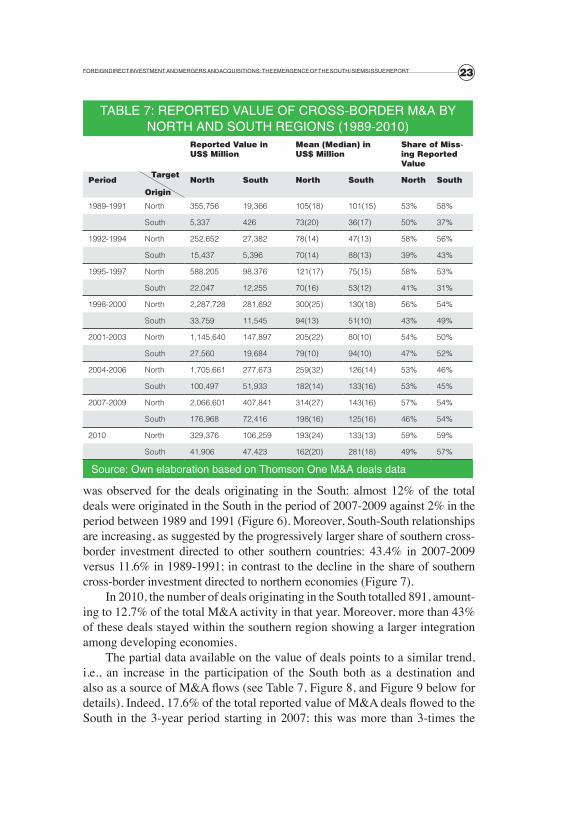
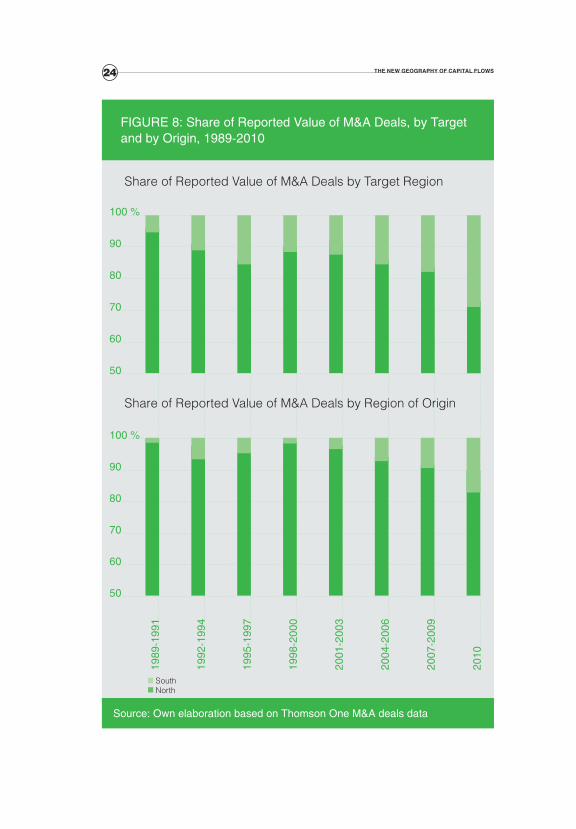
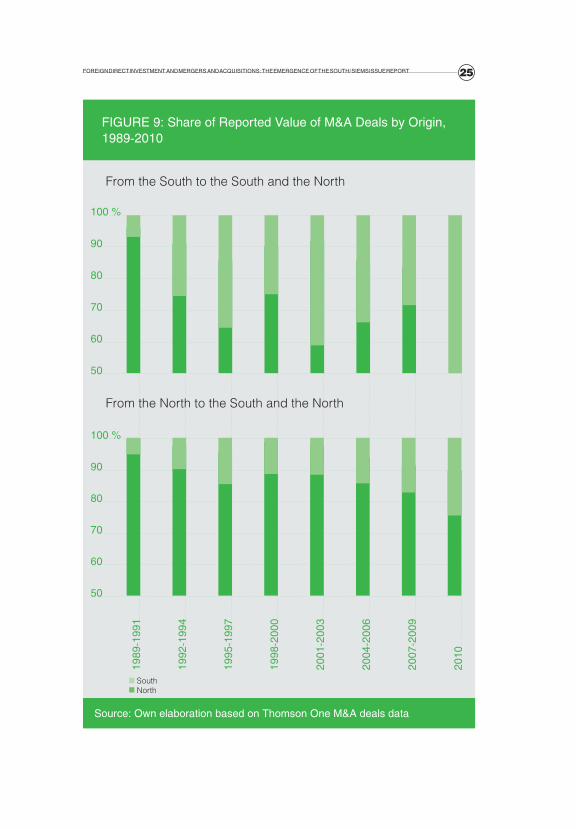
The partial data available on the value of deals points to a similar trend, i.e., an increase in the participation of the South both as a destination and also as a source of M&A flows (see Table 7, Figure 8, and Figure 9 below for details). Indeed, 17.6% of the total reported value of M&A deals flowed to the South in the 3-year period starting in 2007; this was more than 3-times the
TabLE 7: REpORTEd VaLuE OF CROSS-bORdER M&a by NORTh aNd SOuTh REGIONS (1989-2010)
Reported Value in uS$ Million
Mean (Median) in uS$ Million
Share of Miss-ing Reported Value
periodtarget
originNorth South North South North South
1989-1991 North 355,756 19,366 105(18) 101(15) 53% 58%
South 5,337 426 73(20) 36(17) 50% 37%
1992-1994 North 252,652 27,382 78(14) 47(13) 58% 56%
South 15,437 5,396 70(14) 88(13) 39% 43%
1995-1997 North 588,205 98,376 121(17) 75(15) 58% 53%
South 22,047 12,255 70(16) 53(12) 41% 31%
1998-2000 North 2,287,728 281,692 300(25) 130(18) 56% 54%
South 33,759 11,545 94(13) 51(10) 43% 49%
2001-2003 North 1,145,640 147,897 205(22) 80(10) 54% 50%
South 27,560 19,684 79(10) 94(10) 47% 52%
2004-2006 North 1,705,661 277,673 259(32) 126(14) 53% 46%
South 100,497 51,933 182(14) 133(16) 53% 45%
2007-2009 North 2,066,601 407,841 314(27) 143(16) 57% 54%
South 176,968 72,416 198(16) 125(16) 46% 54%
2010 North 329,376 106,259 193(24) 133(13) 59% 59%
South 41,906 47,423 162(20) 281(18) 49% 57%
Source: Own elaboration based on Thomson One M&a deals data
24 The New GeoGraphy of CapiTal flows
100 %
90
80
70
60
50
100 %
90
80
70
60
50
1989
-199
1
1992
-199
4
1995
-199
7
1998
-200
0
2001
-200
3
2004
-200
6
2007
-200
9
2010
Source: Own elaboration based on Thomson One M&a deals data
FIGuRE 8: Share of Reported Value of M&a deals, by Target and by Origin, 1989-2010
SouthNorth
Share of Reported Value of M&A Deals by Target Region
Share of Reported Value of M&A Deals by Region of Origin
25FOREIGN dIRECT INVESTMENT aNd MERGERS aNd aCquISITIONS: ThE EMERGENCE OF ThE SOuTh/ SIEMS ISSuE REpORT
100 %
90
80
70
60
50
100 %
90
80
70
60
50
1989
-199
1
1992
-199
4
1995
-199
7
1998
-200
0
2001
-200
3
2004
-200
6
2007
-200
9
2010
Source: Own elaboration based on Thomson One M&a deals data
FIGuRE 9: Share of Reported Value of M&a deals by Origin, 1989-2010
SouthNorth
From the South to the South and the North
From the North to the South and the North
26 The New GeoGraphy of CapiTal flows
share value of the deals flowing to the South over 1989-1991. Moreover, for year 2010, 29.3% of the reported value of the M&A deals targeted economies in the South region. The proportion of M&A deals by reported value leaving the South over 2007-2009 amounted to 9.2% of the total reported value, more than six times larger than in the 1989-1991 period. That proportion increased to 17% in 2010, though this is certainly a consequence of the financial crisis that has affected the mature economies more than the emerging south.
has The reCeNT fiNaNCial Crisis Modified
The TreNd iN M&a?
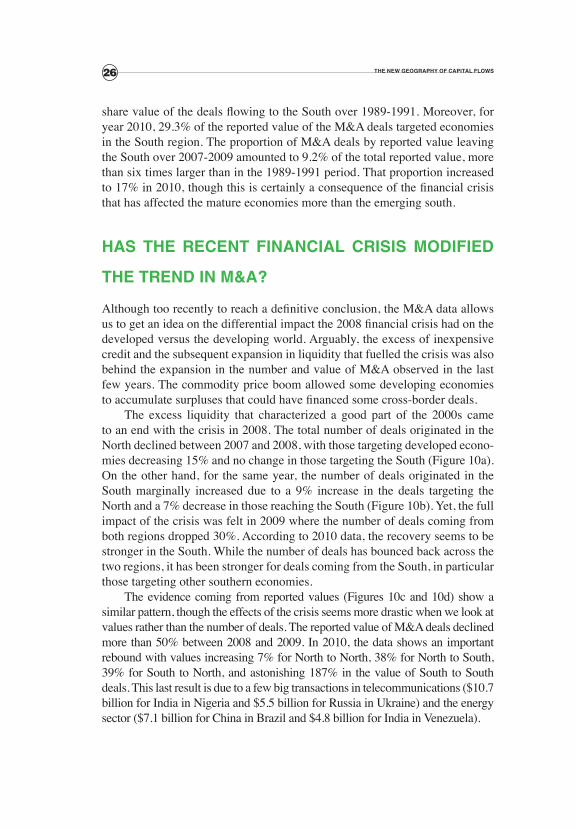
Although too recently to reach a definitive conclusion, the M&A data allows us to get an idea on the differential impact the 2008 financial crisis had on the developed versus the developing world. Arguably, the excess of inexpensive credit and the subsequent expansion in liquidity that fuelled the crisis was also behind the expansion in the number and value of M&A observed in the last few years. The commodity price boom allowed some developing economies to accumulate surpluses that could have financed some cross-border deals.
The excess liquidity that characterized a good part of the 2000s came to an end with the crisis in 2008. The total number of deals originated in the North declined between 2007 and 2008, with those targeting developed econo-mies decreasing 15% and no change in those targeting the South (Figure 10a). On the other hand, for the same year, the number of deals originated in the South marginally increased due to a 9% increase in the deals targeting the North and a 7% decrease in those reaching the South (Figure 10b). Yet, the full impact of the crisis was felt in 2009 where the number of deals coming from both regions dropped 30%. According to 2010 data, the recovery seems to be stronger in the South. While the number of deals has bounced back across the two regions, it has been stronger for deals coming from the South, in particular those targeting other southern economies.
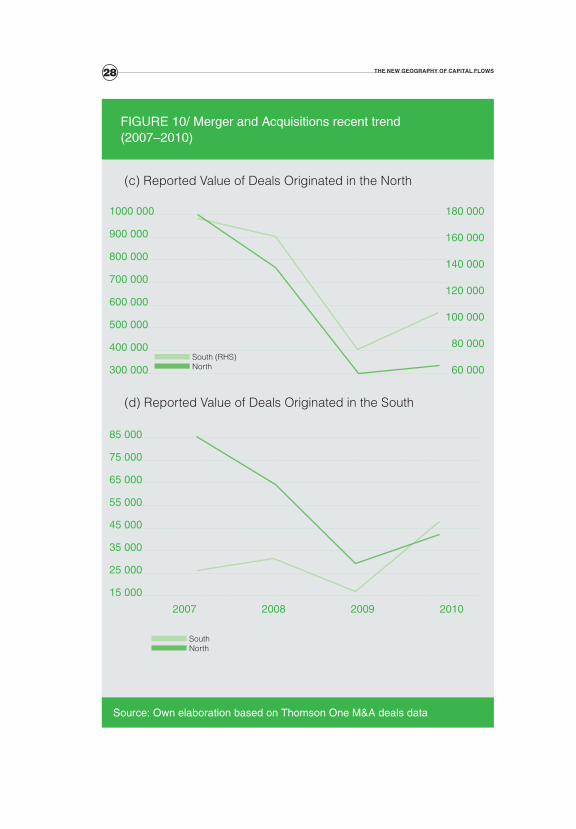
The evidence coming from reported values (Figures 10c and 10d) show a similar pattern, though the effects of the crisis seems more drastic when we look at values rather than the number of deals. The reported value of M&A deals declined more than 50% between 2008 and 2009. In 2010, the data shows an important rebound with values increasing 7% for North to North, 38% for North to South, 39% for South to North, and astonishing 187% in the value of South to South deals. This last result is due to a few big transactions in telecommunications ($10.7 billion for India in Nigeria and $5.5 billion for Russia in Ukraine) and the energy sector ($7.1 billion for China in Brazil and $4.8 billion for India in Venezuela).
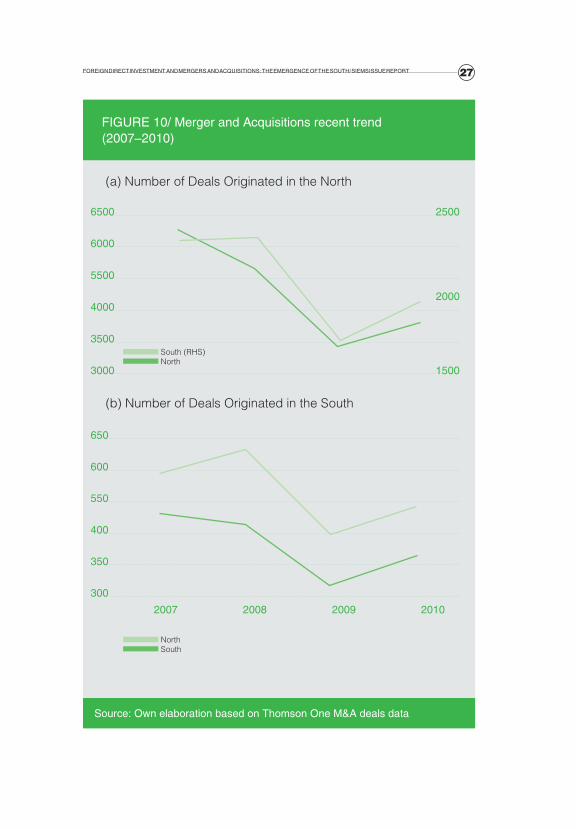
27FOREIGN dIRECT INVESTMENT aNd MERGERS aNd aCquISITIONS: ThE EMERGENCE OF ThE SOuTh/ SIEMS ISSuE REpORT
6500 2500
6000
5500
4000
3500
3000 1500
650
600
550
400
350
300
Source: Own elaboration based on Thomson One M&a deals data
FIGuRE 10/ Merger and acquisitions recent trend (2007–2010)
NorthSouth
(a) Number of Deals Originated in the North
(b) Number of Deals Originated in the South
2007 2008 2009 2010
2000
South (RHS)North
28 The New GeoGraphy of CapiTal flows
1000 000
900 000
800 000
700 000
600 000
500 000
400 000
300 000
85 000
75 000
65 000
55 000
45 000
35 000
25 000
15 000
Source: Own elaboration based on Thomson One M&a deals data
FIGuRE 10/ Merger and acquisitions recent trend (2007–2010)
SouthNorth
(c) Reported Value of Deals Originated in the North
(d) Reported Value of Deals Originated in the South
2007 2008 2009 2010
180 000
160 000
140 000
120 000
100 000
80 000
60 000 South (RHS)North
29FOREIGN dIRECT INVESTMENT aNd MERGERS aNd aCquISITIONS: ThE EMERGENCE OF ThE SOuTh/ SIEMS ISSuE REpORT
Overall the evidence suggests that the crisis not only has not reversed the trend of increasing the South’s participation in cross-border M&A deals but further accentuated it due to the relative better economic performance of the emerging economies during this period.
how far souTh?
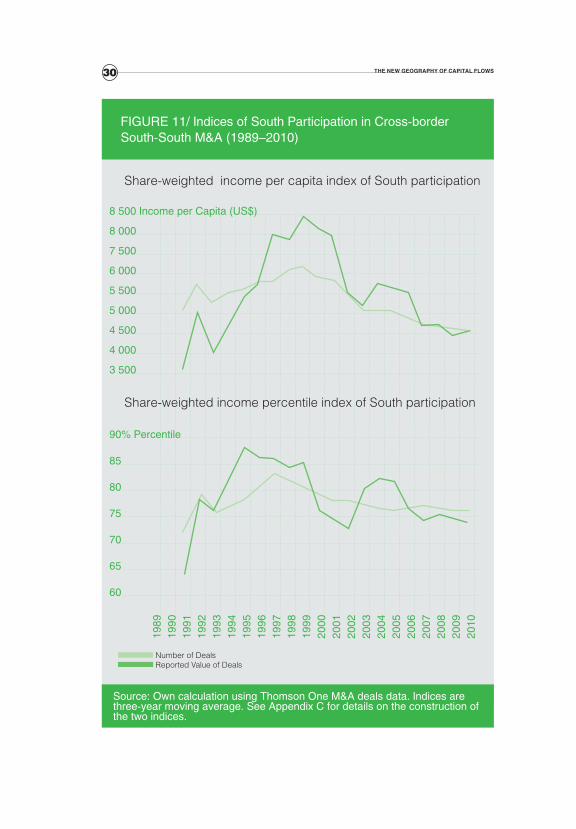
The participation of the South in global M&A activity is of particular interest for the future configuration of the global economy as southern enterprises are crossing borders and seeking new markets, new technologies, new consumers, and spreading their risks. But is this a general trend among southern econo-mies? Who in the South is leading this trend? In order to answer some of these questions we construct indices to track southern participation in M&A activity. The details of the construction of the indices are shown in Appendix C and are based on Marone (2007). A reduction in the value of the index reflects a rela-tive increase in the importance of lower income economies in M&A activities.
In order to study the participation of lower income economies in southern M&A activity, we divide the sample into two groups: South-South deals and the South-North deals. The first group consists of deals where the acquirer’s ultimate parent is in the South and the target is also in the South. The latter group consists of deals with a Southern acquirer and a Northern target. This distinction will later help us identify whether there are similarities and dispari-ties between the southern economies reaching north and those reaching south for investment through M&A activity.
The first finding is that South-South deals are coming from further south. Since the late 1990s, there has been an increase in the participation of lower income economies in the M&A activity between southern economies. We es-timate that the increase in the participation of lower income countries in the number of South-South deals is equivalent to a drop of 12 percentage points in the average weighted income percentile ranking of southern participants between the peak in the three-year period ending in 1997 and the three-year period ending in 2010. In absolute levels, this would be equivalent to a decline in the weighted income per capita of acquirers of about 29%, from the average of $6,450 in the three-year ending in 1997 to an estimated $4,820 level in the three-year period ending in 2010 (Figure 11).
In terms of the value of M&A deals, the participation of lower income economies follows a similar but stronger trend. Available data suggests that the increase in the participation of lower income countries in the value of South-South deals would be equivalent to a drop of more than 14 percentage points in the average weighted income percentile ranking of southern participants
30 The New GeoGraphy of CapiTal flows
8 500 Income per Capita (uS$)
8 000
7 500
6 000
5 500
5 000
4 500
4 000
3 500
90% percentile
85
80
75
70
65
60
Source: Own calculation using Thomson One M&a deals data. Indices are three-year moving average. See appendix C for details on the construction of the two indices.
FIGuRE 11/ Indices of South participation in Cross-border South-South M&a (1989–2010)
Number of Deals Reported Value of Deals
Share-weighted income per capita index of South participation
Share-weighted income percentile index of South participation
1989
1990
1991
1992
1993
1994
1995
1996
1997
1998
1999
2000
2001
2002
2003
2004
2005
2006
2007
2008
2009
2010
31FOREIGN dIRECT INVESTMENT aNd MERGERS aNd aCquISITIONS: ThE EMERGENCE OF ThE SOuTh/ SIEMS ISSuE REpORT
between the peak in three-year period ending in 1998 and the three-year period ending in 2010, the equivalent of a 37% drop in the average income per capita (Figure 11).
Note that the indices constructed based on shares in deal values, how-ever, exhibit higher volatility. This may reflect exchange rate variations and/or the potential existence of concentrated high value deals in combination with small samples. This is particular true in the late 1980s and early 1990s when samples were relatively smaller. Between 1989 and 1991, for instance, a total of 164 deals were reported originating in 25 countries in the South, an aver-age of about 6.6 deals per participating country. In contrast, in the 3- year period starting in 2004, a total of 1,875 deals were reported originating in 64 countries in the South, an average of about 29.3 deals per country. Higher volatility in the indices using value could also be exacerbated by the fact that, on average, half of the sample is missing information on values: the smaller the sample, the larger would be the effect of missing information. This again underlines the missing value data problem discussed earlier.
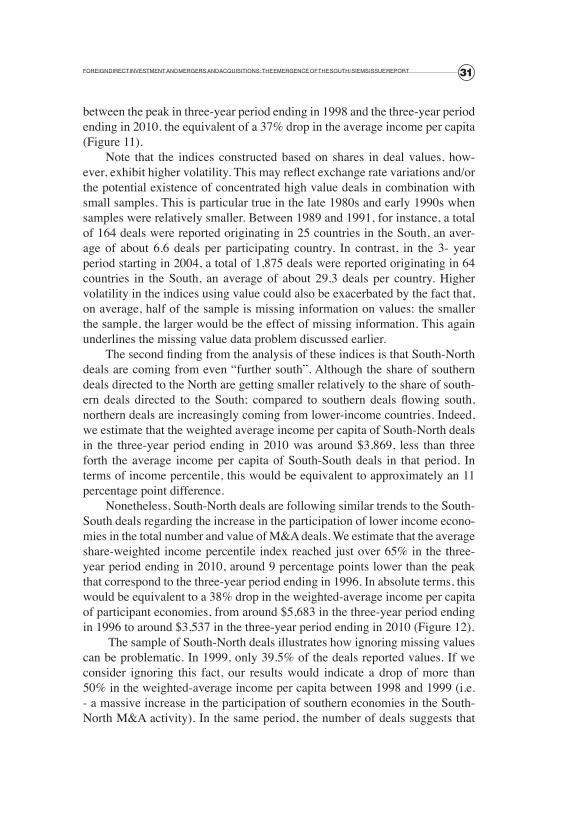
The second finding from the analysis of these indices is that South-North deals are coming from even “further south”. Although the share of southern deals directed to the North are getting smaller relatively to the share of south-ern deals directed to the South; compared to southern deals flowing south, northern deals are increasingly coming from lower-income countries. Indeed, we estimate that the weighted average income per capita of South-North deals in the three-year period ending in 2010 was around $3,869, less than three forth the average income per capita of South-South deals in that period. In terms of income percentile, this would be equivalent to approximately an 11 percentage point difference.
Nonetheless, South-North deals are following similar trends to the South-South deals regarding the increase in the participation of lower income econo-mies in the total number and value of M&A deals. We estimate that the average share-weighted income percentile index reached just over 65% in the three-year period ending in 2010, around 9 percentage points lower than the peak that correspond to the three-year period ending in 1996. In absolute terms, this would be equivalent to a 38% drop in the weighted-average income per capita of participant economies, from around $5,683 in the three-year period ending in 1996 to around $3,537 in the three-year period ending in 2010 (Figure 12).
The sample of South-North deals illustrates how ignoring missing values can be problematic. In 1999, only 39.5% of the deals reported values. If we consider ignoring this fact, our results would indicate a drop of more than 50% in the weighted-average income per capita between 1998 and 1999 (i.e. - a massive increase in the participation of southern economies in the South-North M&A activity). In the same period, the number of deals suggests that
32 The New GeoGraphy of CapiTal flows
7 000 Income per Capita (uS$)
6 500
6 000
5 500
5 000
4 500
4 000
3 500
3 000
80% percentile
77,5
75
72,5
70
67,5
65
62,5
60
Source: Own calculation using Thomson One M&a deals data. Indices are three-year moving average. See appendix C for details on the construction of the two indices.
FIGuRE 12/ Indices of South participation in Cross-border South-North M&a (1989-2010)
Reported Value of DealsNumber of Deals
Share-weighted income per capita index of South participation
Share-weighted income percentile index of South participation
1989
1990
1991
1992
1993
1994
1995
1996
1997
1998
1999
2000
2001
2002
2003
2004
2005
2006
2007
2008
2009
2010
33FOREIGN dIRECT INVESTMENT aNd MERGERS aNd aCquISITIONS: ThE EMERGENCE OF ThE SOuTh/ SIEMS ISSuE REpORT
actually the opposite might have occurred. Indeed, the weighted- average in-come per capita based on number of deals went up by about 1.1% in that same period. We choose therefore to scale the results obtained in the analysis based on M&A value using the share of missing reported values. While we believe that this does not solve the problem, it smooths the large swing in the data that would be otherwise observed in 1999.
Driving this trend towards the South, Russia, China and especially India show up as new top southern investors both among deals targeting the North as well those targeting the South. While there are other southern countries also joining this new trend, only a few countries account for the largest share of M&A deals, which is discussed in more detail in the next section.
whaT CouNTries are driviNG The TreNd?
The number of southern acquirers soared in both South-South as well South-North M&A deals. In the period between 2007 and 2009, 59 southern countries invested in the South and 65 southern countries invested in the North through cross-border M&A deals. This is in contrast to 30 southern countries invest-ing in the South and 25 investing in the North in the period between 1989 and 1991. The number of deals also soared, especially for South-South deals, which jumped more than 66 fold from the 1989-1991 to the 2007-2009 period. The year of 2007 brought a new historical record in terms of the number of South-South deals with 491 transactions. Those numbers later declined with the crisis to 320 in 2009 but quickly recovered reaching 389 deals in 2010.
While new participants continue to expand the pool of southern investors, only a few countries are responsible for a large share of M&A activity origi-nated in the South. In fact, the top four countries accounted for 30% to 50% of the total number of South- South M&A deals during each of the eight 3-year periods between 1989 and 2010. This number is even higher for South-North deals: the top four countries accounted for 49% to 75% of the total deals in each period until 2010.
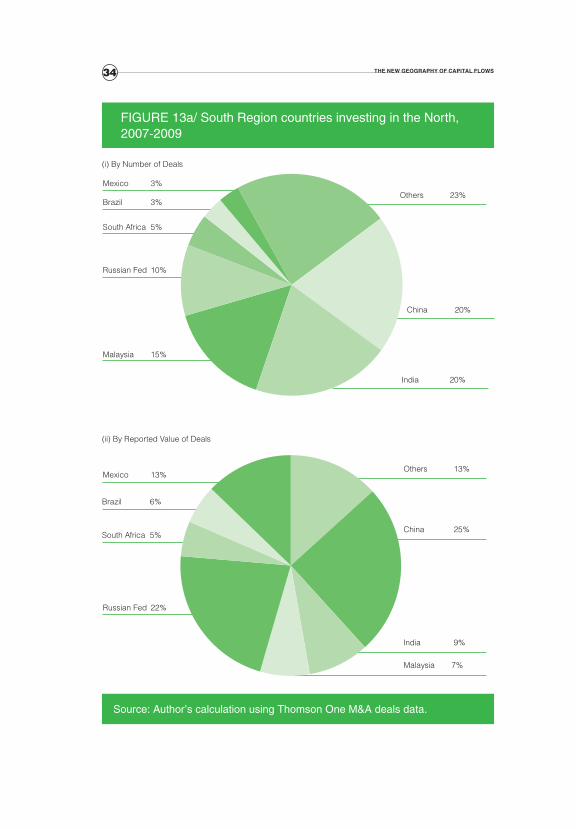
Among South-North deals, South Africa, Malaysia, and China were among the top three investors until the 2004-2006 period, when India took over South Africa’s place. During 2007-2009, India became with China the top investors with 20.2% each of all South-North M&A deals, followed by Malaysia and Russia (Figure 13a-i). This massive increase in India’s partici-pation in South-North M&A deals explains a great part of the decrease in the weighted average income per capita of South-North M&A activity discussed in the previous section. As an illustration, in the period from 2004 and 2006, 21.8% of all South-North deals came from low income countries; more than
34 The New GeoGraphy of CapiTal flows
Source: author’s calculation using Thomson One M&a deals data.
FIGuRE 13a/ South Region countries investing in the North, 2007-2009
Others 13%
China 25%
India 9%
Malaysia 7%
Mexico 3%
South Africa 5%
Russian Fed 10%
Malaysia 15%
Mexico 13%
Brazil 6%
South Africa 5%
Russian Fed 22%
Others 23%
(i) By Number of Deals
(ii) By Reported Value of Deals
China 20%
India 20%
Brazil 3%
35FOREIGN dIRECT INVESTMENT aNd MERGERS aNd aCquISITIONS: ThE EMERGENCE OF ThE SOuTh/ SIEMS ISSuE REpORT
Source: author’s calculation using Thomson One M&a deals data.
FIGuRE 13b/ South Region countries investing in the South, 2007-2009
Russian Fed 17%
China 14%
Malaysia 11%
India 8%
Others 48%
Poland 5%
Others 33%
Brazil 7%
Czech Republic 6%
Argentina 4%
Russian Fed 12%
(i) By Number of Deals
(ii) By Reported Value of Deals
India 8%
Malaysia 11%
Mauritius 7%
Czech Republic 4%
Brazil 6%
36 The New GeoGraphy of CapiTal flows
19.9 % came from India alone. The other 1.9% originated in Eritrea, Cambo-dia, Kenya, Liberia, Nigeria, Pakistan, Papua New Guinea, Uzbekistan, Viet-nam, Zambia, and Zimbabwe.
When we take into account the reported value of M&A deals the picture is similar but the rankings of the countries change due to a few large energy and telecommunications deals (Figure 13a-ii). For the period 2007-2009, the ranking of South economies investing in the North is led by China with one quarter of the value of South-North deals, followed by Russia (21.9%), Mexi-co (12.8%), and India (9%).
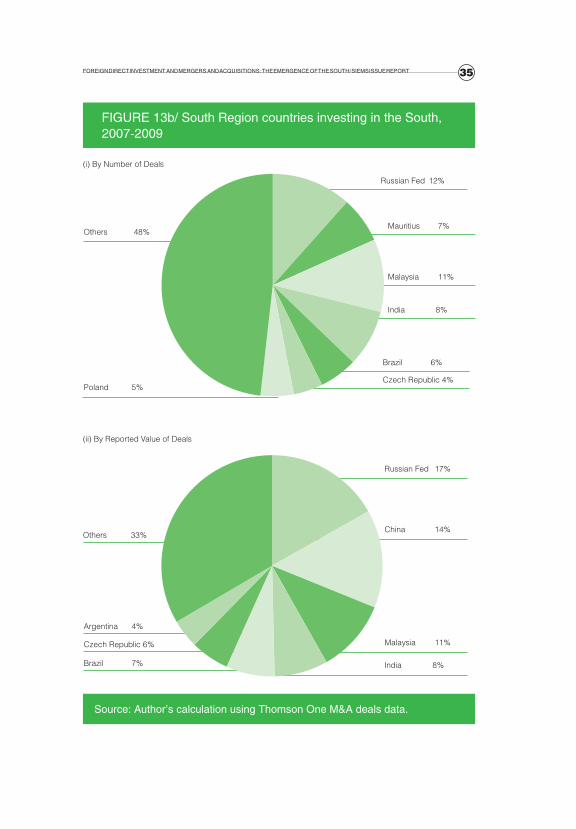
India, next to Russia and Malaysia, was also among the top three South-South investors in the period between 2004 and 2006. And it was again India that was responsible for a great part of the movement of South-South M&A activity further to the South. In the 3-year period starting in 2004, 11.6% of all South-South deals originated in low income countries; 9.6% came from In-dia alone. The remaining 2% were split between Afghanistan, Kenya, Liberia, Malawi, Nigeria, Senegal, Vietnam, Zambia, and Zimbabwe combined. The ranking of countries for the period 2007-2009 is similar with Russia (11.6%), Malaysia (10.6%) and India (8.3%) leading the South countries6 investing in the South (Figure 13b-i). China replaces India in the top three when we take into account the reported value of South-South M&A deals (Figure 13b). Two South-American countries, Brazil (7.1%) and Argentina (4.2%), also appear in the list of top South countries investing in the South, but with a market share that is significantly lower of that of the top three countries.
whaT CouNTries iN The souTh reGioN are
beeN TarGeTed?
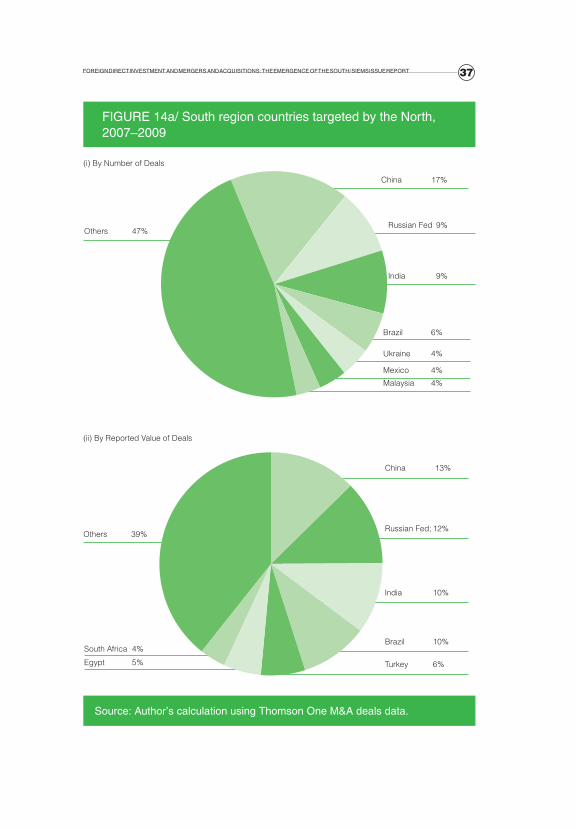
We know that the BRIC and Malaysia have been the main source of M&A tar-geting both the North and the South, but what countries are been targeted in the South? Figure 14a shows the targeted South region countries by North parent companies during the period 2007-2009. Not surprisingly, the BRIC countries are once again the top four countries in term of destination of North-South deals accounting for 41.3% of the number of deals and 43% of the total declared val-ue. China is the main recipient both in terms of number of deals (17.1%) and value (12.6%) followed by Russia (9.3% and 12.6%, respectively).
6/ Mauritius appears in fourth place but its case is similar to the Cayman Islands or the British Virgin Islands as it works as an offshore investment arm for companies operating mainly in India. While we do not have detailed information, it is possible that most of Mauritius M&A deals in India are actually not cross border activities.
37FOREIGN dIRECT INVESTMENT aNd MERGERS aNd aCquISITIONS: ThE EMERGENCE OF ThE SOuTh/ SIEMS ISSuE REpORT
Source: author’s calculation using Thomson One M&a deals data.
FIGuRE 14a/ South region countries targeted by the North, 2007–2009
China 13%
Russian Fed; 12%
India 10%
Brazil 10%
Turkey 6%
Others 47%
Others 39%
Egypt 5%
South Africa 4%
China 17%
(i) By Number of Deals
(ii) By Reported Value of Deals
Brazil 6%
India 9%
Russian Fed 9%
Malaysia 4%
Mexico 4%
Ukraine 4%
38 The New GeoGraphy of CapiTal flows
Source: author’s calculation using Thomson One M&a deals data.
FIGuRE 14b/ South region countries targeted by the South, 2007–2009
Indonesia 5%
India 8%
Brazil 5%
Turkey 10%
South Africa 8%
Kazakhstan 7%
Hungary 5%
Others; 63%
Others 51%
India; 09%
(i) By Number of Deals
(ii) By Reported Value of Deals
Ukraine; 05%
Indonesia; 05%
Brazil; 04%
Russian Fed; 05%
China; 04%
Argentina; 04%
39FOREIGN dIRECT INVESTMENT aNd MERGERS aNd aCquISITIONS: ThE EMERGENCE OF ThE SOuTh/ SIEMS ISSuE REpORT
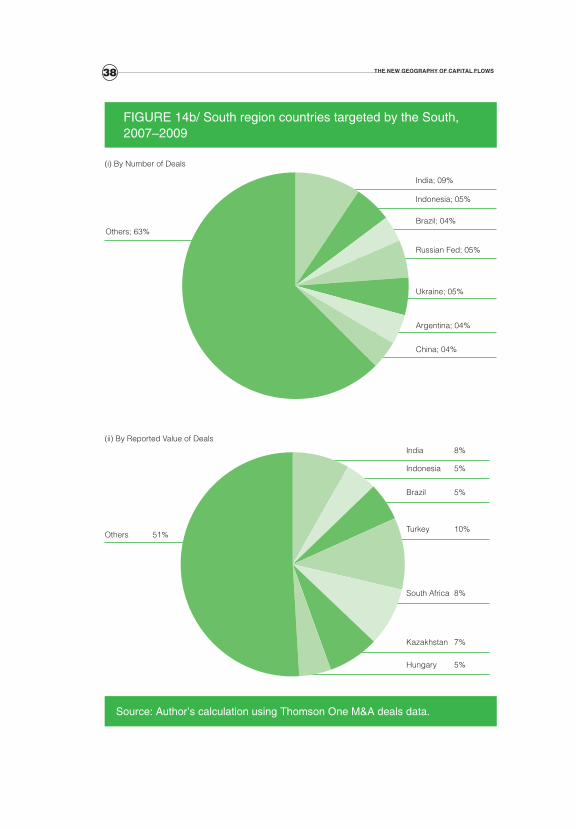
The deals originating in the South that target firms in the South are far less concentrated than those originated in the North. The seven top recipients account for one third of the total number of deals and almost one half of the total reported values (Figure 14b). India is the major recipient of South origi-nated deals with 9.4% of the total number of transactions. It is followed by Indonesia, Russia, and Ukraine, all with a 5.4% share. Surprisingly, China, a favourite destination for deals originated in the North, only receives 4% of the total number of deals originated in the South. In terms of values, the list is led by Turkey (10.4%) followed by South Africa (8.5%), India (8.2%), and Kazakhstan (7.4%).
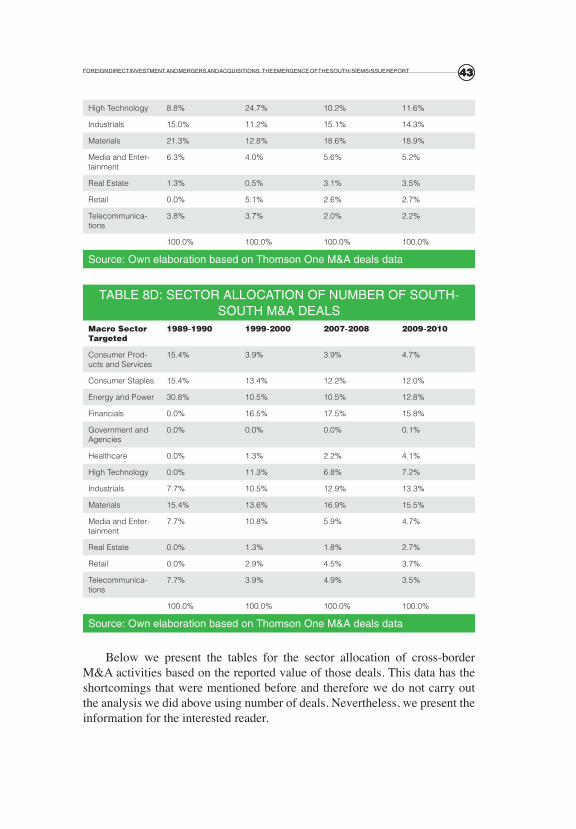
whaT seCTors are beeN TarGeTed?
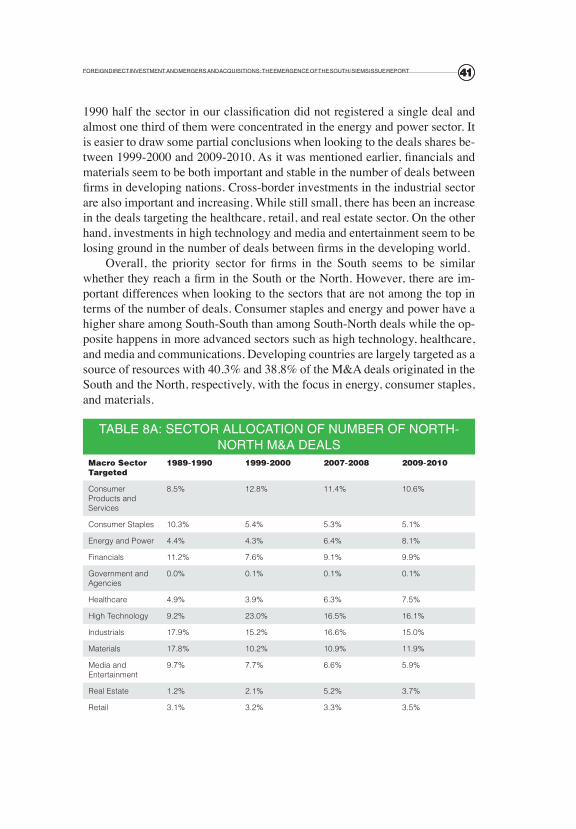
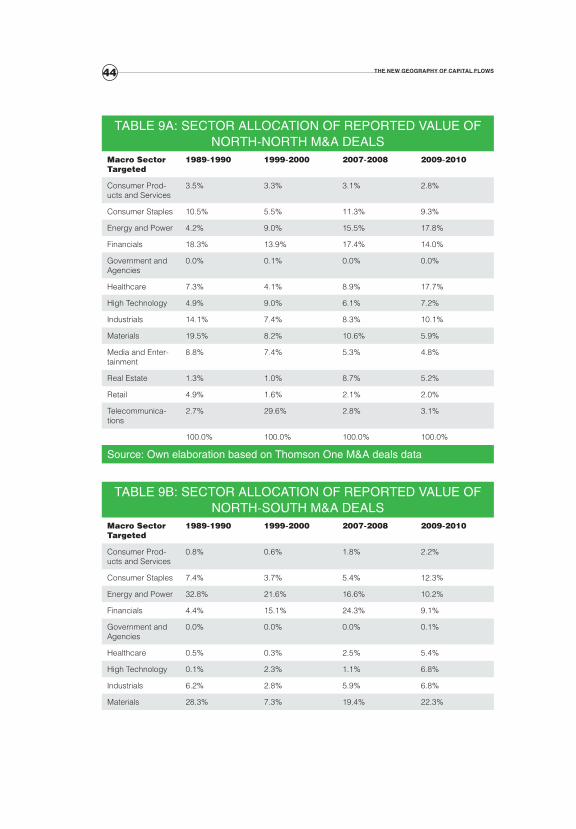
In this last subsection we would like to study what economic sectors are driv-ing the increasing number of cross-border deals. We are also interested in as-sessing if there is any difference depending on the region of the country of origin and destination. This would be important to understand if most of the increase in FDI observed in the last few years is due to a reallocation of activi-ties following a new division of labour among economies. For that reason, we present below Tables 8a-d with information on the distribution of the number of deals across economic sectors for North-North, North-South, South-North, and South-South transactions. Tables 9a-d display the same information but based on the reported value of deals.
The sector allocation of North-North deals is presented in Table 8a for four different periods. Twenty years ago, three sectors dominated the deals among developed nations: industrials (17.9%), materials (17.8%), and finan-cials (11.2%). The same three sectors were also the main target of North-South (15.4%, 20.9%, and 15.8% respectively) and South-North (15%, 21.3%, and 15%, respectively) deals (Tables 8b and 8c). On the other hand, of the three sectors only materials was important in South to South deals with 15.4% of the total number of transactions or half of those of the energy and power sector. In-dustrials deals only accounted for 7.7% of the South-South deals in 1989-1990 and there were no registered transactions involving South companies targeting the financial sector in other developing economies (Table 8d).
The evolution in the number of deals in the three sectors mentioned in the paragraph above illustrates the change in production patterns experienced by the world economy in the last twenty years. The three sectors combined ac-counted for 47% of the North-North deals, 52.2% of North-South deals, and 51.3% of South-North deals in 1989-1990. Those numbers declined to 36.8%, 47%, and 49.8% respectively in 2009-2010. On the other hand, the three sec-
40 The New GeoGraphy of CapiTal flows
tors that combined for only 23.1% of the number of South-South deals back in 1989-1990, twenty years later accounted for 44.6% of the deals. Of the three sectors, materials has been a consistent top sector destination of cross-border deals in the last twenty years for all type of deals except from North countries targeting other North economies. For this last case, foreign direct investment in the industrial sector has been among the top three choices of firms in the developed world investing in similar economies.
In the last twenty years, deals in consumer staples lost half the share in North-North transactions. On the other hand, the share of number of deals in energy and power among developed economies almost double. The health sec-tor also became important with an increase of 50% in the market share for this sector in North-North deals. However, it is the high technology sector that has today the largest market shares of deals between rich countries with 16.1% of the total in 2009-2010. The share of deals in the retail sector has been low and constant while those in the real estate sector rapidly increased until 2007-2008 and later declined as a consequence of the crisis (Table 8a).
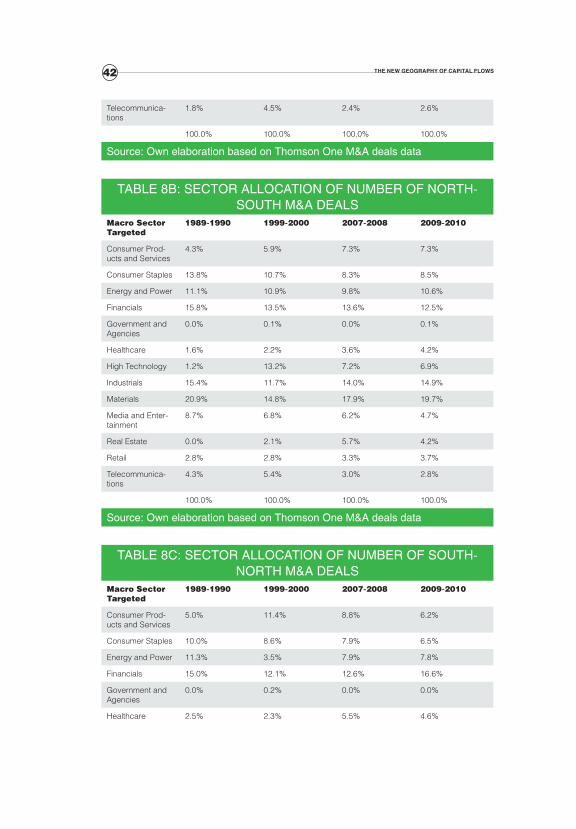
While there are some coincidences, the North firms reaching the South seem to be more consistent over time with respect to the targeted sector (Table 8b). In almost every year, the deals in materials, industrials, and financials seem to be the priority of the firms in developed countries investing in the de-veloping world. The material sector accounted for 19.7% of the deals in 2009-2010, a similar percentage as twenty years ago. The energy and power sector in the South has also been a stable target of the firms in high income countries with 10%-11% of the total deals each year. The share of the number of deals in consumer product and services has increased over time, while it has declined in the last twenty years for consumer staples and media and communication. The evolution in the share of North-South deals in health, retail, real estate, and telecommunication sectors is similar to the one for North-North deals.
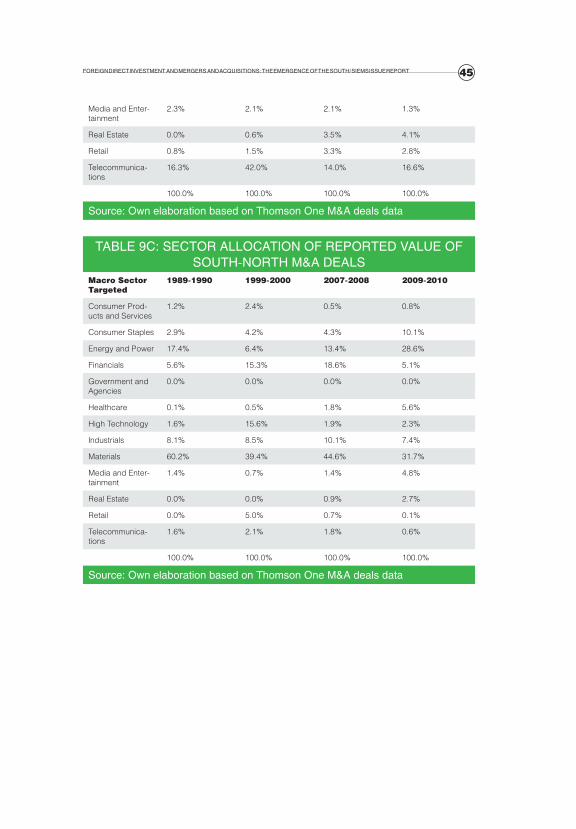
The evolution in the sector allocation of South-North (Table 8c) is sur-prisingly similar to that of North-South deals. The ranking of the top three sectors is similar across time with the high technology sector peaking both ways around year 2000 when one quarter of all M&A South companies’ deals in the North focused in this sector. There are of course differences in the levels with high technology deals more important in the South-North deals than in the North-South deals, and the opposite true for energy and power. Also, it is interesting to note that what seems a direct consequence of the 2008 crisis, the share of financial and real estate North-South investment declined between 2007-2008 and 2009-2010, although it increased in importance for the South-North M&A activities.
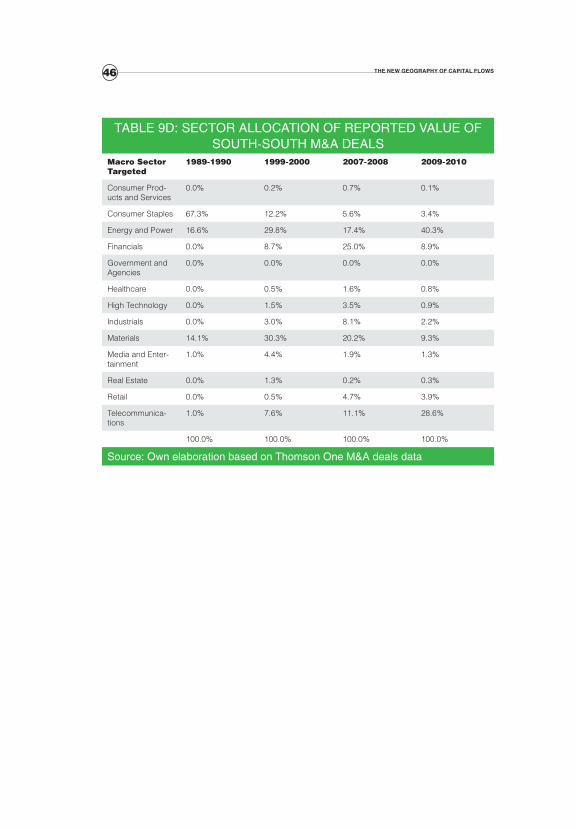
It is hard to draw a precise picture of the evolution of South to South merger and acquisitions deals as this is a relatively new phenomenon. In 1989-
41FOREIGN dIRECT INVESTMENT aNd MERGERS aNd aCquISITIONS: ThE EMERGENCE OF ThE SOuTh/ SIEMS ISSuE REpORT 41
1990 half the sector in our classification did not registered a single deal and almost one third of them were concentrated in the energy and power sector. It is easier to draw some partial conclusions when looking to the deals shares be-tween 1999-2000 and 2009-2010. As it was mentioned earlier, financials and materials seem to be both important and stable in the number of deals between firms in developing nations. Cross-border investments in the industrial sector are also important and increasing. While still small, there has been an increase in the deals targeting the healthcare, retail, and real estate sector. On the other hand, investments in high technology and media and entertainment seem to be losing ground in the number of deals between firms in the developing world.
Overall, the priority sector for firms in the South seems to be similar whether they reach a firm in the South or the North. However, there are im-portant differences when looking to the sectors that are not among the top in terms of the number of deals. Consumer staples and energy and power have a higher share among South-South than among South-North deals while the op-posite happens in more advanced sectors such as high technology, healthcare, and media and communications. Developing countries are largely targeted as a source of resources with 40.3% and 38.8% of the M&A deals originated in the South and the North, respectively, with the focus in energy, consumer staples, and materials.
TabLE 8a: SECTOR aLLOCaTION OF NuMbER OF NORTh-NORTh M&a dEaLS
Macro Sector targeted
1989-1990 1999-2000 2007-2008 2009-2010
Consumer Products and Services
8.5% 12.8% 11.4% 10.6%
Consumer Staples 10.3% 5.4% 5.3% 5.1%
Energy and Power 4.4% 4.3% 6.4% 8.1%
Financials 11.2% 7.6% 9.1% 9.9%
Government and Agencies
0.0% 0.1% 0.1% 0.1%
Healthcare 4.9% 3.9% 6.3% 7.5%
High Technology 9.2% 23.0% 16.5% 16.1%
Industrials 17.9% 15.2% 16.6% 15.0%
Materials 17.8% 10.2% 10.9% 11.9%
Media and Entertainment
9.7% 7.7% 6.6% 5.9%
Real Estate 1.2% 2.1% 5.2% 3.7%
Retail 3.1% 3.2% 3.3% 3.5%
42 The New GeoGraphy of CapiTal flows
Telecommunica-tions
1.8% 4.5% 2.4% 2.6%
100.0% 100.0% 100.0% 100.0%
Source: Own elaboration based on Thomson One M&a deals data
TabLE 8b: SECTOR aLLOCaTION OF NuMbER OF NORTh-SOuTh M&a dEaLS
Macro Sector targeted
1989-1990 1999-2000 2007-2008 2009-2010
Consumer Prod-ucts and Services
4.3% 5.9% 7.3% 7.3%
Consumer Staples 13.8% 10.7% 8.3% 8.5%
Energy and Power 11.1% 10.9% 9.8% 10.6%
Financials 15.8% 13.5% 13.6% 12.5%
Government and Agencies
0.0% 0.1% 0.0% 0.1%
Healthcare 1.6% 2.2% 3.6% 4.2%
High Technology 1.2% 13.2% 7.2% 6.9%
Industrials 15.4% 11.7% 14.0% 14.9%
Materials 20.9% 14.8% 17.9% 19.7%
Media and Enter-tainment
8.7% 6.8% 6.2% 4.7%
Real Estate 0.0% 2.1% 5.7% 4.2%
Retail 2.8% 2.8% 3.3% 3.7%
Telecommunica-tions
4.3% 5.4% 3.0% 2.8%
100.0% 100.0% 100.0% 100.0%
Source: Own elaboration based on Thomson One M&a deals data
TabLE 8C: SECTOR aLLOCaTION OF NuMbER OF SOuTh-NORTh M&a dEaLS
Macro Sector targeted
1989-1990 1999-2000 2007-2008 2009-2010
Consumer Prod-ucts and Services
5.0% 11.4% 8.8% 6.2%
Consumer Staples 10.0% 8.6% 7.9% 6.5%
Energy and Power 11.3% 3.5% 7.9% 7.8%
Financials 15.0% 12.1% 12.6% 16.6%
Government and Agencies
0.0% 0.2% 0.0% 0.0%
Healthcare 2.5% 2.3% 5.5% 4.6%
43FOREIGN dIRECT INVESTMENT aNd MERGERS aNd aCquISITIONS: ThE EMERGENCE OF ThE SOuTh/ SIEMS ISSuE REpORT 43
High Technology 8.8% 24.7% 10.2% 11.6%
Industrials 15.0% 11.2% 15.1% 14.3%
Materials 21.3% 12.8% 18.6% 18.9%
Media and Enter-tainment
6.3% 4.0% 5.6% 5.2%
Real Estate 1.3% 0.5% 3.1% 3.5%
Retail 0.0% 5.1% 2.6% 2.7%
Telecommunica-tions
3.8% 3.7% 2.0% 2.2%
100.0% 100.0% 100.0% 100.0%
Source: Own elaboration based on Thomson One M&a deals data
TabLE 8d: SECTOR aLLOCaTION OF NuMbER OF SOuTh-SOuTh M&a dEaLS
Macro Sector targeted
1989-1990 1999-2000 2007-2008 2009-2010
Consumer Prod-ucts and Services
15.4% 3.9% 3.9% 4.7%
Consumer Staples 15.4% 13.4% 12.2% 12.0%
Energy and Power 30.8% 10.5% 10.5% 12.8%
Financials 0.0% 16.5% 17.5% 15.8%
Government and Agencies
0.0% 0.0% 0.0% 0.1%
Healthcare 0.0% 1.3% 2.2% 4.1%
High Technology 0.0% 11.3% 6.8% 7.2%
Industrials 7.7% 10.5% 12.9% 13.3%
Materials 15.4% 13.6% 16.9% 15.5%
Media and Enter-tainment
7.7% 10.8% 5.9% 4.7%
Real Estate 0.0% 1.3% 1.8% 2.7%
Retail 0.0% 2.9% 4.5% 3.7%
Telecommunica-tions
7.7% 3.9% 4.9% 3.5%
100.0% 100.0% 100.0% 100.0%
Source: Own elaboration based on Thomson One M&a deals data
Below we present the tables for the sector allocation of cross-border M&A activities based on the reported value of those deals. This data has the shortcomings that were mentioned before and therefore we do not carry out the analysis we did above using number of deals. Nevertheless, we present the information for the interested reader.
44 The New GeoGraphy of CapiTal flows
TabLE 9a: SECTOR aLLOCaTION OF REpORTEd VaLuE OF NORTh-NORTh M&a dEaLS
Macro Sector targeted
1989-1990 1999-2000 2007-2008 2009-2010
Consumer Prod-ucts and Services
3.5% 3.3% 3.1% 2.8%
Consumer Staples 10.5% 5.5% 11.3% 9.3%
Energy and Power 4.2% 9.0% 15.5% 17.8%
Financials 18.3% 13.9% 17.4% 14.0%
Government and Agencies
0.0% 0.1% 0.0% 0.0%
Healthcare 7.3% 4.1% 8.9% 17.7%
High Technology 4.9% 9.0% 6.1% 7.2%
Industrials 14.1% 7.4% 8.3% 10.1%
Materials 19.5% 8.2% 10.6% 5.9%
Media and Enter-tainment
8.8% 7.4% 5.3% 4.8%
Real Estate 1.3% 1.0% 8.7% 5.2%
Retail 4.9% 1.6% 2.1% 2.0%
Telecommunica-tions
2.7% 29.6% 2.8% 3.1%
100.0% 100.0% 100.0% 100.0%
Source: Own elaboration based on Thomson One M&a deals data
TabLE 9b: SECTOR aLLOCaTION OF REpORTEd VaLuE OF NORTh-SOuTh M&a dEaLS
Macro Sector targeted
1989-1990 1999-2000 2007-2008 2009-2010
Consumer Prod-ucts and Services
0.8% 0.6% 1.8% 2.2%
Consumer Staples 7.4% 3.7% 5.4% 12.3%
Energy and Power 32.8% 21.6% 16.6% 10.2%
Financials 4.4% 15.1% 24.3% 9.1%
Government and Agencies
0.0% 0.0% 0.0% 0.1%
Healthcare 0.5% 0.3% 2.5% 5.4%
High Technology 0.1% 2.3% 1.1% 6.8%
Industrials 6.2% 2.8% 5.9% 6.8%
Materials 28.3% 7.3% 19.4% 22.3%
45FOREIGN dIRECT INVESTMENT aNd MERGERS aNd aCquISITIONS: ThE EMERGENCE OF ThE SOuTh/ SIEMS ISSuE REpORT
Media and Enter-tainment
2.3% 2.1% 2.1% 1.3%
Real Estate 0.0% 0.6% 3.5% 4.1%
Retail 0.8% 1.5% 3.3% 2.8%
Telecommunica-tions
16.3% 42.0% 14.0% 16.6%
100.0% 100.0% 100.0% 100.0%
Source: Own elaboration based on Thomson One M&a deals data
TabLE 9C: SECTOR aLLOCaTION OF REpORTEd VaLuE OF SOuTh-NORTh M&a dEaLS
Macro Sector targeted
1989-1990 1999-2000 2007-2008 2009-2010
Consumer Prod-ucts and Services
1.2% 2.4% 0.5% 0.8%
Consumer Staples 2.9% 4.2% 4.3% 10.1%
Energy and Power 17.4% 6.4% 13.4% 28.6%
Financials 5.6% 15.3% 18.6% 5.1%
Government and Agencies
0.0% 0.0% 0.0% 0.0%
Healthcare 0.1% 0.5% 1.8% 5.6%
High Technology 1.6% 15.6% 1.9% 2.3%
Industrials 8.1% 8.5% 10.1% 7.4%
Materials 60.2% 39.4% 44.6% 31.7%
Media and Enter-tainment
1.4% 0.7% 1.4% 4.8%
Real Estate 0.0% 0.0% 0.9% 2.7%
Retail 0.0% 5.0% 0.7% 0.1%
Telecommunica-tions
1.6% 2.1% 1.8% 0.6%
100.0% 100.0% 100.0% 100.0%
Source: Own elaboration based on Thomson One M&a deals data
46 The New GeoGraphy of CapiTal flows
TabLE 9d: SECTOR aLLOCaTION OF REpORTEd VaLuE OF SOuTh-SOuTh M&a dEaLS
Macro Sector targeted
1989-1990 1999-2000 2007-2008 2009-2010
Consumer Prod-ucts and Services
0.0% 0.2% 0.7% 0.1%
Consumer Staples 67.3% 12.2% 5.6% 3.4%
Energy and Power 16.6% 29.8% 17.4% 40.3%
Financials 0.0% 8.7% 25.0% 8.9%
Government and Agencies
0.0% 0.0% 0.0% 0.0%
Healthcare 0.0% 0.5% 1.6% 0.8%
High Technology 0.0% 1.5% 3.5% 0.9%
Industrials 0.0% 3.0% 8.1% 2.2%
Materials 14.1% 30.3% 20.2% 9.3%
Media and Enter-tainment
1.0% 4.4% 1.9% 1.3%
Real Estate 0.0% 1.3% 0.2% 0.3%
Retail 0.0% 0.5% 4.7% 3.9%
Telecommunica-tions
1.0% 7.6% 11.1% 28.6%
100.0% 100.0% 100.0% 100.0%
Source: Own elaboration based on Thomson One M&a deals data
47ThE pOTENTIaL EFFECTS OF SOuTh FdI/ SIEMS ISSuE REpORT 47
ThE pOTENTIaL EFFECTS
OF SOuTh FdI
4
48brave New world CaTeGoriziNG The eMerGiNG MarkeT eCoNoMies – a New MeThodoloGy
The previous section carefully described the recent trends in M&A deals with a particular emphasis in those originated or targeting a developing economy. However, partial or full acquisitions are only one component of FDI flows. The lack of an extensive dataset covering Greenfield investments and joint ventures does not allow us to provide a full picture of FDI activity. Despite this data limitation, there are several studies reflecting on the potential benefits of inward and outward foreign direct investment for a developing country. For instance, the advantages for the recipient country include technology transfer, acquisition of managerial and other skills, as well as job creation and the pro-vision of capital needed for investment and growth. Additional advantages are the impact on foreign exchange and the balance of payments. FDI could also stimulate competition in the host country’s domestic market, and potentially provide access to foreign export markets and global production-sharing net-works (Agosin, 2008).
The supposed benefits of inward FDI for development have nonetheless been widely questioned. FDI flows may have inappropriate or negative effects on the host economy, depending on the type or motive for which the FDI is undertaken. Certain types of resource seeking FDI, for example, have been criticized as encouraging low value added activity and inducing little spending on plant and equipment (Narula and Dunning, 2000). Prospects for employ-ment creation in certain skill categories may be low if FDI results in the use of technology that does not complement the country’s factor endowments. Ben-eficial technological spillovers may be limited if research and development is not conducted in the host economy, or if there are demands for highly restric-tive protection or fees for technology use. In addition, high profit and dividend remittances could negate potential balance of payments benefits. In contrast to the view of increased competition in host country markets, there could be also disadvantages for developing country producers and consumers coming from the market power of multinational corporations in commodity supply chains.
Developing countries’ ability to profit from the potential growth bene-fits of FDI are said to rest on a range of factors including education, macro-economic, financial and political stability, as well as the extent to which the knowledge and technology diffused through FDI can be assimilated (Gam-meltoft, 2007). While it has been argued that technological spillovers would be more substantial the greater the difference in technological sophistication between foreign and local firms, Gammeltoft (2007) suggests that larger gaps could instead prevent such spillovers from occurring effectively. If so, then it could be proposed that South-South FDI may offer better development poten-tials than North-South FDI by applying more ‘appropriate’ technologies, busi-ness models, and managerial and organizational techniques, which are better attuned to developing-economy circumstances.
49ThE pOTENTIaL EFFECTS OF SOuTh FdI/ SIEMS ISSuE REpORT 49
From the point of view of outward FDI, the rationale for South-South integration includes the conventional market-seeking, resource seeking and efficiency-seeking motives (MIGA, 2008; UNCTAD, 2004). For example, Chinese, Russian and Brazilian companies look to Africa and central Asia to address their energy and raw material requirements; and East Asian manu-facturing firms seek efficiency gains through production sharing in regional networks. Gammeltoft (2007) analyses shifts in the characteristics of outward FDI from emerging markets since the 1980s. He finds that while market-seek-ing and efficiency-seeking remain the first and second most important motives for South-South flows, FDI from emerging economies into developed coun-tries has, by contrast, been increasingly of the asset-seeking variety, in pursuit of technological and other capabilities that may not be available at home.
While Greenfield investment was the dominant mode of entry in the 1980s, mergers and acquisitions are gaining in importance for developing countries. The sector structure of outward FDI from emerging economies has changed significantly in the past two decades, with a shift towards services and away from manufacturing and natural resources. The latter nevertheless remains particularly important in South-South flows as we saw in the previous section. The destination of outward FDI from developing countries has also broadened considerably since the early 1990s. Such investment initially took place close to the home country market (to take advantage of existing trade, cultural and other relationships), but has since grown significantly beyond the source country’s neighboring region (Catanneo, 2010).
Therefore the attraction of South-South FDI lies in its potential to offer more appropriate ways for developing countries to stimulate the productive capacity needed for development. Cross-border FDI among developing coun-tries may facilitate integration into regional supply chains as a stepping stone to participation in global production networks. South-South FDI could be of some importance for low-income developing countries that may not attract FDI from the North, but may receive investment from developing country multinationals investing in countries with similar or lower GDPs than their own (UNCTAD, 2004; Aykut and Ratha, 2004). Further, the growing impor-tance of the services sector in FDI flows from emerging markets to other de-veloping countries coincides with a renewed recognition of the importance of a growing and efficient service sector in development.
If South-South FDI is a desirable goal, then the essential question to be considered is how such investment is to be promoted among developing coun-tries and, in particular, whether regional trade agreements (RTAs), preferred trade and investment agreements (PTIAs) and other types of trade and invest-ment agreement could be useful vehicles for increased investment cooperation of this kind.

50 The New GeoGraphy of CapiTal flows
51CONCLuSIONS/ SIEMS ISSuE REpORT
CONCLuSIONS
5
52 The New GeoGraphy of CapiTal flows
The aim of this paper was to describe the making of a new geography of capi-tal flows where both the public and private sectors in a number of emerging markets are rising as key players in the global economy.
The first two sections aggregated data on capital inflows and outflows. We find that the global macro imbalances are at the core of the surge in excess savings (or current account surpluses) in a group of commodity-producing countries and China. Our data suggests that the official sector in this group of countries has become a key player in the allocation of assets across countries and has helped finance the global imbalances. However, we also find that the private sector in the same group of countries has become an important source of capital. In 2009, middle income countries were responsible for about 8.1 % of the total amount of capital outflows, which is almost three times as large a share as it was in year 2000. The consolidation of both outflows and inflows data by income groups suggests that middle income countries have became more important not only as a source but also as a destination of capital flows.
The analysis of the aggregate data does not allow us to fully understand the increasing relevance of a group of emerging economies. For that reason, we decided to map and study the participation of the southern economies in global cross-border merger and acquisition activity over an extended period of time. We draw on M&A data from Thomson Financial Database, one of the most comprehensive M&A databases available. The study looked at the participation of the South by focusing largely on the number of deals. A large number of missing data on the value of deals is an obstacle to an analysis focused on value. In any case, during our analysis, we also present the results based on the reported value of M&A deals for the interested reader.
Our findings suggest that the South has in the last decade emerged as a destination but also as a source of M&A flows. South-South deals have soared suggesting greater integration of the region. Although the share of southern deals directed to the North are getting smaller relatively to the share of south-ern deals directed to the South, the weighted average income per capita of southern countries in South-North deals are considerably lower than those in South-South deals suggesting that relatively poorer countries among the South are pushing the increase in the South-North integration. Overall the BRICs (Brazil, Russia, India, and China) and a number of emerging countries, in-cluding Malaysia and South Africa, are behind this new phenomenon of the South as a source of foreign direct investments. The same set of countries plus Ukraine, Indonesia, and Mexico are the favourite destination among the M&A deals targeting the South. However, the market shares for the number of M&A deals are more concentrated when we look to the countries that act as a source in the South than when we consider the countries that are targeted in that same region.
53CONCLuSIONS/ SIEMS ISSuE REpORT
Our dataset is rich enough to allow us to analyse the M&A deals accord-ing to the economic sector that has been targeted. Overall, the priority sector for firms in the South seems to be similar whether they reach a firm in the South or the North. Investments in materials, financial, and industrial sectors account for 45% to 50% of the number of deals. However, there are important differences when looking to the sectors that are not among the top in terms of the number of deals. Consumer staples and energy and power have a higher share among South-South than among South-North deals while the opposite happens in more advanced sectors such as high technology, healthcare, and media and communications. This suggests that South firms reach North com-panies to both access new markets and technology, and target South compa-nies for raw materials and traditional markets.
The recent increase in the participation of the South in global cross-border M&A activity raises a number of questions. First, is the increase in the South participation a lasting phenomenon? Considering that some possible triggers were the boom in commodity prices pushing profits of commodity suppliers in emerging economies to unprecedented levels, the increase in stock market valuation in emerging markets amplifying the funding options of local enter-prises, and the prevalent availability of cheap credit until mid 2008, it is quite possible that the upswing in M&A activity both coming from and targeting the South was a temporary incident. While it is too early to fully understand the effect of the crisis, the M&A deal data for 2010 suggests a faster recovery in the number and value of the deals targeting or having the South as a source in comparison with the North counterpart. As these emerging economies con-tinue to grow and to diversify their production structure, it would be natural to expect a further increase in their involvement in the global economy, including the strengthening of their position as a source of capital.
Even if the pace of South involvement in cross-border M&As were to slow down, the global and transnational production networks initiated by these M&As are unlikely to go away, suggesting that the effects of cross-border activity bring an opportunity for the private sector in developing economies to tap into new markets, to access new technologies and resources, to spread risks, to reduce costs, and to increase competitiveness. Gains to developing economies may come in the form of lower prices and broader access to qual-ity products and services. The challenge is to see how different sectors and economies can benefit from this new wave of cross-border activity and how countries’ national policies should respond to this new challenge. Further re-search on the impact of outward M&A activity and FDI on growth dynamics and economic transformation using specific country case studies would there-fore be very valuable.
53
54 The New GeoGraphy of CapiTal flows
Appendix A: Variable Definitions
for Tables aNd fiGures ThaT use iNTerNa-
TioNal fiNaNCial sTaTisTiCs as The sourCe
Foreign Direct Investment is the sum of Direct Investment Abroad and Direct Investment in Reporting Econ., n.i.e. They represent the flows of direct investment capital out of the reporting economy and those into the reporting economy, respectively. Direct investment includes equity capital, reinvested earnings, other capital and financial derivatives associated with various intercompany transactions between affiliated enterprises. Excluded are flows of direct investment capital into the reporting economy for exceptional financing, such as debt-for-equity swaps. Direct investment abroad is usually shown with a negative figure, reflecting an increase in net outward investment by residents, with a corresponding net payment inflow into the reporting economy.
Portfolio Investments (Assets and Liabilities) include transactions with non-residents in financial securities of any maturity (such as corporate securities, bonds, notes, and money market instruments) other than those included in direct investment, exceptional financing, and reserve assets.
Other Investment (Assets and Liabilities) include all financial transactions not covered in direct investment, portfolio investment, financial derivatives, or reserve assets. Major categories are transactions in currency and deposits, loans, and trade credits.
Reserve Assets consists of external assets readily available to and controlled by monetary authorities primarily for direct financing of payment imbalances and for indirect regulating of the magnitude of such imbalances through exchange market intervention. Reserve assets comprise monetary gold, special drawing rights, reserve position in the
55
Fund, foreign reserve assets (consisting of currency and deposits and securities), and other claims.
for Tables aNd fiGures ThaT use Global
developMeNT fiNaNCe as The sourCe
Aggregate net resource flows are the sum of net resource flows on long-term debt (excluding IMF) plus net direct foreign investment, portfolio equity flows and official grants (excluding technical cooperation). Net flows (or net lending or net disbursements) are disbursements minus principal repayments.
Official net resource flows are the sum of official net flows on long-term debt to official creditors (excluding IMF) plus official grants (excluding technical cooperation). Net flows (or net lending or net disbursements) are disbursements minus principal repayments.
Private net resource flows are the sum of net flows on debt to private creditors (PPG and PNG) plus net direct foreign investment and portfolio equity flows. Net flows (or net lending or net disbursements) are disbursements minus principal repayments.
for Tables aNd fiGures ThaT use ThoMsoN
oNe as a sourCe
Mergers and Acquisitions include all completed cross-border deals where 1) the value of the deal and the country of origin of both acquirer and target are known; and 2) the deal meets the equity condition of FDI, i.e. the percent of shares owned by the acquirer upon completion is greater than or equal to 10%. This excludes acquisitions by investors where the country of origin is unknown. The date refers to the date completed rather than the date announced, and the value is reported in constant 2000 USD.
Source country is the country of the ultimate parent of the acquiring firm.
Target country is the country of the firm acquired, regardless of whether the ultimate parent is located in a different country.
/ appeNdiX / SIEMS ISSuE REpoRt
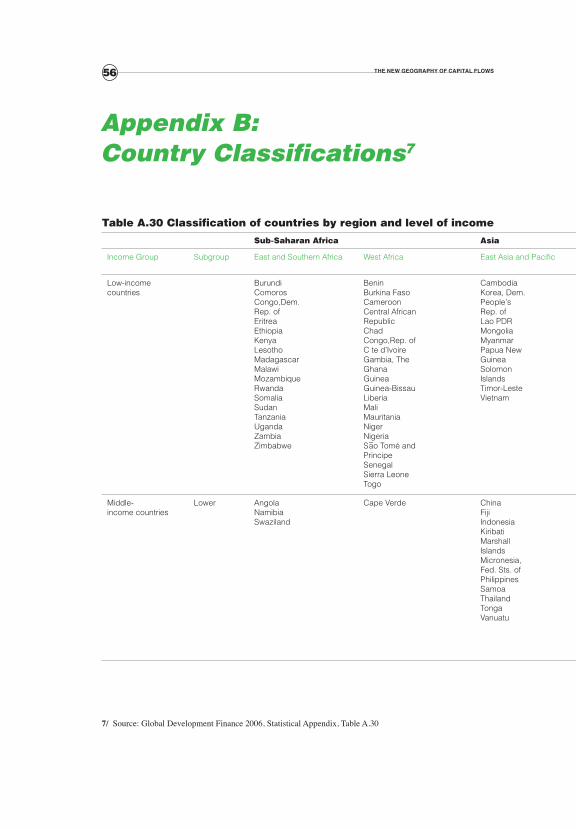
56 The New GeoGraphy of CapiTal flows
Appendix B: Country Classifications7
Sub-Saharan Africa Asia Europe and Central Asia Middle East and North Africa America
Income Group Subgroup East and Southern Africa West Africa East Asia and Pacific South Asia Eastern Europe and Central Asia
Rest of Europe Middle East North Africa America
Low-incomecountries
BurundiComorosCongo,Dem.Rep. ofEritreaEthiopiaKenyaLesothoMadagascarMalawiMozambiqueRwandaSomaliaSudanTanzaniaUgandaZambiaZimbabwe
BeninBurkina FasoCameroonCentral AfricanRepublicChadCongo,Rep. ofCôte d’IvoireGambia, TheGhanaGuineaGuinea-BissauLiberiaMaliMauritaniaNigerNigeriaS~ao Tomeô and PrincipeSenegalSierra LeoneTogo
CambodiaKorea, Dem.People’sRep. ofLao PDRMongoliaMyanmarPapua NewGuineaSolomonIslandsTimor-LesteVietnam
AfghanistanBangladeshBhutanIndiaNepalPakistan
KyrgyzRepublicMoldovaTajikistanUzbekistan
Yemen,Rep. of
HaitiNicaragua
Middle-income countries
Lower AngolaNamibiaSwaziland
Cape Verde ChinaFijiIndonesiaKiribatiMarshallIslandsMicronesia,Fed. Sts. ofPhilippinesSamoaThailandTongaVanuatu
MaldivesSri Lanka
AlbaniaArmeniaAzerbaijanBelarusBosnia andHerzegovinaBulgariaGeorgiaKazakhstanMacedonia,FYRa
RomaniaSerbia andMontenegroTurkmenistanUkraine
Iran, IslamicRep. ofIraqJordanSyrian ArabRep.West BankAnd Gaza
AlgeriaDjiboutiEgypt, Arab Rep. ofMoroccoTunisia
BoliviaBrazilColombiaCubaDominicanRepublicEcuadorEl SalvadorGuatemalaGuyanaHondurasJamaicaParaguayPeruSuriname
7/ Source: Global Development Finance 2006, Statistical Appendix, Table A.30
table A.30 Classification of countries by region and level of income
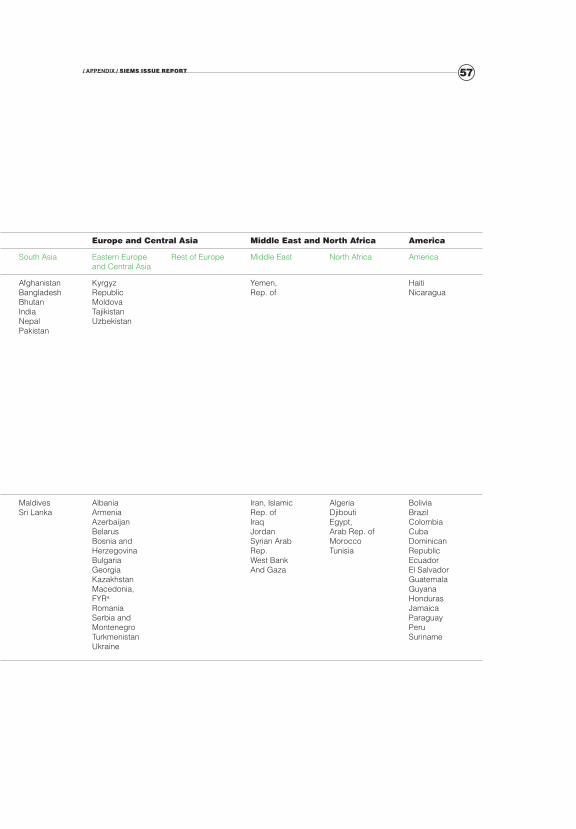
57
Sub-Saharan Africa Asia Europe and Central Asia Middle East and North Africa America
Income Group Subgroup East and Southern Africa West Africa East Asia and Pacific South Asia Eastern Europe and Central Asia
Rest of Europe Middle East North Africa America
Low-incomecountries
BurundiComorosCongo,Dem.Rep. ofEritreaEthiopiaKenyaLesothoMadagascarMalawiMozambiqueRwandaSomaliaSudanTanzaniaUgandaZambiaZimbabwe
BeninBurkina FasoCameroonCentral AfricanRepublicChadCongo,Rep. ofCôte d’IvoireGambia, TheGhanaGuineaGuinea-BissauLiberiaMaliMauritaniaNigerNigeriaS~ao Tomeô and PrincipeSenegalSierra LeoneTogo
CambodiaKorea, Dem.People’sRep. ofLao PDRMongoliaMyanmarPapua NewGuineaSolomonIslandsTimor-LesteVietnam
AfghanistanBangladeshBhutanIndiaNepalPakistan
KyrgyzRepublicMoldovaTajikistanUzbekistan
Yemen,Rep. of
HaitiNicaragua
Middle-income countries
Lower AngolaNamibiaSwaziland
Cape Verde ChinaFijiIndonesiaKiribatiMarshallIslandsMicronesia,Fed. Sts. ofPhilippinesSamoaThailandTongaVanuatu
MaldivesSri Lanka
AlbaniaArmeniaAzerbaijanBelarusBosnia andHerzegovinaBulgariaGeorgiaKazakhstanMacedonia,FYRa
RomaniaSerbia andMontenegroTurkmenistanUkraine
Iran, IslamicRep. ofIraqJordanSyrian ArabRep.West BankAnd Gaza
AlgeriaDjiboutiEgypt, Arab Rep. ofMoroccoTunisia
BoliviaBrazilColombiaCubaDominicanRepublicEcuadorEl SalvadorGuatemalaGuyanaHondurasJamaicaParaguayPeruSuriname
/ appeNdiX / SIEMS ISSuE REpoRt
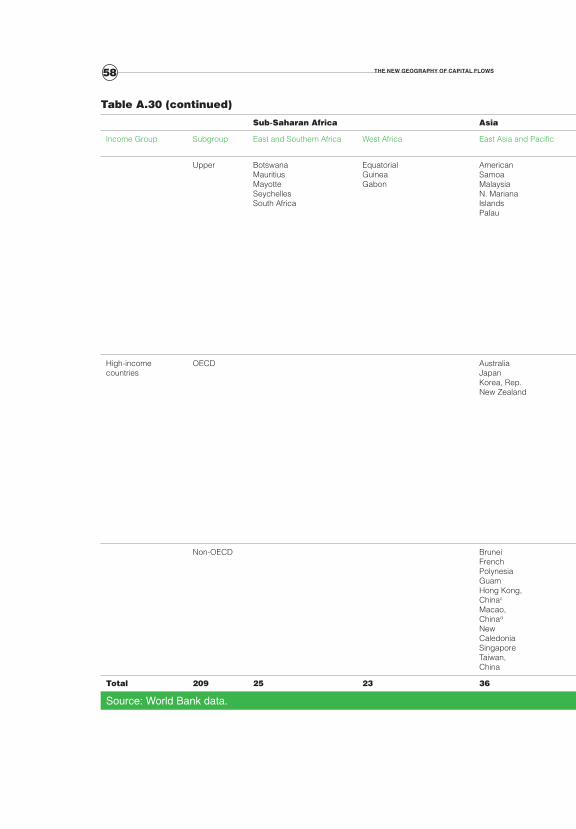
58 The New GeoGraphy of CapiTal flows
Sub-Saharan Africa Asia Europe and Central Asia Middle East and North Africa America
Income Group Subgroup East and Southern Africa West Africa East Asia and Pacific South Asia Eastern Europe and Central Asia
Rest of Europe Middle East North Africa America
Upper BotswanaMauritiusMayotteSeychellesSouth Africa
EquatorialGuineaGabon
AmericanSamoaMalaysiaN. MarianaIslandsPalau
CroatiaCzechRepublicEstoniaHungaryLatviaLithuaniaPolandRussianFederationSlovakRepublic
Turkey LebanonOman
Libya Antigua and BarbudaArgentinaBarbadosBelizeChileCosta RicaDominicaGrenadaMexicoPanamaSt. KittsAnd NevisSt. LuciaSt. VincentTrinidad And TobagoUruguayVenezuela,R. B. de
High-income countries
OECD AustraliaJapanKorea, Rep.New Zealand
AustriaBelgiumDenmarkFinlandFrancebGermanyGreeceIcelandIrelandItalyLuxembourgNetherlandsNorwayPortugalSpainSwedenSwitzerlandUnitedKingdom
CanadaUnited States
Non-OECD BruneiFrenchPolynesiaGuamHong Kong,Chinac
Macao, Chinad
New CaledoniaSingaporeTaiwan,China
Slovenia AndorraChannelIslandsCyprusFaeroeIslandsGreenlandIsle of ManLiechtensteinMonacoSan Marino
BahrainIsraelKuwaitQatarSaudiArabiaUnited ArabEmirates
Malta ArubaBahamas, TheBermudaCayman IslandsNetherlandsAntillesPuerto RicoVirginIslands (U.S.)
total 209 25 23 36 8 27 28 14 7 41
Source: world bank data.
table A.30 (continued)
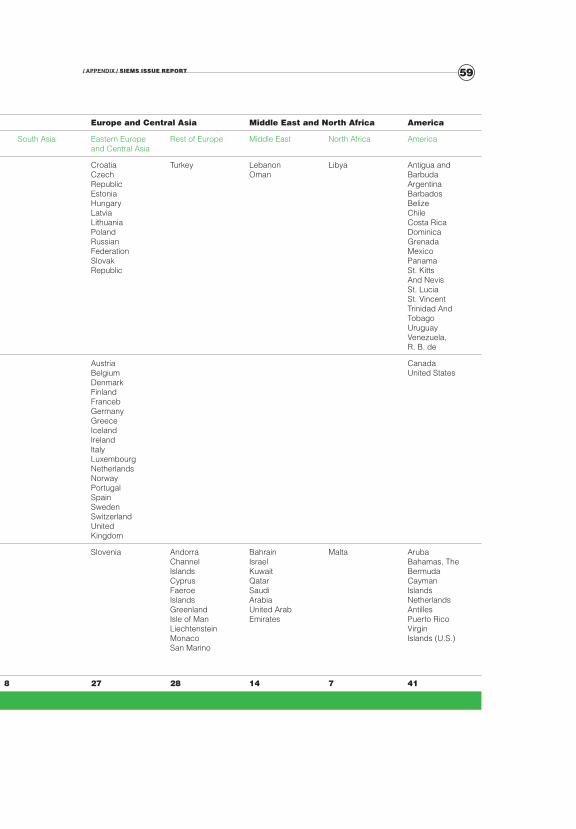
59
Sub-Saharan Africa Asia Europe and Central Asia Middle East and North Africa America
Income Group Subgroup East and Southern Africa West Africa East Asia and Pacific South Asia Eastern Europe and Central Asia
Rest of Europe Middle East North Africa America
Upper BotswanaMauritiusMayotteSeychellesSouth Africa
EquatorialGuineaGabon
AmericanSamoaMalaysiaN. MarianaIslandsPalau
CroatiaCzechRepublicEstoniaHungaryLatviaLithuaniaPolandRussianFederationSlovakRepublic
Turkey LebanonOman
Libya Antigua and BarbudaArgentinaBarbadosBelizeChileCosta RicaDominicaGrenadaMexicoPanamaSt. KittsAnd NevisSt. LuciaSt. VincentTrinidad And TobagoUruguayVenezuela,R. B. de
High-income countries
OECD AustraliaJapanKorea, Rep.New Zealand
AustriaBelgiumDenmarkFinlandFrancebGermanyGreeceIcelandIrelandItalyLuxembourgNetherlandsNorwayPortugalSpainSwedenSwitzerlandUnitedKingdom
CanadaUnited States
Non-OECD BruneiFrenchPolynesiaGuamHong Kong,Chinac
Macao, Chinad
New CaledoniaSingaporeTaiwan,China
Slovenia AndorraChannelIslandsCyprusFaeroeIslandsGreenlandIsle of ManLiechtensteinMonacoSan Marino
BahrainIsraelKuwaitQatarSaudiArabiaUnited ArabEmirates
Malta ArubaBahamas, TheBermudaCayman IslandsNetherlandsAntillesPuerto RicoVirginIslands (U.S.)
total 209 25 23 36 8 27 28 14 7 41
Source: world bank data.
/ appeNdiX / SIEMS ISSuE REpoRt
60 The New GeoGraphy of CapiTal flows
Note: For operational and analytical purposes, the world bank’s main crite-rion for classifying economies is gross national income (GNI) per capita. Ev-ery economy is classified as low income, middle income (subdivided into lower middle and upper middle), or high income. Other analytical groups, based on geographic regions and levels of external debt, are also used. Low-income and middle-income economies are sometimes referred to as developing economies. The use of the term is convenient; it is not intended to imply that all economies in the group are experiencing similar development or that other economies have reached a preferred or final stage of devel-opment. Classification by income does not necessarily reflect development status. This table classifies all world bank member economies, and all other economies with populations of more than 30,000. Economies are divided among income groups according to 2004 GNI per capita, calculated using the world bank atlas method. The groups are: low income, $825 or less; lower middle income, $826–3,255; upper middle in-come, $3,256–10,065; and high income, $10,066 or more. a. Former yugoslav Republic of Macedonia. b. The French overseas departments French Guiana, Guadeloupe, Martinique, and Réunion are included in France. c. On 1 July 1997 China resumed its exercise of sovereignty over hong Kong. d. On 20 december 1999 China resumed its exercise of sovereignty over Macao.
Balance of payment data is not available for the following countries in the International Financial Statistic database:
• Low-income countries: Dem. Rep. of Congo; Dem. People’s Rep. of Korea; Bhutan; Uzbekistan• Lower-middle income countries: Marshall Islands; Fed. Sts. of Micronesia; Serbia and Montenegro; Iraq; Cuba• Upper-middle income countries: American Samoa; N. Mariana Islands; Palau; Mayotte• High income countries: Brunei; French Polynesia; Guam; New Caledonia; Taiwan, China; Andorra; Channel Islands; Faeroe Islands; Greenland; Isle of Man; Liechtenstein; Monaco; San Marino; United Arab Emirates; Bermuda; Cayman Islands; Puerto Rico; Virgin Islands (U.S.)
61
We construct two general indices aiming to capture the composition of partici-pation in southern M&A activity. On both measures, the smaller the index, the larger is the participation of lower income countries in M&A deals originating in the South.
The share-weiGhTed iNCoMe per CapiTa iNdeXThe first measure is participating countries’ annual income per capita weighted by their respective share in M&A activity. Share in activity is the percentage originating from a given country of the total number of deals. We also pres-ent the results based on the share of total value, but with the caveat that no values are reported for about half of the sample. 2006 income per capita of the southern region as a whole is fixed as the base for a time- series comparison, controlling for income growth of the region as a whole. We use individual country annual GNI per capita (Atlas method in current US$) from the World Bank’s World Development Report.
Index= (shareit *IncomePerCapitait )*IncomePerCapitasouth2006
IncomePerCapitasoutht
Shareit = mit
, Mit= mit, n=number of countries Mt
Where shareit denotes the share participation of country i at time t in the total number deals or in the total value of M&A deals in a specified region and at time t; IncomePerCapitait is the income per capita of country i at time t; and the IncomePerCapitaSoutht is the income per capita of the southern region at time t. Income per capita of 2006 is defined as the base year.
The share-weiGhTed iNCoMe perCeNTile iNdeXThe second measure is the per capita income deciles of participating countries weighted by each individual country’s share in the M&A activity of a speci-fied region at time t. Annual income percentile rankings are constructed using
Appendix C: How to measure the South’s participation in M&A?
/ appeNdiX / SIEMS ISSuE REpoRt
62 The New GeoGraphy of CapiTal flows
individual country annual GNI per capita (Atlas method in current US$) from the World Bank’s World Development Indicator.
Index percentile= (shareit *percentileit )
Where shareit denotes the share of country i at time t in the total number or the total value of M&A deals in a specified region and at time t; and percentile it denotes the income percentile of a given country i at time t.
REFERENCES
• Agosin, Manuel (2008): “Is foreign investment always good for development?” Global Development and Environment Institute, Tufts University, Medford, Massachusetts.
• Aykut, Dick and Dilip Ratha (2004): “South-South FDI flows: how big are they?” Transnational Corporations, 13, 1: 149-176.
• Boston Consulting Group (2006): “The New Global Challenges.” Financial Times. 2006. “Emerging Markets Bite Back.” November 2006.
• Cattaneo, Nicolette (2010): “Regional trade agreements, production networks and South-South FDI: potential benefits and challenges for SACU-MERCOSUR investment relations”. Mimeo.
• Çiğdem, Akin and Ayhan Kose (2007): “Changing Nature of North-South Linkages: Stylized Facts and Explanations,” IMF Working Paper 07/280.
• Gammeltoft, Peter (2008): “Emerging multinationals: outward FDI from the BRICS countries.” International Journal of Technology and Globalization.
• International Monetary Fund (2007): Global Financial Stability Report. Washington, D.C.
• Lane, Philip R. and Gian Maria Milesi-Ferretti (2001): “The External Wealth of Nations: Measures of Foreign Assets and Liabilities for Industrial and Developing Countries” Journal of International Economics, 55: 263-94.
• Lane, Philip R. and Gian Maria Milesi-Ferretti (2006): “The External Wealth of Nations Mark II: Revised and Extended Estimates of Foreign Assets and Liabilities, 1970- 2004.” IMF Working Paper WP/06/69. Washington, D.C.: IMF.
• Marone, Heloisa (2007): “How Far South Have Merger and Acquisitions Gone?” Mimeo.
• MIGA (2008) “South-South FDI and political risk insurance: challenges and opportunities.” Multilateral Investment Guarantee Agency, World Bank Group.
63/ refereNCes / SIEMS ISSuE REpoRt
• Morck, Randall, Bernard Yeung, and Minyuan Zhao (2007): “Perspectives on China’s Outward Foreign Direct Investment,” Mimeo.
• Narula, Rajneesh and John Dunning (2000): “Industrial development, globalization and multinational enterprises: new realities for developing countries.” Oxford Development Studies, 28, 2: 141-67.
• Rogoff, Kenneth (1999): “International Institutions for Reducing Global Financial Instability.” Journal of Economic Perspectives. 13(4): 21-42.
• Sauvant, Karl (2005): “New Sources of FDI: The BRICs,” Journal of World Investment and Trade, vol.6, 5, pp. 639-709.
• Sauvant, Karl (2007): “Regulatory Risk and the growth of FDI,” in World Investment Prospects to 2011: Foreign Direct Investment and the Challenge of Political Risk, The Economist Intelligence Unit.
• UNCTAD (2004): “South-South investment flows: a potential for developing country governments to tap for supply capacity building”. Background Paper No. 3, Doha High-Level Forum on Trade and Investment, Doha, 5-6 December.
• UNCTAD (2006): World Investment Report: FDI from Developing and Transition Economies: Implications for Development. Geneva: UNCTAD.
• UNCTAD (2007): World Investment Report: Transnational Corporations, Extractive Industries and Development.
64 The New GeoGraphy of CapiTal flows
SIEMS RESEARCH MONTHLY BRIEFINGS • “The global financial crisis: impact and responses in China and Russia”
(February 2009).• “Managing through the global recession: Opportunities and strategic responses
in China and Russia” (March 2009).• “Global expansion of emerging multinationals: postcrisis adjustment”
(May 2009).• “Operational challenges facing emerging multinationals from Russia and
China” (June 2009).• “MNC Operations in Emerging Markets: Post-Crisis Adjustments of FDI
Inflows in China and Russia” (August 2009).• “Is Demographics Destiny? How Demographic Changes Will Alter the
Economic Futures of the BRICs” (September 2009).• “Executive leadership structure in China and Russia” (December 2009).• “Size Matters: Just How Big Are The BRICs?” (January 2010).• “Decoupling Revisited: Can the BRICs Really Go Their Own Way?“
(February 2010).• “The “New Geography” of International Trade “How the Emerging Markets
are Rapidly Changing Global Trade” (March 2010).• “Chief Executive Officer Turnover in China and Russia: Implications for
Corporate Governance and Strategic Management” (April 2010).• “Sovereign Wealth Funds and the New Era of BRIC Wealth” (July 2010).• “Corporate Giants and Economic Growth — A Case for China and Russia”
(August 2010).• “Is Low Wage Manufacturing in China Disappearing? - Who will be the
World’s next Workshop?” (November 2010).• “The New Oil Paradigm: Can the Developing World Live with $100 Plus
Oil?” (January 2011).
SIEMS ISSUE REPORTS
• “The World’s Top Auto Markets in 2030: Emerging Markets Transforming the Global Automotive Industry” (May 2010).
• “The Productivity Prize. Accounting for Recent Economic Growth among the BRICs: Miracle or Mirage?” (June 2010).
• “The Great Equalizer. The Rise of the Emerging Market Global Middle Class” (September 2010).
• “Central Bank Independence and the Global Financial Meltdown: A View from the Emerging Markets” (November 2010).

65/ refereNCes / SIEMS ISSuE REpoRt
• “Brave New World Categorizing the Emerging Market Economies – A New Methodology, SKOLKOVO Emerging Market Index” (February 2011)
• “The New Geography of Capital Flows” (March 2011)
The SKOLKOVO institute for Emerging Market studies (SIEMS) is a knowledge centre at the Moscow School of Management SKOLKOVO that specializes in the research of the economies and businesses of the emerging markets. It provides a research platform that attracts and links leading thinkers and experts from around the world, who can col-laborate on studying timely and critical issues in emerging markets. Its research is rigorous, field-driven, and comparative across emerging markets and offers practical, broadly applicable, and valuable guide-lines and frameworks for business leaders, entrepreneurs, policy-mak-ers, and academics with interests in emerging markets. It currently has offices in Moscow and beijing and plans to open the India office in the near future. Its researchers include several full-time and part-time research fellows who are leading scholars and experts in various fields. Its current research focus covers economic and financial devel-opment, firm growth and sustainability, CSR practices, and indigenous innovations in fast growing countries. Its research output is distributed through various forms of reports, publications, forums, and seminars. we welcome feedback and suggestions from our readers on the re-search findings and future research directions.
SKOLKOVO Institute for Emerging Market Studiesunit 1607-1608, North Star Times Tower No. 8 beichendong Road, Chaoyang districtbeijing, 100101, Chinatel./fax: +86 10 6498 1634

CONCLuSIONS/ SIEMS ISSuE REpORT
The Moscow School of Management SKOLKOVO is a joint project of Russian and international business representatives, who joined their efforts to create a business new-generation school from scratch. Fo-cusing on practical knowledge, the Moscow School of Management dedicates itself to training leaders, who intend to implement their pro-fessional knowledge in the conditions of rapidly developing markets. SKOLKOVO is defined by: leadership and business undertakings, rap-idly developing markets focus, innovative approach towards educa-tional methods.
The Moscow School of Management SKOLKOVO project is fulfilled by the governmental-private partnership within the framework of the Education Foreground National project. The project is financed by pri-vate investors, and doesn’t use governmental budget recourses. The president of the Russian Federation dmitry anatolyevich Medvedev is Chairman of the SKOLKOVO International advisory board.
Since 2006 SKOLKOVO conducts short educational Executive Edu-cation programmes for top and medium level managers – open pro-grammes and specialized, integrated modules based on the com-panies requests. SKOLKOVO launched Executive МВА programme in January 2009, first class of the international Full-time Mba pro-gramme – in September 2009.
Moscow School of Management SKOLKOVO100 ulitsa Novaya, Skolkovo,Odintsovsky district, Moscow Region,Russia 143025tel.: +7 495 580 30 03fax: +7 495 994 46 68

68 The New GeoGraphy of CapiTal flows
Ernst & young is a global leader in assurance, tax, transaction and advisory services. worldwide, our 144,000 people are united by our shared values and an unwavering commitment to quality. we make a difference by helping our people, our clients and our wider communi-ties achieve their potential.
with the opening of our Moscow office in 1989, we were the first pro-fessional services firm to establish operations in the Commonwealth of Independent States. Ernst & young expands its services and re-sources in accordance with clients’ needs throughout the CIS. 3,400 professionals work at 16 offices throughout the CIS in Moscow, St. petersburg, Novosibirsk, Ekaterinburg, Togliatti, yuzhno-Sakhalinsk, almaty, astana, atyrau, baku, Kyiv, donetsk, Tashkent, Tbilisi, yere-van, and Minsk.
across all industries, and at local and international levels, our profes-sionals are recognized for their leadership, know-how, and delivery of accomplished results. we aim to help you identify and reduce business risks, find solutions that will work, and open new opportunities for your company. Through more than 20 years of our operations in the CIS, we have provided the critical information and the trusted resources to pave the way for improved business performance and profitability.
Ernst & young Sadovnicheskaya Nab. 77, bld. 1 | 115035 Moscow | Russia phone: +7 (495) 755 9700 Fax: +7 (495) 755 9701 E-mail: [email protected] website: www.ey.com

CONCLuSIONS/ SIEMS ISSuE REpORT

70 The New GeoGraphy of CapiTal flows
Moscow School of Management SKOLKOVO100 ulitsa Novaya, Skolkovo,Odintsovsky district, Moscow Region,Russia 143025tel.: +7 495 580 30 03fax: +7 495 994 46 68
SKOLKOVO Institute for Emerging Market Studiesunit 1607-1608, North Star Times TowerNo. 8 beichendong Road, Chaoyang districtbeijing, 100101, Chinatel./fax: +86 10 6498 1634