Embed Size (px)
Citation preview
1
The New England FinancialServices Industry:
Around the Corner andAround the World
January 2017
NEC Members and Friends,
As the nation’s oldest regional business association, The New England Council is dedicated to promoting
economic growth and a high quality of life in the New England region. Central to this mission is raising
awareness of the key role various industries play in helping boost our economy and create and sustain
good, well-paying jobs. As such, The Council is proud to present a report on the strength and role of the
financial services industry in New England.
As this study demonstrates, the financial services sector is one of our region’s strongest job-generating,
growth-producing industries, with a tremendous footprint in each of the six New England states. In no
state does financial services account for less than 5 percent of that state’s jobs, and in many states the
impact is far greater. Additionally, a hallmark of financial services jobs in New England is that they are
high-wage jobs, featuring an impressive array of benefits for the hundreds of thousands of individuals
who make up the region’s workforce.
The history of finance in the United States is intertwined with the New England region. Boston is home to
some of the world’s largest asset management firms, while Connecticut boasts an outsized share of
insurance companies. But what may be less obvious is the impact that the financial services industry has
on the entire six-state region. Vermont is a global player in the captive insurance realm, while banks and
credit unions help ensure economic development and vitality in hundreds of cities and towns from
Bridgeport to Bangor.
The story told in these pages is one of an industry that makes all things possible. From funding a startup
company in Providence with a small business loan to helping a hardworking couple in Portsmouth save
for retirement, financial services impacts our lives on a daily basis. We are pleased that PwC, a member
of The New England Council, provided invaluable resources in helping to tell this story, and we thank
them for their expertise and support in bringing this project to fruition.
This report is intended to be a factual resource; there are no policy recommendations contained within.
However, it is our hope that readers will gain a stronger understanding of, and appreciation for, the role
that the financial services industry plays in enhancing the quality of life and economic well-being in New
England, and will contemplate what steps should be taken to ensure that the sector – and the proud men
and women who make up its workforce – continues to be a steadfast driver of jobs and growth here at
home.
Best regards,
James T. Brett
President & CEO
ContentsIntroduction ................................................................................................................................ 1
New England Financial Services Ecosystem.............................................................................. 3
Report Methodology................................................................................................................... 4
Economic Impacts of the Financial Services Industry................................................................. 6
Sector Spotlights.......................................................................................................................11
Banking .................................................................................................................................11
Asset Management................................................................................................................14
Insurance ..............................................................................................................................16
State Spotlights.........................................................................................................................18
Connecticut ...........................................................................................................................18
Maine ....................................................................................................................................19
Massachusetts ......................................................................................................................21
New Hampshire.....................................................................................................................22
Rhode Island .........................................................................................................................24
Vermont.................................................................................................................................25
FinTech.....................................................................................................................................27
Conclusion ................................................................................................................................32
Appendix A: Methodology .........................................................................................................33
Author and Contributors ............................................................................................................34
Endnotes...................................................................................................................................36
The New England Financial Services Industry: Around the Corner and Around the World 1
Introduction
Background
Financial services, as former Treasury Secretary Larry Summers once said, “Don’t just grease the
wheels of commerce – they are the wheels.” Consider this: without insurance, no ships would sail,
no trucks or trains would roll, no planes would fly – at least not anywhere on the scale we see
today. The risks would simply be too great. Without banks to provide mortgages and construction
loans, few homes could get built – and only for cash by a wealthy few. Farmers would not risk
planting huge crops to serve the global market without access to crop insurance and derivatives to
hedge against bad harvests. E-commerce would be impossible, Amazon and E-bay would be mere
fantasies – without credit cards and payments systems to clear transactions. Closer to home, the
financial services industry helps parents save for their children’s tuition, affords the ability to pay for
groceries (and get those groceries to market), provides capital for new businesses to open on main
street and allows workers to save for their retirement. Everything we wear, drive, eat, live in and
rely on depends, in turn, on the vast unseen web of financial contracts and networks that link us to
each other and to buyers and sellers around the globe.
It seems that, all too often, stakeholders don’t fully appreciate the story behind the financial
services industry, from its economic impact, to the jobs it creates, to the cutting-edge technology
helping attract and retain college graduates to the region. The purpose of this report is to provide
a contemporary data set that demonstrates the strength, importance, and impact of New
England’s financial services industry. In all six New England states, the goal is to capture as
much information as we can about the condition of financial services in New England – from the
captive insurance market in Connecticut and Vermont, to the asset management industry in
Boston, to the small and mid-sized banks and credit unions in cities and towns across the region.
With this information, the hope is that the public will better appreciate the critical and positive role
the New England’s financial services industry plays in their lives, and policymakers at both the
state and federal levels will have a stronger understanding about how the financial services
industry is helping their constituents get ahead and stay there.
A Storied Industry in a Historic Region
The financial services industry has a long history and tradition in New England. The world’s first
modern mutual fund, Massachusetts Investors Trust, was created in Boston by L. Sherman
Adams, Charles H. Learoyd, and Ashton L. Carr in 1924.1 Ninety two years later, Massachusetts
Investors Trust is still an active mutual fund, with more than $6.2 billion in net assets and has
performed at an average annual total return of roughly 9% life to date.2 In 1924, the fund broke
ground becoming the first “open ended,” as we know the term today, fund that was willing to buy
back its shares from its investors at the end of each business day. Today, mutual fund assets
managed in the United States top $16 trillion3 as part of the more than $51 trillion of industry
assets under management.4 The first U.S. exchange-traded fund, Standard and Poor’s
Depository Receipt or SPDR, was launched in 1993 by State Street Global Advisors in Boston.5
Massachusetts was the first state to pass comprehensive laws regulating banks. While
restrictions were previously contained within individual bank charters, the 1829 Act to Regulate
Banks and Banking brought uniformity to areas such as capital, limitations on debt, and the
liability of directors.6 The nation’s first credit union was founded in New Hampshire in 1909.7

The New England Financial Services Industry: Around the Corner and Around the World 2
Connecticut has long been home to insurance companies which lead and innovate in the industry
and further north in the region, Vermont became the first U.S. state to pass captive insurance
legislation in 1981.8 Vermont currently is the largest captive insurance domicile in the country,9
and several states have since followed Vermont’s lead by revising regulations to be more
attractive to captive insurance companies. Currently, more than half of U.S. states have captive
licensing laws.10
The Report
Following a discussion on the New England financial
services ecosystem and background on report
methodology, the report then highlights the impact the
financial services industry has on the region. This is
followed by details on the industry sub sectors and
states. Throughout this report, spotlights on regional
industry participants have been included. The report
closes with a section focused on FinTech.
The New England Financial Services Industry: Around the Corner and Around the World 3
New England Financial Services Ecosystem
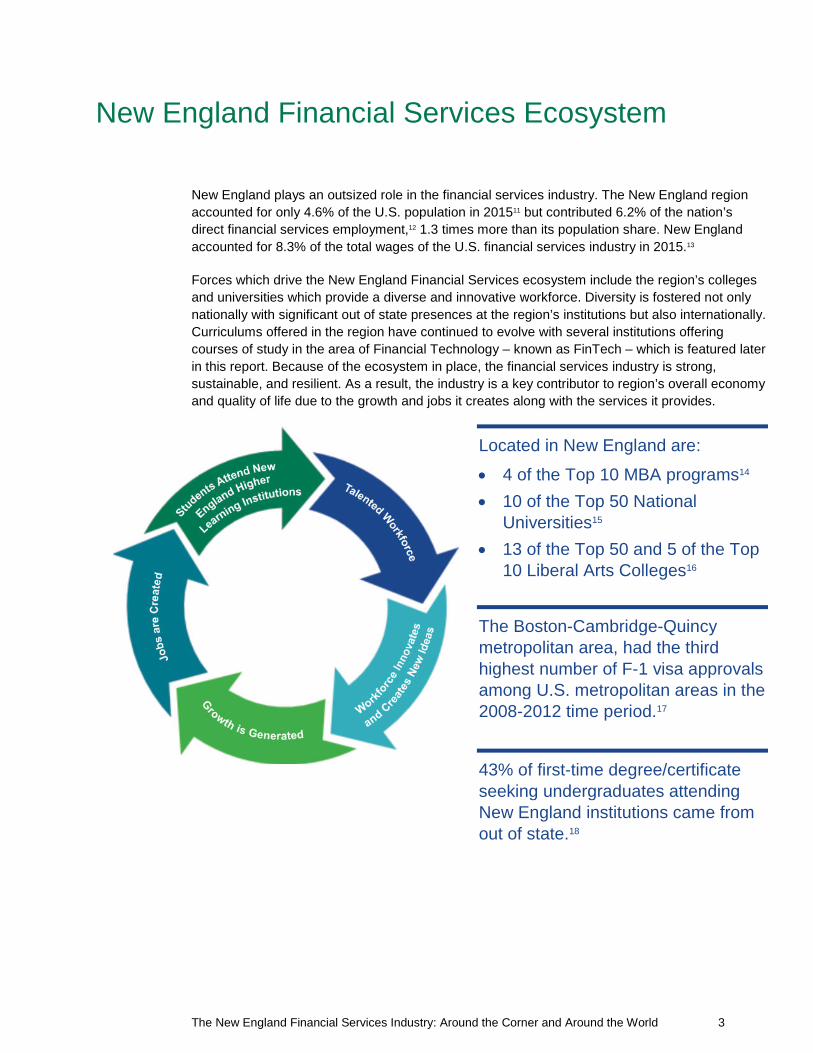
New England plays an outsized role in the financial services industry. The New England region
accounted for only 4.6% of the U.S. population in 201511 but contributed 6.2% of the nation’s
direct financial services employment,12 1.3 times more than its population share. New England
accounted for 8.3% of the total wages of the U.S. financial services industry in 2015.13
Forces which drive the New England Financial Services ecosystem include the region’s colleges
and universities which provide a diverse and innovative workforce. Diversity is fostered not only
nationally with significant out of state presences at the region’s institutions but also internationally.
Curriculums offered in the region have continued to evolve with several institutions offering
courses of study in the area of Financial Technology – known as FinTech – which is featured later
in this report. Because of the ecosystem in place, the financial services industry is strong,
sustainable, and resilient. As a result, the industry is a key contributor to region’s overall economy
and quality of life due to the growth and jobs it creates along with the services it provides.
Located in New England are:
4 of the Top 10 MBA programs14
10 of the Top 50 NationalUniversities15
13 of the Top 50 and 5 of the Top10 Liberal Arts Colleges16
The Boston-Cambridge-Quincymetropolitan area, had the thirdhighest number of F-1 visa approvalsamong U.S. metropolitan areas in the2008-2012 time period.17
43% of first-time degree/certificateseeking undergraduates attendingNew England institutions came fromout of state.18
The New England Financial Services Industry: Around the Corner and Around the World 4
Report Methodology
For the purposes of this report, the financial services industry is defined as public and private
sector firms and institutions falling under North American Industry Classification System (NAICS)
code 52, “Finance and Insurance.” The report further analyzes the industry in the following three
subsectors, defined as follows:
Key definitions
Asset Management Firms primarily involved in portfolio management, investmentadvice, and trust and fiduciary activities.
Insurance Insurance carriers and insurance agencies and brokerages.
Banking Monetary authorities and firms primarily involved in depositorycredit banking (i.e. commercial banking, savings institutions, andcredit unions), nondepository services (i.e. credit card issuing,sales financing, and consumer lending), mortgage and loanbrokering, investment banking and securities dealing, andsecurities exchanges.19
Note that to the extent that a firm offers funds which hold real estate securities, these would be
captured in the asset management category. Real estate firms which actively manage a portfolio
of real estate assets as well as real estate investment trusts (REITs) are not within the scope of
this report.
Also note that the classification of firms who perform activities across multiple subsectors are
classified based on the primary activity performed at the office addresses of the firms. This
approach allows the activities of a single firm to be captured across multiple subsectors.
In describing the economic impact of the financial services industry through its employment and
purchases of goods and services, this report considers three separate channels – the direct
impact, the indirect impact, and the induced impact – that in aggregate provide a measure of the
total economic impact of the financial services industry to the region. The direct, indirect, and
induced impacts are captured for jobs, labor income, value added, and output to further measure
the impact the industry has to the region. These measures are defined as follows:
Key definitions
Jobs The total number of people employed in a given industry.20
Labor Income Cash wages and salaries and benefits.21 Throughout this report,labor income will be referred to as wages for ease of reference.
Value Added Employee compensation, proprietors’ income, income to capitalowners from property, and taxes on production and imports. Thevalue added of a particular industry excludes the value ofintermediate inputs, for example the value added of the investmentbanking industry would exclude the value of purchased computersand software used for trading. The U.S. gross domestic product(GDP) is the sum of value added across all industries, and thus thevalue added of an industry can be thought of as the industry’scontribution to GDP.

The New England Financial Services Industry: Around the Corner and Around the World 5
Output The total value of sales, including the value of intermediate goods.For example, the output of the investment banking industry wouldinclude the value of purchased computers and software that arereflected in the cost of doing business for investment firms.
Direct Impact Jobs, labor income, value added, and output within the financialservices industry.22 To the extent an employee is determined to beemployed by a financial services firm, they are included within thecategory. For example, an individual in an administrative role at anasset management firm would be considered in the direct category.
Indirect Impact Jobs, labor income, value added, and output occurring throughoutthe supply chain of the financial services industry.23 For example,the indirect impact would capture an advertising firm hired by afinancial services company to design an ad campaign.
Induced Impact Jobs, labor income, value added, and output resulting fromhousehold spending of wages earned either directly or indirectlyfrom the financial services industry’s spending.24 For example, theinduced impact would capture the jobs and wages of the local delifrequented by financial services industry employees at lunch.
Jobs and associated wages are captured for all employees of firms in the financial services
industries, not just employment and wages for financial services occupations. For more detailed
information on methodology, see Appendix A.
The New England Financial Services Industry: Around the Corner and Around the World 6
Economic Impacts of the Financial ServicesIndustry
New England Employment
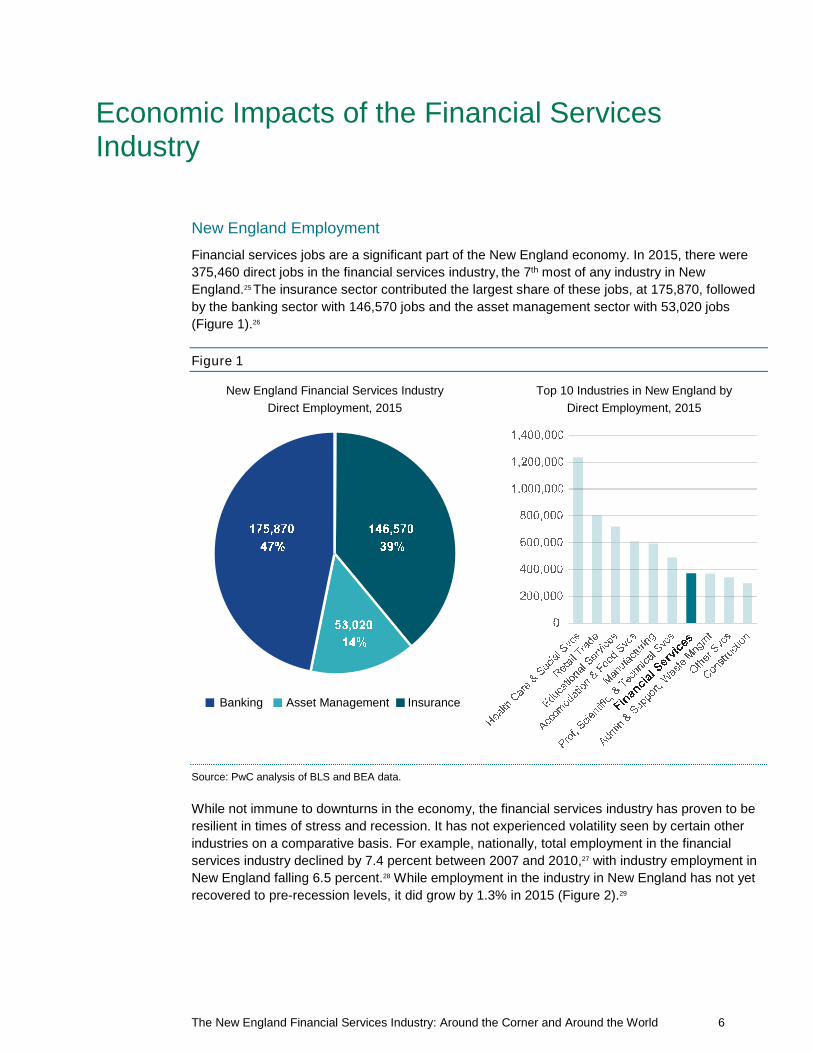
Financial services jobs are a significant part of the New England economy. In 2015, there were
375,460 direct jobs in the financial services industry, the 7th most of any industry in New
England.25 The insurance sector contributed the largest share of these jobs, at 175,870, followed
by the banking sector with 146,570 jobs and the asset management sector with 53,020 jobs
(Figure 1).26
Figure 1
New England Financial Services Industry
Direct Employment, 2015
Banking Asset Management Insurance
Top 10 Industries in New England by
Direct Employment, 2015
Source: PwC analysis of BLS and BEA data.
While not immune to downturns in the economy, the financial services industry has proven to be
resilient in times of stress and recession. It has not experienced volatility seen by certain other
industries on a comparative basis. For example, nationally, total employment in the financial
services industry declined by 7.4 percent between 2007 and 2010,27 with industry employment in
New England falling 6.5 percent.28 While employment in the industry in New England has not yet
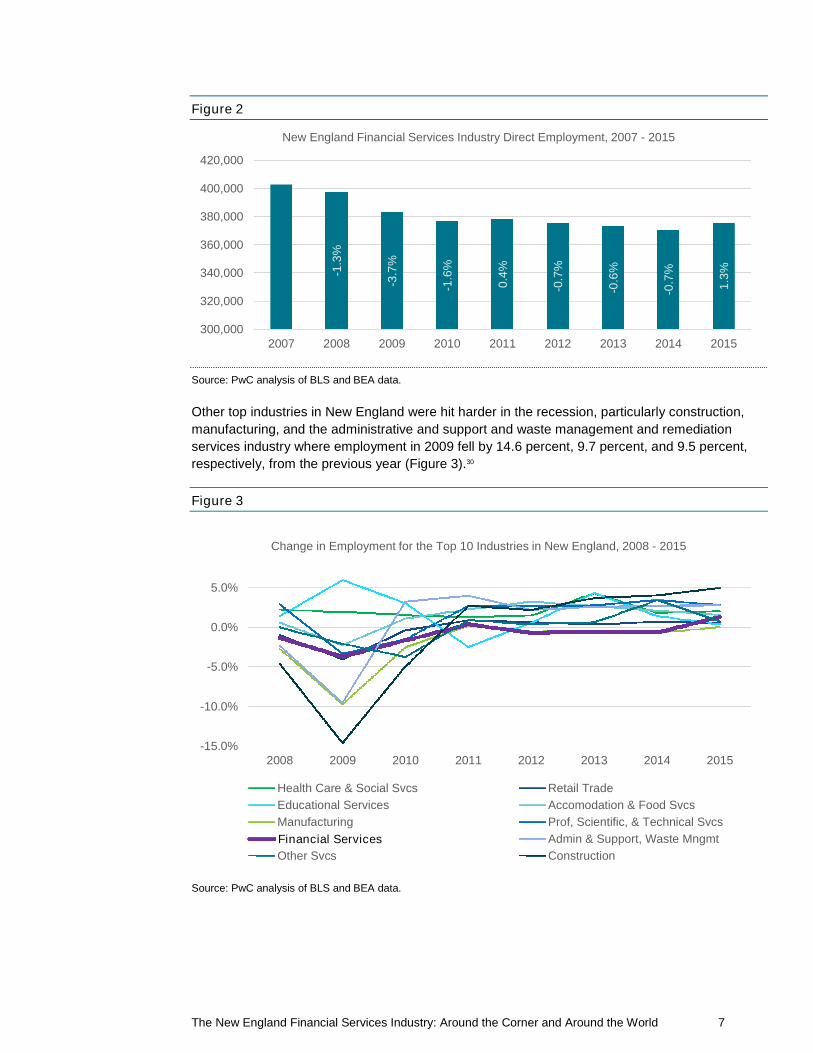
recovered to pre-recession levels, it did grow by 1.3% in 2015 (Figure 2).29
The New England Financial Services Industry: Around the Corner and Around the World 7
Figure 2
Source: PwC analysis of BLS and BEA data.
Other top industries in New England were hit harder in the recession, particularly construction,
manufacturing, and the administrative and support and waste management and remediation
services industry where employment in 2009 fell by 14.6 percent, 9.7 percent, and 9.5 percent,
respectively, from the previous year (Figure 3).30
Figure 3
Source: PwC analysis of BLS and BEA data.
-1.3
%
-3.7
%
-1.6
%
0.4
%
-0.7
%
-0.6
%
-0.7
%
1.3
%
300,000
320,000
340,000
360,000
380,000
400,000
420,000
2007 2008 2009 2010 2011 2012 2013 2014 2015
New England Financial Services Industry Direct Employment, 2007 - 2015
-15.0%
-10.0%
-5.0%
0.0%
5.0%
2008 2009 2010 2011 2012 2013 2014 2015
Change in Employment for the Top 10 Industries in New England, 2008 - 2015
Health Care & Social Svcs Retail Trade
Educational Services Accomodation & Food Svcs
Manufacturing Prof, Scientific, & Technical Svcs
Financial Services Admin & Support, Waste Mngmt
Other Svcs Construction
Financial Services
The New England Financial Services Industry: Around the Corner and Around the World 8
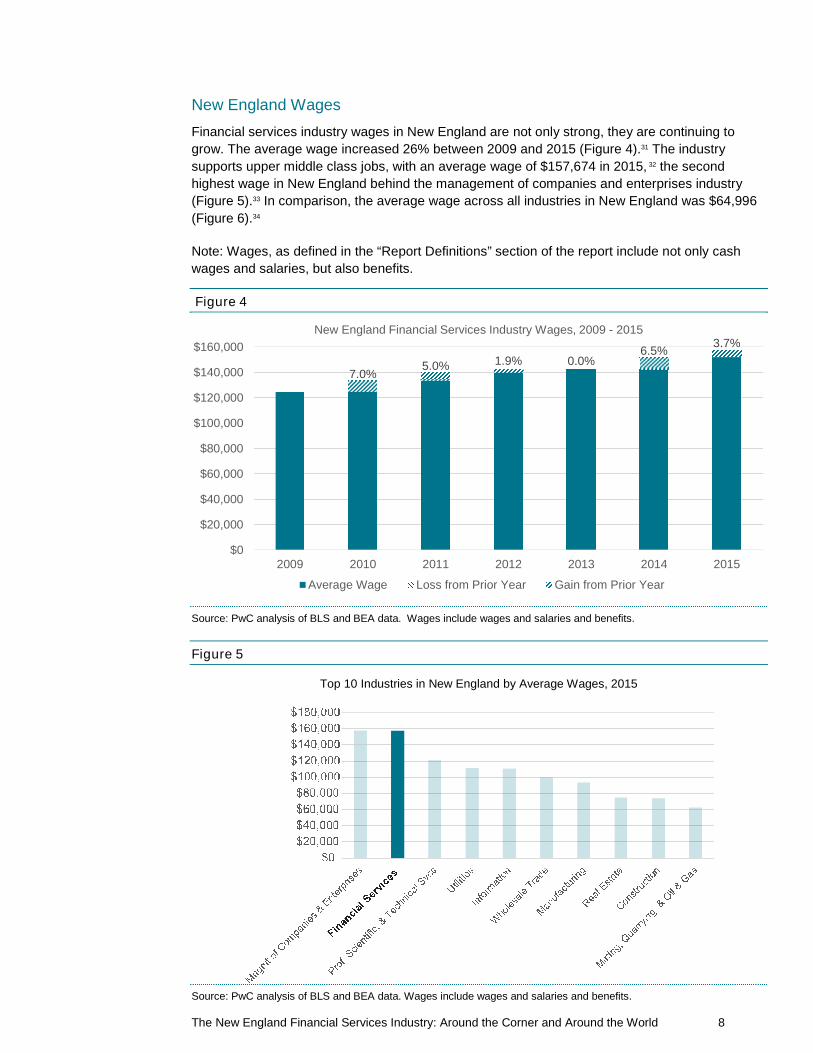
New England Wages
Financial services industry wages in New England are not only strong, they are continuing to
grow. The average wage increased 26% between 2009 and 2015 (Figure 4).31 The industry
supports upper middle class jobs, with an average wage of $157,674 in 2015, 32 the second
highest wage in New England behind the management of companies and enterprises industry
(Figure 5).33 In comparison, the average wage across all industries in New England was $64,996
(Figure 6).34
Note: Wages, as defined in the “Report Definitions” section of the report include not only cash
wages and salaries, but also benefits.
Figure 4
Source: PwC analysis of BLS and BEA data. Wages include wages and salaries and benefits.
Figure 5
Top 10 Industries in New England by Average Wages, 2015
Source: PwC analysis of BLS and BEA data. Wages include wages and salaries and benefits.
0.0%7.0%
5.0% 1.9%6.5%
3.7%
$0
$20,000
$40,000
$60,000
$80,000
$100,000
$120,000
$140,000
$160,000
2009 2010 2011 2012 2013 2014 2015
New England Financial Services Industry Wages, 2009 - 2015
Average Wage Loss from Prior Year Gain from Prior Year
The New England Financial Services Industry: Around the Corner and Around the World 9
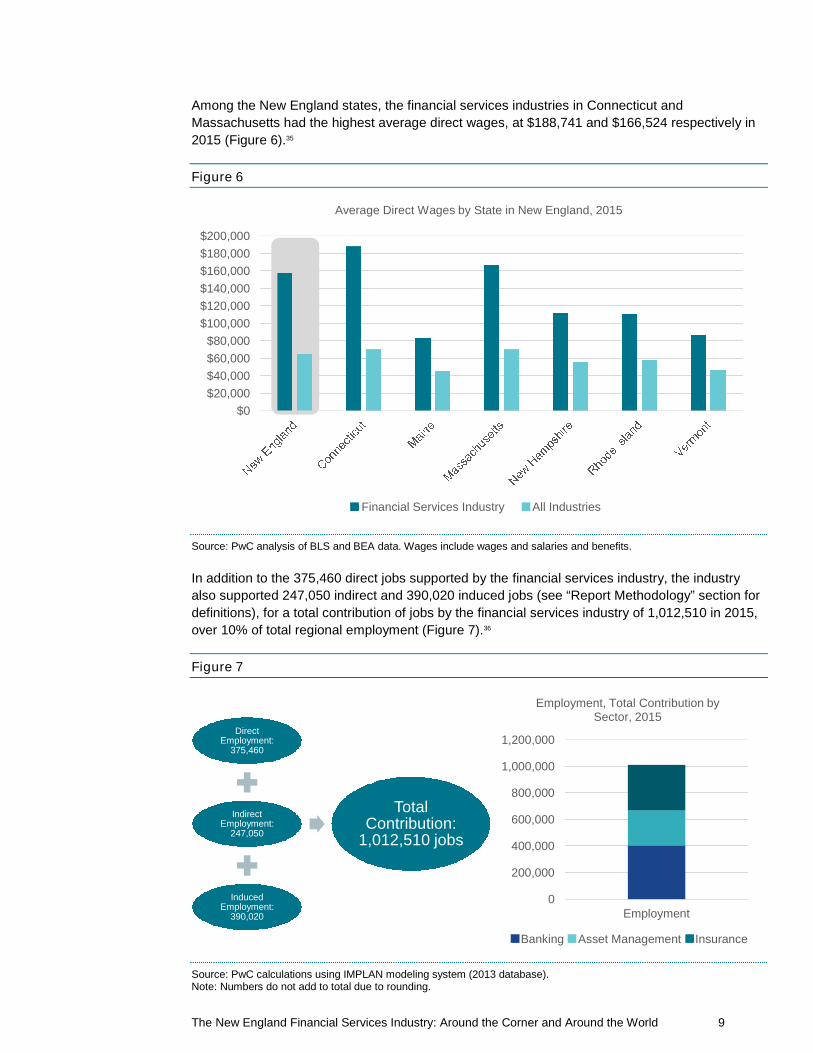
Among the New England states, the financial services industries in Connecticut and
Massachusetts had the highest average direct wages, at $188,741 and $166,524 respectively in
2015 (Figure 6).35
Figure 6
Source: PwC analysis of BLS and BEA data. Wages include wages and salaries and benefits.
In addition to the 375,460 direct jobs supported by the financial services industry, the industry
also supported 247,050 indirect and 390,020 induced jobs (see “Report Methodology” section for
definitions), for a total contribution of jobs by the financial services industry of 1,012,510 in 2015,
over 10% of total regional employment (Figure 7).36
Figure 7
Source: PwC calculations using IMPLAN modeling system (2013 database).Note: Numbers do not add to total due to rounding.
$0
$20,000
$40,000
$60,000
$80,000
$100,000
$120,000
$140,000
$160,000
$180,000
$200,000
Average Direct Wages by State in New England, 2015
Financial Services Industry All Industries
DirectEmployment:
375,460
IndirectEmployment:
247,050
InducedEmployment:
390,020
TotalContribution:
1,012,510 jobs
0
200,000
400,000
600,000
800,000
1,000,000
1,200,000
Employment
Employment, Total Contribution bySector, 2015
Banking Asset Management Insurance
The New England Financial Services Industry: Around the Corner and Around the World 10
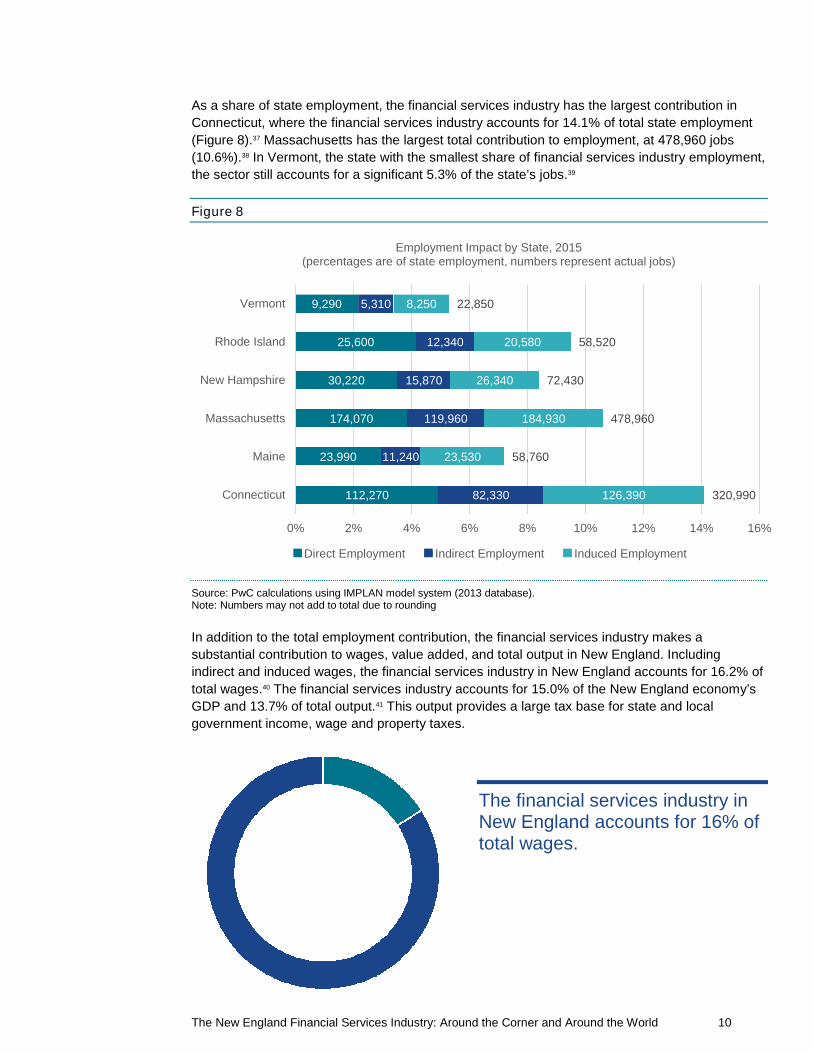
As a share of state employment, the financial services industry has the largest contribution in
Connecticut, where the financial services industry accounts for 14.1% of total state employment
(Figure 8).37 Massachusetts has the largest total contribution to employment, at 478,960 jobs
(10.6%).38 In Vermont, the state with the smallest share of financial services industry employment,
the sector still accounts for a significant 5.3% of the state’s jobs.39
Figure 8
Source: PwC calculations using IMPLAN model system (2013 database).Note: Numbers may not add to total due to rounding
In addition to the total employment contribution, the financial services industry makes a
substantial contribution to wages, value added, and total output in New England. Including
indirect and induced wages, the financial services industry in New England accounts for 16.2% of
total wages.40 The financial services industry accounts for 15.0% of the New England economy’s
GDP and 13.7% of total output.41 This output provides a large tax base for state and local
government income, wage and property taxes.
The financial services industry inNew England accounts for 16% oftotal wages.
112,270
23,990
174,070
30,220
25,600
9,290
82,330
11,240
119,960
15,870
12,340
5,310
126,390
23,530
184,930
26,340
20,580
8,250
320,990
58,760
478,960
72,430
58,520
22,850
0% 2% 4% 6% 8% 10% 12% 14% 16%
Connecticut
Maine
Massachusetts
New Hampshire
Rhode Island
Vermont
Employment Impact by State, 2015(percentages are of state employment, numbers represent actual jobs)
Direct Employment Indirect Employment Induced Employment

The New England Financial Services Industry: Around the Corner and Around the World 11
Sector Spotlights
Banking
In 2015, New England was home to 3,951 bank branches and 1,200 credit union branches,
keeping a combined $643 billion in deposits.42 In 2015, banks in New England originated over
$133 billion in residential mortgages and home loans, and supported small businesses in the
economy with $11.7 billion in small business loans.43 New England credit unions originated nearly
$23 billion in first mortgage loans in 2015.44 New England credit unions are key drivers of growth
for small businesses, with over $1 billion in small business loans originated in 201545 and
approximately $3.5 billion in small business loans outstanding.46 New England credit unions spent
an estimated $543 million on small business related goods and services in 2015.47
In addition to their roles in stimulating the New England economy through loans and jobs, banks
and credit unions in the New England region have distinguished themselves nationally by
emphasizing the quality of their assets. Several New England states rate highly across banking
sub-industries in quality measuring metrics such as noncurrent loans and nonperforming assets.48
New England’s CreditUnions
Credit unions are not-for-
profit financial cooperatives
that are governed by a board
of directors, elected by and
from the credit union’s
membership. They are a key
part of the financial services
ecosystem in communities
across New England.
According to the most recent data from the National Credit Union
Administration’s (NCUA) Credit Union Call Report, as of June 30, 2016,
credit unions boasted the following statistics:
No. of Credit
Unions
Total
Assets
No. of
Memberships
Connecticut 107 $9.9 billion 855,000
Maine 58 $7.0 billion 679,000
Massachusetts 174 $35.0 billion 2,700,000
New Hampshire 18 $7.2 billion 620,000
Rhode Island 20 $5.6 billion 362,000
Vermont 21 $3.9 billion 348,000
TOTAL 398 $68.6 billion 5,564,000
Highlights include:
Commercial bank activity in five of the six New England states ranks in the top half ofstates nationally in noncurrent loan and nonperforming asset quality metrics.49
Massachusetts commercial banks perform particularly well by having the lowestpercentage of nonperforming assets and second lowest percentage of noncurrent loansnationally.50 Vermont has the fifth lowest percentage of noncurrent loans.51
The New England Financial Services Industry: Around the Corner and Around the World 12
Similarly, noncurrent loan ratios for credit unions in five of the six New England states arebelow the savings bank and credit union national ratios, indicating above average loanquality versus comparable institutions in other parts of the country.52 New Hampshireleads the way for credit unions, ranking #1 nationally in this metric, with Rhode Islandalso placing in the top ten.53
Net charge offs – a measure of debt owed that is unlikely to be recovered over averageloans – is another important loan quality and risk management metric used by banks andcredit unions. Similar to noncurrent loans and nonperforming assets, this ratio for creditunions in each New England state indicated higher quality than the national average.Rhode Island is #1 nationally in this metric with Massachusetts (#4), New Hampshire(#8), and Maine (#10) also rated in the top ten.54
All six states have noncurrent loan ratios that better the national ratio for savings andloan associations.55
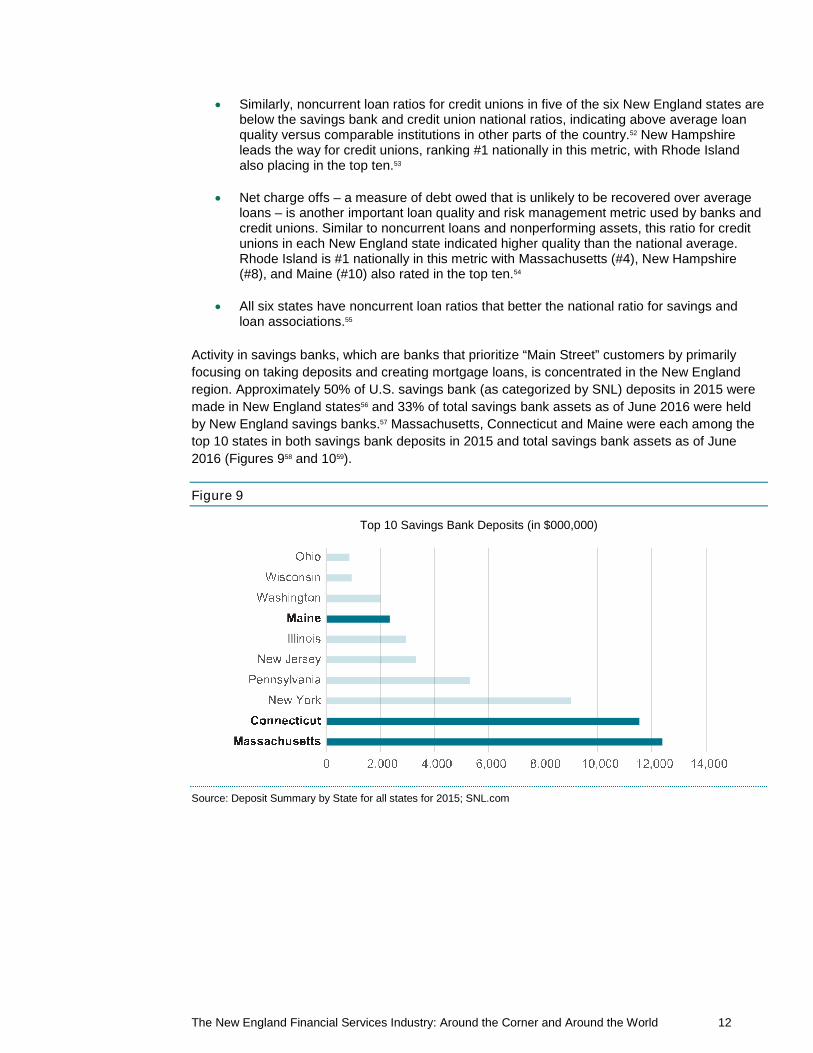
Activity in savings banks, which are banks that prioritize “Main Street” customers by primarily
focusing on taking deposits and creating mortgage loans, is concentrated in the New England
region. Approximately 50% of U.S. savings bank (as categorized by SNL) deposits in 2015 were
made in New England states56 and 33% of total savings bank assets as of June 2016 were held
by New England savings banks.57 Massachusetts, Connecticut and Maine were each among the
top 10 states in both savings bank deposits in 2015 and total savings bank assets as of June
2016 (Figures 958 and 1059).
Figure 9
Top 10 Savings Bank Deposits (in $000,000)
Source: Deposit Summary by State for all states for 2015; SNL.com

The New England Financial Services Industry: Around the Corner and Around the World 13
Figure 10
Top 10 Savings Bank Total Assets (in $000,000)
Source: U.S. Banking Industry Aggregates (and by state) for 06/16 Q; SNL.com
In addition to the prominence of savings banks in Maine, Maine-based credit unions are ranked
fifth nationally in net interest margin,60 a performance and profitability metric that measures the
difference between interest income generated and the amount of interest paid out to lenders.
Rhode Island ranks second nationally in this same metric in the savings and loan association
sub-industry.61
CommunityReinvestment Actlending in New England
The Community Reinvestment Act
(“CRA”), enacted in 1977, is intended
to encourage depository institutions
to help meet the credit needs of the
communities in which they operate,
including low and moderate income
neighborhoods, consistent with safe
and sound banking operations.
Depository institutions in the six New
England States play an active role in
meeting the objectives of the CRA by
providing credit across various
segments of the borrower population,
serving individuals and small
businesses.
As shown in the graphic below, over the last three years, New England
depository institutions originated more than $41.2 billion in CRA loans,62
providing much needed financing in the served areas:
$-
$1,000,000
$2,000,000
$3,000,000
$4,000,000
$5,000,000
$6,000,000
Loan Amount atOrigination <=
$100,000
Loan Amount atOrigination =>
$100,000 but <=$250,000
Loan Amount atOrigination =>
$250,000
Loans to SmallBusinesses(<=$1.0Mrevenue)
CRA Loan Originations (in $000)
2013 2014 2015
The New England Financial Services Industry: Around the Corner and Around the World 14
Asset Management
New England is an asset management leader, accounting for 11.5% of the nation’s direct asset
management employment in 2015.63 In 2014, hedge funds located in Connecticut and
Massachusetts combined to account for 28% of assets under management (“AUM”) of the top 50
hedge funds, second only to New York.64 The New England region is home to 457 private equity
firms.65 Private equity firms provide capital to early stage businesses including FinTech startups.
As of December 2015, Massachusetts-based mutual funds had $2.8 trillion in AUM, a full 17.2%
of all AUM nationwide and the 4th highest state total in the U.S.66
Massachusetts’ role in the asset management space also crosses into other financial products.
Six of the top 50 hedge fund firms in 2014 in terms of AUM were located in Massachusetts and
had more than $100 billion in AUM combined, nearly 10% of the cumulative top 50 hedge fund
firms.67 Nearly 19% of exchange-traded fund AUM were in Massachusetts as of December 2015,68
and Massachusetts is home to 283 private equity firms, the third most in the country behind New
York and California, including two of the top 10 private equity firms in terms of total funds raised
over the last ten years.69
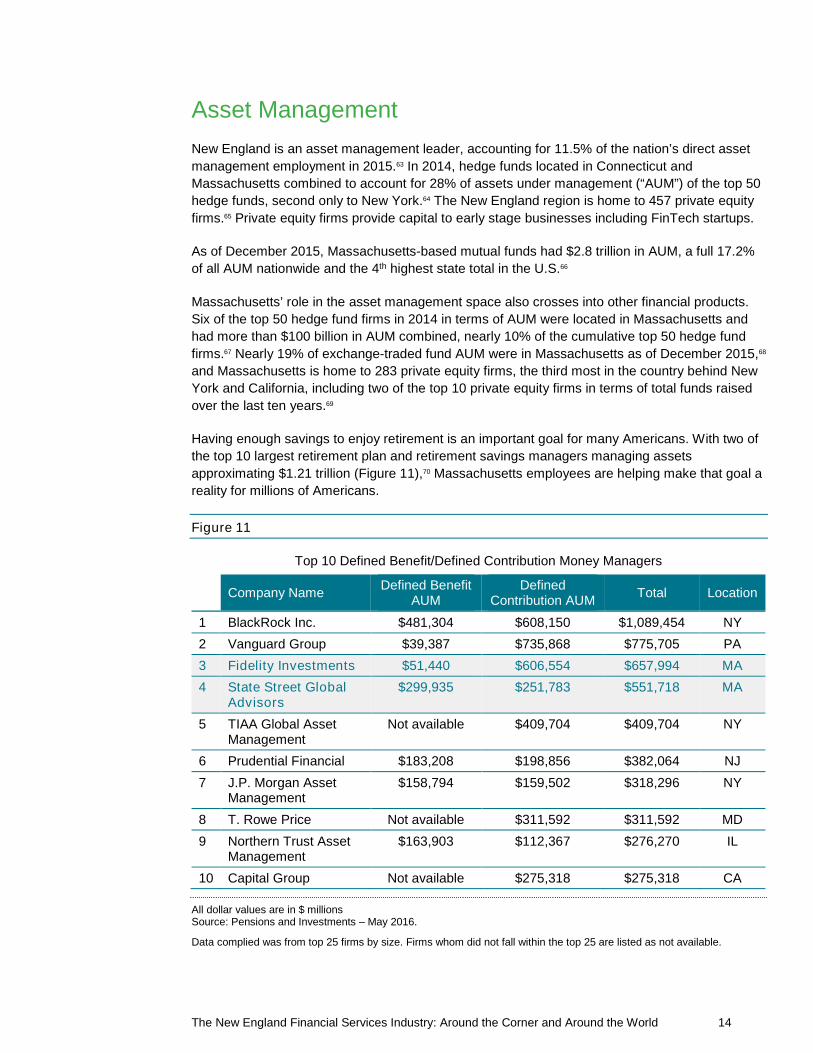
Having enough savings to enjoy retirement is an important goal for many Americans. With two of
the top 10 largest retirement plan and retirement savings managers managing assets
approximating $1.21 trillion (Figure 11),70 Massachusetts employees are helping make that goal a
reality for millions of Americans.
Figure 11
Top 10 Defined Benefit/Defined Contribution Money Managers
Company NameDefined Benefit
AUMDefined
Contribution AUMTotal Location
1 BlackRock Inc. $481,304 $608,150 $1,089,454 NY
2 Vanguard Group $39,387 $735,868 $775,705 PA
3 Fidelity Investments $51,440 $606,554 $657,994 MA
4 State Street GlobalAdvisors
$299,935 $251,783 $551,718 MA
5 TIAA Global AssetManagement
Not available $409,704 $409,704 NY
6 Prudential Financial $183,208 $198,856 $382,064 NJ
7 J.P. Morgan AssetManagement
$158,794 $159,502 $318,296 NY
8 T. Rowe Price Not available $311,592 $311,592 MD
9 Northern Trust AssetManagement
$163,903 $112,367 $276,270 IL
10 Capital Group Not available $275,318 $275,318 CA
All dollar values are in $ millionsSource: Pensions and Investments – May 2016.
Data complied was from top 25 firms by size. Firms whom did not fall within the top 25 are listed as not available.
The New England Financial Services Industry: Around the Corner and Around the World 15
Connecticut is also a large player in the asset management sector. The state was in the nation’s
top 10 in terms of number of private equity deals, number of private equity firms, and the total
value of equity invested for the previous five years ended 2015.71 The state was also in the
nation’s top 10 in total assets of mutual funds.72 Several of the largest hedge funds and private
equity firms are domiciled in Connecticut. Of the top 50 hedge funds in 2014, as measured by
AUM, Connecticut was home to 18.6% of the AUM, the second most in the U.S.73 Connecticut
ranks 5th in the U.S. in the number of private equity firms located in the state, and fourth in the
aggregate capital raised by those firms over the last 10 years.74
Rhode Island barely missed the top 10, coming in at number 11 in the country in terms of total
value of private equity invested for the previous five years ended 2015.75

The New England Financial Services Industry: Around the Corner and Around the World 16
Insurance
Several states in New England are national hubs for the insurance industry and all New England
states are meaningfully impacted by the insurance industry. New England is home to 11.5% of
actuaries in the U.S.,76 and the region also accounts for 6.9% of all people directly employed in
the insurance industry in the nation.77
Connecticut is a national leader in the insurance sector. Approximately 9% of life and health and
property and casualty insurers are companies chartered, incorporated, organized or constituted in
Connecticut.78 The top 20 life and health insurers operating in Connecticut wrote direct premiums
totaling nearly $11 billion and had admitted assets of $449 billion in 2014.79 The top 20 property
and casualty insurers operating in Connecticut wrote direct premiums totaling approximately $1
billion and had admitted assets of $131 billion in 2014.80 Not surprisingly, Connecticut also leads
the nation in actuaries as a percentage of total state employment while Rhode Island ranks third.81
Connecticut ranks first in the U.S. in insurance carrier employment and payroll as a percent of
state totals (Figure 12).82 New Hampshire, Massachusetts and Rhode Island are also highly
ranked in these insurance carrier payroll and employment measures (Figure 12).83
Figure 12
Source: CERC calculation of Moody’s Analytics data. NAICS 5241. August 2016
The New England Financial Services Industry: Around the Corner and Around the World 17
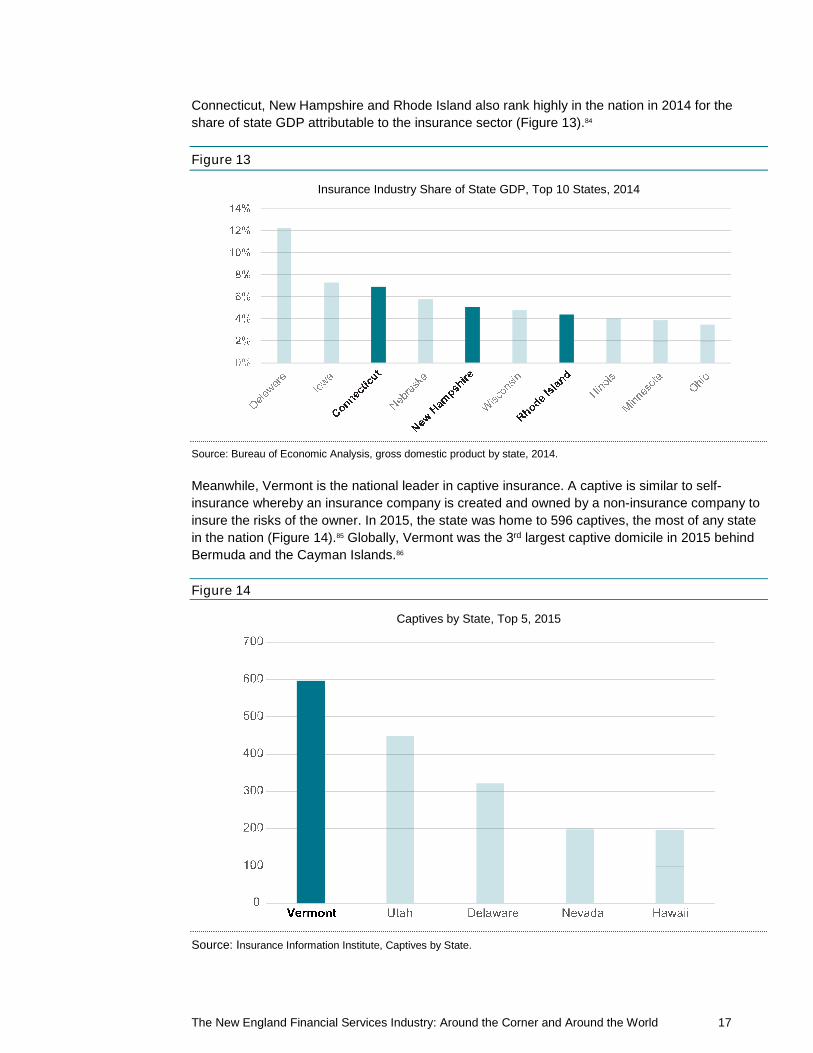
Connecticut, New Hampshire and Rhode Island also rank highly in the nation in 2014 for the
share of state GDP attributable to the insurance sector (Figure 13).84
Figure 13
Insurance Industry Share of State GDP, Top 10 States, 2014
Source: Bureau of Economic Analysis, gross domestic product by state, 2014.
Meanwhile, Vermont is the national leader in captive insurance. A captive is similar to self-
insurance whereby an insurance company is created and owned by a non-insurance company to
insure the risks of the owner. In 2015, the state was home to 596 captives, the most of any state
in the nation (Figure 14).85 Globally, Vermont was the 3rd largest captive domicile in 2015 behind
Bermuda and the Cayman Islands.86
Figure 14
Captives by State, Top 5, 2015
Source: Insurance Information Institute, Captives by State.

The New England Financial Services Industry: Around the Corner and Around the World 18
State Spotlights
Connecticut
Quick Facts, 2015
Source: PwC analysis of BLS and BEA data. IMPLAN model (2013 database). Wages (as defined, see “ReportMethodology”) include wages and salaries and benefits.
Financial services in Connecticut tops the New England region in having the largest impact on the
state and its economy. The total employment contribution of the financial services industry in
Connecticut accounted for 14.1% of all state employment in 2015.87 The total wage contribution of
$35.1 billion represents nearly 22% of all wages paid in the state in 2015. The financial services
industry’s total contribution to Connecticut’s GDP, or value added, is nearly 20%.88
State Highlights
In Connecticut the financial services
industry accounted for 14.1% of all
state employment in 2015.
Connecticut is the national leader in
Insurance for payroll and
employment.
6 of the top 20 life and health
insurers by direct written premiums
are located in Connecticut.
The New England Financial Services Industry: Around the Corner and Around the World 19
Connecticut Insurance & Education
Over the last decade, Travelers and the Travelers Foundation have contributed more than $200
million toward programs and organizations that support academic and career success, develop
thriving neighborhoods and create culturally enriched communities.
In 2007, Travelers launched a new initiative, Travelers EDGE® (Empowering Dreams for
Graduation and Employment), to help increase the number of underrepresented students who
complete bachelor’s degrees in preparation for a career at Travelers or within the insurance and
financial services industry. Through partnerships with colleges, universities and community-based
organizations, the program helps students progress from middle to high school to post-secondary
education, with a growing emphasis on awareness of career opportunities in the insurance
industry. Once enrolled in college, Travelers EDGE scholars benefit from a broad range of
services, including financial support, mentor relationships with Travelers employees, internships,
job shadow opportunities and professional development workshops.
Over the last 10 years, nearly 160 college students have benefitted from Travelers EDGE in
Connecticut alone. In its locations across the country, the program has helped about 400 college
students and provided more than $6 million in scholarships.
“Travelers EDGE enabled me to continue my education and earn a bachelor’s degree,” said
Melissa Rodriguez, one of the program’s first participants, who now works as a business analyst
at Travelers. “I was the first in my family to graduate from college, so it was a major
accomplishment not only for me, but for my entire family.”
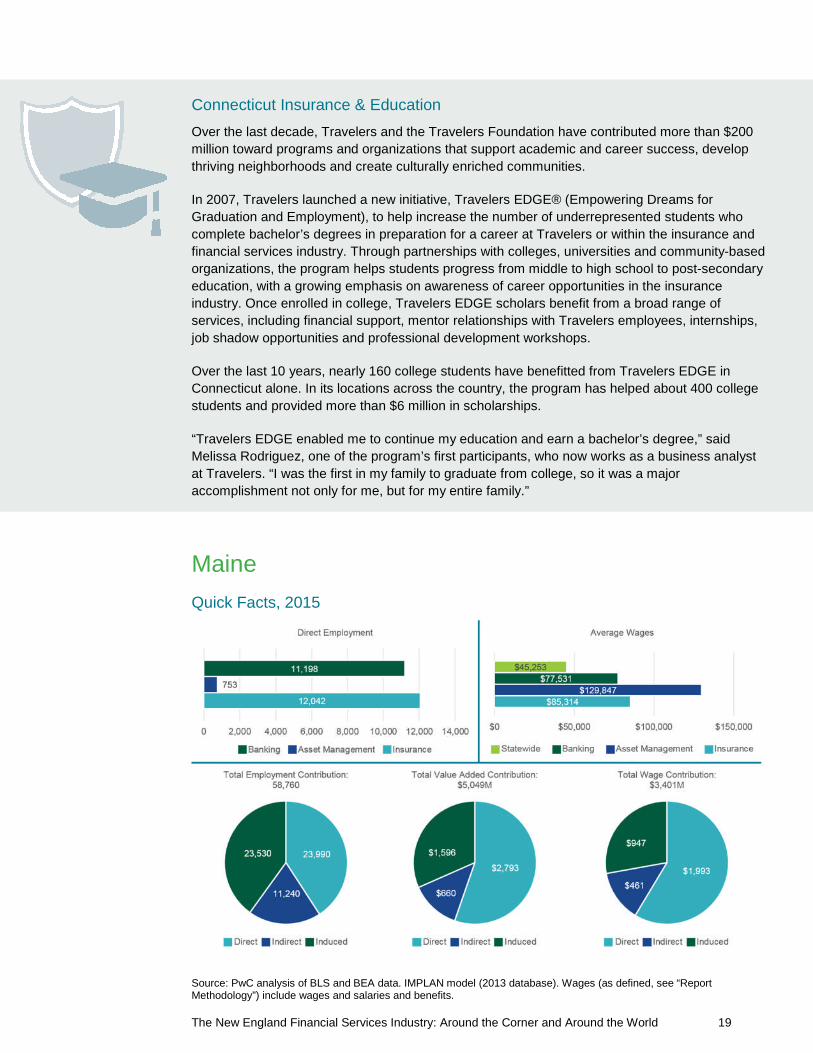
Maine
Quick Facts, 2015
Source: PwC analysis of BLS and BEA data. IMPLAN model (2013 database). Wages (as defined, see “ReportMethodology”) include wages and salaries and benefits.
The New England Financial Services Industry: Around the Corner and Around the World 20
When direct, indirect, and induced employment are combined, total financial services industry
employment in Maine of 58,760 in 2015 accounted for 7.2% of the state’s total jobs.89 The
financial services industry’s impact on Maine wages and value added was even larger,
accounting for 9.2% of total wages and 8.9% of state GDP across all industries in 2015.90
State Highlights
Indirect and direct financialservices employmentaccounted for 7.2% of the jobsin the state of Maine.
Maine is home to 58 creditunions with almost 700,000members.
Maine Banking supporting the local economy
TD Bank understands the important role small businesses play in our local economies, and is
dedicated to helping them grow and be successful. As the No. 3 Small Business Administration
(SBA) lender in Maine by dollar volume and a preferred SBA lender, one way TD does this is by
partnering with the SBA. That partnership formed the foundation of a relationship with Alison
Evans and Chris Fritz of AE Ceramics in Boothbay Harbor and Yarmouth, Maine.
From the age of 14, Alison Evans knew she wanted to be a potter. She began her business, AE
Ceramics, which focused on oyster shell pottery, in 2001. However, it was not until 2005 that she
was able to commit full time. The company grew slowly at first, but in 2012 AE began to
experience higher demands and expanded its product line from bowls to include sinks, lamps,
serving ware, chandeliers and a line of dishes. Around that time her husband Chris Fritz left his
job working for his family lumber business and committed to AE Ceramics full time.
With a need to finance inventory and accounts receivable, TD provided a $30,000 SBA line of
credit. Then things really heated up: in the next three years, AE Ceramics purchased their retail
space in Yarmouth with a commercial mortgage, opened a second store in 2014 in Boothbay with
a second commercial mortgage and along the way increased their line of credit. Today, in
addition to its two retail locations, AE Ceramics sells to wholesalers nationwide and is partnering
with local designers and interior decorators.

The New England Financial Services Industry: Around the Corner and Around the World 21
Massachusetts
Quick Facts, 2015
Source: PwC analysis of BLS and BEA data. IMPLAN model (2013 database). Wages (as defined, see “ReportMethodology”) include wages and salaries and benefits.
State Highlights
Massachusetts is home to thelargest share of assetmanagement employment inNew England.
Average financial serviceswage in Massachusetts was 2.4times average state wagesacross all industries in 2015.
Massachusetts is home of 2 ofthe top 10 private equity firmsin terms of total funds raised inthe past 10 years.
Massachusetts FinTech Curriculum
As financial technology continues to evolve, a critical question hasemerged: how does the industry sustain continued innovation? Part ofthe answer lies in having a prepared and knowledgeable workforce.Given New England’s tremendous network of higher educationinstitutions, it was inevitable that one of these universities would be atrailblazer in getting students ready to succeed in FinTech. TheMassachusetts Institute of Technology (MIT) is now home to the firstgraduate-level course to cover the topic of financial technologyapplications in the United States. The course, entitled FinTechVentures, is the result of a collaboration between the Martin TrustCenter for MIT Entrepreneurship and the Finance Group at the MITSloan School of Management, alongside the MIT Department ofElectrical Engineering and Computer Science and Harvard LawSchool. As FinTech continues to grow, and companies continue toadapt, expect the base of knowledge – and the number of coursesoffered at colleges and universities – to change as well.
The New England Financial Services Industry: Around the Corner and Around the World 22
Massachusetts is a regional leader in the
financial services industry, with the highest
total contribution of employment, total
wages, and value added of the New
England states. The state is also home to
the largest share of asset management
employment in the region, accounting for
60% of direct asset management
employment in New England.91
Massachusetts ranks 4th in the nation for
direct asset management employment.92 In
addition, Massachusetts accounted for 44%
of direct employment in the banking and
insurance sectors in New England in 2015.93
The strong wages paid by the
Massachusetts financial services industry
make a large contribution to the state
economy. The average financial services
wage in 2015 of $166,521 was nearly 2.4
times the average state wage across all
industries.94
Charitable giving inMassachusetts
Financial service firms give back with
meaningful contributions to local communities
of which they are a part. During 2015, a survey
of giving by Massachusetts businesses to
Massachusetts charities highlighted this impact
noting that of participating firms, financial
service firms, based on total contributions
(defined to include both cash and in-kind
contributions) comprised 10 of the top 25 and
22 of the top 50 contributors to state charities.95
The total contributions of these 22 participating
firms were in excess of $100 million, supporting
a wide range of charitable causes throughout
the state.96
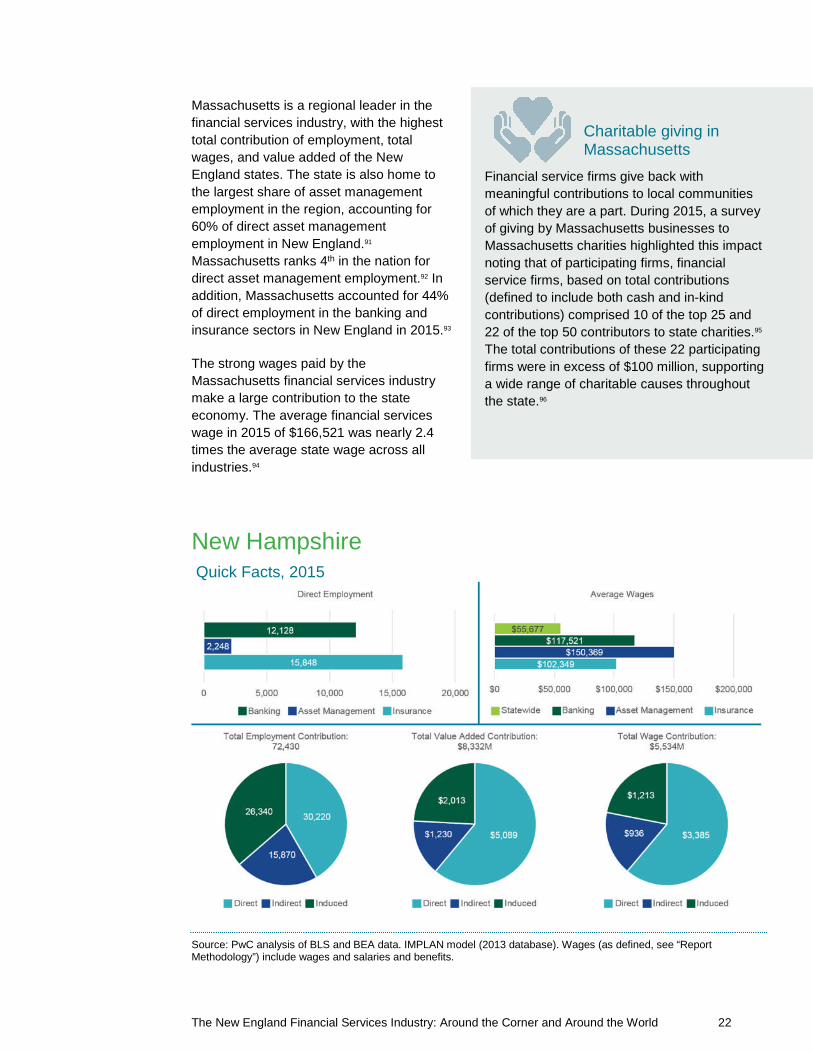
New HampshireQuick Facts, 2015
Source: PwC analysis of BLS and BEA data. IMPLAN model (2013 database). Wages (as defined, see “ReportMethodology”) include wages and salaries and benefits.
The New England Financial Services Industry: Around the Corner and Around the World 23
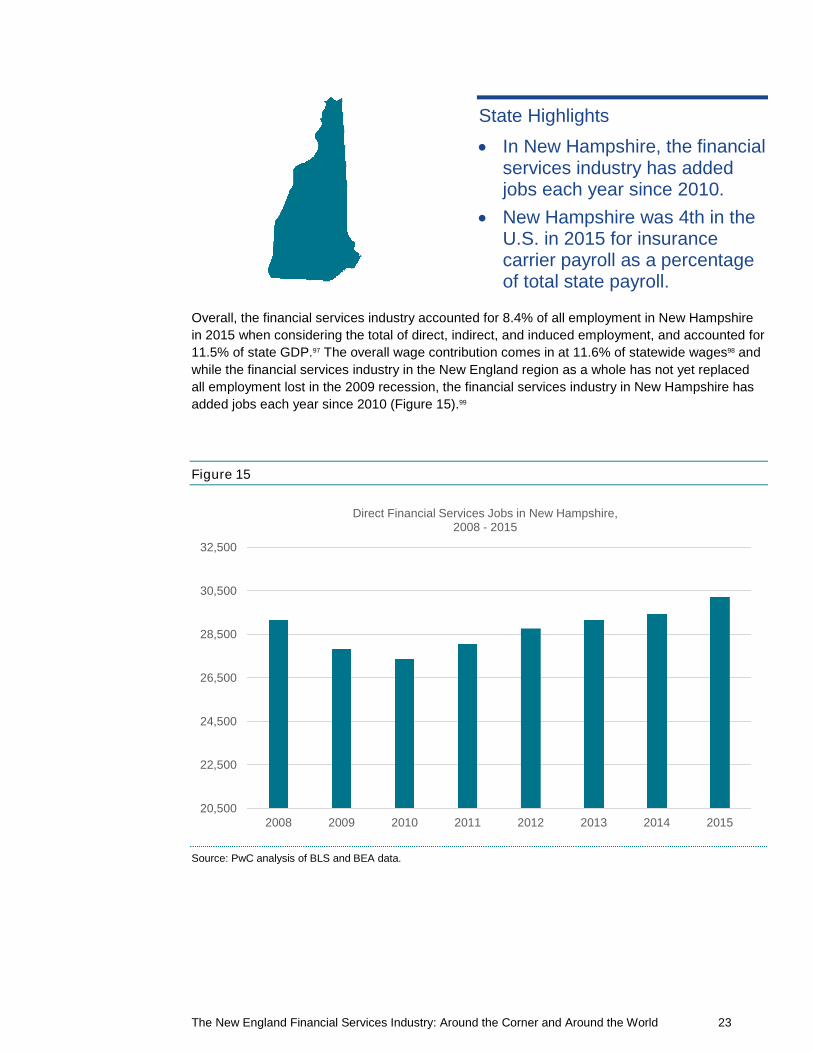
State Highlights
In New Hampshire, the financialservices industry has addedjobs each year since 2010.
New Hampshire was 4th in theU.S. in 2015 for insurancecarrier payroll as a percentageof total state payroll.
Overall, the financial services industry accounted for 8.4% of all employment in New Hampshire
in 2015 when considering the total of direct, indirect, and induced employment, and accounted for
11.5% of state GDP.97 The overall wage contribution comes in at 11.6% of statewide wages98 and
while the financial services industry in the New England region as a whole has not yet replaced
all employment lost in the 2009 recession, the financial services industry in New Hampshire has
added jobs each year since 2010 (Figure 15).99
Figure 15
Source: PwC analysis of BLS and BEA data.
20,500
22,500
24,500
26,500
28,500
30,500
32,500
2008 2009 2010 2011 2012 2013 2014 2015
Direct Financial Services Jobs in New Hampshire,2008 - 2015
The New England Financial Services Industry: Around the Corner and Around the World 24
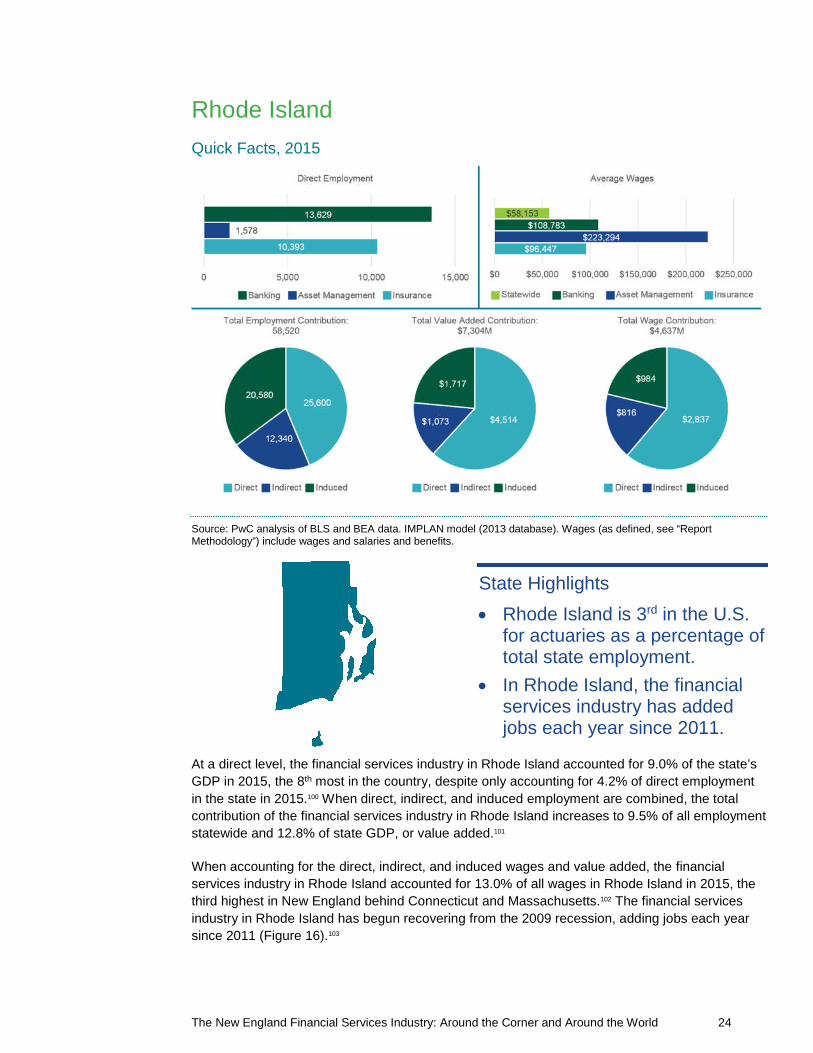
Rhode Island
Quick Facts, 2015
Source: PwC analysis of BLS and BEA data. IMPLAN model (2013 database). Wages (as defined, see “ReportMethodology”) include wages and salaries and benefits.
State Highlights
Rhode Island is 3rd in the U.S.for actuaries as a percentage oftotal state employment.
In Rhode Island, the financialservices industry has addedjobs each year since 2011.
At a direct level, the financial services industry in Rhode Island accounted for 9.0% of the state’s
GDP in 2015, the 8th most in the country, despite only accounting for 4.2% of direct employment
in the state in 2015.100 When direct, indirect, and induced employment are combined, the total
contribution of the financial services industry in Rhode Island increases to 9.5% of all employment
statewide and 12.8% of state GDP, or value added.101
When accounting for the direct, indirect, and induced wages and value added, the financial
services industry in Rhode Island accounted for 13.0% of all wages in Rhode Island in 2015, the
third highest in New England behind Connecticut and Massachusetts.102 The financial services
industry in Rhode Island has begun recovering from the 2009 recession, adding jobs each year
since 2011 (Figure 16).103

The New England Financial Services Industry: Around the Corner and Around the World 25
Figure 16
Source: PwC analysis of BLS and BEA data.
Vermont
Quick Facts, 2015
Source: PwC analysis of BLS and BEA data. IMPLAN model (2013 database). Wages (as defined, see “ReportMethodology”) include wages and salaries and benefits.
20,500
21,500
22,500
23,500
24,500
25,500
26,500
2008 2009 2010 2011 2012 2013 2014 2015
Direct Financial Services Jobs in Rhode Island,2008 - 2015
The New England Financial Services Industry: Around the Corner and Around the World 26
The financial services industry accounted for 5.6% of Vermont’s gross domestic product in
2014.104 When combining direct, indirect, and induced employment, wages, and value added, the
financial services industry in Vermont made up 5.3% of statewide employment, 6.8% of statewide
total wages, and 7.6% of state GDP across all industries.105
State Highlights
Vermont is the 3rd largestcaptive insurance domicile inthe world.
In Vermont, the financialservice industry accounted for6% of the state’s GDP in 2014.
Vermont: A global leader in captive insurance
Captive insurance is a regulated form of self-insurance that has existed since the 1960’s, and has
been a part of the Vermont insurance industry since 1981, when Vermont passed the Special
Insurer Act. Captive insurance companies are formed by companies or groups of companies as a
form of alternative insurance to better manage their own risk. Captives are typically used for
corporate lines of insurance such as property, general liability, products liability, or professional
liability. Growth sectors of the captive insurance industry include professional medical malpractice
coverage for doctors and hospitals, and the continued trend of small and mid-sized companies
forming captive insurance companies.
Vermont’s dedication to excellence has helped attract over 1,000 licensed captive insurance
companies to the State of Vermont, making it third in the world behind Bermuda and the Cayman
Islands. If you measure domiciles by gross written premium, Vermont ranks first world-wide with
$29.8 billion. In 2015, the Vermont captive industry is estimated to have generated $24 million of
premium tax benefits and related fees for Vermont. At last count in an economic study completed
10 years ago, more than 1400 direct and indirect jobs (full and part-time), were created by the
captive industry in Vermont. The captive industry infrastructure that has developed in Vermont
over the past 35 years includes managers, accountants, attorneys, and others, as well as the
Vermont Captive Insurance Association (VCIA), and provides Vermont with a significant
advantage. In fact, Burlington, VT has become a “Center of Excellence” in the captive insurance
industry world-wide.
All of that is the result of several key factors: the foresight of the domicile’s founders, the
consistent commitment of state officials and Vermont legislators to captive insurance, the
expertise and responsiveness of Vermont’s captive regulatory team, an effective and efficient
infrastructure supported by the VCIA, and a strong connection between policymakers and the
industry that creates an environment in which captives can thrive.
The New England Financial Services Industry: Around the Corner and Around the World 27
FinTech
New England has a history of innovation and is well positioned for newopportunities in FinTech
FinTech
The financial services sector continues to evolve with the technological revolution and the rise of
FinTech. As discussed earlier in this report, the current state of the financial services ecosystem
in New England is strong. This interconnectedness and access to the top talent through our
universities is crucial to future success in a technological world. The New England region fosters
a cycle of education and innovation. First was the mutual fund and the ETF in Massachusetts,
then the explosion of captives in Vermont, and now FinTech is the quickly growing phenomenon
that is currently gaining steam across the region.
What is FinTech?
FinTech is a dynamic segment at the intersection of the financial services and technology sectors
where start-ups, new market entrants, and even the traditional big players innovate the products
and services currently provided.
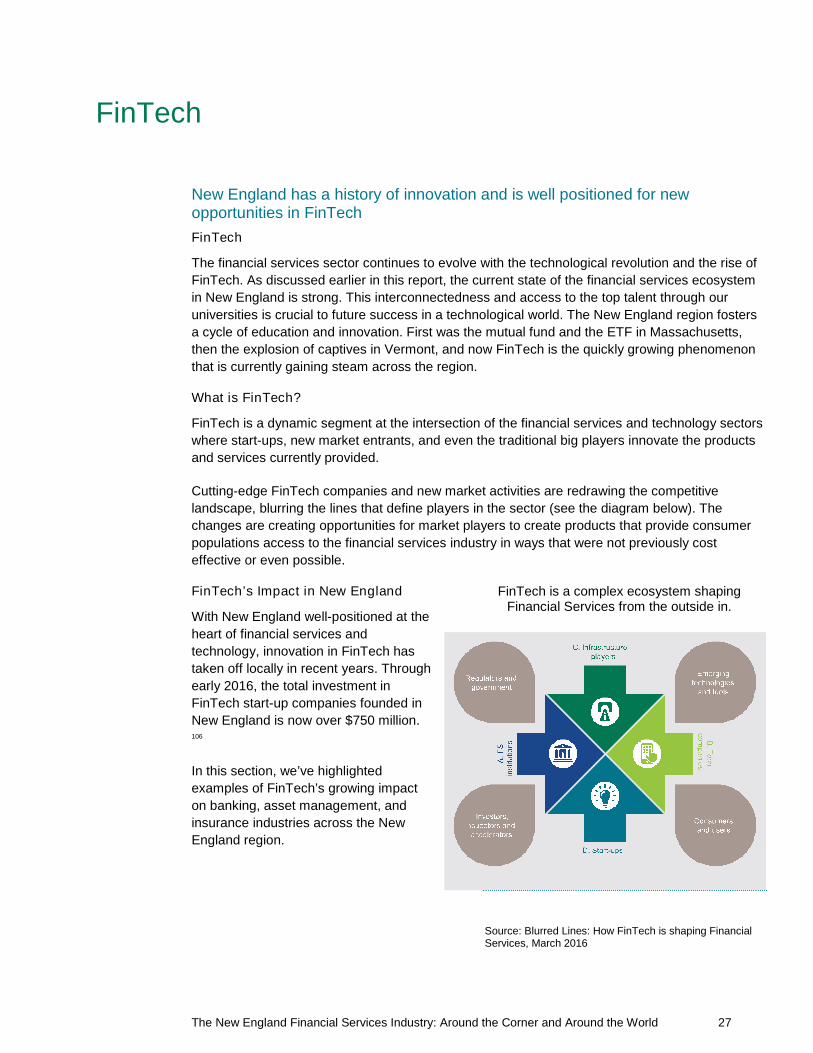
Cutting-edge FinTech companies and new market activities are redrawing the competitive
landscape, blurring the lines that define players in the sector (see the diagram below). The
changes are creating opportunities for market players to create products that provide consumer
populations access to the financial services industry in ways that were not previously cost
effective or even possible.
FinTech’s Impact in New England
With New England well-positioned at the
heart of financial services and
technology, innovation in FinTech has
taken off locally in recent years. Through
early 2016, the total investment in
FinTech start-up companies founded in
New England is now over $750 million.106
In this section, we’ve highlighted
examples of FinTech’s growing impact
on banking, asset management, and
insurance industries across the New
England region.
FinTech is a complex ecosystem shapingFinancial Services from the outside in.
Source: Blurred Lines: How FinTech is shaping FinancialServices, March 2016
The New England Financial Services Industry: Around the Corner and Around the World 28
Asset Management: Spotlight on FinTech
Asset and Wealth Management shifts from technology-enabled human advice to humansupported technology-driven advice
Automated investment advice (i.e. robo-advisors) poses a competitive threat to operators in the
execution-only and self-directed investment market as well as to traditional financial advisors.
However, such capabilities also create an opportunity for these traditional firms to transform their
delivery of advice. Many self-directed firms have responded by hiring, or investing in, talented
employees with both technology and finance experience.
A secondary by-product of automated customer analysis is the lower cost of customer
onboarding, conversion and funding rates. This change in the financial advisory model has
created an opening for wealth managers, who have struggled for years to figure out how to create
profitable relationships with clients in possession of fewer total assets. Robo-advisors provide a
viable solution for this segment and, if positioned correctly as part of a full service offering, can
serve as a segue to full service advice for clients with specific needs or higher touch.
In early 2015, Boston-based Fidelity Investments partnered with Thomson Reuters and
Amazon.com to launch the FinTech Sandbox. The FinTech Sandbox, based in Boston, is an
innovative program that provides free or discounted access to data feeds from partners in the
financial industry to participating FinTech startups. Through its vast network of partners, the
FinTech Sandbox can also provide direct exposure to its partners in the Massachusetts area,
some of the leading financial firms in the world. Different than a typical accelerator or incubator,
the FinTech Sandbox is a non-profit program does not take an equity stake in the companies that
participate. In just over one year since its launch, the FinTech Sandbox has received widespread
attention and is an example of the power of collaboration in the region among startups and legacy
financial firms.
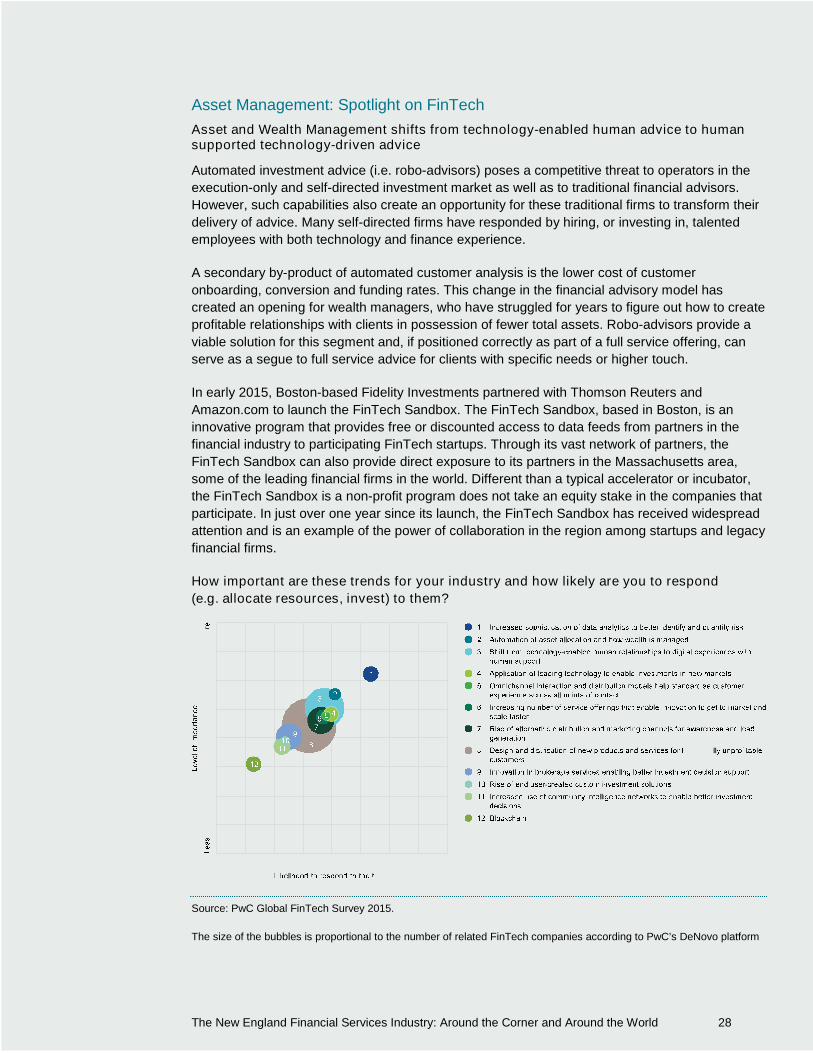
How important are these trends for your industry and how likely are you to respond
(e.g. allocate resources, invest) to them?
Source: PwC Global FinTech Survey 2015.
The size of the bubbles is proportional to the number of related FinTech companies according to PwC’s DeNovo platform
The New England Financial Services Industry: Around the Corner and Around the World 29
Banking: Spotlight on FinTech
Banks move toward a renewed digital customer experience
Banks are moving towards non-physical channels by implementing operational solutions and
developing new methods to reach, engage and retain customers. As they pursue a renewed
digital customer experience, many are engaging in FinTech to provide customer experiences on
par with large tech companies and innovative start-ups.
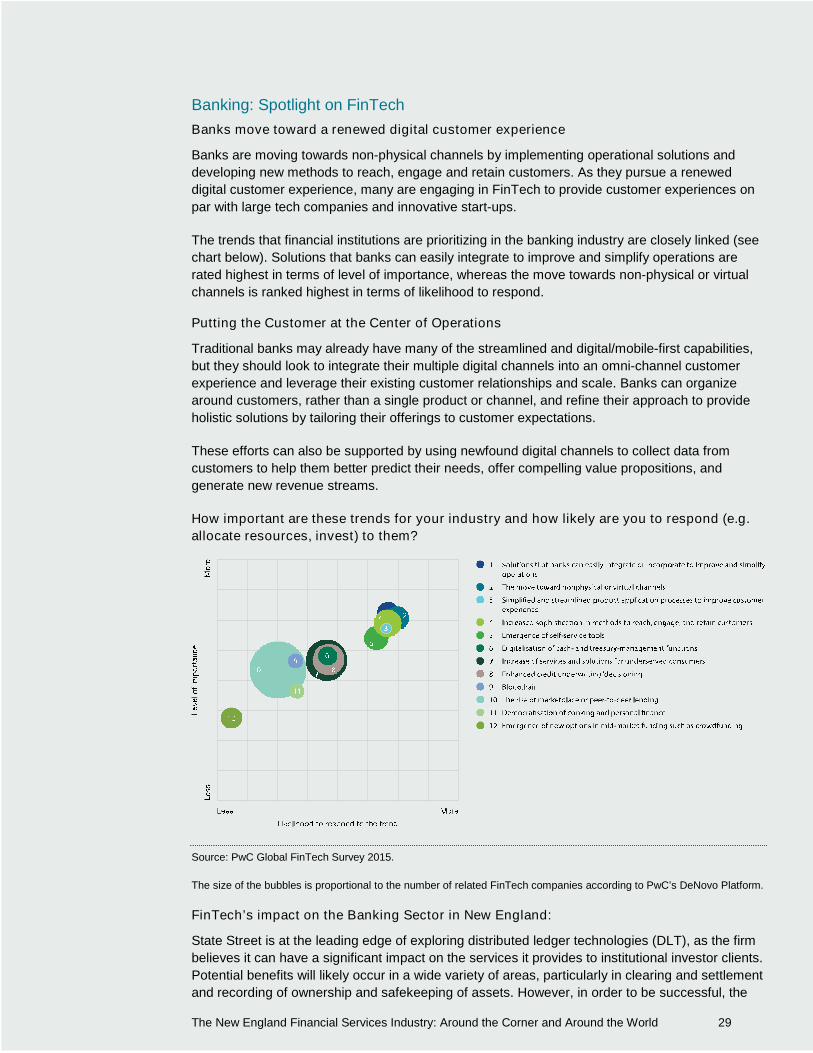
The trends that financial institutions are prioritizing in the banking industry are closely linked (see
chart below). Solutions that banks can easily integrate to improve and simplify operations are
rated highest in terms of level of importance, whereas the move towards non-physical or virtual
channels is ranked highest in terms of likelihood to respond.
Putting the Customer at the Center of Operations
Traditional banks may already have many of the streamlined and digital/mobile-first capabilities,
but they should look to integrate their multiple digital channels into an omni-channel customer
experience and leverage their existing customer relationships and scale. Banks can organize
around customers, rather than a single product or channel, and refine their approach to provide
holistic solutions by tailoring their offerings to customer expectations.
These efforts can also be supported by using newfound digital channels to collect data from
customers to help them better predict their needs, offer compelling value propositions, and
generate new revenue streams.
How important are these trends for your industry and how likely are you to respond (e.g.
allocate resources, invest) to them?
Source: PwC Global FinTech Survey 2015.
The size of the bubbles is proportional to the number of related FinTech companies according to PwC’s DeNovo Platform.
FinTech’s impact on the Banking Sector in New England:
State Street is at the leading edge of exploring distributed ledger technologies (DLT), as the firm
believes it can have a significant impact on the services it provides to institutional investor clients.
Potential benefits will likely occur in a wide variety of areas, particularly in clearing and settlement
and recording of ownership and safekeeping of assets. However, in order to be successful, the
The New England Financial Services Industry: Around the Corner and Around the World 30
new solutions driven by DLT will need to be properly structured, governed, and regulated. The
resulting reductions in costs, lower reliance on manual interventions, better data assurance,
higher transparency, reduced settlement risk, and new products and services will all benefit the
investing public.
State Street has a multi-pronged approach to blockchain exploration, prototyping and the
eventual rollout of services. This involves the coordinated input of, various business units, State
Street IT, the company’s internal FinTech laboratory and external partners. Also, State Street is a
member of various industry consortiums, including R3, the Hyperledger Project, and the Post
Trade Distributed Ledger group, and collaborates with other banks on DLT use cases and
thought leadership across the globe. State Street’s ultimate goal is to enhance its clients’
experience through improved services and new product offerings, increase internal operating
efficiency, and create the intellectual basis to help fuel a sustained pipeline of ideas and
innovation.
Another prominent Massachusetts based bank, Eastern Bank, has launched a FinTech focused
enterprise known as Eastern Labs. The venture seeks to incubate new banking focused
technology and startups utilizing the banking data of its parent, Eastern Bank. Eastern Bank’s
investment has quickly earned it recognition when it was named the Model Bank of the Year in
2016 by Celent for their innovation in small business loans with a technology developed by
Eastern Labs called Express Business Loan. Express Business Loan allows Eastern Bank to
provide small business loans up to $100,000 in less than five minutes.
Insurance: Spotlight on FinTech
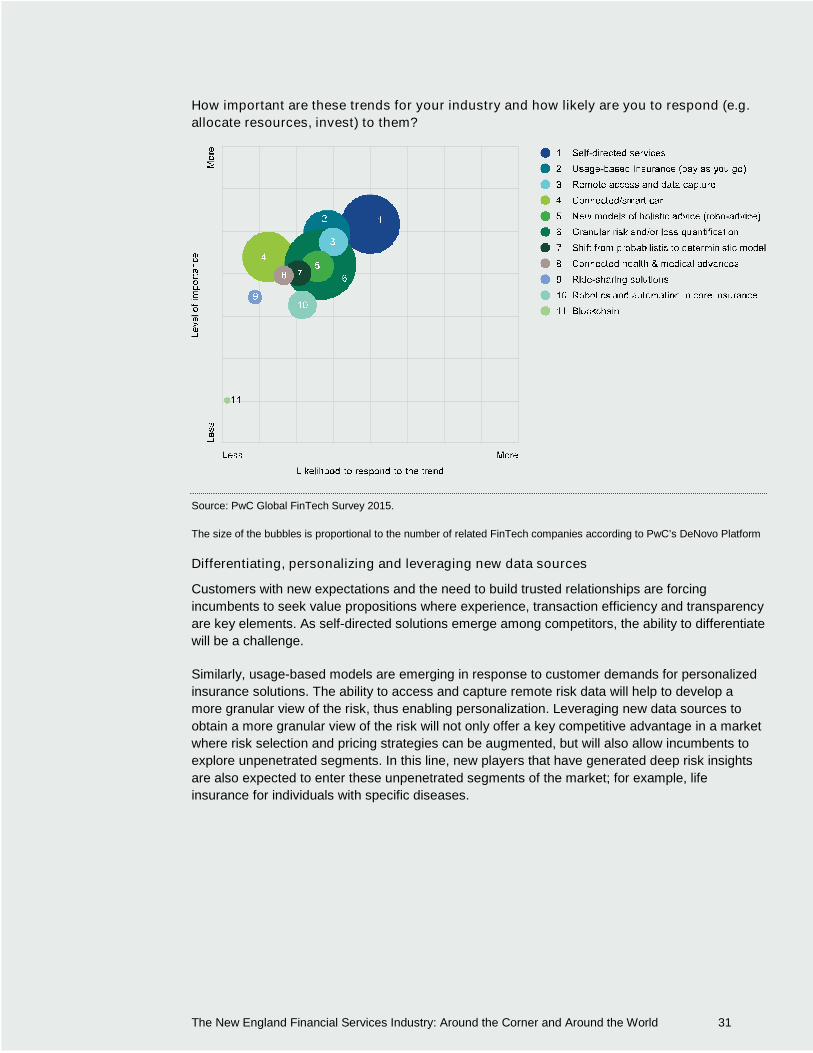
Insurers leverage data and analytics to bring personalized value propositions whileproactively managing risk
The insurance sector sees usage-based risk models and new methods for capturing risk-related
data as key trends while the shift to more self-directed services remains a top priority in order to
efficiently meet existing customer expectations. As is the case in other industry segments,
insurance companies are investing in the design and implementation of more self-directed
services for both customer acquisition and customer servicing. This allows companies to improve
their operational efficiency while enabling online/mobile channels demanded by emerging
segments such as Millennials. There have been interesting cases where customer centric
designs create compelling user experiences (e.g. quotes obtained by sending a quick picture of
the driving license and the car vehicle identification number (VIN)), and where new solutions bring
the opportunity to mobilize core processes in a matter of hours (e.g. provide access to services
by using “robots” to create a mobile layer on top of legacy systems) or augment current key
processes.
Current trends also show an increasing interest in finding new underwriting approaches based on
the generation of deep risk insights. In this respect, usage-based models – rated the second most
important trend – are becoming more relevant.
The New England Financial Services Industry: Around the Corner and Around the World 31
How important are these trends for your industry and how likely are you to respond (e.g.
allocate resources, invest) to them?
Source: PwC Global FinTech Survey 2015.
The size of the bubbles is proportional to the number of related FinTech companies according to PwC’s DeNovo Platform
Differentiating, personalizing and leveraging new data sources
Customers with new expectations and the need to build trusted relationships are forcing
incumbents to seek value propositions where experience, transaction efficiency and transparency
are key elements. As self-directed solutions emerge among competitors, the ability to differentiate
will be a challenge.
Similarly, usage-based models are emerging in response to customer demands for personalized
insurance solutions. The ability to access and capture remote risk data will help to develop a
more granular view of the risk, thus enabling personalization. Leveraging new data sources to
obtain a more granular view of the risk will not only offer a key competitive advantage in a market
where risk selection and pricing strategies can be augmented, but will also allow incumbents to
explore unpenetrated segments. In this line, new players that have generated deep risk insights
are also expected to enter these unpenetrated segments of the market; for example, life
insurance for individuals with specific diseases.

The New England Financial Services Industry: Around the Corner and Around the World 32
Conclusion
The financial services industry is a driver of job creation, economic growth, and upward mobility in
the New England region. While it is a diverse industry, these commonalities exist in all of the
subsectors. As such, The New England Council’s hope is that this report provides the readers
with key data that underscores the importance of the industry to the region, and helps explain the
critical role that financial services plays.
The story of financial services is engrained in our everyday lives. We rely on banks and credits
unions to keep our hard earned money safe and accessible upon demand; we entrust the
dedicated employees of the asset management industry to help us prepare for retirement; we
expect insurers to protect our homes, vehicles, and treasures in the event of tragedy; and we
depend on financial firms of all stripes to participate in building and strengthening our
communities, from providing a start-up loan to an aspiring entrepreneur, to insuring a new job-
creating office complex in a major city, to offering employees the opportunity to volunteer their
time to clean up a park. Nearly every facet of our everyday lives is supported, in some way, by
the financial services industry.
To policymakers, we ask that, when considering legislation and actions that impact the financial
services industry, you be mindful of the constituents employed by financial firms, and the
economic input – direct, indirect, and induced – that this industry brings to bear in your states and
districts. And to the general public, our hope is that you have gained a greater understanding of
the positive role that this critical sector plays right here in New England. Your neighbors and
friends are bank tellers, brokers, and insurance agents; they are safeguarding your savings,
managing your investments, processing your claims, and looking out for your financial well-being.
While no industry is without flaws, the 375,000 hardworking, dedicated direct employees of the
financial services sector are the lifeblood of an industry that is helping make life better for you and
your family.
The New England Financial Services Industry: Around the Corner and Around the World 33
Appendix A: Methodology
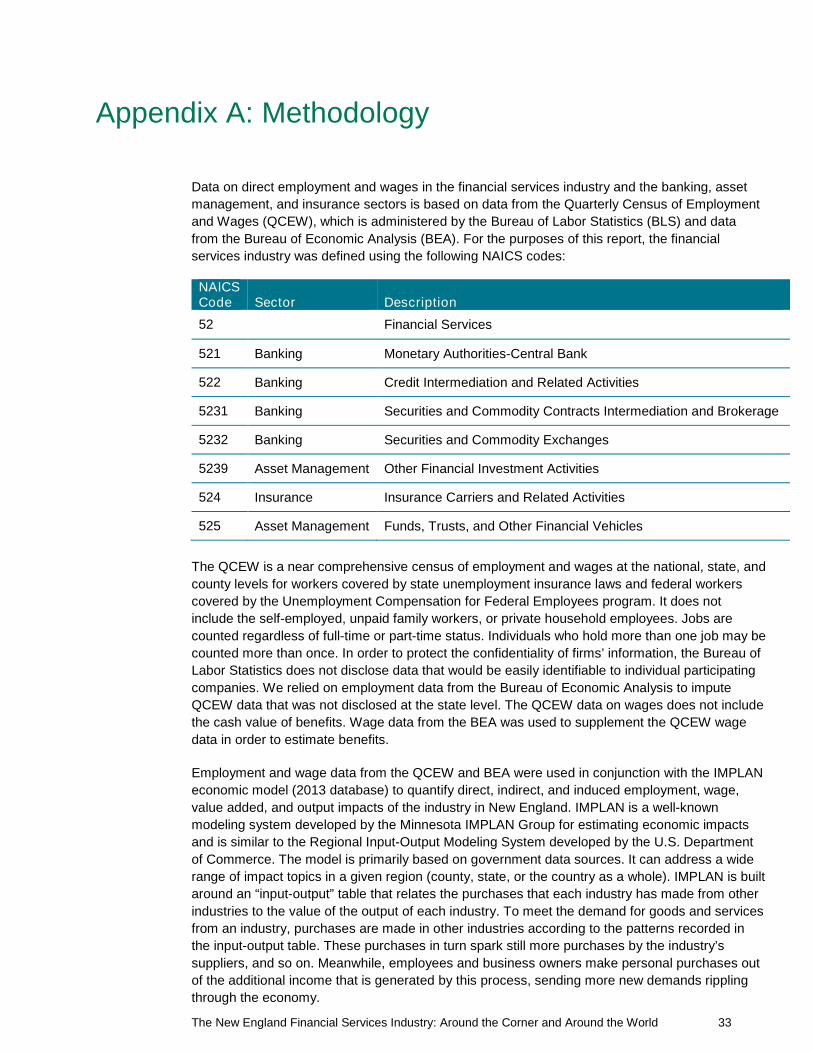
Data on direct employment and wages in the financial services industry and the banking, asset
management, and insurance sectors is based on data from the Quarterly Census of Employment
and Wages (QCEW), which is administered by the Bureau of Labor Statistics (BLS) and data
from the Bureau of Economic Analysis (BEA). For the purposes of this report, the financial
services industry was defined using the following NAICS codes:
NAICSCode Sector Description
52 Financial Services
521 Banking Monetary Authorities-Central Bank
522 Banking Credit Intermediation and Related Activities
5231 Banking Securities and Commodity Contracts Intermediation and Brokerage
5232 Banking Securities and Commodity Exchanges
5239 Asset Management Other Financial Investment Activities
524 Insurance Insurance Carriers and Related Activities
525 Asset Management Funds, Trusts, and Other Financial Vehicles
The QCEW is a near comprehensive census of employment and wages at the national, state, and
county levels for workers covered by state unemployment insurance laws and federal workers
covered by the Unemployment Compensation for Federal Employees program. It does not
include the self-employed, unpaid family workers, or private household employees. Jobs are
counted regardless of full-time or part-time status. Individuals who hold more than one job may be
counted more than once. In order to protect the confidentiality of firms’ information, the Bureau of
Labor Statistics does not disclose data that would be easily identifiable to individual participating
companies. We relied on employment data from the Bureau of Economic Analysis to impute
QCEW data that was not disclosed at the state level. The QCEW data on wages does not include
the cash value of benefits. Wage data from the BEA was used to supplement the QCEW wage
data in order to estimate benefits.
Employment and wage data from the QCEW and BEA were used in conjunction with the IMPLAN
economic model (2013 database) to quantify direct, indirect, and induced employment, wage,
value added, and output impacts of the industry in New England. IMPLAN is a well-known
modeling system developed by the Minnesota IMPLAN Group for estimating economic impacts
and is similar to the Regional Input-Output Modeling System developed by the U.S. Department
of Commerce. The model is primarily based on government data sources. It can address a wide
range of impact topics in a given region (county, state, or the country as a whole). IMPLAN is built
around an “input-output” table that relates the purchases that each industry has made from other
industries to the value of the output of each industry. To meet the demand for goods and services
from an industry, purchases are made in other industries according to the patterns recorded in
the input-output table. These purchases in turn spark still more purchases by the industry’s
suppliers, and so on. Meanwhile, employees and business owners make personal purchases out
of the additional income that is generated by this process, sending more new demands rippling
through the economy.

The New England Financial Services Industry: Around the Corner and Around the World 34
Author and Contributors
Author
The Council is a non-partisan alliance of businesses, academic and health
institutions, and public and private organizations throughout New England
formed to promote economic growth and a high quality of life in the New
England region. The New England Council’s mission is to identify and support federal public
policies and articulate the voice of its membership regionally and nationally on important issues
facing New England. The Council works to foster positive working relationships between its
members and key federal policy makers, including members of Congress and leaders of key
federal agencies. As a non-partisan organization, the Council has forged strong relationships with
leaders on both sides of the aisle, and has won the respect of Democrats and Republicans alike.
Contributors
PwC’s professional services include audit and assurance, tax and consulting that cover such
areas as cybersecurity and privacy, human resources, deals and forensics. PwC’s purpose is
building trust in society and solving important problems. PwC’s global network is supported by
more than 223,000 people in 157 countries. Financial services is a distinctive business
practice that provides audit, technical accounting, tax, regulatory, compliance, risk management, outsourcing, securities
processing, payments, information risk and security, data quality, M&A and other services.
Connecticut Insurance and Financial Services (CT IFS), formed in 2003, is a statewide
initiative of the MetroHartford Alliance comprised of 32 member companies in
Connecticut’s insurance and financial services sector. CT IFS’ Board of Directors
engages around a shared vision: to create competitive advantages in business attraction and retention, to sustain
recruitment and education of a trained workforce and to increase public awareness of the industry’s critical economic
importance. Learn more at www.connecticutIFS.com.
The Cooperative Credit Union Association is a credit union trade group with a heritage
distinguishing it as the oldest continually operating trade group in the United States. While
proud of this heritage, the Association serves its member credit unions throughout
Massachusetts, New Hampshire, Rhode Island, and Delaware as their legislative and regulatory advocate, as a liaison to
vendors and business partners, and as a resource for training and education, and industry news.
The Federal Home Loan Bank of Boston provides highly reliable wholesale funding, liquidity, and
a competitive return on investment to more than 440 member financial institutions in New
England. The Bank develops and delivers financial products, services, and expertise that support housing finance,
community development, and economic growth, including programs targeted to lower-income households.
In business since 1912, and headquartered in Boston, Massachusetts, Liberty Mutual is a
diversified insurer with operations in 29 countries and economies around the world. It is the
fifth largest property and casualty insurer in the U.S. based on 2015 direct written premium
data as reported by the National Association of Insurance Commissioners. It also ranks 73rd
on the Fortune 100 list of largest corporations in the U.S. based on 2015 revenue. Liberty employs over 50,000 people in
more than 800 offices throughout the world.
The New England Financial Services Industry: Around the Corner and Around the World 35
Mass Insight Global Partnerships creates competitive advantages for Massachusetts’
organizations through leadership groups, policy initiatives and partnerships that expand market
opportunities and supports the region’s leadership. Through the Boston Financial Services Leadership Council, Mass
Insight promotes the financial services sector locally, nationally, and internationally, including release annually of a Sector
Impact Report. The Council recently launched Financial Technology Boston, its major initiative to capture FinTech talent
and innovation and connect leading firms, startups, the investor community and universities.
Natixis Global Asset Management serves thoughtful investment professionals worldwide
through our Durable Portfolio Construction® approach: applying risk-minded insights to
empower more intelligent investing. Uniting over 20 specialized investment managers
globally ($897 billion AUM1), Natixis is ranked among the world’s largest asset management firms.2
1 Net asset value as of 9/30/16. Assets under management (AUM) may include assets for which non-regulatory AUM services are provided.
Non-regulatory AUM includes assets which do not fall within the SEC’s definition of “regulatory AUM” in Form ADV, Part 1. 2Cerulli
Quantitative Update: Global Markets 2016 ranked Natixis Global Asset Management, S.A. as the 16th largest asset manager in the world
based on assets under management as of December 31, 2015.
Putnam has helped individuals and institutions pursue successful investment strategies for
more than 75 years. Driven by commitment to our clients, we have practiced an active,
research-intensive approach to investing while embracing innovation since the launch of our first fund in 1937. Today,
Putnam provides investment services across a range of equity, fixed income, absolute return, and alternative strategies. A
global asset manager serving individuals, institutions, and retirement plan sponsors, Putnam distributes its services
largely through intermediaries via offices and strategic alliances in North America, Europe, and Asia.
State Street Corporation is an American worldwide financial services holding company. The company’s
headquarters are in Boston and it has offices in 29 countries around the world. State Street is organized
into three main divisions: the Global Services business is a custodian bank. The Global Advisors
business provides investment management services. The Global Markets business offers investment research and
trading services to institutional investors.
TD Bank, N.A., America’s Most Convenient Bank, is one of the 10 largest banks in the U.S.,
providing more than 8 million customers with a full range of retail, small business and commercial
banking products and services at approximately 1,300 convenient locations throughout the Northeast, Mid-Atlantic, Metro
D.C., the Carolinas and Florida.
The Travelers Companies is an American insurance company. The company has field offices in
every U.S. state and several countries; its largest office is in Hartford, Connecticut. Travelers,
through its subsidiaries and approximately 14,000 independent agents and brokers, provides commercial and personal
property and casualty insurance products and services to businesses, government units, associations and individuals.
The Vermont Captive Insurance Association is the largest trade association for captive insurance
in the world. Established in 1985, the Association has grown to provide legislative leadership and
advocacy on both the state and federal levels for its nearly 500 member companies. In addition, it
hosts and supports professional education and networking opportunities for the industry at large.
.
The New England Financial Services Industry: Around the Corner and Around the World 36
Endnotes
1 Armstrong, D., et al., “85 Innovations 1917 – 1938,” Forbes, 23 December 2002. Available at:http://www.forbes.com/forbes/2002/1223/124.html; McWhinney, J.E., “A Brief History of the Mutual Fund,”Investopedia, Available at: http://www.investopedia.com/articles/mutualfund/05/mfhistory.asp.
2 www.mfs.com3 Strategic Insight/Simfund, December 2015.4 https://www.selectusa.gov/financial-services-industry-united-states5 Simpson, S.D., “A Brief History of Exchange-Traded Funds,” Investopedia, Available at:
http://www.investopedia.com/articles/exchangetradedfunds/12/brief-history-exchange-traded-funds.asp;Davidson, L., “The History of Exchange-Traded Funds (ETFs),” Morningstar, 14 February 2012, Availableat: http://www.morningstar.co.uk/uk/news/69300/the-history-of-exchange-traded-funds-(etfs).aspx.
6 History of the Division of Banks, http://www.mass.gov/ocabr/utility/history-of-the-division-of-banks.html7 National Credit Union Association, “History of the Credit Union System” available at:
https://www.ncua.gov/About/Pages/history.aspx8 “Vermont’s Captive Industry Celebrates 30th Anniversary,” available at:
http://www.vermontcaptive.com/press-room/news-releases/vermonts-captive-insurance-industry-celebrates-30th-anniversary.html; “History of Captives” available at:http://www.captiveexperts.com/History_of_Captives.html.
9 Ibid.10 “2010 Insurance Department Resources Report, Volume I” NAIC, 2011. Includes some RRGs that are
formed as Captive Insurance Companies.11 U.S. Census Bureau, Population Division. Table 1. Annual Estimates of the Resident Population for the
United States, Regions, States, and Puerto Rico.12 PwC analysis of BLS and BEA data.13 PwC analysis of BLS and BEA data. Wages includes wages and salaries and benefits.14 U.S. News & World Report, 2016, http://colleges.usnews.rankingsandreviews.com/best-colleges15 Ibid.16 Ibid.17 Ruiz, N.G., “The Geography of Foreign Students in the U.S. Higher Education: Origins and
Destinations,” Brookings Institute, 29 August 2014. Availableat http://www.brookings.edu/research/interactives/2014/geography-of-foreign-students#/M10420.
18 National Center for Education Statistics, 2015 Digest of Education Statistics, Table 309.10. Availableat: http://nces.ed.gov/programs/digest/d15/tables/dt15_309.10.asp.
19 Employees of monetary authorities make up less than 1% of jobs in the banking subsector in NewEngland.
20 Direct employment is defined as the number of payroll jobs. Indirect/induced employment includes bothpaid and self-employment.
21 Direct labor income includes wages and salaries and benefits. Indirect/induced wages includes wages andsalaries and benefits, as well as proprietors’ income.
22 Direct employment is defined as the number of payroll jobs. Direct labor income includes wages andsalaries and benefits.
23 Indirect/induced employment includes both paid and self-employment. Indirect/induced wages includewages and salaries and benefits, as well as proprietors’ income.
24 Ibid.25 PwC analysis of BLS and BEA data.26 Ibid.27 Ibid.28 Ibid.29 Ibid.30 Ibid.
The New England Financial Services Industry: Around the Corner and Around the World 37
31 PwC analysis of BLS and BEA data. Wages include wages and salaries and benefits.32 Ibid.33 Ibid.34 Ibid.35 Ibid.36 PwC calculations using IMPLAN modeling system (2013 database).37 Ibid.38 Ibid.39 Ibid.40 Ibid.41 Ibid.42 FDIC, American Bankers Association Analysis. Note: aside from deposits, the information is based on
banks headquartered in those states. For example, the number of employees are not necessarily thenumber of bank employees in that state, but the number of employees employed by banks headquarteredin that state.
43 Ibid.44 Credit Union National Association analysis.45 Ibid.46 Ibid.47 Credit Union National Association analysis. This is an estimate of the amount spent by credit unions with
local businesses – not in any way related to small business lending. The estimate is based on the sum ofseveral types of expenditures based on the following assumptions for each credit union headquartered ineach state: 1) 100% of office occupancy expense; plus 2) 100% of office operations expense; plus 3) 20%of travel/conference expense; plus 20% educational/promotional expense; plus 20% ofprofessional/outside service expense.
48 The noncurrent loan metric measures the amount of risky loans in a portfolio and is calculated as themedian ratio of the sum of loans and leases 90 days or more past due or in nonaccrual status divided bytotal loans. The nonperforming asset metric compares the level of bad loans and foreclosed properties tothe total assets a bank has on its books and is calculated by dividing nonaccrual loans, loans and leasesoverdue 90 or more days and other real estate owned by total assets.
49 U.S. Banking Industry Aggregates (and by state) for 06/16 Q; SNL.com50 Ibid.51 Ibid.52 Ibid.53 Ibid.54 Ibid.55 Ibid.56 Deposit Summary by State for all states for 2015; SNL.com57 U.S. Banking Industry Aggregates (and by state) for 06/16 Q; SNL.com58 Deposit Summary by State for all states for 2015; SNL.com59 U.S. Banking Industry Aggregates (and by state) for 06/16 Q; SNL.com60 Ibid.61 Ibid.62 Compiled from the data available at https://www.ffiec.gov/craadweb/aggregate.aspx63 PwC analysis of BLS and BEA data.64 Calculations based on information from: Kenney, J.B and Taub, S., “The 2014 Hedge Fund 100,”
Institutional Investor, Inc.65 Thomson Reuters, Investment Analytics Report, Companies involved in All Private Equity Deals from
1/1/2011 to 12/31/2015.66 Strategic Insight/Simfund, December 2015.67 Calculations based on information from: Kenney, J.B and Taub, S., “The 2014 Hedge Fund 100,”
Institutional Investor, Inc.68 Strategic Insight/Simfund, December 2015.69 Thomson Reuters, 2015.70 Pensions and Investments – May 2016.

The New England Financial Services Industry: Around the Corner and Around the World 38
71 Thomson Reuters, May 2015.72 Strategic Insight/Simfund, December 2015.73 Calculations based on information from: Kenney, J.B and Taub, S., “The 2014 Hedge Fund 100,”
Institutional Investor, Inc.74 Thomson Reuters, 2015.75 Thomson Reuters, Investment Analytics Report, Companies involved in All Private Equity Deals from
1/1/2011 to 12/31/2015.76 Bureau of Labor Statistics, OCC Code 15-2011, May 2015.77 PwC analysis of BLS and BEA data.78 144th Annual Report of Insurance Commissioner; a Condensed Financial Overview of Insurance
Companies Doing Business in the State in 2014 – March 30, 2016.79 Ibid.80 Ibid.81 Bureau of Labor Statistics, OCC Code 15-2011, May 2015.82 CERC calculation of Moody’s Analytics data, NAICS 5241. August 2016.83 Ibid84 Bureau of Economic Analysis, gross domestic product by state, 2014.85 Insurance Information Institute, Captives by State.86 Ibid.87 PwC analysis of BLS and BEA data. IMPLAN model (2013 database). Wages include wages and salaries
and benefits.88 Ibid.89 Ibid.90 Ibid.91 PwC analysis of BLS and BEA data.92 Ibid.93 Ibid.94 PwC analysis of BLS and BEA data. Wages include wages and salaries and benefits.95 Boston Business Journal, Top Charitable Companies in Massachusetts96 Ibid.97 PwC analysis of BLS and BEA data. IMPLAN model (2013 database). Wages include wages and salaries
and benefits.98 Ibid.99 PwC analysis of BLS and BEA data.100 Bureau of Economic Analysis, gross domestic product by state, 2015.101 PwC analysis of BLS and BEA data. IMPLAN model (2013 database). Wages include wages and
salaries and benefits.102 Ibid.103 PwC analysis of BLS and BEA data.104 Bureau of Economic Analysis, gross domestic product by state, 2014.105 PwC analysis of BLS and BEA data. IMPLAN model (2013 database). Wages include wages and
salaries and benefits.106 Mattermark.


![Watton Town Council Financial Regulations [England] · Watton Town Council Financial Regulations [England] ... are one of the council’s three governing policy documents providing](https://img.pdfslide.us/doc/110x75/5e6c734da0b3955d5715f276/watton-town-council-financial-regulations-england-watton-town-council-financial.jpg)