Embed Size (px)
Citation preview

The New CIA - China, India & America
John N. Doggett, JD, MBA, Senior Lecturer
Global Management, Entrepreneurship & Sustainability and Energy
McCombs School of Business
Senior Research Fellow, IC2 Institute
University of Texas at Austin
March 25 2010

We Are In The Eye of a S.I.P.

S.I.P.’s Are Scary
“A strategic inflection point is a time in
the life of a business [or country]
when its fundamentals are about to
change. That change can mean an
opportunity to rise to new heights. But
it may just as likely signal the
beginning of the end.”
Andy Grove, Only the Paranoid Survive

At the End of WW II
Europe and Asia had suffered
unimaginable death and destruction.
Most factories of our industrialized
competitors had been destroyed.
For a brief period, American
manufacturing firms were the only
game in town.
We assumed that Third World
Countries would always be dirt poor
colonies.
We assumed that Third World
Countries would never be able to
produce innovative products that could
compete with our products.
We Were Wrong On Both Counts.
Assume is a Very Dangerous Word

Be Careful What You Wish For
We told the world that our way of life
was better than Communism or
Socialism.
CNN and Hollywood showed the world
an irresistible vision of American Life.
Then the Unthinkable happened. On November 9, 1989, the Berlin Wall Fell
On Christmas Day, 1991, the USSR ceased to exist.
We had won the Cold War.
And most people in the world wanted to
live like US.

Birth of the BRICs
In 2001, as the Internet Bubble was
collapsing and the stock market was
imploding, Goldman Sachs predicted
that four countries would dominate
global economic activity in the 21st
Century.
Brazil
Russia
India
China

The Axis of the Future

Are These Guys Crazy?
6,100% Annual Inflation (1994)
Shock Therapy and the Oligarchs (1990s)
Two Weeks of Foreign Reserves (1991)
The Cultural Revolution (1966-1976)

Largest Countries By Population1. China 1,338,612,968 (slightly smaller than the US)
2. India 1,166,079,217 (slightly more than one-third the size of the US)
3. United States 307,212,123 (6.25% of the earth’s land mass = 424,378,888)
4. Indonesia 240,271,522 (slightly less than three times the size of Texas)
5. Brazil 198,739,269 (slightly smaller than the US)
6. Pakistan 176,242,949 (slightly less than twice the size of California)
7. Bangladesh 156,050,883 (slightly smaller than Iowa)
8. Nigeria 149,229,090 (slightly more than twice the size of California)
9. Russia 140,041,247 (approximately 1.8 times the size of the US )
10.Japan 127,078,679 (slightly smaller than California)
11.Mexico 111,211,789 (slightly less than three times the size of Texas)
12.Philippines 97,976,603 (slightly larger than Arizona)
13.Vietnam 86,967,524 (slightly larger than New Mexico)
CIA World Factbook - March, 2010

Elephants Emerging from the Mist Total World Population = 6,790,062,216
BRIC Population = 2,843,472,701 (41.9%)
Total World Land Area = 174,814,000 sq. km. (- oceans)
BRIC Land Area = 38,471,715(22%)
Total World Gross Domestic Product = $57.53 Trillion
Total World Gross Domestic Product = $70.24 Trillion
(Purchasing Power Parity) (p.p.p.)
BRIC Gross Domestic Product (p.p.p.) = $ 16.4
Trillion (23.4%)
Source: CIA World Factbook – March 2010

Today, The BRICs Have Arrived
BRICs Economies collectively are now
23.4% of global GDP, which is $1.9 trillion
larger than America’s GDP.
China is the second largest economy in
the world. Today!
India is the fourth largest economy in the
world. Today!
CIA World FactBook, Goldman Sachs and Professor Doggett Analysis

National GDP in 2009 (purchasing power parity)
Country GDP 2009 Growth %
1. United States $ 14,520,000,000,000 -2.4%
2. China $ 8,768,000,000,000 8.4%
3. Japan $ 4,141,000,000,000 -5.7%
4. India $ 3,548,000,000,000 6.1%
5. Germany $ 2,812,000,000,000 -5.00%
6. United Kingdom $ 2,165,000,000,000 -4.3%
7. France $ 2,113,000,000,000 -2.1%
8. Russia $ 2,103,000,000,000 -8.5%
9. Brazil $ 2,024,000,000,000 0.1%
10. Italy $ 1,756,000,000,000 -5.0%
11. Mexico $ 1,473,000,000,000 -7.1%
12. Spain $ 1,367,000,000,000 -3.7%
13. South Korea $ 1,343,000,000,000 -0.8%
14. Canada $ 1,287,000,000,000 -2.4%
CIA World Factbook – March, 2010
China is On the Move
Goldman Sachs says that China can
become the largest economy in the
world by 2035 by growing by 5% a year.
What does the world look like when
China’s economy is 9x bigger than it is
today?
What opportunities does this represent
for American entrepreneurs?

India is Rising
Goldman Sachs says that India can
challenge the US for #2 by 2040 by
growing by 6% a year.
What does the world look like when the
Indian economy is 12x bigger than it is
now?
What opportunities does this represent
for American entrepreneurs?

Here Comes The BRIC Middle Class
Goldman Sachs predicts that the BRIC Middle Class could grow 4x in the next decade
Never before have we seen the addition of 750 million new members of the middle class in one decade.
Goldman says that the BRIC Middle Class could grow from 250 million in 2005 to 3.5 billion by 2050*
Jim O'Neill, Managing Director & Head of Global Economic Research, Goldman Sachs, 5/06

How Far The BRICs Have Come
In 2006 the G7 (US, Japan, Germany, France, Britain, Italy & Canada) held $1,253,900,000,000 in FOREX
By the end of 2007 China’s FOREX reserves had passed $1,500,000,000,000
China spent $65 billion for the Olympics. 5x the cost of the Athens Olympics.
China’s China Investment Corporation is a $300 billion State VC Fund
Today, China has $2,400,000,000,000 in FOREX reserves.Professor P. Konana, McCombs School of Business, University of Texas at Austin & Goldman Sachs

Go Where the Market Is
756 million Mobile Phone Users in
China (January, 2010)
Only 56.3% of China’s population
550 million Mobile Phone Users in India
19,000,000 Indians signed up for cell phone
service in January, 2010 . . . for the first time ever
612,903 new subscribers every day of the month
All of Motorola’s mobile phone ads are
developed and designed in Beijing
They outsource to the US and Europe for
“localization”

China Drawing High-Tech Research
Mark Pinto, Chief Technology Officer of
Applied Materials moved to Beijing in
January
Applied Materials is building its newest
and largest research labs in China
Applied held its annual shareholder’s
meeting in Xi’an, China.
Applied’s global headquarters are in Santa Clara,
California

Applied’s New Xi’an R&D Plant

This Will Be China’s Century
When Xie Lina, a 26-year-old Applied
Materials engineer here, was asked
recently whether China would play a
big role in clean energy in the future,
she was surprised by the question.
“Most of the graduate students in
China are chasing this area,” she said.
“Of course, China will lead everything.” New York Times, March 17, 2010
Who. is. Your. Daddy?

Who is Worried About IP?
Thermal Power Research Institute is
China’s world-leading laboratory on
cleaner coal, has just licensed its latest
design to Future Fuels in the US.
Future Fuels will pay about $100 million to import
from China a 130-foot-high maze of equipment
that turns coal into a gas before burning it. This
method reduces toxic pollution and makes it
easier to capture and sequester gases like
carbon dioxide under ground.
Future Fuels will ship the equipment to
Pennsylvania and have Chinese engineers teach
American workers how to assemble and operate it.

Who Owns Our Debt? (Billion US$)
May 2008
China = $506.8
Japan= $575.3
Caribbean Banking
Centers = $104.5
Oil Exporters = $164.2
UK = $271.2
Brazil = $151.4
Russia = $63.7
Luxembourg = $75.2
Hong Kong = $61.4
Taiwan = $38.9
January 2010
China = $889.0
Japan = $765.4
Oil Exporters = $218.4
UK = $206.0
Brazil = $169.1
Hong Kong = $146.6
Caribbean Banking
Centers = $143.5
Russia = $124.2
Taiwan = $119.6
Switzerland = $84.4 http://www.treas.gov/tic/mfh.txt

Who is Our Banker?
In May, 2008, we owed China, Inc.
$607.1 billion.
By December, 2009, this number had
grown to $1.16 trillion
We borrowed an additional $552.9
billion in 1 ½ years.
This is a 91.07% increase in their “line of credit”
to US

What Are They Buying Now?
Majority Share of GM China & GM India
Hummer from GM (Not anymore)
Volvo from Ford
15% of the Cleveland Cavaliers
20% of Fisher & Pavkel (New Zealand)
Oz Minerals (Australia) for $1.4 billion
Addax Petroleum (Swiss oil company)
for $7 billion
Access to Kurdish & Nigerian oil fields
9.9% of Morgan Stanley & Citibank


The New World Order in 2050? (GDP in Trillion US$)
China $70
USA $39
India $38
Brazil $11
Mexico $10
Russia $9
Indonesia $8
Japan $7
UK $5
Germany $5
Nigeria $5
France $5
Korea $4
Turkey $3
Vietnam $3
Canada $3
Philippines $2
Italy $2
Iran $2
Egypt $2
Pakistan $1
Bangladesh $1
Goldman Sachs BRIC Book (2007) - Page 154

Are We Losing Our Touch?
“God bless the Chinese,” one senior
American diplomat in Brazzaville put it
bluntly. “They build roads and dams,
and quite frankly we don’t have what it
takes to do those things anymore. All
we can do is give English classes and
try to sell our technology.”
China Safari: On the Trail of Beijing’s
Expansion in Africa, Serge Michel and
Michel Beuret, Nation Books, 2009

Who Would Have Thought?
Dr. P. Konana, McCombs Business School, University of Texas at Austin
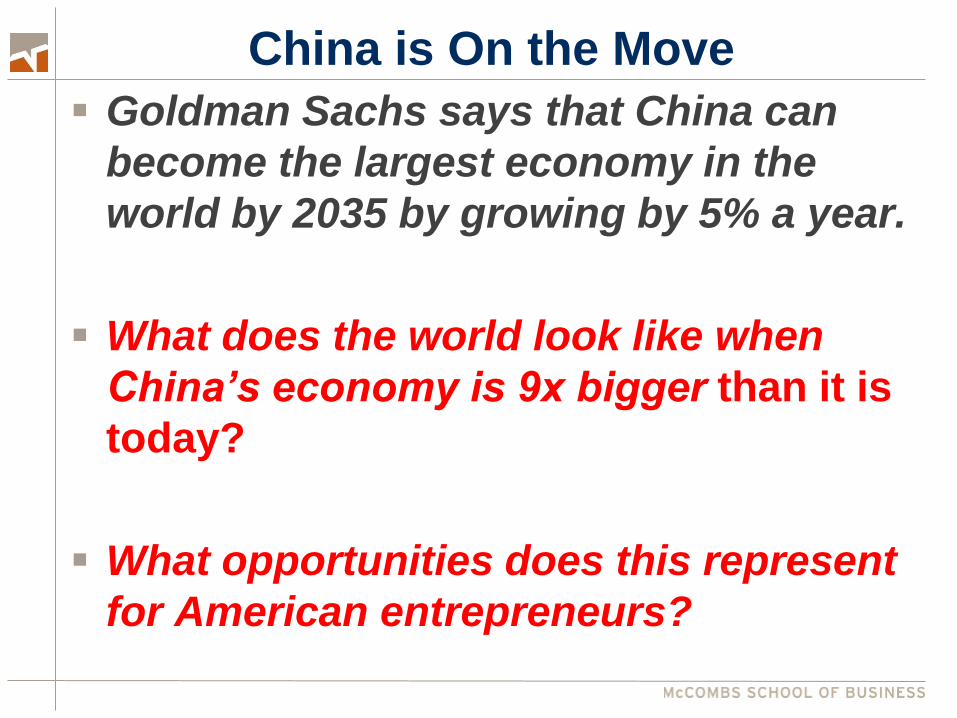
A Swarm of Inflection Points
India - Total Trade
$0
$10
$20
$30
$40
$50
$60
$70
$80
$90
$100
1990 1991 1992 1993 1994 1995 1996 1997 1998 1999 2000 2001 2002
Bill
ion
s
Japan - Total Trade
$0
$50
$100
$150
$200
$250
$300
1960
1961
1962
1963
1964
1965
1966
1967
1968
1969
1970
1971
1972
1973
1974
1975
1976
1977
1978
1979
1980
$ B
illi
on
s
China - Total Trade
$0
$50
$100
$150
$200
$250
$300
$350
19
80
19
81
19
82
19
83
19
84
19
85
19
86
19
87
19
88
19
89
19
90
19
91
19
92
19
93
19
94
19
95
19
96
19
97
19
98
19
99
20
00
$ B
illi
on
s
1964-70 1989-94
2000-2005

WSJ - June 25, 2007, Page A1
California Dreaming?
Welcome to the New China
copyright - John N. Doggett, 2008

34
Growth at Warp Speed

The People’s Republic of Communist China?

www.lenbracken.com/images/china31
Shenzhen in 1979

30,000 people lived here in 1983
Source: http://en.wikipedia.org/wiki/Image:57440.jpg

Boji Christmas tree factory

Chinese New Year Train Station

China’s Exploding Middle Class
In 2007, China had 80 million
middle class consumers 6% of China’s population
By 2020, China will have 700
million middle class consumers.
30% of China’s population
Source: McKinsey & Company

Millionaires’ Fair 2007, Shanghai

How Long Will They Wait For Theirs?
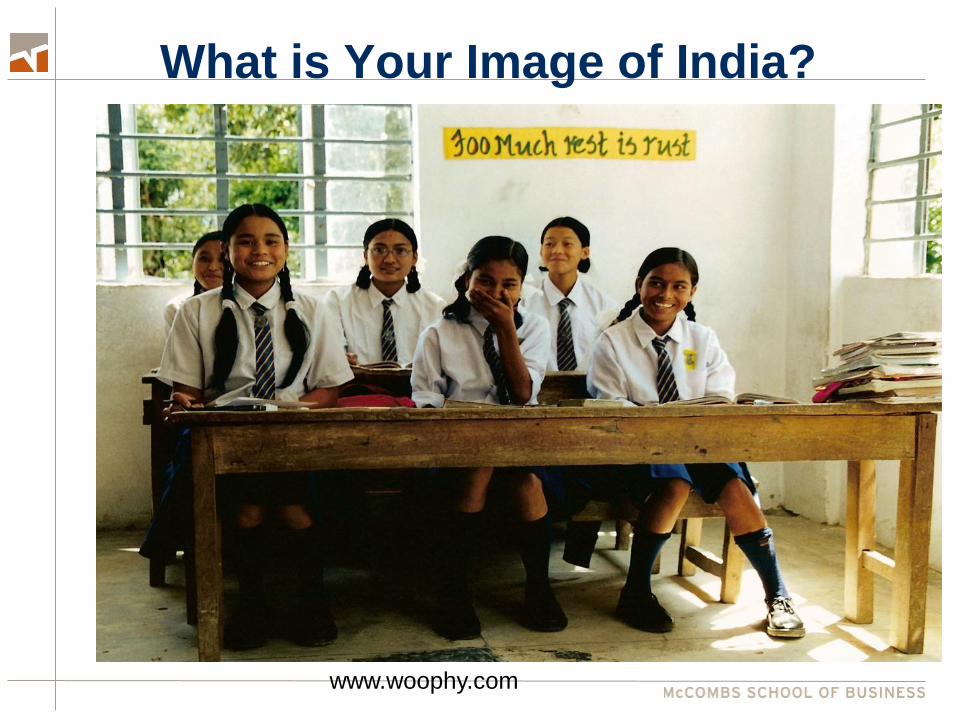
What is Your Image of India?
www.woophy.com

Competing With Bright Minds

Infosys
Infosys

Infosys

Indigo Airlines

India = Brainpower, Inc.
Students who are rejected by one of the
IIT branches go to MIT as their backup
school
India is home to over 100 R&D Facilities
for Fortune 500 Firms
Since 2003, Indian firms were 10 of the
17 winners of the Deming Application
Award for Quality
Nearly 250 Indian centers teach
courses on Japanese language and
culture

Mr. Steel

Competing With M&A
Mittal Steel acquires Arcelor
ArcelorMittal is the #1 Steel Company in the
World with 310,000 employees in 60 Countries

Tata Motors People’s Car

Tata Motors’ Newest Ride

Tata Motors’ Newest Ride

Dr. P. Konana, McCombs Business School,
University of Texas at Austin
Energy per Capita Rising with Incomes
-
1,000
2,000
3,000
4,000
5,000
6,000
7,000
8,000
9,000
- 5,000 10,000 15,000 20,000 25,000 30,000
Energy Consumption and GDP per Capita: 2002
Energy usage per capita (oil equivalent litres per person per year)
GDP per capita (1990 US dollars per person per year)
India
South Korea
China
Japan
UK
Australia
US
Source: GGDC, BP, GSJBW
Source: Roopa Purushothaman, Goldman
Sachs, BRICs Report 2003
Japan
UK
South Korea

Unprecedented Energy Growth
China became the World’s Largest Emitter
of energy-related CO2 in 2008.
China will become the World’s Largest
Consumer of Energy in 2010.
From 2007 and 2030, China will install
more new electricity generating capacity
than exists in the United States in 2007
World Energy needs in 2030 will be 55%
higher than in 2006
China and India will = 45% of this new
demand
World Energy Outlook - 2007

China’s Exploding Energy Demand
China’s Primary Energy demand will more than double from 1,742 million toe in 2005 to 3,819 million toe in 2030 ( 3.2% annual growth rate)
In 2005, the United States used 1/3 more energy than China
By 2010, China will use more energy than the United States
China’s primary energy demand will grow by 5.1% until 2015
World Energy Outlook - 2007

China’s Generation Growth Curve
New York Times - May 11, 2009

China Is Innovating
New York Times - May 11, 2009
China, India and Coal
Coal produces 80% of China’s power.
China uses more coal than the US, Europe and Japan . . . Combined.
China is the leading builder of supercritical and ultra-supercritical coal plants.
Indian and Chinese companies have been
buying coal assets abroad, especially in
Africa.
India's National Aluminum Co. wants to buy a
coal asset in Indonesia with at least 200
million metric tons of reserves.
New York Times - May 11, 2009, WSJ & Professor Doggett Analysis

Progress Comes at a Steep Price
Source: New York Times, 8/25/2007

The Chinese People Hate Dirty Air

They Hate Dirty Water

The Clock is Ticking

The Guardian - June 20, 2007 Peter Parks/AFP
This “Air” Doesn’t Stay in China

WSJ - Science Journal - July 7, 2007
Global Air Currents
“On some days, almost a third of the air over Los Angeles and San Francisco can be traced directly to Asia. With it comes up to three-quarters of the black carbon particulate pollution that reaches the West Coast.”

We are #2!
0
1,000
2,000
3,000
4,000
5,000
6,000
7,000
8,000
9,000
10,000
11,000
12,000
1990 1995 2000 2005 2010 2015 2020 2025 2030
China
USA
OECD Europe
Russia
India
Japan
Year
MMT CO2 Projected CO2 Emissions 2
1 China, Choking On Growth – Part I. New York Times, 26 Aug 2007.
2 International Energy Outlook – Table A10, U.S. Energy Information Administration (EIA)
China Is Moving Fast
China has doubled its total wind energy capacity in each of the past four years.
China will pass the US this year to become the largest market for wind turbines in the world.
China will build more new nuclear power plants than any country for the next two decades.
HSBC predicts that China will spend more on renewable and nukes than coal and oil electricity generating plants.
New York Times, July 2, 2009 and Professor Doggett Analysis

Growing at the Speed of Wind
2008 target = 5,000 megawatts by 2010
March 2009 target = 10,000 megawatts
by 2010
July 2009 target = 30,000 megawatts by
2010
This was the target for 2020 three years ago

Dunhuang – China’s Green Desert

Becoming a Renewable Energy Giant
China is building six massive wind
farms across the country.
Each has the generating capacity of 16 large
coal-fired plants
Each of the six projects “totally dwarfs
anything else, anywhere else in the
world,” Steve Sawyer, the secretary general of the Global
Wind Energy Council, an industry group in Brussels.

Lone Star, Meet Red Star
China inks $1.5 Billion Wind-Power
Deal in Texas (WSJ 10/29/09)
Largest U.S.-China Joint Investment in American
Renewable Energy to Date
First U.S.-China Joint Venture in Utility-Scale
Wind Power Project
Chinese banks will finance the deal
Year old Chinese wind turbine
company will make the wind turbines
China has received $1 billion in UN
Climate Subsidies

WHAT THE HECK DO WE DO?
Anyone Still Question Whether We are in the midst of a S.I.P.?

Drain Brains! Immigrants started 25% of U.S. public companies
that were venture-backed.
The market capitalization of publicly traded
immigrant-founded venture-backed companies in
the U. S. exceeds $500 billion.
40% of U.S. publicly traded venture-backed high-
technology manufacturing companies were
started by immigrants.
50%+ of the employment generated by U.S. public
venture-backed high-tech manufacturers has
come from immigrant-founded companies.

Innovate! The iPhone and iPad

The Amazon Kindle DX

Carbon Free Fresh Water

French Tidal Power Plant Online in 1967
http://en.wikipedia.org/wiki/Image:Rance_tidal_power_plant.JPG

Real Products; Not Just Dreams

300 in NYC’s East Rive by 2013

Algae to Oil

Small Reactors to the Rescue?
Baby Nuke Self Contained Design
Tennessee Valley Authority, First Energy
Corp. and Oglethorpe Power Corp., on
2/17/10 signed an agreement with McDermott
International Inc.'s Babcock & Wilcox
subsidiary, committing to get the new reactor
approved for commercial use in the U.S.
Made in plants in Indiana, Ohio or Virginia.
125 to 150 MW
1/10 the cost of big nukes = $750 million
Built with all of the fuel needed to run it for
60 years.
All waste stored in plant for 60 years.WSJ - 2/18/2010

240 MW on a Truck
(c) - General Atomics - WSJ -
2/22/2010

Pocket Nuclear Reactor 240 MW reactor that will be built in factors
and shipped to sites on trucks or trains.
Helium cooled reactor would use operate at temperatures as high as 850 degrees Centigrade. This makes it an attractive “combined cycle” energy
source for desalinization of water and other industrial uses.
Fuel source is spent nuclear fuel from large conventional nuclear plants. “spent fuel” contains more than 90% of its original
energy
Enough nuclear waste to build 3,000 of these reactors
12 year development timeline
WSJ - 2/22/2010