Embed Size (px)
Citation preview
THE NEW ART OFPROBLEM SOLVING
A Guide for Your Decision Sciences Journey
www.mu-sigma.com | 2
© 2016 Mu Sigma Reproduction Prohibited.
Table of Contents3 Introduction
3 Businesses Must Learn to Capitalize on Change
4 Where to Focus: The River of Reasonable Return
5 What it Means for Today’s Solution Options
6 New Paradigms are Needed
7 The Art of Problem Solving SystemTM
8 Plan for Outcomes and Transformation in Harmony
12 Map the Interactions Across the Problem Universe
13 Encode Problems to Promote the Best Design
14 Apply an Analytics Prism to Improve Consumption
16 Harmonize the Creation and Consumption of Analytics
17 Pursuing a New Art of Problem Solving – While Doing Your Day Job
19 Charting the Course
19 The Right Governance
21 The Right Culture
24 Summary and More Information
www.mu-sigma.com | 3
© 2016 Mu Sigma Reproduction Prohibited.
IntroductionMu Sigma has a singular purpose: To instill a fundamentally new approach to decision making in large enterprises,
one designed to not just match today’s incredible pace of change, but to help firms like yours capitalize on it. We call
it a New Art of Problem Solving, and it’s our pleasure to describe the concept in this eBook.
We begin with a look at today’s changing business climate and where you should concentrate your problem solving efforts
in light of that change. Then we’ll outline five habits that form our Art of Problem Solving SystemTM, which is designed with
that high pace of change in mind. And finally, we’ll conclude with recommendations for organizing and governing what
will be an ongoing effort. We hope this document is a useful starting point for your decision sciences journey.
Businesses Must Learn to Capitalize on ChangeBig data tops many lists of business priorities, as the growing volume, velocity, variety, veracity and volatility of data
continue to fuel anxiety in business leaders. But that anxiety is misplaced. It’s not these clichéd Vs that you should
worry about. After all, big data is a symptom not a cause. The root cause of our anxiety is something that’s been
around forever: Change. And change continues to accelerate, creating more complexity and more data for our
businesses in shorter cycles.
Change isn’t new. We only have to look to nature for guidance. If Earth’s 4.5 billion year existence were compressed to
one 24-hour period, modern humans would be only one second old.
www.mu-sigma.com | 3
www.mu-sigma.com | 4
© 2016 Mu Sigma Reproduction Prohibited.
Consider this point in a business context. It took 100 years for modern flight to evolve into an industry with 2.3 billion
passengers flying commercially each year. It took a certain online college hangout only 10 years to become a social
network that generates 22 billion minutes of online interaction each day. All industries are young. All business models
will continue to evolve rapidly.
As a result, leaders like you fight each day to find simplicity in the face of this hastening change. But in seeking
simplicity, you can’t ignore complexity; the two are flip sides of the same coin. Just as evolution occurs when species
learn to thrive in changing environments, organizations designed to capitalize on change will be more successful than
those who attempt to simply manage change.
Will you learn to just live with the anxiety? Or will you learn to capitalize on change? The latter first requires an
understanding of the problem universe in which we operate. Then we’ll discuss how the solution space must
change as well.
Where to Focus: The River of Reasonable Return
We have a situation that is unique in the short history of humankind: An explosion of signals, more networks for
carrying those signals instantaneously to anywhere in the world, and a proliferation of market economies that reward
people for responding quickly to those signals. Decision supply chains now trump physical supply chains in terms of
importance, and data is now the new oil.
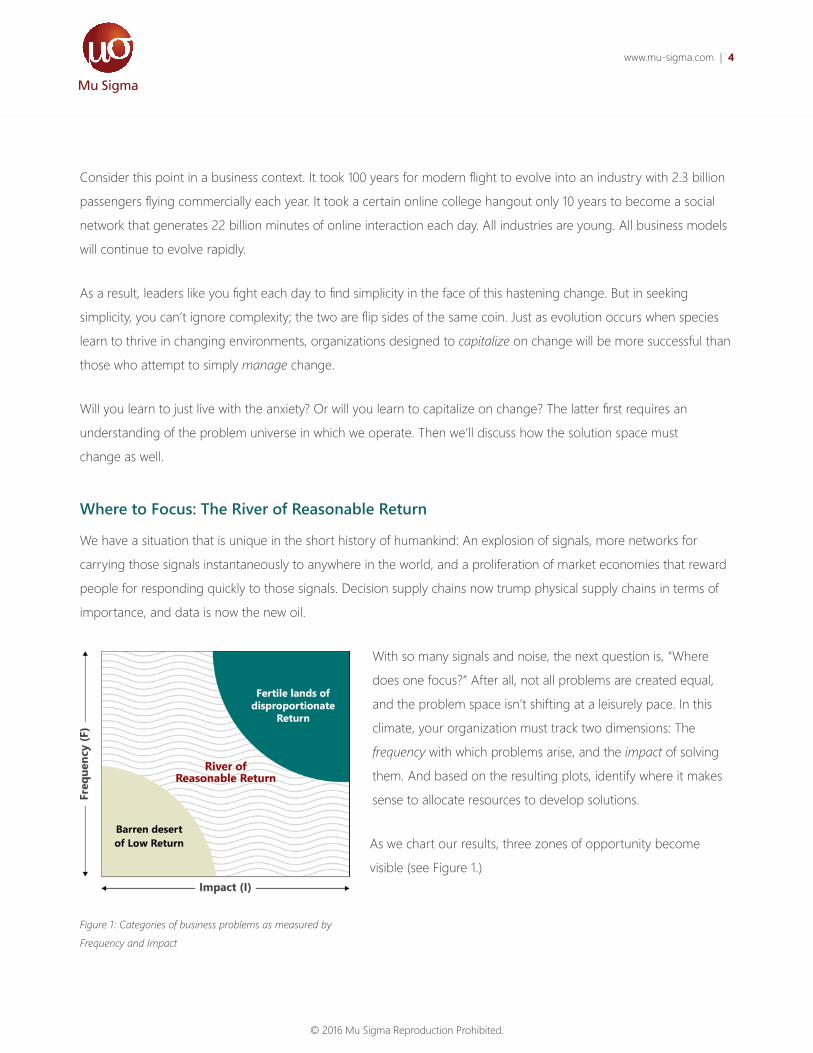
With so many signals and noise, the next question is, “Where
does one focus?” After all, not all problems are created equal,
and the problem space isn’t shifting at a leisurely pace. In this
climate, your organization must track two dimensions: The
frequency with which problems arise, and the impact of solving
them. And based on the resulting plots, identify where it makes
sense to allocate resources to develop solutions.
As we chart our results, three zones of opportunity become
visible (see Figure 1.)
Figure 1: Categories of business problems as measured by Frequency and Impact
www.mu-sigma.com | 5
© 2016 Mu Sigma Reproduction Prohibited.
Most businesses want to focus on the upper right section of the graph, where the combination of payback and
frequency seems the highest. This is the popular place to be – where the shiny problems lie, the most difficult and
time-consuming problems. Management consultants will ply their heuristic, judgment-based approaches in the part of
this zone where business impact is highest, while independent software vendors (ISVs) promote algorithmic solutions
in the part where frequency is highest.
But most problems occupy the middle of the graph, in what we call the “River of Reasonable Return.” And that’s also
where the richest opportunity lies. Think of an effort to clear a river in order to increase its flow. Imagine a choice
between removing one or two massive boulders versus dredging millions of smaller pebbles. Exploding the big rocks
sounds impressive, but removal of the smaller stones will generate more value – more flow.
In this river we find a wealth of problems awaiting creative solutions. Why is fraud on the rise in this particular
customer segment? Why is my discounting strategy not affecting sales? Why was only one channel effective for our
most recent campaign? Why are my West coast stores less profitable?
There are thousands more such questions. We find that such problems are ill-defined, surprisingly complex and
growing in terms of frequency. They’re also interconnected. In fact, we might envision some connections between just
those four questions above.
That’s why the River of Reasonable Return represents the richest opportunity – because of its problem density and the
myriad interactions between those problems. The impact of solving any one of these problems in isolation is too small to
make it worthwhile. But the more you find solutions for networks of these smaller problems – by mining their interactions
– the greater the impact you’ll experience, especially when compared with trying to solve the big shiny problems.
What it Means for Today’s Solution Options
Swimming in the current of these muddy, interconnected problems, many organizations face some challenges. For
one, the data and analytics domain is still nascent – new platforms emerge seemingly weekly, and analytical processes
can be immature or fragmented across industries. And don’t forget the lingering lack of analytical talent.
When it comes to external resources, although traditional solution providers have an important role to play in
navigating the River of Reasonable Return, taken individually, their models have some deficiencies that might be
exposed in a climate of fast change. For instance, we know that consulting and its inherent project-to-project
approach, doesn’t scale. We know that corporate IT, under pressure to just “keep the lights on,” is not known for its
agility. And we know that software applications are inflexible – often encapsulating just one approach to a particular
problem domain.
www.mu-sigma.com | 6
© 2016 Mu Sigma Reproduction Prohibited.
As you look for ways in which your organization can benefit from change, and as you take on those muddy,
interconnected problems, you’ll need a more holistic treatment of what those point solutions offer. You’ll require a truly
integrated blend of math and business insights, tightly wound within software. Not “man + machine” but truly “man
machine.” Such a combination is a requirement for implementing our Art of Problem Solving System and something
we take great pride in at Mu Sigma.
New Paradigms are Needed
The scarcity of resources and inadequacy of solution options is just the start. A bigger problem is that, despite the fast
pace of change, many organizations rely on safe analytical paradigms.
For one, firms will work hard to capture the knowledge that exists in pockets of their organization, with the intent
of replicating it elsewhere. All too often this knowledge collects dust in KM repositories, loses relevance, and then
depreciates in value faster than that of a new automobile.
Second, most organizations seek experts – seasoned industry or functional practitioners who’ve been taught to find
answers to specific questions. But having everyone tap into the same definitions of expertise can lead to a parity of
ideas across your company and your competitors.
Third and finally, we’ve all been conditioned to create intellectual property, but we then apply all sorts of technical and
legal means to protect it. An unfortunate side effect is that the best ideas spread too slowly, or not at all.
The modes of thinking mentioned above might help you keep up with change, but they won’t help you capitalize
on that change. As such, they represent the opposite of what’s needed to thrive in today’s fast pace of change and
muddy, interconnected problems. Enterprises should instead follow three principles:
1. Learning over Knowing. Rather than compete on knowledge that constantly breaks down, better
companies will compete on an ability to learn, where learning is the rate of change of that knowledge. The
best companies will compete on their speed and adaptability of learning.
2. Extreme Experimentation. Rather than rely on experts or expertise, rely on experiments. We are like
monkeys throwing darts at a moving dartboard. Our hubris wants us to believe that we can learn to throw
darts with greater accuracy. But if we can bring down the cost of experimentation – throwing many more
darts within the same budget and timeframe – then our odds of finding successful solutions rise dramatically.
www.mu-sigma.com | 7
© 2016 Mu Sigma Reproduction Prohibited.
3. The New IP. Enough with isolated, protected approaches built around intellectual property. The new “IP”
stands for “interdisciplinary perspectives.” It’s open and wants to connect, as opposed to closed. The new IP
believes that ideas from different origins want to complete each other.
These three guiding principles underpin all that we do and believe at Mu Sigma. They serve as the bedrock on which
the New Art of Problem Solving is built.
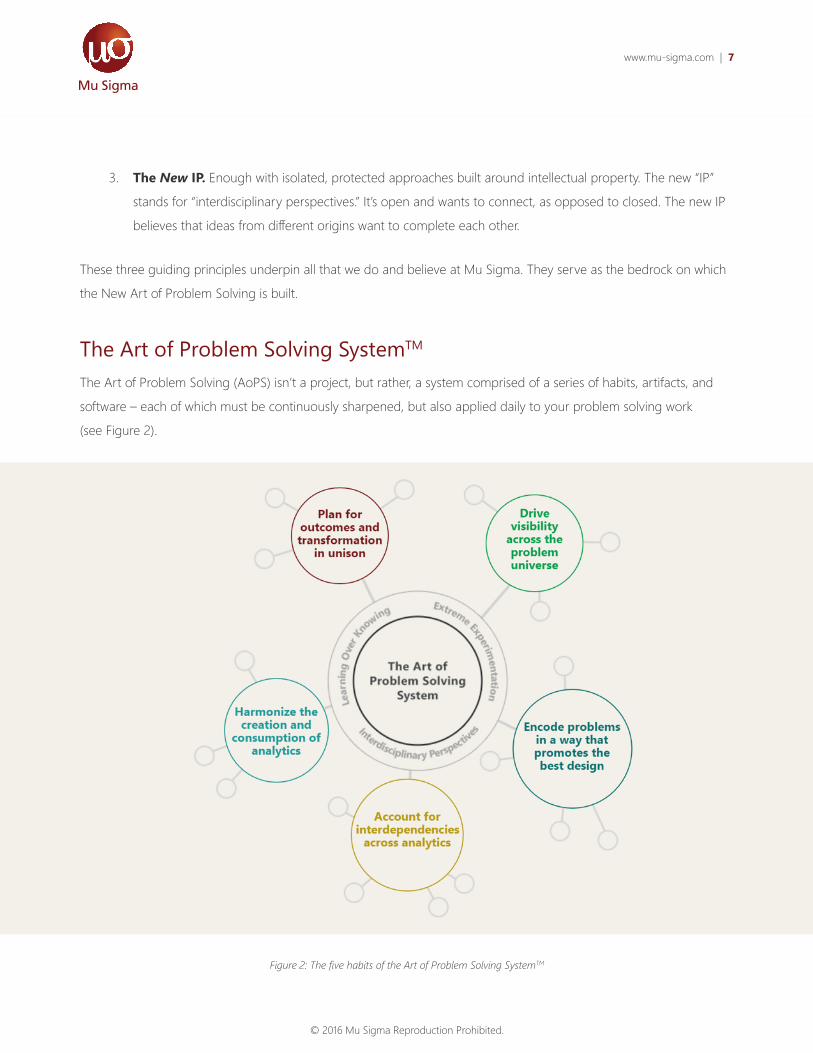
The Art of Problem Solving SystemTM
The Art of Problem Solving (AoPS) isn’t a project, but rather, a system comprised of a series of habits, artifacts, and
software – each of which must be continuously sharpened, but also applied daily to your problem solving work
(see Figure 2).
Figure 2: The five habits of the Art of Problem Solving SystemTM
www.mu-sigma.com | 8
© 2016 Mu Sigma Reproduction Prohibited.
This system can be an especially effective tool set for analytics centers of excellence (CoEs) or governing councils,
because those who orchestrate analytics efforts or are tasked with capability building can serve as the AoPS steward
and champion across a company. However, you’ll find that the system can also succeed in fully centralized or
decentralized governance models. We discuss governance models later in this paper.
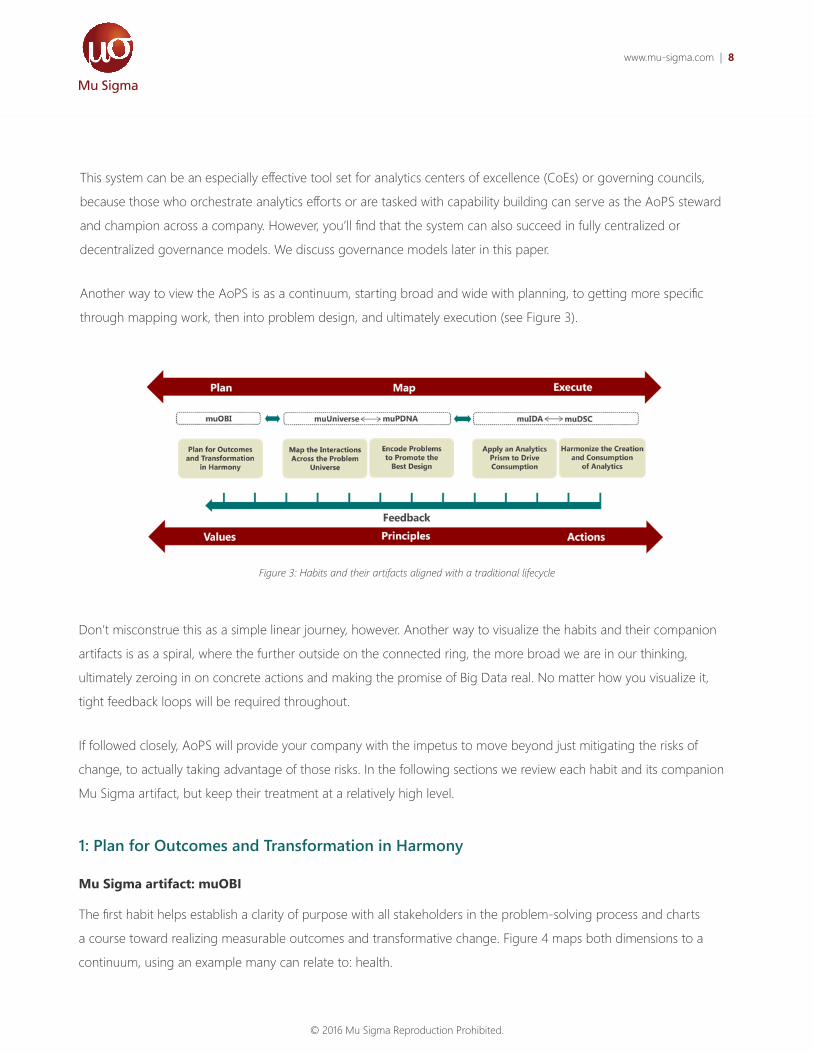
Another way to view the AoPS is as a continuum, starting broad and wide with planning, to getting more specific
through mapping work, then into problem design, and ultimately execution (see Figure 3).
Don’t misconstrue this as a simple linear journey, however. Another way to visualize the habits and their companion
artifacts is as a spiral, where the further outside on the connected ring, the more broad we are in our thinking,
ultimately zeroing in on concrete actions and making the promise of Big Data real. No matter how you visualize it,
tight feedback loops will be required throughout.
If followed closely, AoPS will provide your company with the impetus to move beyond just mitigating the risks of
change, to actually taking advantage of those risks. In the following sections we review each habit and its companion
Mu Sigma artifact, but keep their treatment at a relatively high level.
1: Plan for Outcomes and Transformation in Harmony
Mu Sigma artifact: muOBI
The first habit helps establish a clarity of purpose with all stakeholders in the problem-solving process and charts
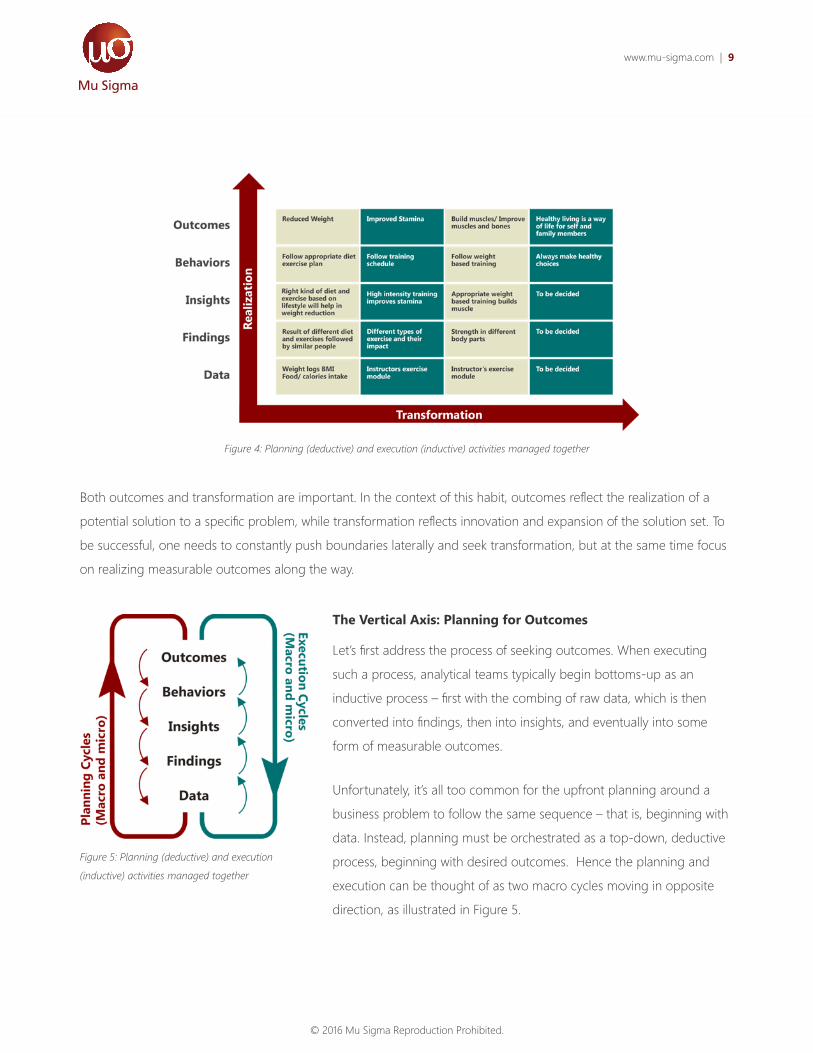
a course toward realizing measurable outcomes and transformative change. Figure 4 maps both dimensions to a
continuum, using an example many can relate to: health.
Figure 3: Habits and their artifacts aligned with a traditional lifecycle
www.mu-sigma.com | 9
© 2016 Mu Sigma Reproduction Prohibited.
Both outcomes and transformation are important. In the context of this habit, outcomes reflect the realization of a
potential solution to a specific problem, while transformation reflects innovation and expansion of the solution set. To
be successful, one needs to constantly push boundaries laterally and seek transformation, but at the same time focus
on realizing measurable outcomes along the way.
The Vertical Axis: Planning for Outcomes
Let’s first address the process of seeking outcomes. When executing
such a process, analytical teams typically begin bottoms-up as an
inductive process – first with the combing of raw data, which is then
converted into findings, then into insights, and eventually into some
form of measurable outcomes.
Unfortunately, it’s all too common for the upfront planning around a
business problem to follow the same sequence – that is, beginning with
data. Instead, planning must be orchestrated as a top-down, deductive
process, beginning with desired outcomes. Hence the planning and
execution can be thought of as two macro cycles moving in opposite
direction, as illustrated in Figure 5.
Figure 4: Planning (deductive) and execution (inductive) activities managed together
Figure 5: Planning (deductive) and execution (inductive) activities managed together
www.mu-sigma.com | 10
© 2016 Mu Sigma Reproduction Prohibited.
In our planning, we associate each business problem or network of business problems to be solved with a set of
desired outcomes, behaviors, insights (and findings and data). In effect, the muOBI artifact facilitates a “decision
design” process that backs into desired outcomes.
What’s different about this planning approach versus other traditional models is that the latter often describe
outcomes as derivatives of actions. But the “rational human” theories that have dominated economic and
management science theory, on which this traditional approach is based, have been disproven.
Simply put, human beings don’t always make rational choices. The actions they take come more from their behaviors
and habits than from pure logic. As such, muOBI identifies the customer or employee behaviors that we want our
analyses to shape, and the insights needed to trigger those behaviors. In short, when trying to solve a problem, you
must strive to humanize the insights.
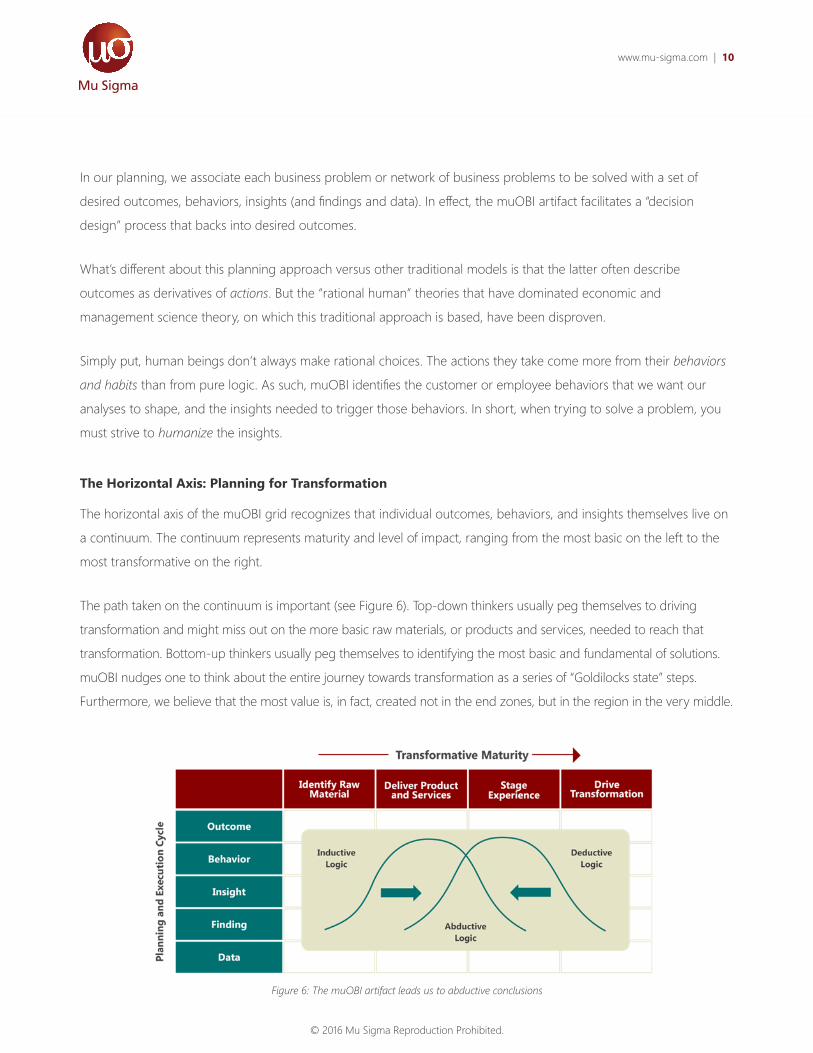
The Horizontal Axis: Planning for Transformation
The horizontal axis of the muOBI grid recognizes that individual outcomes, behaviors, and insights themselves live on
a continuum. The continuum represents maturity and level of impact, ranging from the most basic on the left to the
most transformative on the right.
The path taken on the continuum is important (see Figure 6). Top-down thinkers usually peg themselves to driving
transformation and might miss out on the more basic raw materials, or products and services, needed to reach that
transformation. Bottom-up thinkers usually peg themselves to identifying the most basic and fundamental of solutions.
muOBI nudges one to think about the entire journey towards transformation as a series of “Goldilocks state” steps.
Furthermore, we believe that the most value is, in fact, created not in the end zones, but in the region in the very middle.
Figure 6: The muOBI artifact leads us to abductive conclusions
www.mu-sigma.com | 11
© 2016 Mu Sigma Reproduction Prohibited.
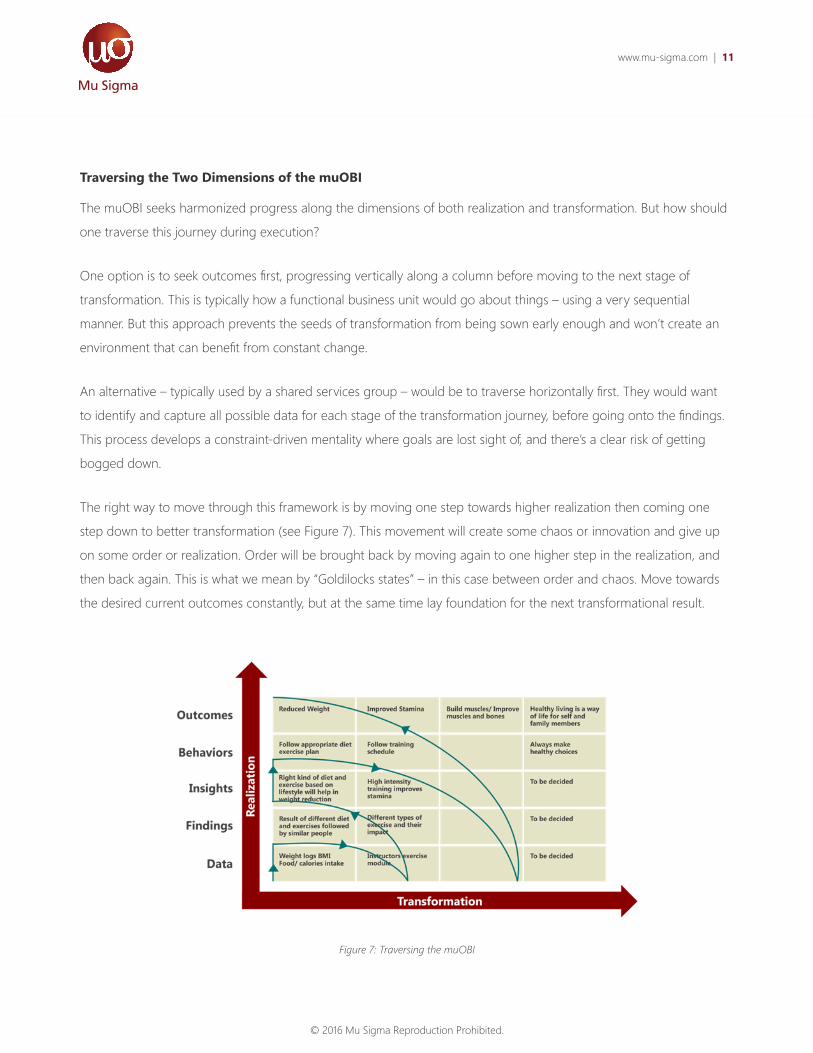
Traversing the Two Dimensions of the muOBI
The muOBI seeks harmonized progress along the dimensions of both realization and transformation. But how should
one traverse this journey during execution?
One option is to seek outcomes first, progressing vertically along a column before moving to the next stage of
transformation. This is typically how a functional business unit would go about things – using a very sequential
manner. But this approach prevents the seeds of transformation from being sown early enough and won’t create an
environment that can benefit from constant change.
An alternative – typically used by a shared services group – would be to traverse horizontally first. They would want
to identify and capture all possible data for each stage of the transformation journey, before going onto the findings.
This process develops a constraint-driven mentality where goals are lost sight of, and there’s a clear risk of getting
bogged down.
The right way to move through this framework is by moving one step towards higher realization then coming one
step down to better transformation (see Figure 7). This movement will create some chaos or innovation and give up
on some order or realization. Order will be brought back by moving again to one higher step in the realization, and
then back again. This is what we mean by “Goldilocks states” – in this case between order and chaos. Move towards
the desired current outcomes constantly, but at the same time lay foundation for the next transformational result.
Figure 7: Traversing the muOBI
www.mu-sigma.com | 12
© 2016 Mu Sigma Reproduction Prohibited.
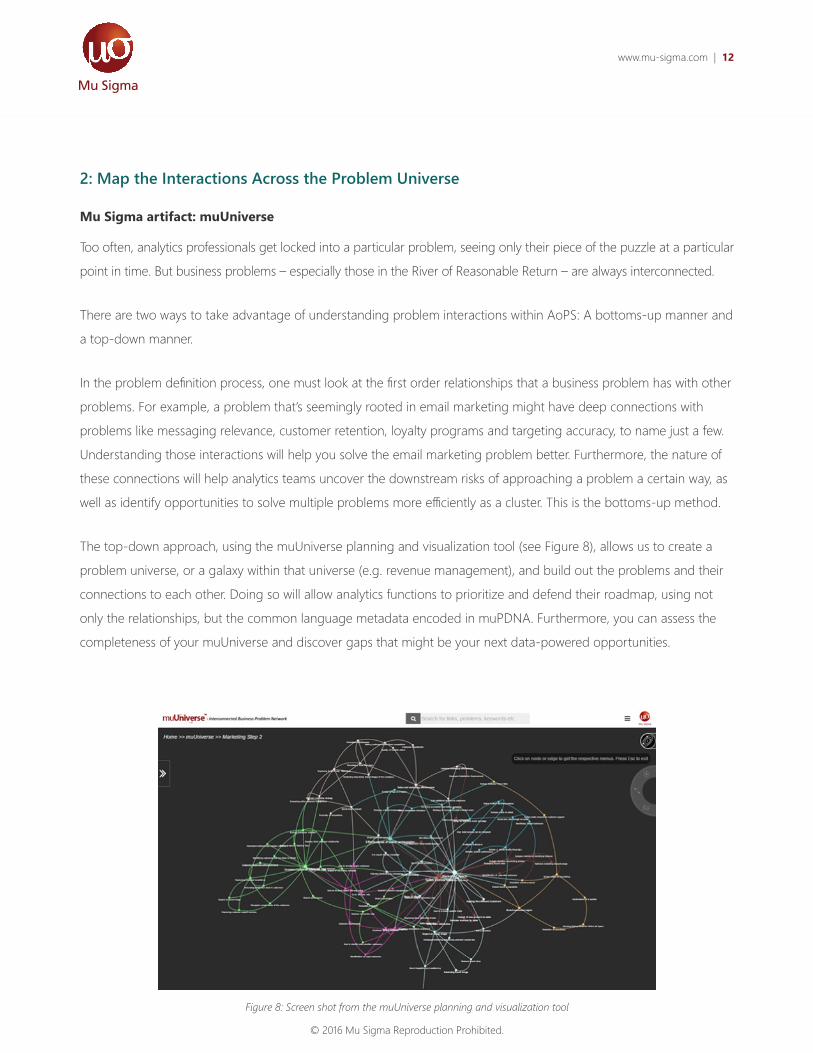
2: Map the Interactions Across the Problem Universe
Mu Sigma artifact: muUniverse
Too often, analytics professionals get locked into a particular problem, seeing only their piece of the puzzle at a particular
point in time. But business problems – especially those in the River of Reasonable Return – are always interconnected.
There are two ways to take advantage of understanding problem interactions within AoPS: A bottoms-up manner and
a top-down manner.
In the problem definition process, one must look at the first order relationships that a business problem has with other
problems. For example, a problem that’s seemingly rooted in email marketing might have deep connections with
problems like messaging relevance, customer retention, loyalty programs and targeting accuracy, to name just a few.
Understanding those interactions will help you solve the email marketing problem better. Furthermore, the nature of
these connections will help analytics teams uncover the downstream risks of approaching a problem a certain way, as
well as identify opportunities to solve multiple problems more efficiently as a cluster. This is the bottoms-up method.
The top-down approach, using the muUniverse planning and visualization tool (see Figure 8), allows us to create a
problem universe, or a galaxy within that universe (e.g. revenue management), and build out the problems and their
connections to each other. Doing so will allow analytics functions to prioritize and defend their roadmap, using not
only the relationships, but the common language metadata encoded in muPDNA. Furthermore, you can assess the
completeness of your muUniverse and discover gaps that might be your next data-powered opportunities.
Figure 8: Screen shot from the muUniverse planning and visualization tool
www.mu-sigma.com | 13
© 2016 Mu Sigma Reproduction Prohibited.
Upon closer inspection, you’ll see that the bottoms-up approach is algorithmic and machine-oriented, while the
top-down approach is more heuristic and manual. The muUniverse application enables us to harmonize these two
important perspectives.
In either the top-down or bottoms-up approach, we define and visually depict relationships between problems the
same way. There’s an element of distance, which accounts for how closely related the two problems are. We also
use the thickness of the line connecting two nodes to describe the extent to which they share common business
objectives, factors, questions, hypotheses and data elements. These characteristics, along with the fact that our
muPDNA application is embedded within muUniverse, will help you instill a common language for problem solving
across your organization.
3: Encode Problems to Promote the Best Design
Mu Sigma artifact: muPDNA
The dynamic nature of businesses forces organizations to solve multiple problems on a daily basis, especially those
problems in the River of Reasonable Return. These problems start off as muddy or fuzzy before becoming clearer, forcing
analytics groups to feel their way through the smoke in order to define, articulate and solve business problems the right
way. Ensuring that organizations can define problems in a consistent and structured manner is key. A common language
is required.
Asking the right questions is also key in this step. Let’s face it, traditional education and corporate performance systems
test us on the ability to find answers, not on the questions we asked on the way to the answer. In a world of increasing
change, questions are more important than answers.
At Mu Sigma, we consider business problems to have an underlying DNA. In fact, the artifact muPDNA stands for
“Problem DNA.” By encoding a problem’s DNA early in the process, we convert it into a construct, or common language,
that can be shared across the organization and retrieved for use in future work. We encode each of the thousands of
business problems that we work on with clients into our proprietary muPDNA software application. This encoding effort
breaks into three parts:
» A design element, which pushes us to front-load our thinking and have constructive debates earlier on in
the problem solving process – so that rework is avoided later. Here, we think through the best configuration
for the business problem, so as to get to the right key questions. This element is most important, as it
captures our design for tackling the problem.
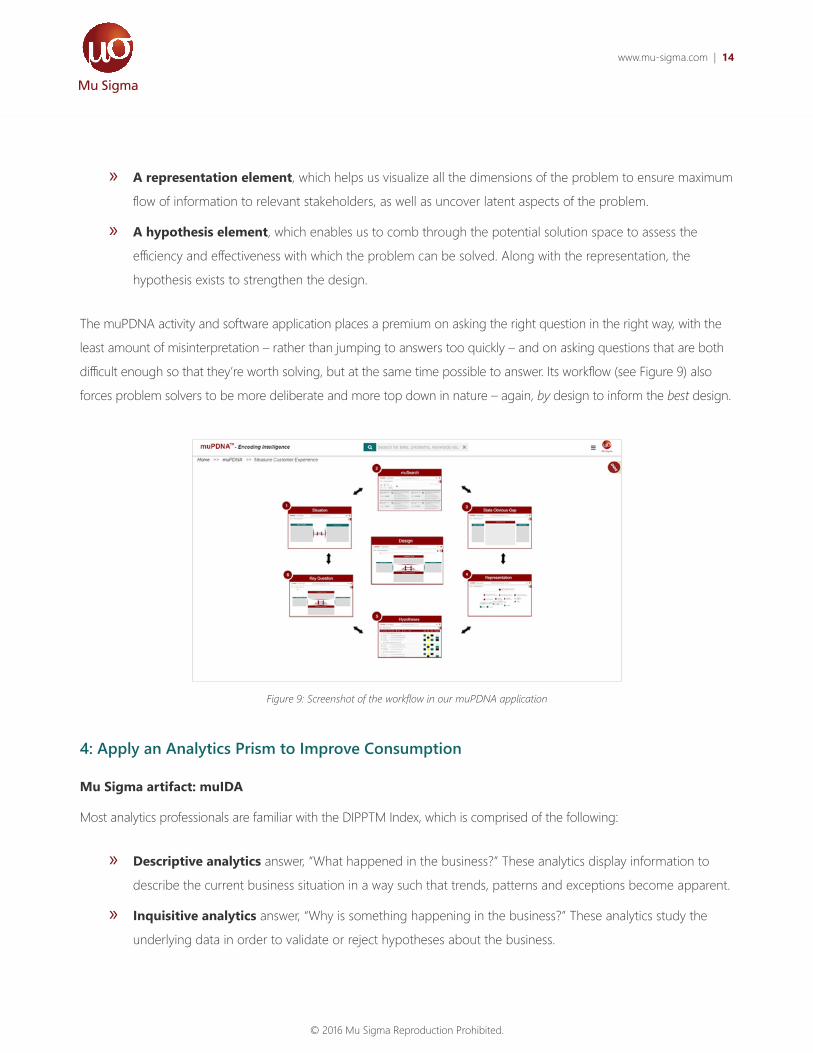
www.mu-sigma.com | 14
© 2016 Mu Sigma Reproduction Prohibited.
» A representation element, which helps us visualize all the dimensions of the problem to ensure maximum
flow of information to relevant stakeholders, as well as uncover latent aspects of the problem.
» A hypothesis element, which enables us to comb through the potential solution space to assess the
efficiency and effectiveness with which the problem can be solved. Along with the representation, the
hypothesis exists to strengthen the design.
The muPDNA activity and software application places a premium on asking the right question in the right way, with the
least amount of misinterpretation – rather than jumping to answers too quickly – and on asking questions that are both
difficult enough so that they’re worth solving, but at the same time possible to answer. Its workflow (see Figure 9) also
forces problem solvers to be more deliberate and more top down in nature – again, by design to inform the best design.
4: Apply an Analytics Prism to Improve Consumption
Mu Sigma artifact: muIDA
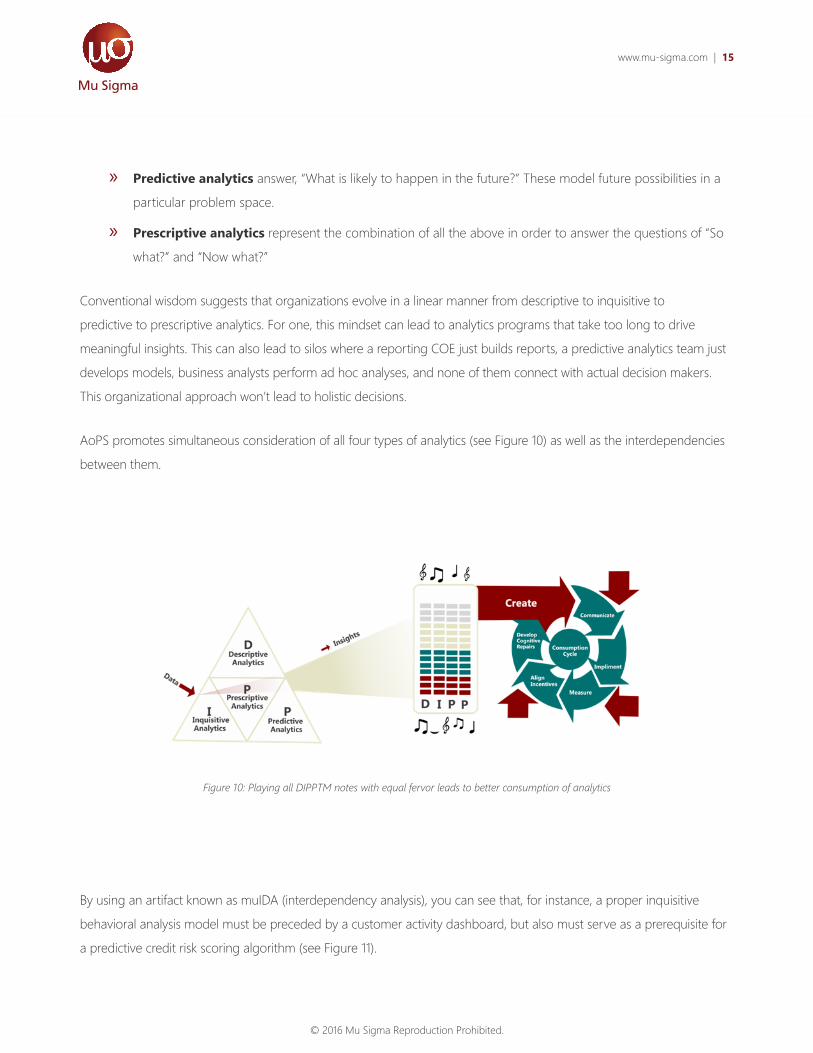
Most analytics professionals are familiar with the DIPPTM Index, which is comprised of the following:
» Descriptive analytics answer, “What happened in the business?” These analytics display information to
describe the current business situation in a way such that trends, patterns and exceptions become apparent.
» Inquisitive analytics answer, “Why is something happening in the business?” These analytics study the
underlying data in order to validate or reject hypotheses about the business.
Figure 9: Screenshot of the workflow in our muPDNA application
www.mu-sigma.com | 15
© 2016 Mu Sigma Reproduction Prohibited.
» Predictive analytics answer, “What is likely to happen in the future?” These model future possibilities in a
particular problem space.
» Prescriptive analytics represent the combination of all the above in order to answer the questions of “So
what?” and “Now what?”
Conventional wisdom suggests that organizations evolve in a linear manner from descriptive to inquisitive to
predictive to prescriptive analytics. For one, this mindset can lead to analytics programs that take too long to drive
meaningful insights. This can also lead to silos where a reporting COE just builds reports, a predictive analytics team just
develops models, business analysts perform ad hoc analyses, and none of them connect with actual decision makers.
This organizational approach won’t lead to holistic decisions.
AoPS promotes simultaneous consideration of all four types of analytics (see Figure 10) as well as the interdependencies
between them.
Figure 10: Playing all DIPPTM notes with equal fervor leads to better consumption of analytics
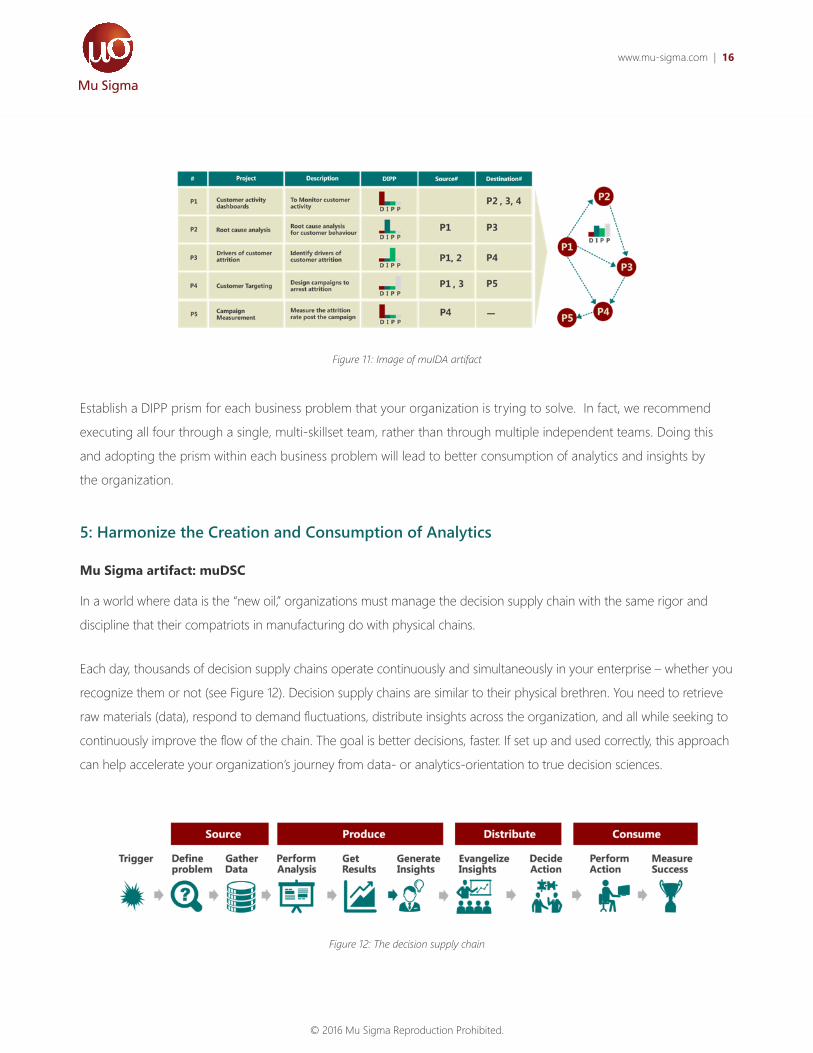
By using an artifact known as muIDA (interdependency analysis), you can see that, for instance, a proper inquisitive
behavioral analysis model must be preceded by a customer activity dashboard, but also must serve as a prerequisite for
a predictive credit risk scoring algorithm (see Figure 11).
www.mu-sigma.com | 16
© 2016 Mu Sigma Reproduction Prohibited.
Establish a DIPP prism for each business problem that your organization is trying to solve. In fact, we recommend
executing all four through a single, multi-skillset team, rather than through multiple independent teams. Doing this
and adopting the prism within each business problem will lead to better consumption of analytics and insights by
the organization.
5: Harmonize the Creation and Consumption of Analytics
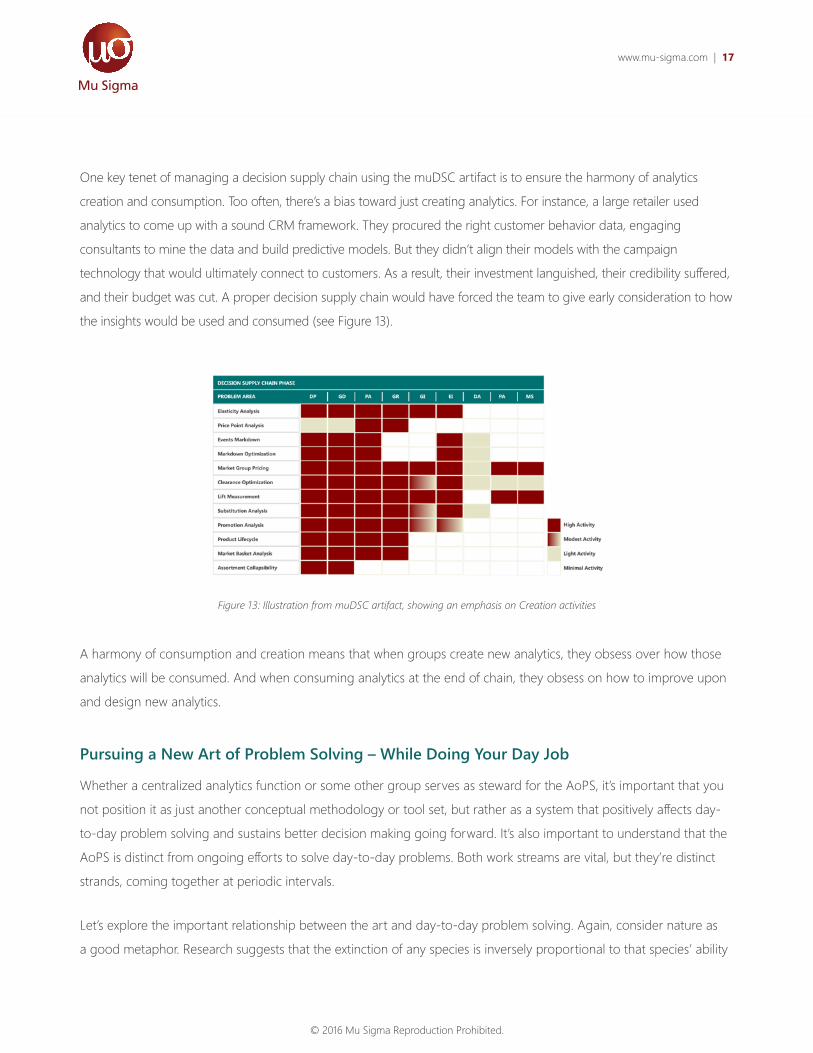
Mu Sigma artifact: muDSC
In a world where data is the “new oil,” organizations must manage the decision supply chain with the same rigor and
discipline that their compatriots in manufacturing do with physical chains.
Each day, thousands of decision supply chains operate continuously and simultaneously in your enterprise – whether you
recognize them or not (see Figure 12). Decision supply chains are similar to their physical brethren. You need to retrieve
raw materials (data), respond to demand fluctuations, distribute insights across the organization, and all while seeking to
continuously improve the flow of the chain. The goal is better decisions, faster. If set up and used correctly, this approach
can help accelerate your organization’s journey from data- or analytics-orientation to true decision sciences.
Figure 11: Image of muIDA artifact
Figure 12: The decision supply chain
www.mu-sigma.com | 17
© 2016 Mu Sigma Reproduction Prohibited.
One key tenet of managing a decision supply chain using the muDSC artifact is to ensure the harmony of analytics
creation and consumption. Too often, there’s a bias toward just creating analytics. For instance, a large retailer used
analytics to come up with a sound CRM framework. They procured the right customer behavior data, engaging
consultants to mine the data and build predictive models. But they didn’t align their models with the campaign
technology that would ultimately connect to customers. As a result, their investment languished, their credibility suffered,
and their budget was cut. A proper decision supply chain would have forced the team to give early consideration to how
the insights would be used and consumed (see Figure 13).
A harmony of consumption and creation means that when groups create new analytics, they obsess over how those
analytics will be consumed. And when consuming analytics at the end of chain, they obsess on how to improve upon
and design new analytics.
Pursuing a New Art of Problem Solving – While Doing Your Day Job
Whether a centralized analytics function or some other group serves as steward for the AoPS, it’s important that you
not position it as just another conceptual methodology or tool set, but rather as a system that positively affects day-
to-day problem solving and sustains better decision making going forward. It’s also important to understand that the
AoPS is distinct from ongoing efforts to solve day-to-day problems. Both work streams are vital, but they’re distinct
strands, coming together at periodic intervals.
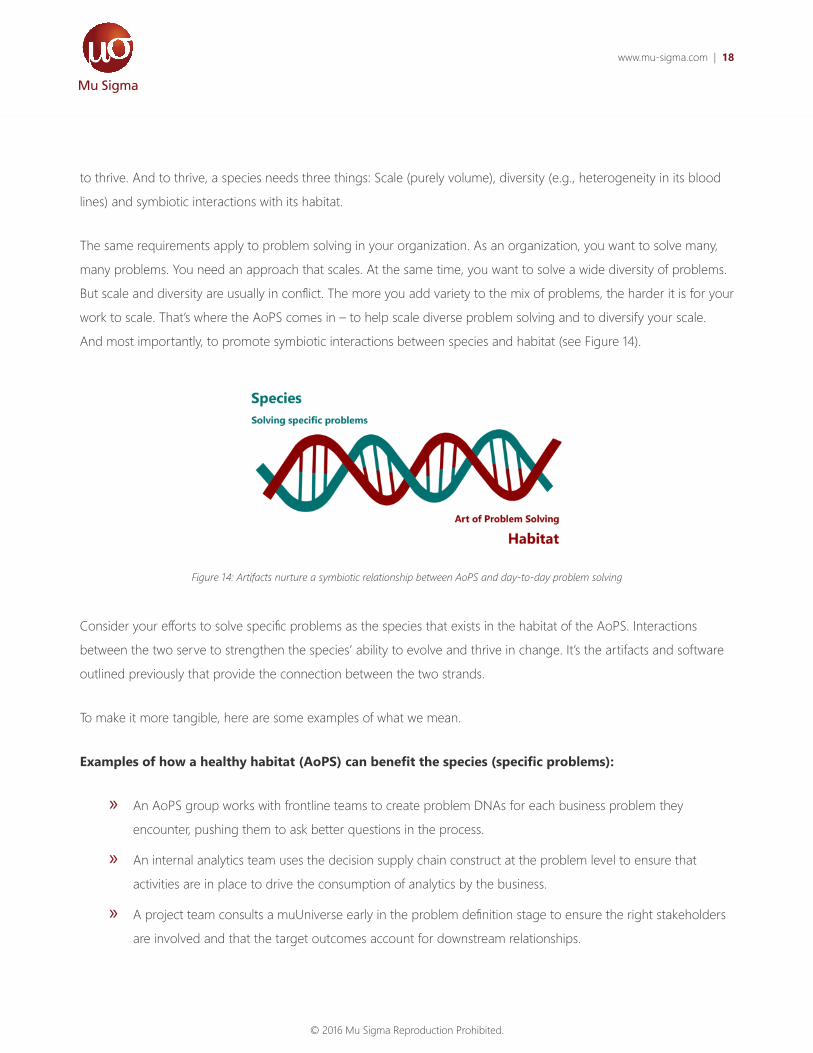
Let’s explore the important relationship between the art and day-to-day problem solving. Again, consider nature as
a good metaphor. Research suggests that the extinction of any species is inversely proportional to that species’ ability
Figure 13: Illustration from muDSC artifact, showing an emphasis on Creation activities
www.mu-sigma.com | 18
© 2016 Mu Sigma Reproduction Prohibited.
to thrive. And to thrive, a species needs three things: Scale (purely volume), diversity (e.g., heterogeneity in its blood
lines) and symbiotic interactions with its habitat.
The same requirements apply to problem solving in your organization. As an organization, you want to solve many,
many problems. You need an approach that scales. At the same time, you want to solve a wide diversity of problems.
But scale and diversity are usually in conflict. The more you add variety to the mix of problems, the harder it is for your
work to scale. That’s where the AoPS comes in – to help scale diverse problem solving and to diversify your scale.
And most importantly, to promote symbiotic interactions between species and habitat (see Figure 14).
Consider your efforts to solve specific problems as the species that exists in the habitat of the AoPS. Interactions
between the two serve to strengthen the species’ ability to evolve and thrive in change. It’s the artifacts and software
outlined previously that provide the connection between the two strands.
To make it more tangible, here are some examples of what we mean.
Examples of how a healthy habitat (AoPS) can benefit the species (specific problems):
» An AoPS group works with frontline teams to create problem DNAs for each business problem they
encounter, pushing them to ask better questions in the process.
» An internal analytics team uses the decision supply chain construct at the problem level to ensure that
activities are in place to drive the consumption of analytics by the business.
» A project team consults a muUniverse early in the problem definition stage to ensure the right stakeholders
are involved and that the target outcomes account for downstream relationships.
Figure 14: Artifacts nurture a symbiotic relationship between AoPS and day-to-day problem solving
www.mu-sigma.com | 19
© 2016 Mu Sigma Reproduction Prohibited.
Examples of how a species (specific problems) can improve the health of the habitat (AoPS):
» A project team identifies first and second order problem dependencies to uncover areas not being
adequately served by the analytics group, feeding into a new muUniverse roadmap.
» An analyst looks across multiple decision supply chains to identify common attributes of projects that
materially drive consumption, feeding those insights back to a central team.
» A central analytics group analyzes multiple muIDA artifacts from across the business to identify patterns
where one aspect of DIPP is frequently underutilized, and a possible skill-set bias is seeping in (e.g., the BI
team just focuses on creating Tableau reports).
Charting the CourseThis section addresses how to organize and govern an environment where the AoPS and the day-to-day grind of
solving specific problems operate in harmony. Similar to five habits, there are five critical cultural attributes that will
nurture both habitat and species.
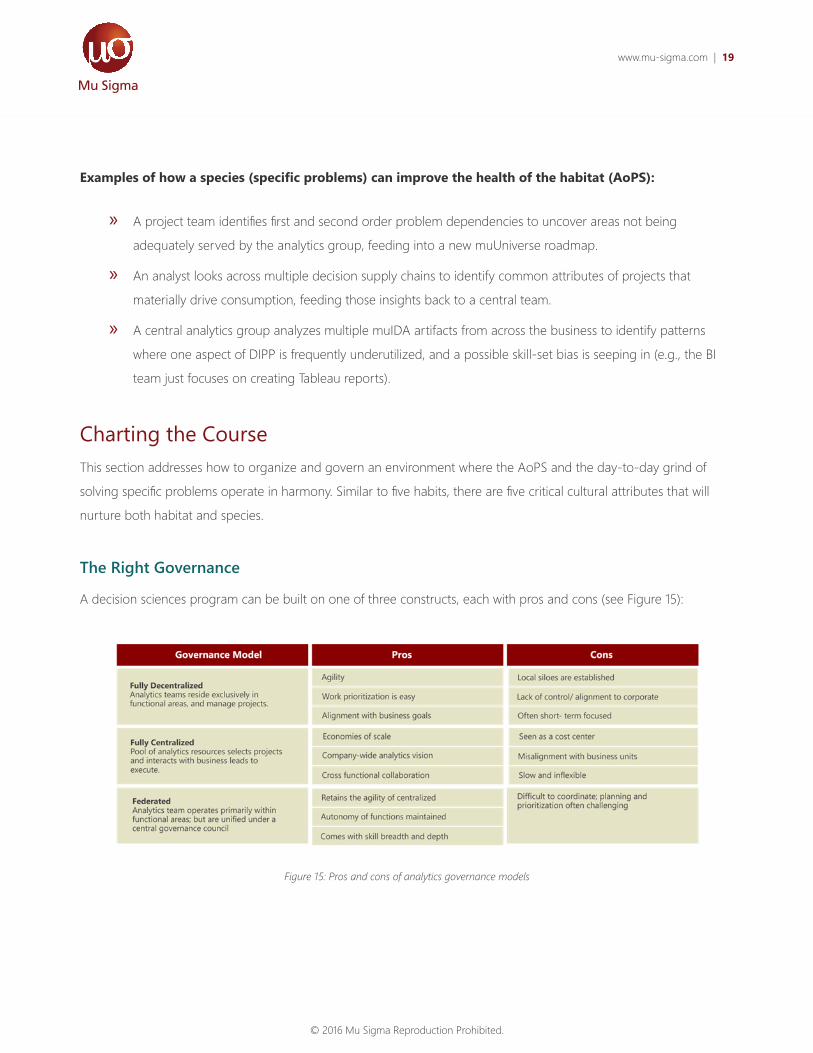
The Right Governance
A decision sciences program can be built on one of three constructs, each with pros and cons (see Figure 15):
Figure 15: Pros and cons of analytics governance models
www.mu-sigma.com | 20
© 2016 Mu Sigma Reproduction Prohibited.
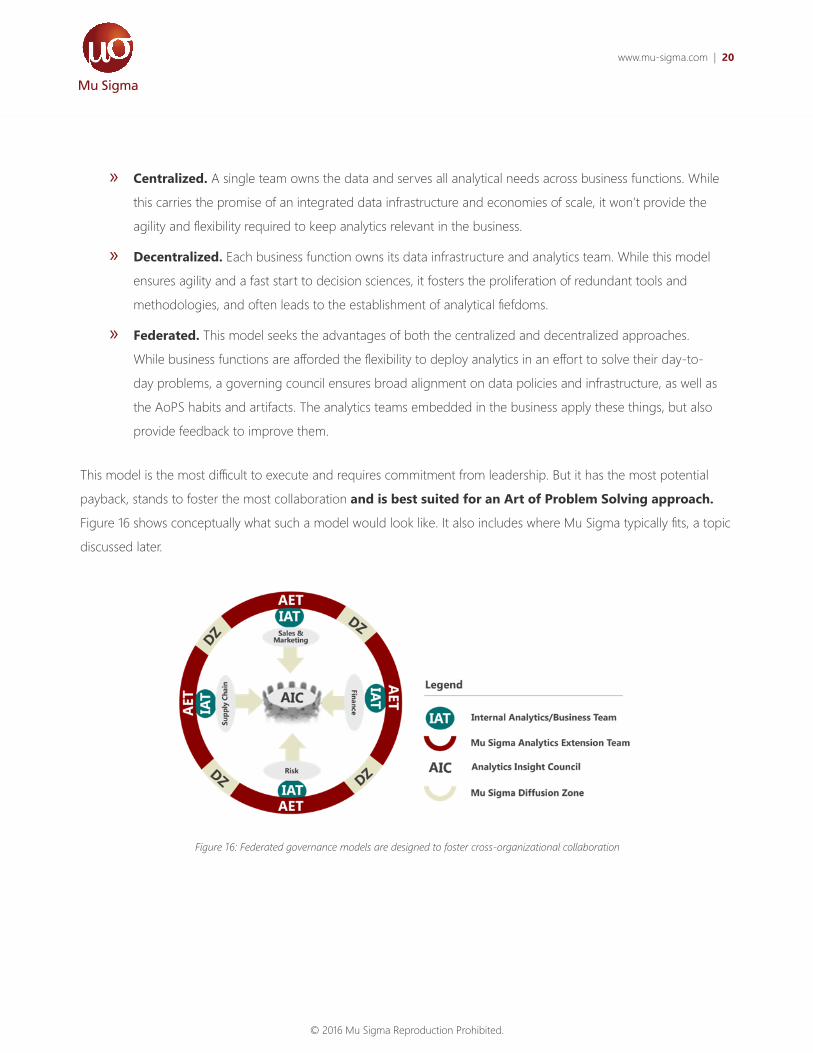
» Centralized. A single team owns the data and serves all analytical needs across business functions. While
this carries the promise of an integrated data infrastructure and economies of scale, it won’t provide the
agility and flexibility required to keep analytics relevant in the business.
» Decentralized. Each business function owns its data infrastructure and analytics team. While this model
ensures agility and a fast start to decision sciences, it fosters the proliferation of redundant tools and
methodologies, and often leads to the establishment of analytical fiefdoms.
» Federated. This model seeks the advantages of both the centralized and decentralized approaches.
While business functions are afforded the flexibility to deploy analytics in an effort to solve their day-to-
day problems, a governing council ensures broad alignment on data policies and infrastructure, as well as
the AoPS habits and artifacts. The analytics teams embedded in the business apply these things, but also
provide feedback to improve them.
This model is the most difficult to execute and requires commitment from leadership. But it has the most potential
payback, stands to foster the most collaboration and is best suited for an Art of Problem Solving approach.
Figure 16 shows conceptually what such a model would look like. It also includes where Mu Sigma typically fits, a topic
discussed later.
Figure 16: Federated governance models are designed to foster cross-organizational collaboration
www.mu-sigma.com | 21
© 2016 Mu Sigma Reproduction Prohibited.
The Right Culture
An environment conducive to the New Art of Problem Solving, and an ability to capitalize on change rather than fear
it, requires certain cultural characteristics or practices. We highlight five here, all of which are interdependent, and
some of which we readily pull from prior art:
1. A growth mindset. Most organizations look at big data as a collection of datasets to be harvested, skillsets
to be recruited and toolsets to be acquired. But again, data is the effect; change is the cause. Benefitting
from the change brought upon your organization will mostly require the right mindset, echoing the logic
of Stanford University professor, Carol Dweck. In her book “Mindset: The New Psychology of Success” she
compares a “fixed mindset” to a “growth mindset.”
In the fixed mindset universe, your qualities are fixed and immutable; you play the hand that fate deals you.
In the growth mindset universe, your qualities are flexible and changeable through learning and practice,
which means that your efforts – rather than cruel fate – determine the outcome of the game. We believe
a “problem solving mindset” is akin to a growth mindset, and therefore supersedes skillsets, toolsets and
datasets.
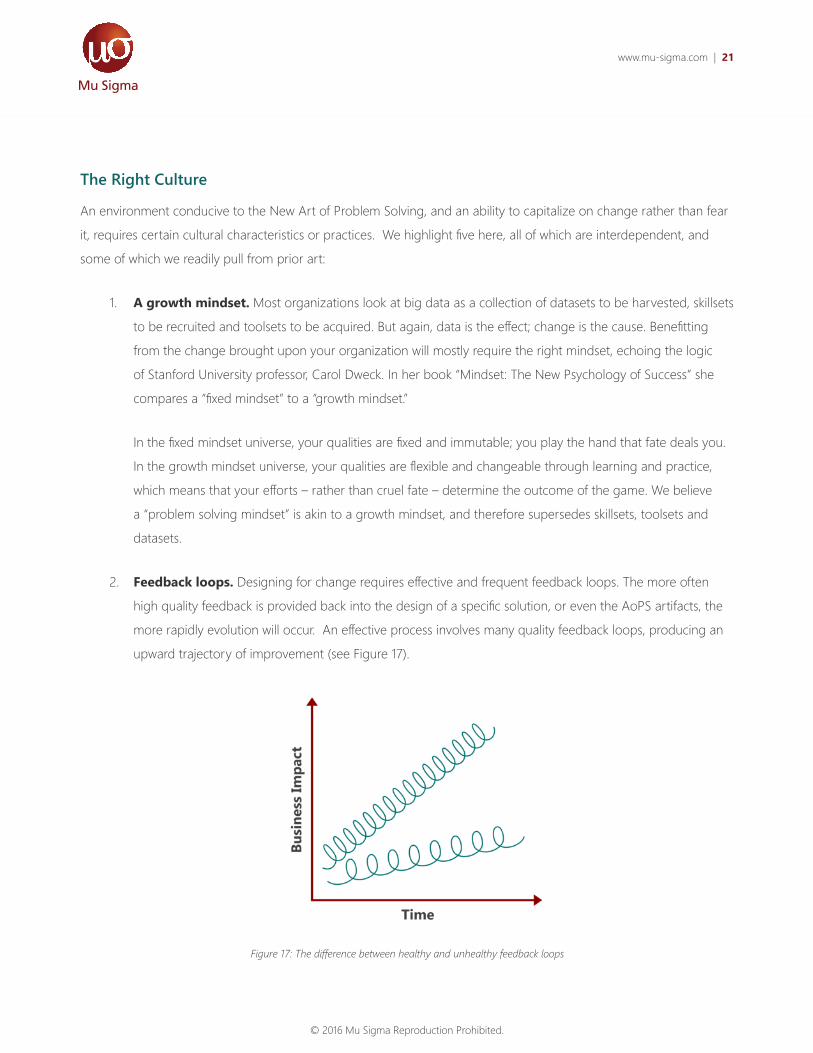
2. Feedback loops. Designing for change requires effective and frequent feedback loops. The more often
high quality feedback is provided back into the design of a specific solution, or even the AoPS artifacts, the
more rapidly evolution will occur. An effective process involves many quality feedback loops, producing an
upward trajectory of improvement (see Figure 17).
Figure 17: The difference between healthy and unhealthy feedback loops
www.mu-sigma.com | 22
© 2016 Mu Sigma Reproduction Prohibited.
A process where mistakes or weaknesses go unidentified produces a slower upward trajectory. In fact, if
there are too few and/or poor quality feedback loops, you will see a decline in performance because you
won’t uncover those problems with the potential to derail you.
3. Continuous work streams. Organizations looking to institute a New Art of Problem Solving shouldn’t
think about analytics as a project or initiative, but rather as an ongoing activity. After all, learning is a
continuous process and requires constant attention. The ability to enable better decisions should pervade
every function within the organization and get inculcated into its DNA. A continuous mindset has a better
chance of doing this than a series of projects. Furthermore, a continuous work stream environment,
supported by the right governance model, will do a better job at uncovering latent needs, new ways of
thinking and opportunities for experimentation.
This also relates to how you should think about your problem space. The RORR and the interconnected
nature of its business problems demand a continuous approach. In such an environment, thinking about
discrete projects with specific start and end dates is non-productive. In our river and nature metaphor,
projects represent stocks while a continuous work stream mindset represents a flow. This is why, in Mu Sigma
partnerships with clients, we talk in terms of problems or opportunities and avoid the term “project.”
4. Constant prototyping. Corporate IT has long driven automation and efficiency into business processes, and
it’s historically worked well because the business processes being automated were relatively static. But in a world
of change, this breaks down and the conflict between business users and IT groups has intensified. Business
demands creativity, agility, and responsiveness, while IT has responded with process, security and standardization.
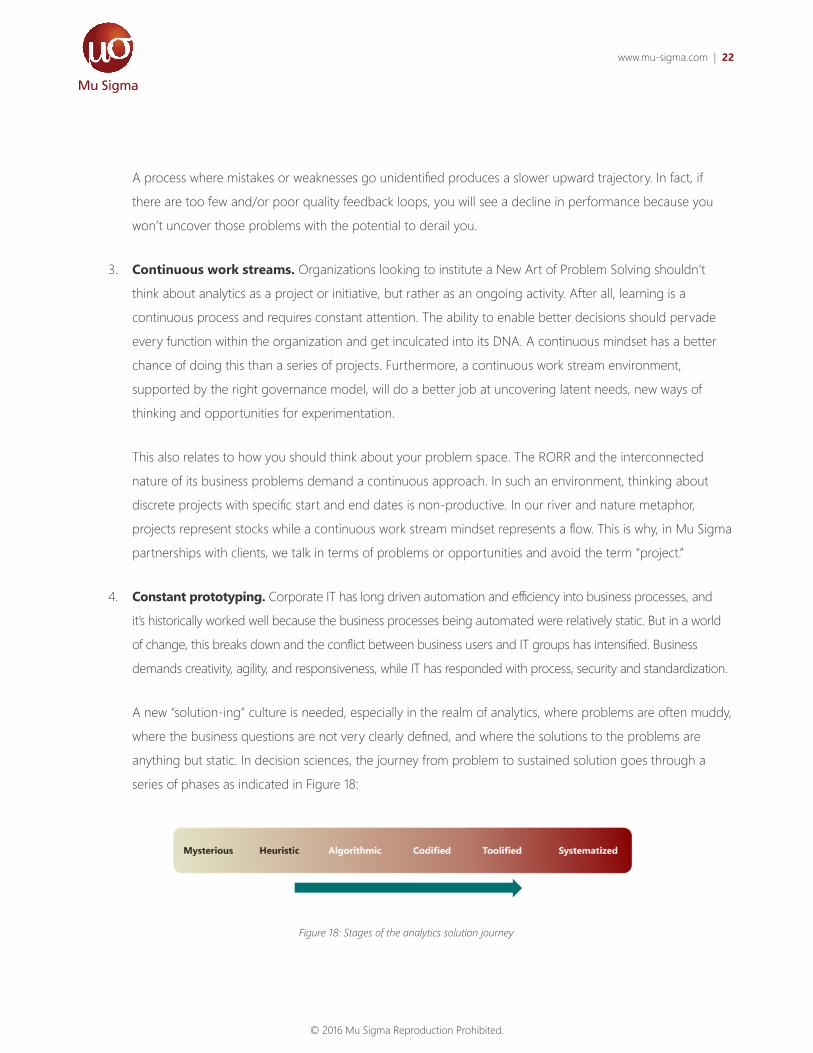
A new “solution-ing” culture is needed, especially in the realm of analytics, where problems are often muddy,
where the business questions are not very clearly defined, and where the solutions to the problems are
anything but static. In decision sciences, the journey from problem to sustained solution goes through a
series of phases as indicated in Figure 18:
Figure 18: Stages of the analytics solution journey
www.mu-sigma.com | 23
© 2016 Mu Sigma Reproduction Prohibited.
But it’s important to recognize that not all solutions will go through this path completely. Some short
duration problems might stop at the Algorithmic stage or at the Tool-ification stage. Even if you reach
the final Systematization stage for a particular problem, a change in business conditions might require
you to revisit the problem and possibly restart the journey. Solution specifications and requirements are
never frozen, so expect and accept volatility, and be ever ready to change and refine the solution with
constant prototyping.
5. Signals of dysfunctional behavior. Builders of decision sciences groups must appreciate that they are,
in fact, creating teams of individuals from possibly disparate backgrounds who must work together toward
common goals. Hence, it falls upon the leaders to watch out for signs of team dysfunction. According to
Patrick Lencioni’s 2002 book, the five dysfunctions are: absence of trust, fear of conflict, lack of commitment,
accountability avoidance and inattention to results. Be sure to design mechanisms that signal dysfunctional
behavior, and develop corrective interventions.
www.mu-sigma.com | 24
© 2016 Mu Sigma Reproduction Prohibited.
Summary and More InformationAt Mu Sigma, we believe that organizations needn’t try to cope with or manage change, but should strive to capitalize
on it. You should have a hold on the roadmap of your organization’s analytical problems. We want your work to drive
clear outcomes and behavioral change. We are one of the largest analytics and decision sciences firms in the world.
We help enterprises institutionalize data-driven decision making and harness the potential of Big Data.
The purpose of our Art of Problem Solving SystemTM is to instill large enterprises with a new approach to decision
making. It is designed to not only match today’s incredibly fast changing business environment, but to help firms like
yours benefit from it. AoPS encompasses five habits and an underlying platform for decision sciences, which provide
structured problem solving and insight generation approaches supported by guided, white-box analytics.
Contact us today to attend an upcoming workshop on the New Art of Problem Solving and to find out how our
system can help your business capitalize on change.
For more information, visit www.mu-sigma.com or follow us on Twitter @MuSigmaInc
ABOUT US
Mu Sigma is a category-defining decision sciences and big data analytics company, helping enterprises systematize better data-driven decision making. The company’s interdisciplinary approach and integrated ecosystem of platform, processes and people are redefining how companies approach problem solving in areas of marketing, risk and supply chain. With more than 3,500 decision scientists working across 10 industries, Mu Sigma is consistently validated as the preferred decision sciences and analytics partner for 140 of the Fortune 500.
ADDRESS
Mu Sigma Inc.3400 Dundee Road, Suite 160, Northbrook, IL 60062Tel: +1 (847) 919-0445
CONTACT US