Embed Size (px)
Citation preview
The Need for Farmworker
Housing in Florida
Prepared for Florida Housing Finance Corporation
227 N. Bronough St., Suite 5000Tallahassee, Florida 32301
Prepared by Shimberg Center for Housing Studies
University of FloridaP. O. Box 115703
Gainesville, Florida 32611
The Need for Farmworker Housing in Florida
July 16, 2010
Prepared for Florida Housing Finance Corporation 227 N. Bronough St., Suite 5000 Tallahassee, Florida 32301-1329
Prepared by Laura Abernathy Shimberg Center for Housing Studies
University of Florida P. O. Box 115703
Gainesville, Florida 32611-5703
TABLE OF CONTENTS
EXECUTIVE SUMMARY 1
INTRODUCTION 3
I. METHODOLOGY 4
II. FARMWORKER POPULATION AND HOUSEHOLD ESTIMATES 8
III. INCOMES AND AFFORDABLE RENT RANGES FOR FARMWORKER HOUSEHOLDS 18
IV. FARMWORKER HOUSING SUPPLY 23
V. NEED ESTIMATE: COMPARISON OF SUPPLY AND HOUSEHOLDS 28
VI. DATA LIMITATIONS 35
REFERENCES 36
1
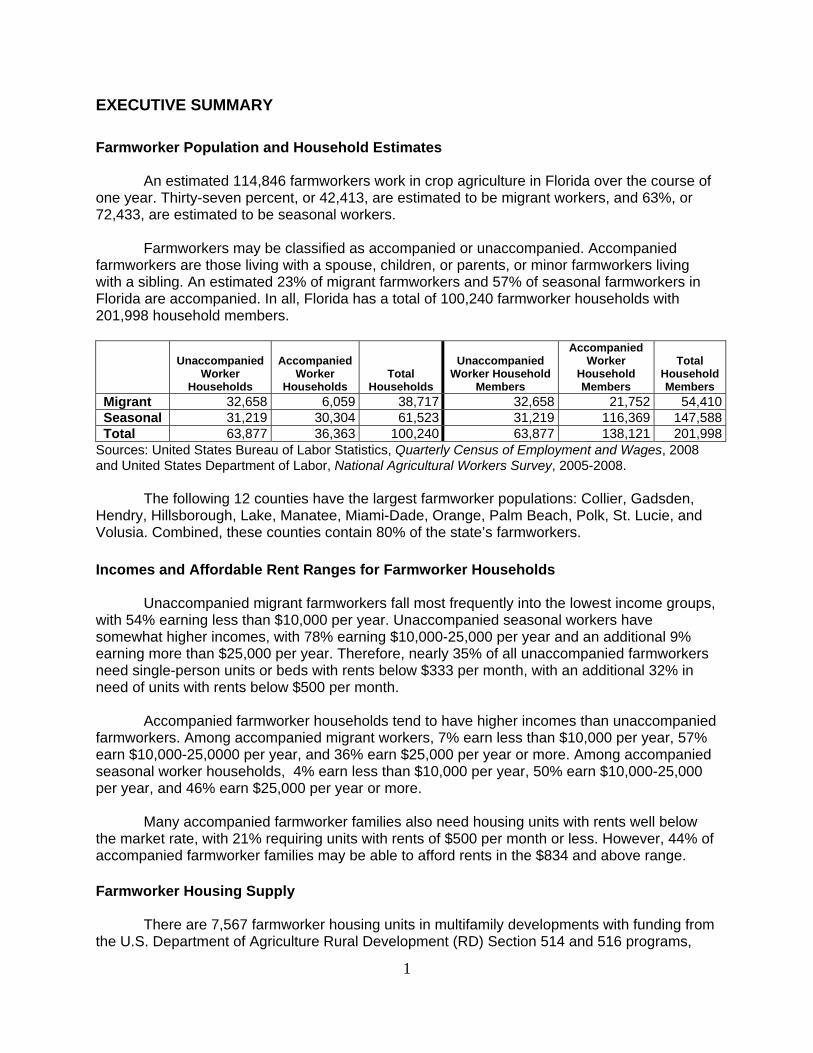
EXECUTIVE SUMMARY Farmworker Population and Household Estimates
An estimated 114,846 farmworkers work in crop agriculture in Florida over the course of
one year. Thirty-seven percent, or 42,413, are estimated to be migrant workers, and 63%, or 72,433, are estimated to be seasonal workers.
Farmworkers may be classified as accompanied or unaccompanied. Accompanied
farmworkers are those living with a spouse, children, or parents, or minor farmworkers living with a sibling. An estimated 23% of migrant farmworkers and 57% of seasonal farmworkers in Florida are accompanied. In all, Florida has a total of 100,240 farmworker households with 201,998 household members.
Unaccompanied Worker
Households
Accompanied Worker
Households Total
Households
Unaccompanied Worker Household
Members
Accompanied Worker
Household Members
Total Household Members
Migrant 32,658 6,059 38,717 32,658 21,752 54,410Seasonal 31,219 30,304 61,523 31,219 116,369 147,588Total 63,877 36,363 100,240 63,877 138,121 201,998
Sources: United States Bureau of Labor Statistics, Quarterly Census of Employment and Wages, 2008 and United States Department of Labor, National Agricultural Workers Survey, 2005-2008.
The following 12 counties have the largest farmworker populations: Collier, Gadsden, Hendry, Hillsborough, Lake, Manatee, Miami-Dade, Orange, Palm Beach, Polk, St. Lucie, and Volusia. Combined, these counties contain 80% of the state’s farmworkers. Incomes and Affordable Rent Ranges for Farmworker Households
Unaccompanied migrant farmworkers fall most frequently into the lowest income groups,
with 54% earning less than $10,000 per year. Unaccompanied seasonal workers have somewhat higher incomes, with 78% earning $10,000-25,000 per year and an additional 9% earning more than $25,000 per year. Therefore, nearly 35% of all unaccompanied farmworkers need single-person units or beds with rents below $333 per month, with an additional 32% in need of units with rents below $500 per month.
Accompanied farmworker households tend to have higher incomes than unaccompanied
farmworkers. Among accompanied migrant workers, 7% earn less than $10,000 per year, 57% earn $10,000-25,0000 per year, and 36% earn $25,000 per year or more. Among accompanied seasonal worker households, 4% earn less than $10,000 per year, 50% earn $10,000-25,000 per year, and 46% earn $25,000 per year or more.
Many accompanied farmworker families also need housing units with rents well below
the market rate, with 21% requiring units with rents of $500 per month or less. However, 44% of accompanied farmworker families may be able to afford rents in the $834 and above range. Farmworker Housing Supply
There are 7,567 farmworker housing units in multifamily developments with funding from the U.S. Department of Agriculture Rural Development (RD) Section 514 and 516 programs,
2
from Florida Housing-allocated SAIL, HOME, and tax credit resources, or both. Florida Department of Health (DOH) permitted camps supply an additional 33,409 unduplicated beds for unaccompanied workers. Assuming that the multifamily units each can house an average of four persons, the farmworker housing supply can house a total of 63,677 farmworkers and their family members in Florida.
The 13 counties with the capacity to house 1,000 or more farmworkers are Collier,
DeSoto, Gadsden, Hardee, Hendry, Highlands, Hillsborough, Indian River, Lee, Manatee, Miami-Dade, Palm Beach, and Polk.
Need Estimate: Comparison of Supply and Farmworker Households
The total statewide gap between farmworker housing capacity and the number of
farmworkers and their household members is 110,506. The total gap between the number of single worker beds needed and the number of unaccompanied farmworkers is 28,698 beds. Nine counties have an unmet need for single worker housing exceeding 1,000 beds: Gadsden, Hillsborough, Lake, Manatee, Miami-Dade, Orange, Polk, St. Lucie, and Volusia. The total gap between the number of multifamily units and the number of accompanied farmworker households is 27,790 units. The eight counties with unmet need for multifamily farmworker units exceeding 1,000 units are Hendry, Hillsborough, Manatee, Miami-Dade, Orange, Palm Beach, Polk, and St. Lucie.
3
The Need for Farmworker Housing in Florida INTRODUCTION
This section of the housing needs assessment discusses the need for rental housing for migrant and seasonal farmworkers in Florida’s counties. Farmworkers may or may not be accompanied by immediate family members, and unaccompanied farmworkers have different housing needs and incomes than accompanied farmworkers. Therefore, this analysis examines the number of accompanied and unaccompanied farmworker households, the incomes of each group, and the number of housing units appropriate to each group.
This analysis is divided into six sections:
I. Methodology
II. Farmworker Population and Household Estimates
III. Incomes and Affordable Rent Ranges for Farmworker Households
IV. Farmworker Housing Supply
V. Need Estimate: Comparison of Supply and Households
VI. Data Limitations
4
I. METHODOLOGY Demand Estimating Farmworkers for State and Counties
The total numbers of farmworkers in the state and in each county are derived from two sources: the Bureau of Labor Statistics’ Quarterly Census of Employment and Wages (QCEW) and the Department of Labor’s National Agricultural Workers Survey (NAWS).
• QCEW: The QCEW “produces a comprehensive tabulation of employment and wage information for workers covered by State unemployment insurance (UI) laws” by industry, including total annual wages and average weekly wages.1 The QCEW records information for each “establishment,” defined as “the physical location of a certain economic activity--for example, a factory, mine, store, or office. A single establishment generally produces a single good or provides a single service.” 2
QCEW data are available by state and county as well as by NAICS (North American Industry Classification, formerly SIC) industrial code. 2008 is the most recent year for which full data are publicly available. This analysis considers employment in two NAICS codes: 111, “Crop Production,” and 11511, “Support Activities for Crop Production.” These classifications include farms, orchards, groves, greenhouses and nurseries.
• NAWS: The NAWS “is an employment-based, random survey of the demographic and
employment characteristics of the U.S. crop labor force” including information about the demographic characteristics of workers and their households, employment history, and migration patterns.3 Susan Gabbard, of JBS International, provided special tabulations of the NAWS data for this report.
We calculated the total number of farmworkers for the state of Florida and each county by a
three-step process:
1. Use the QCEW data to calculate the total number of weeks worked by workers in NAICS codes 111 and 11511. For each code and geographic area,
Total number of weeks worked = Total annual wages Average weekly wage
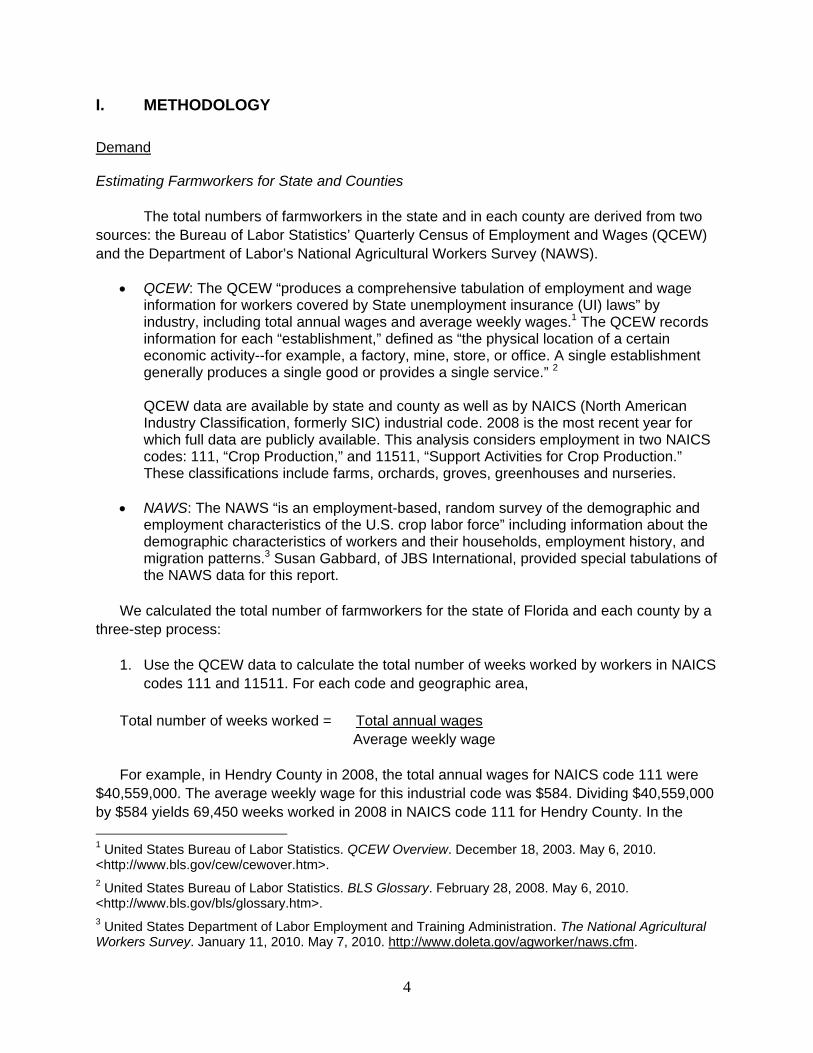
For example, in Hendry County in 2008, the total annual wages for NAICS code 111 were
$40,559,000. The average weekly wage for this industrial code was $584. Dividing $40,559,000 by $584 yields 69,450 weeks worked in 2008 in NAICS code 111 for Hendry County. In the 1 United States Bureau of Labor Statistics. QCEW Overview. December 18, 2003. May 6, 2010. <http://www.bls.gov/cew/cewover.htm>. 2 United States Bureau of Labor Statistics. BLS Glossary. February 28, 2008. May 6, 2010. <http://www.bls.gov/bls/glossary.htm>. 3 United States Department of Labor Employment and Training Administration. The National Agricultural Workers Survey. January 11, 2010. May 7, 2010. http://www.doleta.gov/agworker/naws.cfm.
5
same county, the total annual wages for code 11511 were $35,065,000. The average weekly wage was $347. Dividing $35,065,000 by $347 yields 101,051 weeks worked.
2. Use the NAWS data to calculate the number of workers required to work that number of
weeks in one year.
The NAWS shows that farmworkers in Florida worked an average of 36 weeks during 2008. This allows us to translate the total number of weeks worked in a geographic area and NAICS code into an estimated number of workers:
Workers = Total annual weeks worked = Total annual weeks worked Average weeks worked per year 36 In the Hendry County example, for NAICS code 111, dividing 69,450 weeks worked by 36
weeks per worker yields 1,929 workers. For NAICS code 11511, dividing 101,051 weeks worked by 36 weeks per worker yields 2,807 workers.
3. Sum the total workers for the two industrial codes in each geographic area.
Total farmworkers = Workers in code 111 + Workers in code 11511 For Hendry County, total farmworkers = 1,929 + 2,807 = 4,736
Using the QCEW to distribute farmworkers among counties introduces an error into the
distribution. In this report, the sum of the number of farmworkers in all counties is lower than the statewide total. This is also true for the numbers of farmworker households and household members, which are derived directly from the number of farmworkers. This disparity has two causes. First, the QCEW includes a category of employment establishments for which counties cannot be identified based on data submitted by employers. We determined that 3,181 farmworkers in Florida fall in the “County Unknown” category. For Tables 5-7, which list farmworkers, farmworker households, and farmworker household members, these farmworkers and their associated household and household members are counted in a “County Unknown” row. However, these workers, households and household members are not included in the county lists for Tables 12-13, which identify housing need by comparing demand and supply, or in any of the maps.
Second, the Bureau of Labor Statistics suppresses wage data for establishments in
some counties in order to protect confidentiality, but includes the data in statewide totals. In these counties, the number of farmworkers is actually higher than the figures reported in this report. Statewide, this results in 13,351 farmworkers (12%) included in the state total that are not attributed to any county or to the “County Unknown” category. To account for those workers, we redistributed the 13,351 workers among the counties and the “County Unknown” category based on the counties’ share of the 101,495 workers for whom a county (or “County Unknown”) designation could be identified using the QCEW and NAWS data. For example, the QCEW/NAWS method resulted in an estimate of 4,736 workers for Hendry County, which equals 4.67% of 101,495. We added 623 workers (13,351 * .0467) to Hendry County’s total as that county’s portion of the state total that had been suppressed in the county-level data, for a total of 5,359 workers. However, this likely results in an underestimate of workers in some counties and an overestimate in others, since the wages and therefore workers at the
6
suppressed establishments are unlikely to match the county-level distribution of wages and workers at other establishments. Farmworker Demographic and Household Characteristics
We used data from the NAWS to identify characteristics of farmworkers and their
households. Because the annual NAWS sample size is small, we used the NAWS interviews with individuals collected over a four-year period (fiscal years 2005 - 2008). Therefore, results reflect interviews with 824 individuals regarding these characteristics:
• Migrant vs. seasonal workers: The NAWS defines a “migrant” as a person traveling
more than 75 miles to find farm work. “Seasonal” workers also perform labor in crop agriculture but do not make this migration.
• Accompanied vs. unaccompanied workers: Accompanied farmworkers are those
living with a spouse, children, or parents, or minor farmworkers living with a sibling. Unaccompanied farmworkers are those who do not live with immediate family.
• Household size and number of farmworkers in household for accompanied workers:
By definition, accompanied worker households include more than one person. They may also include more than one farmworker.
• Annual household income: We used the NAWS to determine income distributions for
unaccompanied migrant worker households, unaccompanied seasonal worker households, accompanied migrant worker households and accompanied seasonal worker households. For accompanied worker households, household income may include contributions from more than one farmworker, and it may also include income from family members engaged in types of work other than agriculture.
The estimates of household income were complicated in two ways as a result of NAWS
data collection practices. The NAWS survey asks farmworkers, “What was your family’s total income last year in USA dollars?” (emphasis added). First, for four percent of workers surveyed, data are missing. To account for these workers, we have assumed that they would be distributed among the different income categories in proportion to each category’s share of total workers. For example, if 15% of workers other than the missing workers reported incomes between $7,500 and $9,999, we added 15% of the missing workers to that category. Second, approximately seven percent of workers surveyed—including 18% of unaccompanied migrant workers—responded that their family incomes were below $1,000, with most of these responding that their incomes were below $500. It is unlikely that most of these answers actually represent family incomes earned while the workers were performing farm work in Florida. More likely, these workers are new to the U.S. or to farm work and are reporting previous years’ incomes that do not include farm work. Therefore, we made the assumption that these amounts did not reflect a full year’s income. We redistributed these workers to the other income categories based on the other categories’ share of the state total, the same method by which we redistributed the workers with missing data. Supply
This report tallies two sources of farmworker housing: state- and federally-assisted
housing units and Department of Health-permitted camps.
7
First, a number of multifamily developments in the state receive state subsidies, federal
subsidies, or both in order to serve low-income farmworker households. The Florida Housing Finance Corporation (Florida Housing) allocates some of its SAIL, HOME, and housing tax credit resources to multifamily developments designed to house farmworkers. In addition, a number of multifamily housing complexes receive development subsidies from the U.S. Department of Agriculture’s Rural Development (RD) program to provide housing for farmworker families under the Section 514 and 516 programs. Data on properties subsidized by these programs come from the Shimberg Center’s Assisted Housing Inventory (AHI). The AHI receives data from Florida Housing and the RD program and records all units for which farmworkers are the target population. In the parts of this report that evaluate the capacity of the supply to house individual farmworker household members, we assume that each multifamily unit can house four individuals.
Second, the Florida Department of Health (DOH) issues permits for camps to house
unaccompanied migrant and seasonal farmworkers. These “camps” may consist of single-family homes, mobile homes, motels, multifamily units, or dormitory-style arrangements. The camps are inspected by county departments of public health, which report the camps’ occupancy levels annually to DOH. We received records from DOH that include county location and occupancy for each camp. Therefore, as the figures in this report reflect a snapshot of camps’ occupancy rather than their potential capacity, it is possible that there is additional unused camp capacity available in some counties.
Seven developments were listed in both the RD/Florida Housing multifamily
developments inventory and the DOH camp list. In these cases, we subtracted the developments and their bed capacity from the DOH supply figures but continued to include them in the multifamily supply. Therefore, in all tables and maps, we subtracted a total capacity of 1,118 beds from the DOH supply figure, representing two camps in Collier County, capacity 351; one camp in Hillsborough County, capacity 64; two camps in Miami-Dade County, capacity 176; one camp in Palm Beach County, capacity 95; and one camp in Pasco County, capacity 502.
II. FARMWORKER POPULATION AND HOUSEHOLD ESTIMATES
To determine the number of farmworker housing units needed and the number of people they must accommodate, this section makes estimates of the following:
• Farmworkers: individuals performing farm work in Florida or living in Florida when not
migrating to other states to perform farm work. • Farmworker households: individuals or family groups living together including at least
one farmworker; many farmworker households include more than one farmworker. • Farmworker household members: all of the individuals living in a farmworker
household, regardless of whether they themselves perform farm work. As described in the following section, farmworkers may be migrant or seasonal, with the
National Agricultural Workers Survey (NAWS) defining a “migrant” as a person traveling more than 75 miles to find farm work. Seasonal workers also perform labor in crop agriculture but do not make this migration. Because migrant and seasonal workers have different household characteristics, we make separate estimates of the numbers of farmworkers, households, and household members in each of these categories.
Total Migrant and Seasonal Farmworkers in Florida
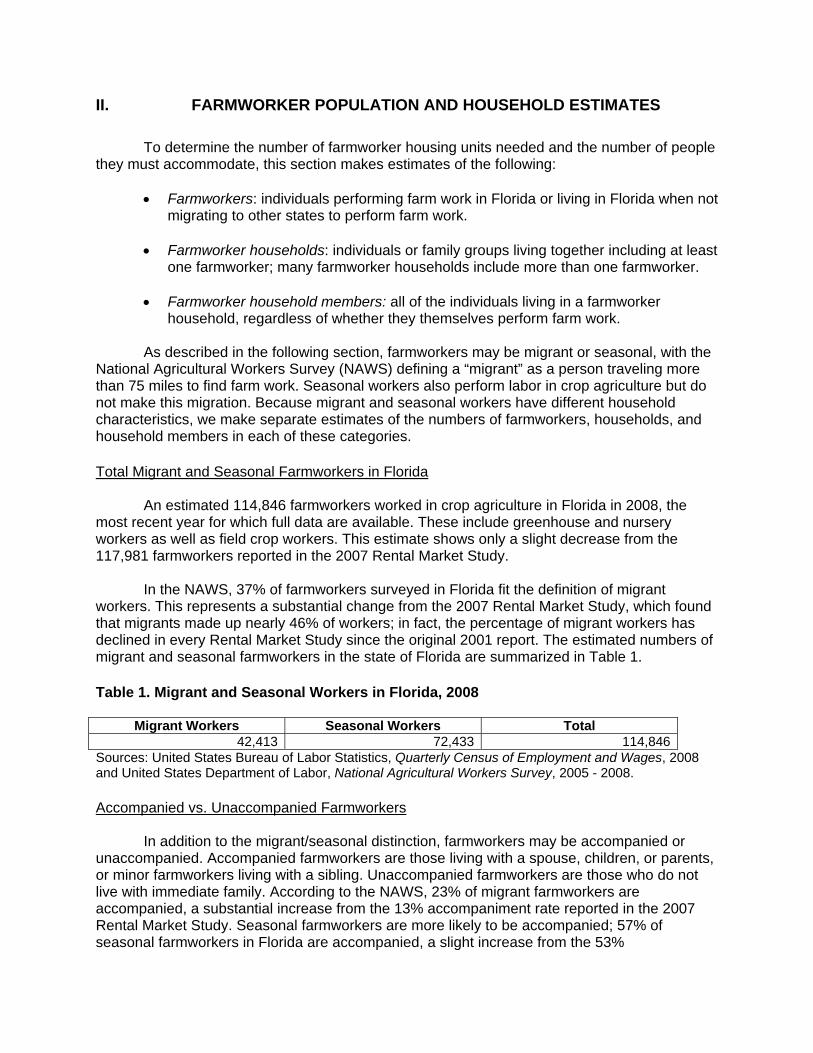
An estimated 114,846 farmworkers worked in crop agriculture in Florida in 2008, the most recent year for which full data are available. These include greenhouse and nursery workers as well as field crop workers. This estimate shows only a slight decrease from the 117,981 farmworkers reported in the 2007 Rental Market Study.
In the NAWS, 37% of farmworkers surveyed in Florida fit the definition of migrant
workers. This represents a substantial change from the 2007 Rental Market Study, which found that migrants made up nearly 46% of workers; in fact, the percentage of migrant workers has declined in every Rental Market Study since the original 2001 report. The estimated numbers of migrant and seasonal farmworkers in the state of Florida are summarized in Table 1.
Table 1. Migrant and Seasonal Workers in Florida, 2008
Migrant Workers Seasonal Workers Total 42,413 72,433 114,846
Sources: United States Bureau of Labor Statistics, Quarterly Census of Employment and Wages, 2008 and United States Department of Labor, National Agricultural Workers Survey, 2005 - 2008. Accompanied vs. Unaccompanied Farmworkers
In addition to the migrant/seasonal distinction, farmworkers may be accompanied or
unaccompanied. Accompanied farmworkers are those living with a spouse, children, or parents, or minor farmworkers living with a sibling. Unaccompanied farmworkers are those who do not live with immediate family. According to the NAWS, 23% of migrant farmworkers are accompanied, a substantial increase from the 13% accompaniment rate reported in the 2007 Rental Market Study. Seasonal farmworkers are more likely to be accompanied; 57% of seasonal farmworkers in Florida are accompanied, a slight increase from the 53%
9
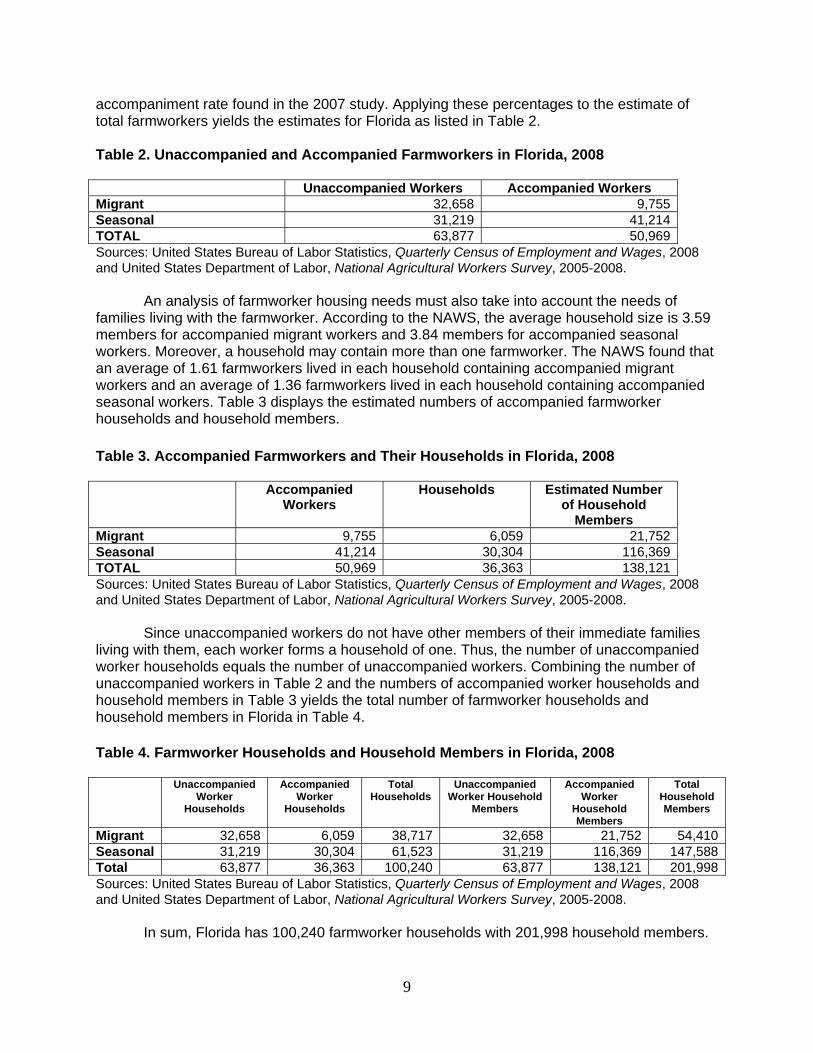
accompaniment rate found in the 2007 study. Applying these percentages to the estimate of total farmworkers yields the estimates for Florida as listed in Table 2.
Table 2. Unaccompanied and Accompanied Farmworkers in Florida, 2008
Unaccompanied Workers Accompanied Workers Migrant 32,658 9,755Seasonal 31,219 41,214TOTAL 63,877 50,969Sources: United States Bureau of Labor Statistics, Quarterly Census of Employment and Wages, 2008 and United States Department of Labor, National Agricultural Workers Survey, 2005-2008.
An analysis of farmworker housing needs must also take into account the needs of
families living with the farmworker. According to the NAWS, the average household size is 3.59 members for accompanied migrant workers and 3.84 members for accompanied seasonal workers. Moreover, a household may contain more than one farmworker. The NAWS found that an average of 1.61 farmworkers lived in each household containing accompanied migrant workers and an average of 1.36 farmworkers lived in each household containing accompanied seasonal workers. Table 3 displays the estimated numbers of accompanied farmworker households and household members. Table 3. Accompanied Farmworkers and Their Households in Florida, 2008
Accompanied Workers
Households Estimated Number of Household
Members Migrant 9,755 6,059 21,752Seasonal 41,214 30,304 116,369TOTAL 50,969 36,363 138,121Sources: United States Bureau of Labor Statistics, Quarterly Census of Employment and Wages, 2008 and United States Department of Labor, National Agricultural Workers Survey, 2005-2008.
Since unaccompanied workers do not have other members of their immediate families
living with them, each worker forms a household of one. Thus, the number of unaccompanied worker households equals the number of unaccompanied workers. Combining the number of unaccompanied workers in Table 2 and the numbers of accompanied worker households and household members in Table 3 yields the total number of farmworker households and household members in Florida in Table 4.
Table 4. Farmworker Households and Household Members in Florida, 2008
Unaccompanied Worker
Households
Accompanied Worker
Households
Total Households
Unaccompanied Worker Household
Members
Accompanied Worker
Household Members
Total Household Members
Migrant 32,658 6,059 38,717 32,658 21,752 54,410Seasonal 31,219 30,304 61,523 31,219 116,369 147,588Total 63,877 36,363 100,240 63,877 138,121 201,998Sources: United States Bureau of Labor Statistics, Quarterly Census of Employment and Wages, 2008 and United States Department of Labor, National Agricultural Workers Survey, 2005-2008.
In sum, Florida has 100,240 farmworker households with 201,998 household members.
10
Estimating Farmworker Population, Households, and Household Members by County
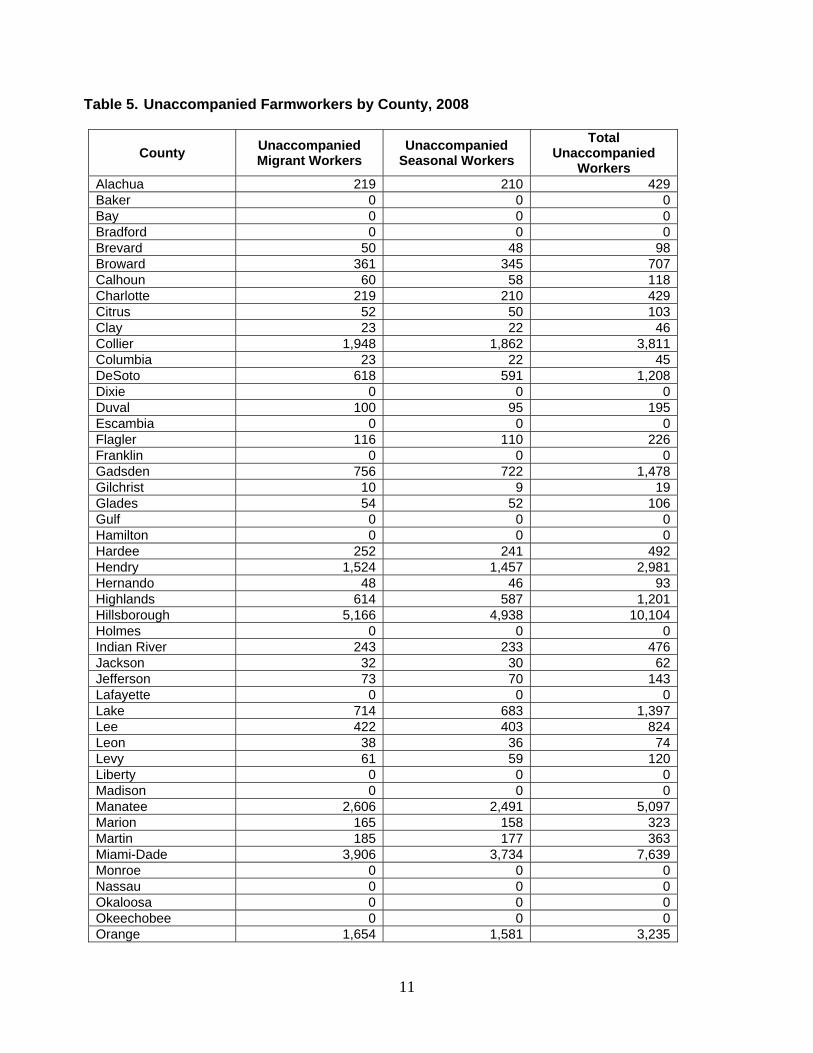
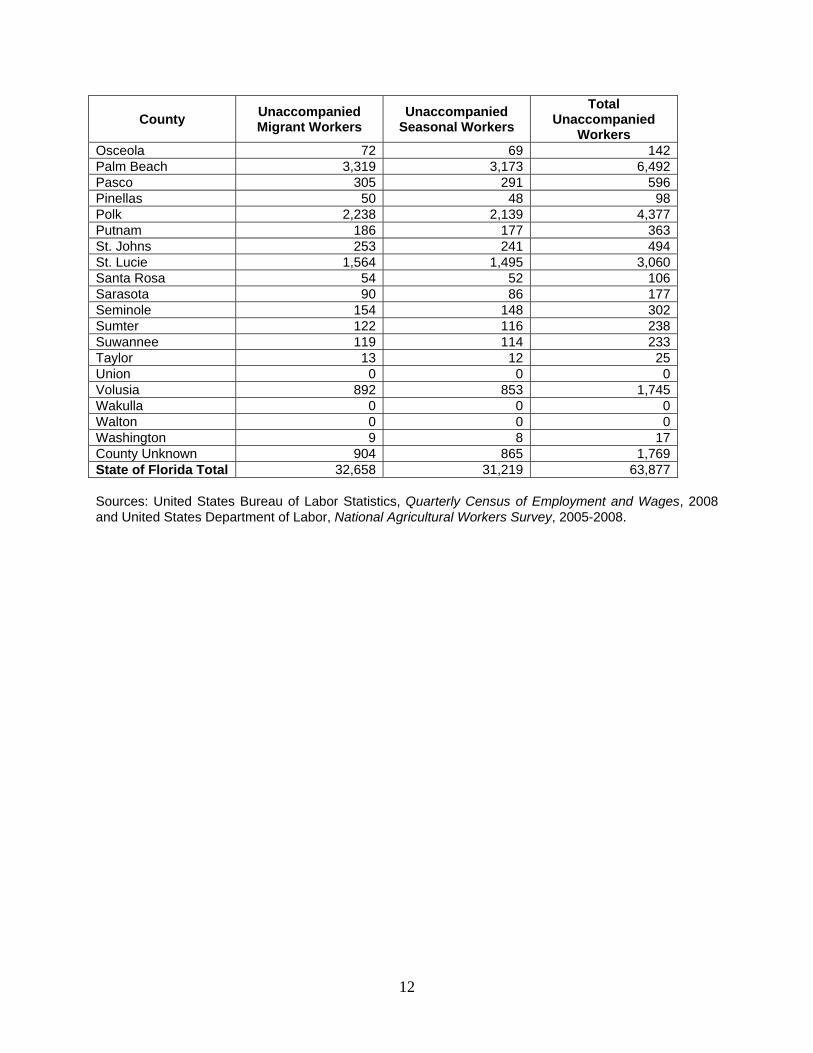
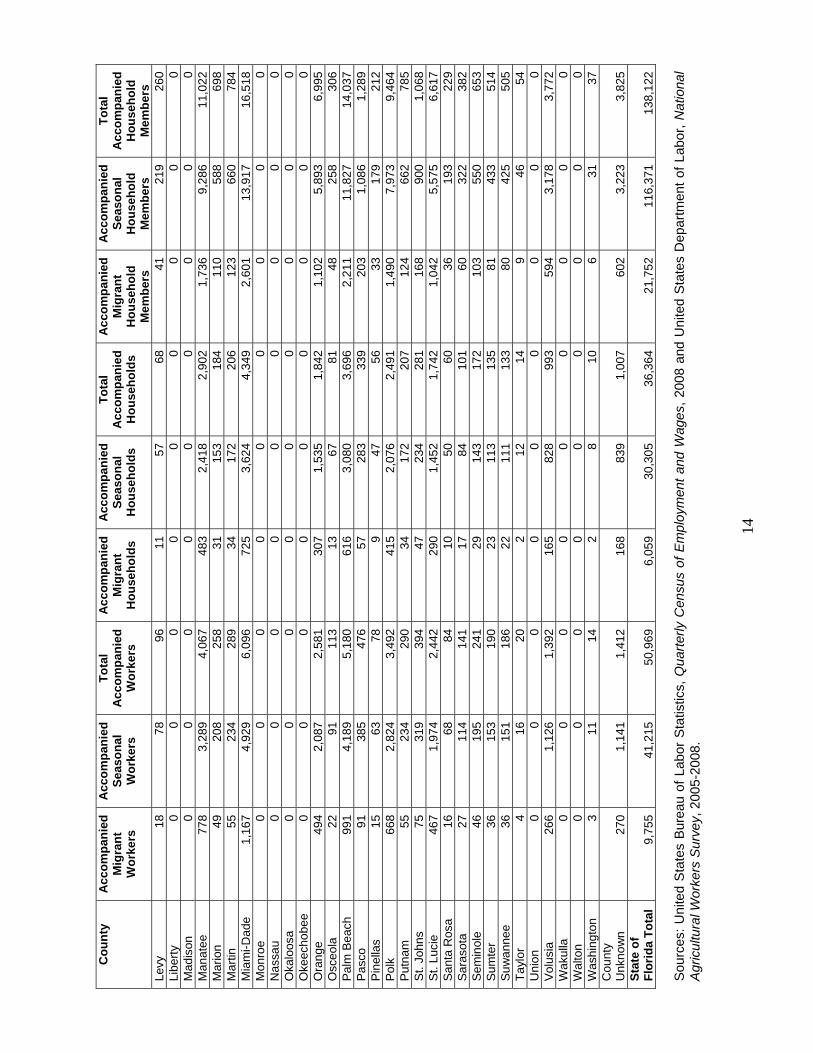
Table 5 shows the numbers of unaccompanied migrant and seasonal workers by county.
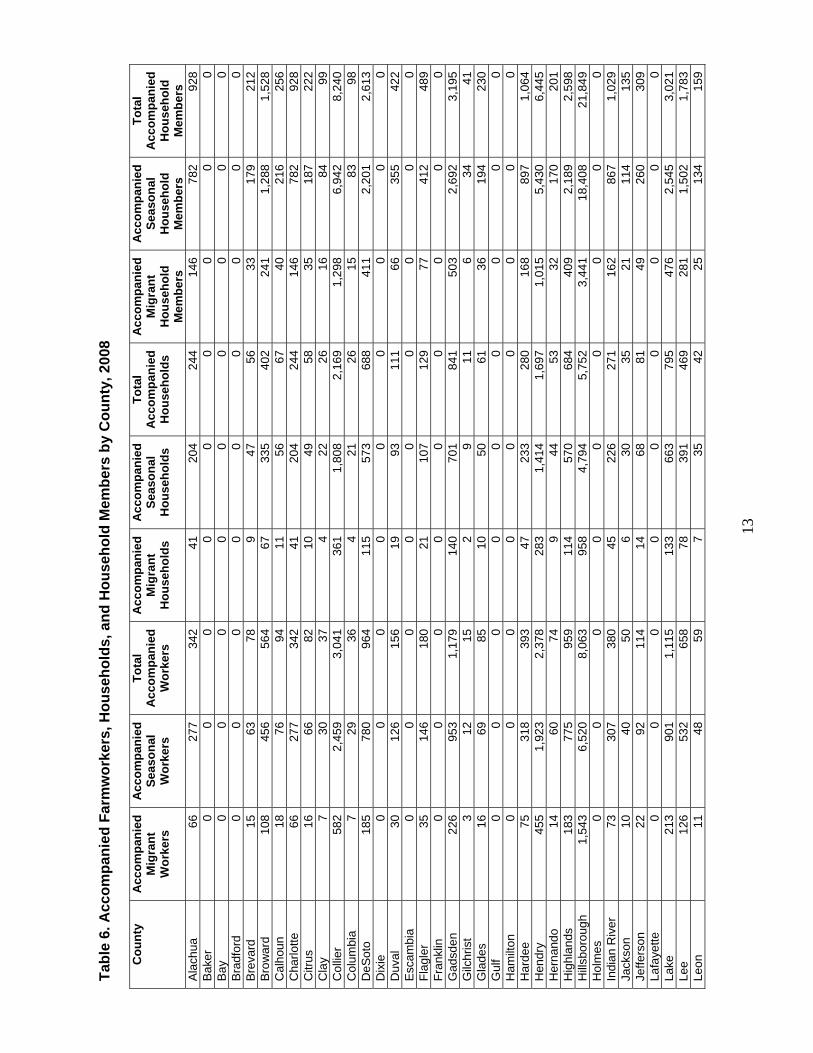
Table 6 shows the number of accompanied workers, accompanied worker households, and accompanied worker household members for migrant and seasonal workers by county. The number of unaccompanied workers declined by 17% since 2007, both because more workers are seasonal this year—a group more likely to be accompanied by family—and because even migrant workers are less likely to be unaccompanied than in the past. Conversely, the number of accompanied worker households increased by 25%, from 28,169 households in 2007 to 35,357 households in 2010.
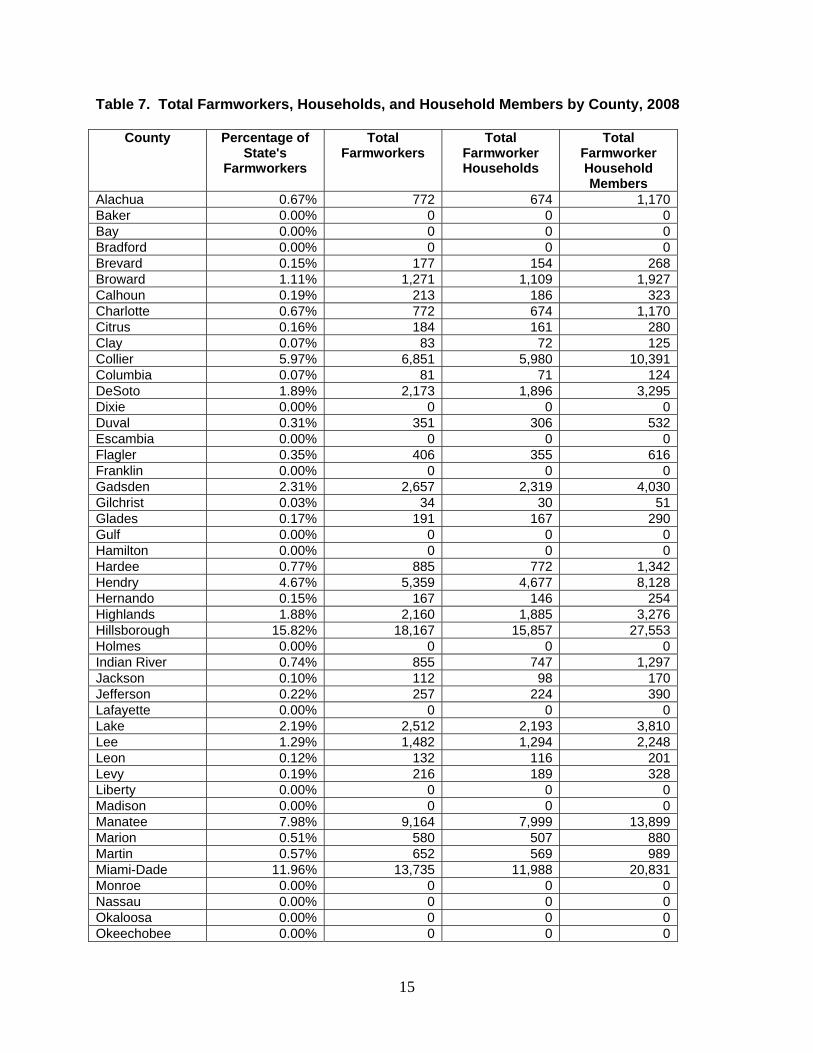
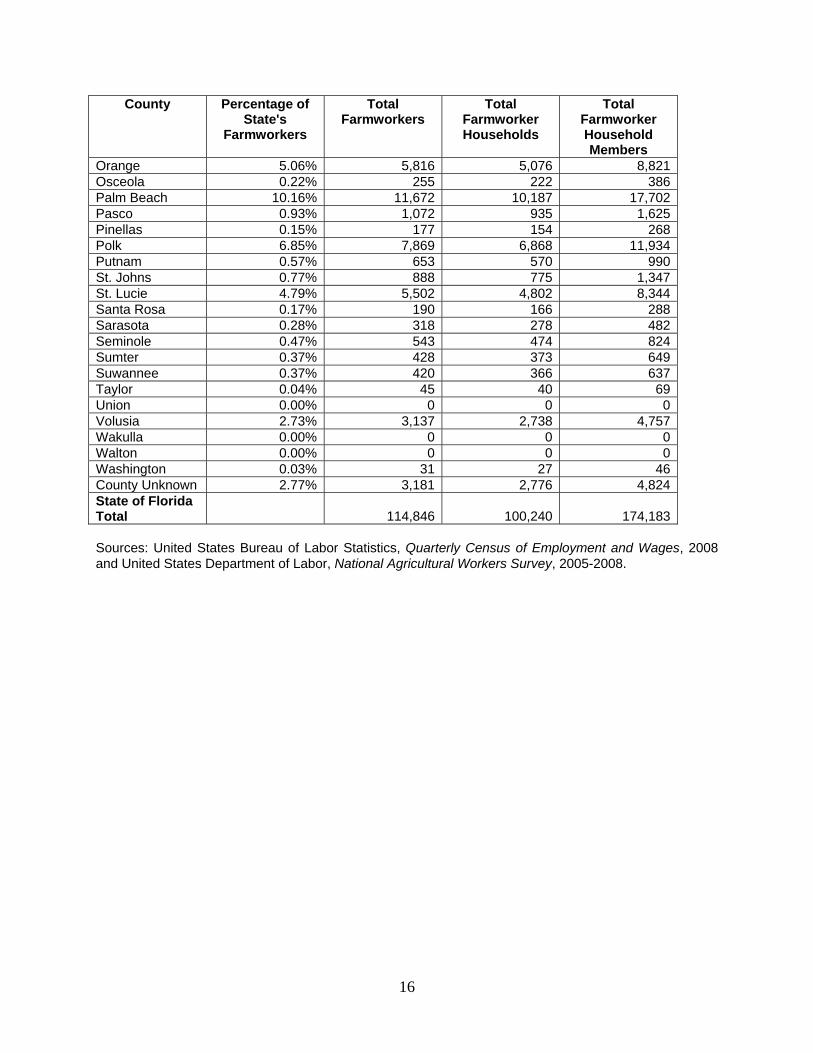
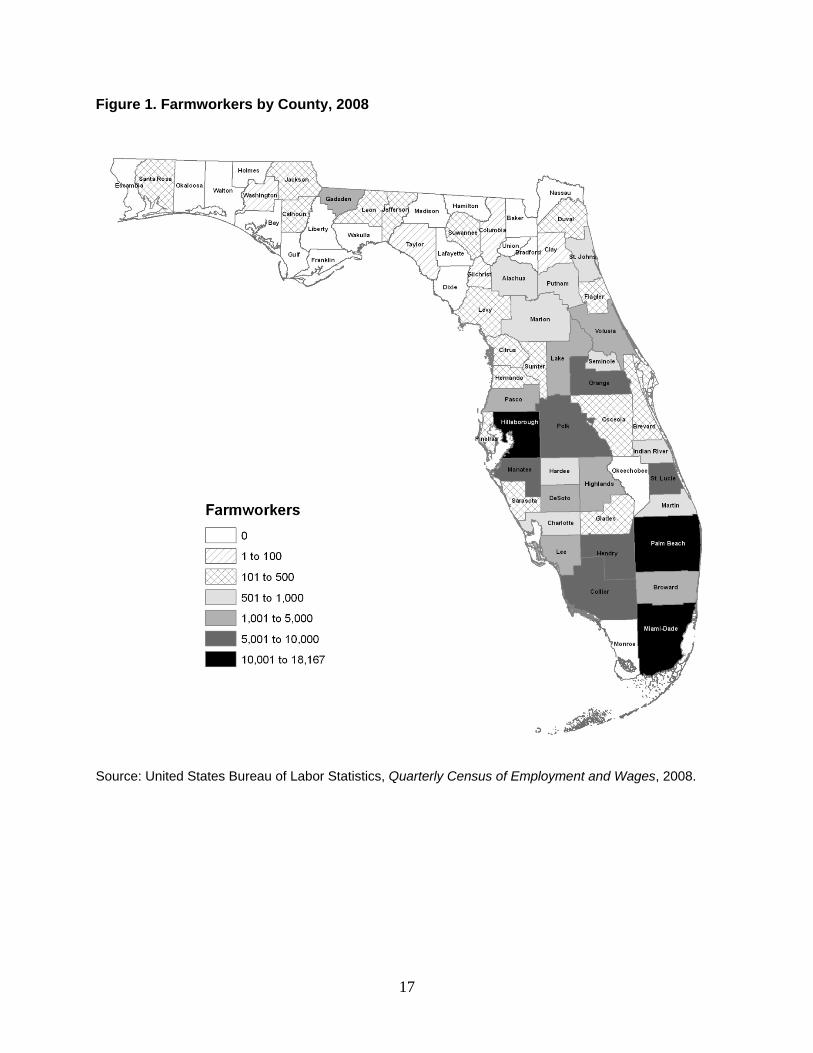
Table 7 shows the total numbers of farmworkers, farmworker households, and
farmworker household members by county, regardless of migrant/seasonal status. Figure 1 is a map showing the distribution of all farmworkers by county
The counties with more than 2,500 farmworkers are Collier, Gadsden, Hendry,
Hillsborough, Lake, Manatee, Miami-Dade, Orange, Palm Beach, Polk, St. Lucie, and Volusia. These counties combined contain 80% of the state’s farmworkers.
11
Table 5. Unaccompanied Farmworkers by County, 2008
County Unaccompanied Migrant Workers
Unaccompanied Seasonal Workers
Total Unaccompanied
Workers Alachua 219 210 429Baker 0 0 0Bay 0 0 0Bradford 0 0 0Brevard 50 48 98Broward 361 345 707Calhoun 60 58 118Charlotte 219 210 429Citrus 52 50 103Clay 23 22 46Collier 1,948 1,862 3,811Columbia 23 22 45DeSoto 618 591 1,208Dixie 0 0 0Duval 100 95 195Escambia 0 0 0Flagler 116 110 226Franklin 0 0 0Gadsden 756 722 1,478Gilchrist 10 9 19Glades 54 52 106Gulf 0 0 0Hamilton 0 0 0Hardee 252 241 492Hendry 1,524 1,457 2,981Hernando 48 46 93Highlands 614 587 1,201Hillsborough 5,166 4,938 10,104Holmes 0 0 0Indian River 243 233 476Jackson 32 30 62Jefferson 73 70 143Lafayette 0 0 0Lake 714 683 1,397Lee 422 403 824Leon 38 36 74Levy 61 59 120Liberty 0 0 0Madison 0 0 0Manatee 2,606 2,491 5,097Marion 165 158 323Martin 185 177 363Miami-Dade 3,906 3,734 7,639Monroe 0 0 0Nassau 0 0 0Okaloosa 0 0 0Okeechobee 0 0 0Orange 1,654 1,581 3,235
12
County Unaccompanied Migrant Workers
Unaccompanied Seasonal Workers
Total Unaccompanied
Workers Osceola 72 69 142Palm Beach 3,319 3,173 6,492Pasco 305 291 596Pinellas 50 48 98Polk 2,238 2,139 4,377Putnam 186 177 363St. Johns 253 241 494St. Lucie 1,564 1,495 3,060Santa Rosa 54 52 106Sarasota 90 86 177Seminole 154 148 302Sumter 122 116 238Suwannee 119 114 233Taylor 13 12 25Union 0 0 0Volusia 892 853 1,745Wakulla 0 0 0Walton 0 0 0Washington 9 8 17County Unknown 904 865 1,769State of Florida Total 32,658 31,219 63,877 Sources: United States Bureau of Labor Statistics, Quarterly Census of Employment and Wages, 2008 and United States Department of Labor, National Agricultural Workers Survey, 2005-2008.
13
Tabl
e 6.
Acc
ompa
nied
Far
mw
orke
rs, H
ouse
hold
s, a
nd H
ouse
hold
Mem
bers
by
Cou
nty,
200
8
Cou
nty
Acc
ompa
nied
M
igra
nt
Wor
kers
Acc
ompa
nied
Se
ason
al
Wor
kers
Tota
l A
ccom
pani
ed
Wor
kers
Acc
ompa
nied
M
igra
nt
Hou
seho
lds
Acc
ompa
nied
Se
ason
al
Hou
seho
lds
Tota
l A
ccom
pani
ed
Hou
seho
lds
Acc
ompa
nied
M
igra
nt
Hou
seho
ld
Mem
bers
Acc
ompa
nied
Se
ason
al
Hou
seho
ld
Mem
bers
Tota
l A
ccom
pani
ed
Hou
seho
ld
Mem
bers
Al
achu
a
66
277
342
41
204
244
146
782
928
Bake
r
0 0
0 0
0 0
0 0
0 Ba
y
0 0
0 0
0 0
0 0
0 Br
adfo
rd
0 0
0 0
0 0
0 0
0 Br
evar
d
15
63
78
9 47
56
33
17
9 21
2 Br
owar
d
108
456
564
67
335
402
241
1,28
8 1,
528
Cal
houn
18
76
94
11
56
67
40
21
6 25
6 C
harlo
tte
66
277
342
41
204
244
146
782
928
Citr
us
16
66
82
10
49
58
35
187
222
Cla
y
7 30
37
4
22
26
16
84
99
Col
lier
58
2 2,
459
3,04
1 36
1 1,
808
2,16
9 1,
298
6,94
2 8,
240
Col
umbi
a
7 29
36
4
21
26
15
83
98
DeS
oto
18
5 78
0 96
4 11
5 57
3 68
8 41
1 2,
201
2,61
3 D
ixie
0
0 0
0 0
0 0
0 0
Duv
al
30
126
156
19
93
111
66
355
422
Esca
mbi
a
0 0
0 0
0 0
0 0
0 Fl
agle
r
35
146
180
21
107
129
77
412
489
Fran
klin
0
0 0
0 0
0 0
0 0
Gad
sden
22
6 95
3 1,
179
140
701
841
503
2,69
2 3,
195
Gilc
hris
t
3 12
15
2
9 11
6
34
41
Gla
des
16
69
85
10
50
61
36
19
4 23
0 G
ulf
0
0 0
0 0
0 0
0 0
Ham
ilton
0
0 0
0 0
0 0
0 0
Har
dee
75
31
8 39
3 47
23
3 28
0 16
8 89
7 1,
064
Hen
dry
45
5 1,
923
2,37
8 28
3 1,
414
1,69
7 1,
015
5,43
0 6,
445
Her
nand
o
14
60
74
9 44
53
32
17
0 20
1 H
ighl
ands
18
3 77
5 95
9 11
4 57
0 68
4 40
9 2,
189
2,59
8 H
illsbo
roug
h
1,54
3 6,
520
8,06
3 95
8 4,
794
5,75
2 3,
441
18,4
08
21,8
49
Hol
mes
0
0 0
0 0
0 0
0 0
Indi
an R
iver
73
30
7 38
0 45
22
6 27
1 16
2 86
7 1,
029
Jack
son
10
40
50
6
30
35
21
114
135
Jeffe
rson
22
92
11
4 14
68
81
49
26
0 30
9 La
faye
tte
0 0
0 0
0 0
0 0
0 La
ke
213
901
1,11
5 13
3 66
3 79
5 47
6 2,
545
3,02
1 Le
e
126
532
658
78
391
469
281
1,50
2 1,
783
Leon
11
48
59
7
35
42
25
134
159
14
Cou
nty
Acc
ompa
nied
M
igra
nt
Wor
kers
Acc
ompa
nied
Se
ason
al
Wor
kers
Tota
l A
ccom
pani
ed
Wor
kers
Acc
ompa
nied
M
igra
nt
Hou
seho
lds
Acc
ompa
nied
Se
ason
al
Hou
seho
lds
Tota
l A
ccom
pani
ed
Hou
seho
lds
Acc
ompa
nied
M
igra
nt
Hou
seho
ld
Mem
bers
Acc
ompa
nied
Se
ason
al
Hou
seho
ld
Mem
bers
Tota
l A
ccom
pani
ed
Hou
seho
ld
Mem
bers
Le
vy
18
78
96
11
57
68
41
219
260
Libe
rty
0 0
0 0
0 0
0 0
0 M
adis
on
0 0
0 0
0 0
0 0
0 M
anat
ee
778
3,28
9 4,
067
483
2,41
8 2,
902
1,73
6 9,
286
11,0
22
Mar
ion
49
20
8 25
8 31
15
3 18
4 11
0 58
8 69
8 M
artin
55
23
4 28
9 34
17
2 20
6 12
3 66
0 78
4 M
iam
i-Dad
e 1,
167
4,92
9 6,
096
725
3,62
4 4,
349
2,60
1 13
,917
16
,518
M
onro
e
0 0
0 0
0 0
0 0
0 N
assa
u
0 0
0 0
0 0
0 0
0 O
kalo
osa
0
0 0
0 0
0 0
0 0
Oke
echo
bee
0 0
0 0
0 0
0 0
0 O
rang
e
494
2,08
7 2,
581
307
1,53
5 1,
842
1,10
2 5,
893
6,99
5 O
sceo
la
22
91
113
13
67
81
48
258
306
Palm
Bea
ch
991
4,18
9 5,
180
616
3,08
0 3,
696
2,21
1 11
,827
14
,037
Pa
sco
91
38
5 47
6 57
28
3 33
9 20
3 1,
086
1,28
9 Pi
nella
s
15
63
78
9 47
56
33
17
9 21
2 Po
lk
668
2,82
4 3,
492
415
2,07
6 2,
491
1,49
0 7,
973
9,46
4 Pu
tnam
55
23
4 29
0 34
17
2 20
7 12
4 66
2 78
5 St
. Joh
ns
75
319
394
47
234
281
168
900
1,06
8 S
t. Lu
cie
46
7 1,
974
2,44
2 29
0 1,
452
1,74
2 1,
042
5,57
5 6,
617
Sant
a R
osa
16
68
84
10
50
60
36
19
3 22
9 Sa
raso
ta
27
114
141
17
84
101
60
322
382
Sem
inol
e
46
195
241
29
143
172
103
550
653
Sum
ter
36
15
3 19
0 23
11
3 13
5 81
43
3 51
4 Su
wan
nee
36
15
1 18
6 22
11
1 13
3 80
42
5 50
5 Ta
ylor
4
16
20
2 12
14
9
46
54
Uni
on
0 0
0 0
0 0
0 0
0 Vo
lusi
a
266
1,12
6 1,
392
165
828
993
594
3,17
8 3,
772
Wak
ulla
0
0 0
0 0
0 0
0 0
Wal
ton
0
0 0
0 0
0 0
0 0
Was
hing
ton
3
11
14
2 8
10
6 31
37
C
ount
y U
nkno
wn
270
1,14
1 1,
412
168
839
1,00
7 60
2 3,
223
3,82
5 St
ate
of
Flor
ida
Tota
l 9,
755
41,2
15
50,9
69
6,05
9 30
,305
36
,364
21
,752
11
6,37
1 13
8,12
2 S
ourc
es: U
nite
d S
tate
s B
urea
u of
Lab
or S
tatis
tics,
Qua
rterly
Cen
sus
of E
mpl
oym
ent a
nd W
ages
, 200
8 an
d U
nite
d S
tate
s D
epar
tmen
t of L
abor
, Nat
iona
l A
gric
ultu
ral W
orke
rs S
urve
y, 2
005-
2008
.
15
Table 7. Total Farmworkers, Households, and Household Members by County, 2008
County Percentage of State's
Farmworkers
Total Farmworkers
Total Farmworker Households
Total Farmworker Household Members
Alachua 0.67% 772 674 1,170Baker 0.00% 0 0 0Bay 0.00% 0 0 0Bradford 0.00% 0 0 0Brevard 0.15% 177 154 268Broward 1.11% 1,271 1,109 1,927Calhoun 0.19% 213 186 323Charlotte 0.67% 772 674 1,170Citrus 0.16% 184 161 280Clay 0.07% 83 72 125Collier 5.97% 6,851 5,980 10,391Columbia 0.07% 81 71 124DeSoto 1.89% 2,173 1,896 3,295Dixie 0.00% 0 0 0Duval 0.31% 351 306 532Escambia 0.00% 0 0 0Flagler 0.35% 406 355 616Franklin 0.00% 0 0 0Gadsden 2.31% 2,657 2,319 4,030Gilchrist 0.03% 34 30 51Glades 0.17% 191 167 290Gulf 0.00% 0 0 0Hamilton 0.00% 0 0 0Hardee 0.77% 885 772 1,342Hendry 4.67% 5,359 4,677 8,128Hernando 0.15% 167 146 254Highlands 1.88% 2,160 1,885 3,276Hillsborough 15.82% 18,167 15,857 27,553Holmes 0.00% 0 0 0Indian River 0.74% 855 747 1,297Jackson 0.10% 112 98 170Jefferson 0.22% 257 224 390Lafayette 0.00% 0 0 0Lake 2.19% 2,512 2,193 3,810Lee 1.29% 1,482 1,294 2,248Leon 0.12% 132 116 201Levy 0.19% 216 189 328Liberty 0.00% 0 0 0Madison 0.00% 0 0 0Manatee 7.98% 9,164 7,999 13,899Marion 0.51% 580 507 880Martin 0.57% 652 569 989Miami-Dade 11.96% 13,735 11,988 20,831Monroe 0.00% 0 0 0Nassau 0.00% 0 0 0Okaloosa 0.00% 0 0 0Okeechobee 0.00% 0 0 0
16
County Percentage of State's
Farmworkers
Total Farmworkers
Total Farmworker Households
Total Farmworker Household Members
Orange 5.06% 5,816 5,076 8,821Osceola 0.22% 255 222 386Palm Beach 10.16% 11,672 10,187 17,702Pasco 0.93% 1,072 935 1,625Pinellas 0.15% 177 154 268Polk 6.85% 7,869 6,868 11,934Putnam 0.57% 653 570 990St. Johns 0.77% 888 775 1,347St. Lucie 4.79% 5,502 4,802 8,344Santa Rosa 0.17% 190 166 288Sarasota 0.28% 318 278 482Seminole 0.47% 543 474 824Sumter 0.37% 428 373 649Suwannee 0.37% 420 366 637Taylor 0.04% 45 40 69Union 0.00% 0 0 0Volusia 2.73% 3,137 2,738 4,757Wakulla 0.00% 0 0 0Walton 0.00% 0 0 0Washington 0.03% 31 27 46County Unknown 2.77% 3,181 2,776 4,824State of Florida Total 114,846 100,240 174,183 Sources: United States Bureau of Labor Statistics, Quarterly Census of Employment and Wages, 2008 and United States Department of Labor, National Agricultural Workers Survey, 2005-2008.
17
Figure 1. Farmworkers by County, 2008
Source: United States Bureau of Labor Statistics, Quarterly Census of Employment and Wages, 2008.
18
III. INCOMES AND AFFORDABLE RENT RANGES FOR FARMWORKER HOUSEHOLDS
We used NAWS data to estimate the breakdown of farmworker households by family
income range to determine how much the households can afford to pay in rent. In general, unaccompanied farmworker households tend to have lower incomes than accompanied farmworker households. Accompanied farmworkers may have several workers living in their households who contribute income from farm labor or other types of work.
Even with the workers reporting incomes below $1,000 redistributed to other categories
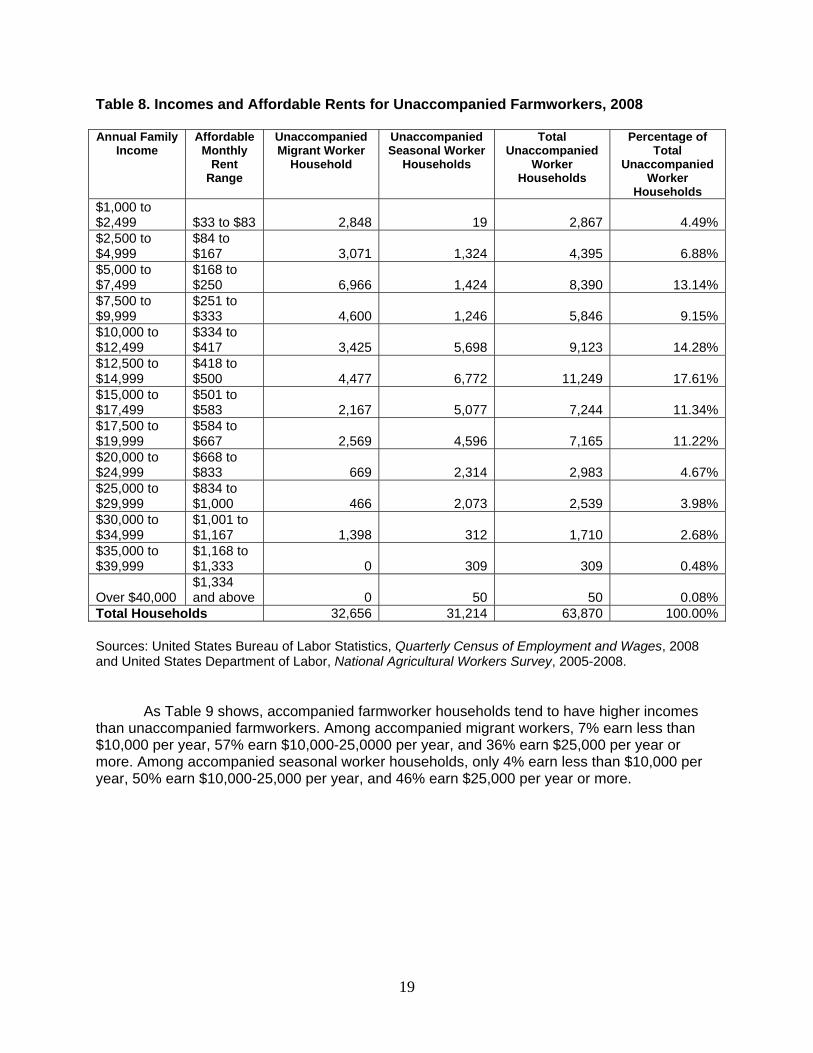
(see “Methodology”), unaccompanied migrant farmworkers fall most frequently into the lowest income groups, with 54% earning less than $10,000 per year and only five percent with incomes of $25,000 or greater. Unaccompanied seasonal workers have somewhat higher incomes, with 78% earning $10,000-25,000 per year and an additional 9% earning more than $25,000 per year. Table 8 below shows the distribution of unaccompanied migrant and seasonal workers within income ranges. Assuming that households can pay no more than 40% of gross income for rent, Table 8 also shows the rent that would be considered “affordable” for each income range.4
4 The 2010 Rental Market Study defines “cost burden” as paying more than 40 percent of income for rent, as specified by the Florida Housing Finance Corporation. The “Affordable Monthly Rent Range” column shows the range between 40 percent of the lowest income level and 40 percent of the highest income level in the corresponding “Annual Family Income” range.
19
Table 8. Incomes and Affordable Rents for Unaccompanied Farmworkers, 2008 Annual Family
Income Affordable
Monthly Rent
Range
Unaccompanied Migrant Worker
Household
Unaccompanied Seasonal Worker
Households
Total Unaccompanied
Worker Households
Percentage of Total
Unaccompanied Worker
Households $1,000 to $2,499 $33 to $83 2,848 19 2,867 4.49%$2,500 to $4,999
$84 to $167 3,071 1,324 4,395 6.88%
$5,000 to $7,499
$168 to $250 6,966 1,424 8,390 13.14%
$7,500 to $9,999
$251 to $333 4,600 1,246 5,846 9.15%
$10,000 to $12,499
$334 to $417 3,425 5,698 9,123 14.28%
$12,500 to $14,999
$418 to $500 4,477 6,772 11,249 17.61%
$15,000 to $17,499
$501 to $583 2,167 5,077 7,244 11.34%
$17,500 to $19,999
$584 to $667 2,569 4,596 7,165 11.22%
$20,000 to $24,999
$668 to $833 669 2,314 2,983 4.67%
$25,000 to $29,999
$834 to $1,000 466 2,073 2,539 3.98%
$30,000 to $34,999
$1,001 to $1,167 1,398 312 1,710 2.68%
$35,000 to $39,999
$1,168 to $1,333 0 309 309 0.48%
Over $40,000 $1,334 and above 0 50 50 0.08%
Total Households 32,656 31,214 63,870 100.00% Sources: United States Bureau of Labor Statistics, Quarterly Census of Employment and Wages, 2008 and United States Department of Labor, National Agricultural Workers Survey, 2005-2008.
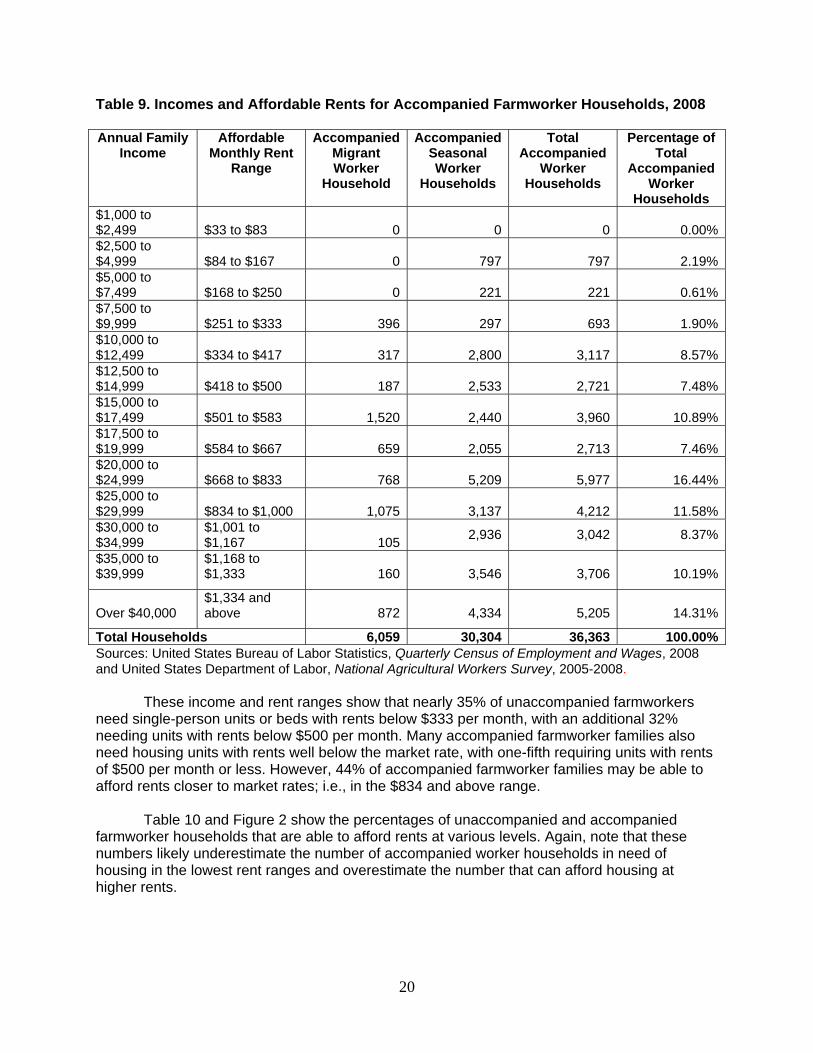
As Table 9 shows, accompanied farmworker households tend to have higher incomes than unaccompanied farmworkers. Among accompanied migrant workers, 7% earn less than $10,000 per year, 57% earn $10,000-25,0000 per year, and 36% earn $25,000 per year or more. Among accompanied seasonal worker households, only 4% earn less than $10,000 per year, 50% earn $10,000-25,000 per year, and 46% earn $25,000 per year or more.
20
Table 9. Incomes and Affordable Rents for Accompanied Farmworker Households, 2008 Annual Family
Income Affordable
Monthly Rent Range
Accompanied Migrant Worker
Household
Accompanied Seasonal Worker
Households
Total Accompanied
Worker Households
Percentage of Total
Accompanied Worker
Households $1,000 to $2,499 $33 to $83 0 0 0 0.00%$2,500 to $4,999 $84 to $167 0 797 797 2.19%$5,000 to $7,499 $168 to $250 0 221 221 0.61%$7,500 to $9,999 $251 to $333 396 297 693 1.90%$10,000 to $12,499 $334 to $417 317 2,800 3,117 8.57%$12,500 to $14,999 $418 to $500 187 2,533 2,721 7.48%$15,000 to $17,499 $501 to $583 1,520 2,440 3,960 10.89%$17,500 to $19,999 $584 to $667 659 2,055 2,713 7.46%$20,000 to $24,999 $668 to $833 768 5,209 5,977 16.44%$25,000 to $29,999 $834 to $1,000 1,075 3,137 4,212 11.58%$30,000 to $34,999
$1,001 to $1,167 105 2,936 3,042 8.37%
$35,000 to $39,999
$1,168 to $1,333 160 3,546 3,706 10.19%
Over $40,000 $1,334 and above 872 4,334 5,205 14.31%
Total Households 6,059 30,304 36,363 100.00%Sources: United States Bureau of Labor Statistics, Quarterly Census of Employment and Wages, 2008 and United States Department of Labor, National Agricultural Workers Survey, 2005-2008.
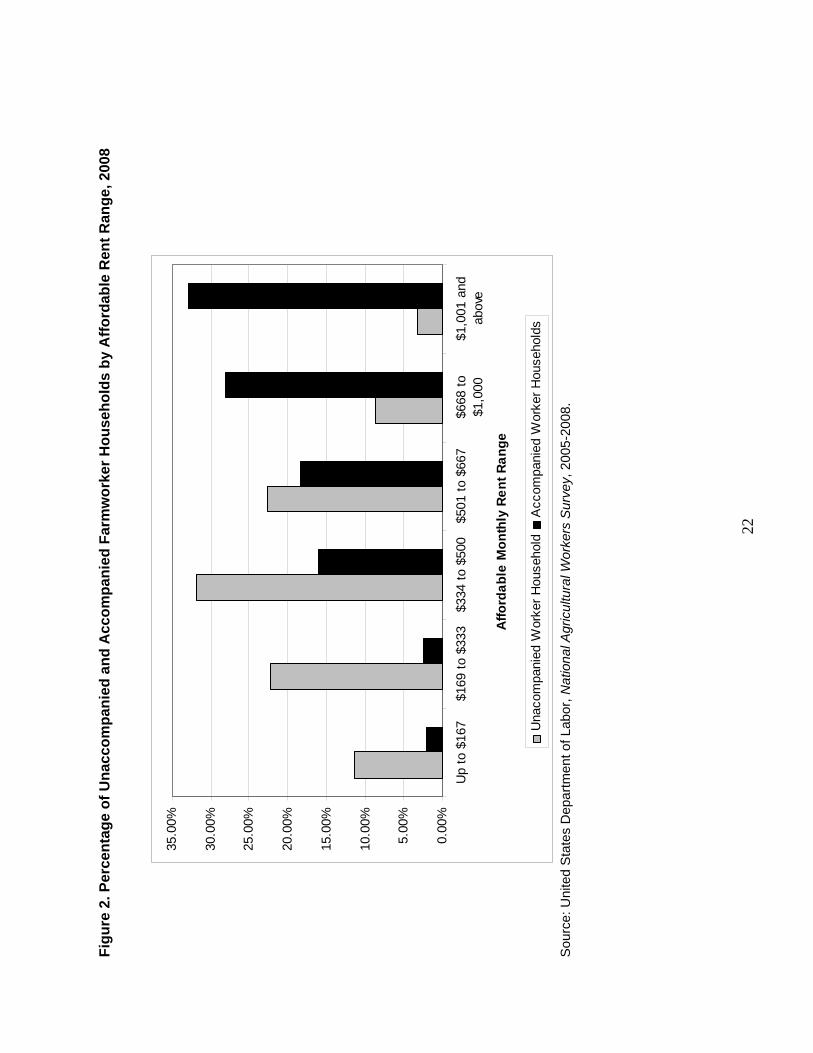
These income and rent ranges show that nearly 35% of unaccompanied farmworkers need single-person units or beds with rents below $333 per month, with an additional 32% needing units with rents below $500 per month. Many accompanied farmworker families also need housing units with rents well below the market rate, with one-fifth requiring units with rents of $500 per month or less. However, 44% of accompanied farmworker families may be able to afford rents closer to market rates; i.e., in the $834 and above range.
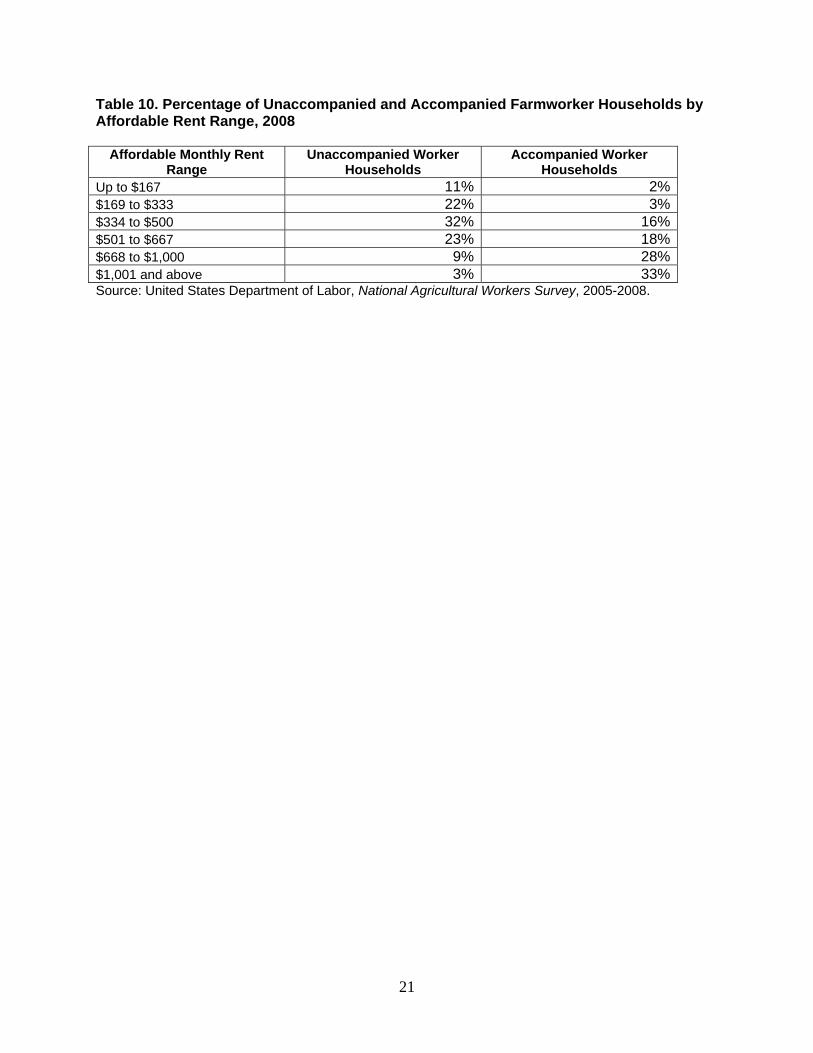
Table 10 and Figure 2 show the percentages of unaccompanied and accompanied
farmworker households that are able to afford rents at various levels. Again, note that these numbers likely underestimate the number of accompanied worker households in need of housing in the lowest rent ranges and overestimate the number that can afford housing at higher rents.
21
Table 10. Percentage of Unaccompanied and Accompanied Farmworker Households by Affordable Rent Range, 2008
Affordable Monthly Rent Range
Unaccompanied Worker Households
Accompanied Worker Households
Up to $167 11% 2%$169 to $333 22% 3%$334 to $500 32% 16%$501 to $667 23% 18%$668 to $1,000 9% 28%$1,001 and above 3% 33%Source: United States Department of Labor, National Agricultural Workers Survey, 2005-2008.
22
Figu
re 2
. Per
cent
age
of U
nacc
ompa
nied
and
Acc
ompa
nied
Far
mw
orke
r Hou
seho
lds
by A
fford
able
Ren
t Ran
ge, 2
008
0.00
%
5.00
%
10.0
0%
15.0
0%
20.0
0%
25.0
0%
30.0
0%
35.0
0%
Up
to $
167
$169
to $
333
$334
to $
500
$501
to $
667
$668
to$1
,000
$1,0
01 a
ndab
ove
Affo
rdab
le M
onth
ly R
ent R
ange
Una
com
pani
ed W
orke
r Hou
seho
ldA
ccom
pani
ed W
orke
r Hou
seho
lds
S
ourc
e: U
nite
d S
tate
s D
epar
tmen
t of L
abor
, Nat
iona
l Agr
icul
tura
l Wor
kers
Sur
vey,
200
5-20
08.
23
IV. FARMWORKER HOUSING SUPPLY
While farmworkers may find a variety of types of housing arrangements, two types of government-licensed or subsidized housing are reserved specifically for farmworkers:
• State- and federally-subsidized multifamily housing: The Florida Housing Finance
Corporation (Florida Housing) allocates some of its SAIL, HOME, and housing tax credit resources to multifamily developments designed to house farmworkers. In addition, a number of multifamily housing complexes receive development subsidies from the U.S. Department of Agriculture’s Rural Development (RD) program to provide housing for farmworker families under the Section 514 and 516 programs. Presently, there are 7,567 farmworker units with these types of financing in operation or under development, an 18% increase over the 2007 total of 6,401 units.
• Department of Health-permitted camps: The Florida Department of Health (DOH)
issues permits for camps to house unaccompanied migrant and seasonal farmworkers. The current occupancy of DOH-permitted camps is 34,527 beds. Of these, 1,118 beds are located in RD or Florida Housing multifamily developments. Therefore, the DOH camps add 33,409 unduplicated beds to the supply, a 21% increase over the 2007 total of 27,591 units.5 The tables and maps below reflect this unduplicated capacity.
Assuming that the Section 514/516 units and Florida Housing-assisted units can house
an average of four persons, the farmworker housing supply can house a total of 63,677 farmworkers and their family members in Florida.
Table 11 lists the supply of these two types of farmworker housing by Florida county.
The term “capacity” in this table and the following map refers to the number of individual farmworkers and their household members who can be housed. The term “unit” in this and later tables refers to an apartment in a Section 514/516 or Florida Housing development. A single unit may have the capacity to house several farmworkers and family members. Figure 3 maps the total capacity of beds for farmworkers and their family members by county.
5 The 2007 count of DOH-permitted beds may have been artificially low, as the listed capacity of permitted camps shifts over time depending on current occupancy. The 2010 count returns to historic levels of DOH camp capacity, similar to those reported in the 2001 and 2004 studies.
24
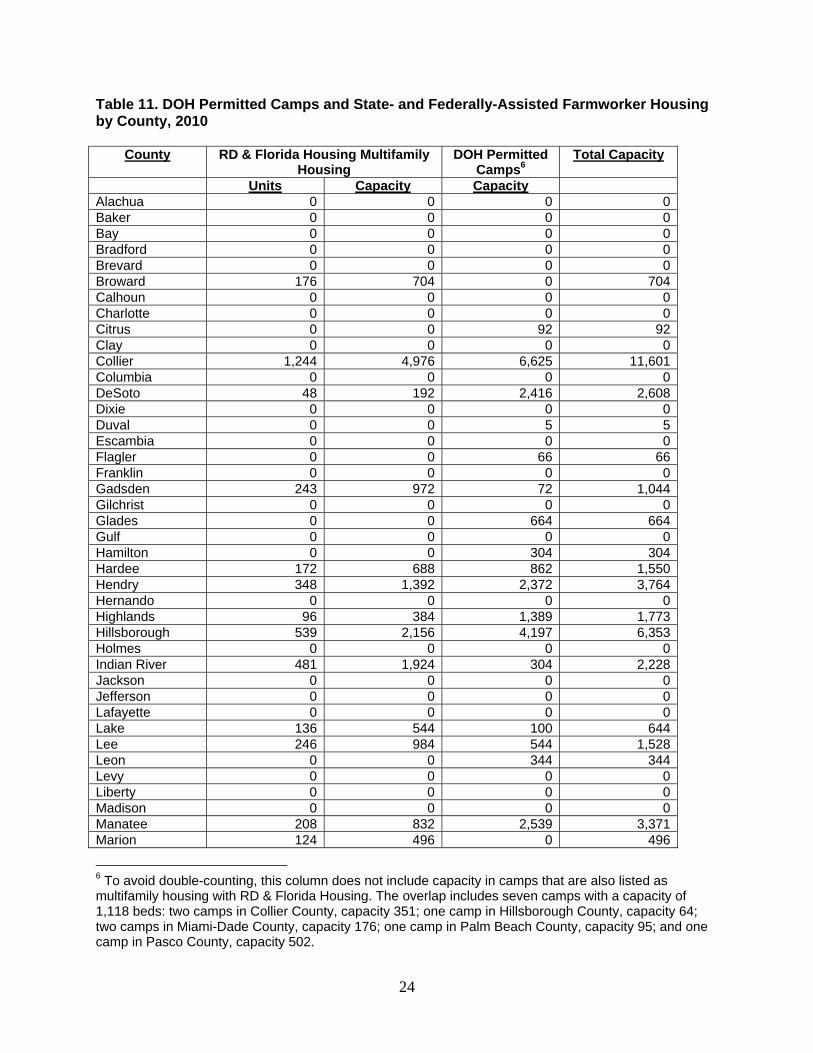
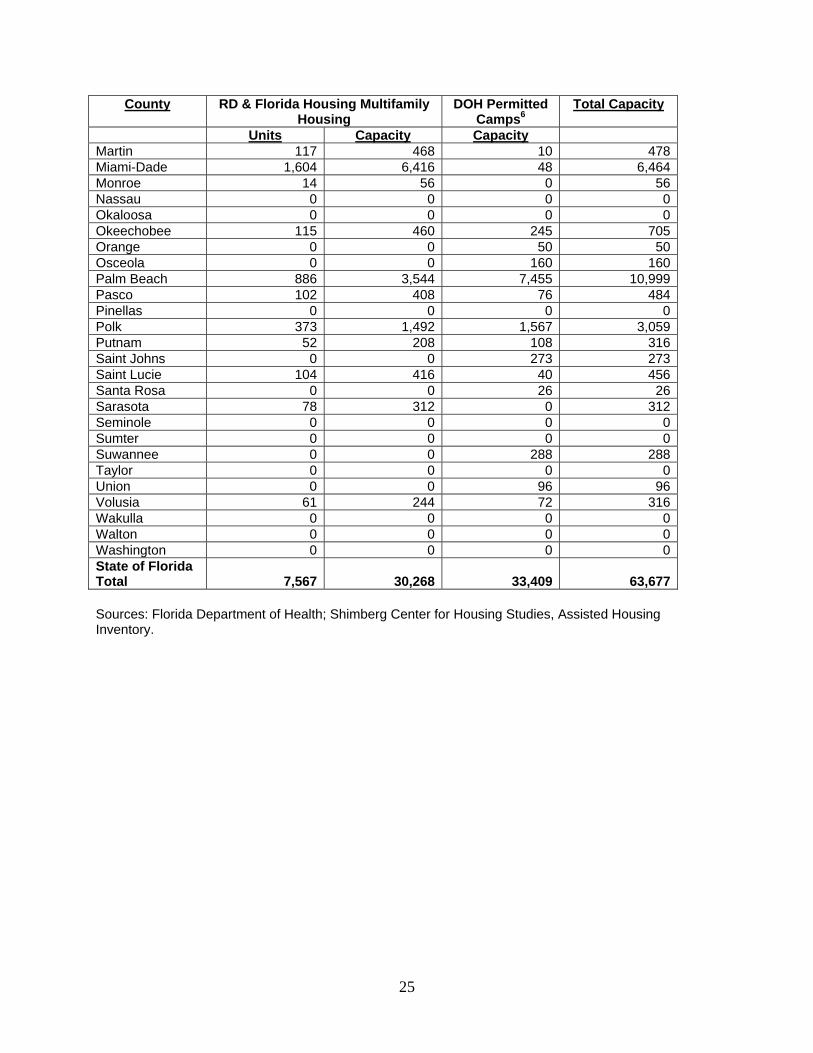
Table 11. DOH Permitted Camps and State- and Federally-Assisted Farmworker Housing by County, 2010
County RD & Florida Housing Multifamily Housing
DOH Permitted Camps6
Total Capacity
Units Capacity Capacity Alachua 0 0 0 0Baker 0 0 0 0Bay 0 0 0 0Bradford 0 0 0 0Brevard 0 0 0 0Broward 176 704 0 704Calhoun 0 0 0 0Charlotte 0 0 0 0Citrus 0 0 92 92Clay 0 0 0 0Collier 1,244 4,976 6,625 11,601Columbia 0 0 0 0DeSoto 48 192 2,416 2,608Dixie 0 0 0 0Duval 0 0 5 5Escambia 0 0 0 0Flagler 0 0 66 66Franklin 0 0 0 0Gadsden 243 972 72 1,044Gilchrist 0 0 0 0Glades 0 0 664 664Gulf 0 0 0 0Hamilton 0 0 304 304Hardee 172 688 862 1,550Hendry 348 1,392 2,372 3,764Hernando 0 0 0 0Highlands 96 384 1,389 1,773Hillsborough 539 2,156 4,197 6,353Holmes 0 0 0 0Indian River 481 1,924 304 2,228Jackson 0 0 0 0Jefferson 0 0 0 0Lafayette 0 0 0 0Lake 136 544 100 644Lee 246 984 544 1,528Leon 0 0 344 344Levy 0 0 0 0Liberty 0 0 0 0Madison 0 0 0 0Manatee 208 832 2,539 3,371Marion 124 496 0 496
6 To avoid double-counting, this column does not include capacity in camps that are also listed as multifamily housing with RD & Florida Housing. The overlap includes seven camps with a capacity of 1,118 beds: two camps in Collier County, capacity 351; one camp in Hillsborough County, capacity 64; two camps in Miami-Dade County, capacity 176; one camp in Palm Beach County, capacity 95; and one camp in Pasco County, capacity 502.
25
County RD & Florida Housing Multifamily Housing
DOH Permitted Camps6
Total Capacity
Units Capacity Capacity Martin 117 468 10 478Miami-Dade 1,604 6,416 48 6,464Monroe 14 56 0 56Nassau 0 0 0 0Okaloosa 0 0 0 0Okeechobee 115 460 245 705Orange 0 0 50 50Osceola 0 0 160 160Palm Beach 886 3,544 7,455 10,999Pasco 102 408 76 484Pinellas 0 0 0 0Polk 373 1,492 1,567 3,059Putnam 52 208 108 316Saint Johns 0 0 273 273Saint Lucie 104 416 40 456Santa Rosa 0 0 26 26Sarasota 78 312 0 312Seminole 0 0 0 0Sumter 0 0 0 0Suwannee 0 0 288 288Taylor 0 0 0 0Union 0 0 96 96Volusia 61 244 72 316Wakulla 0 0 0 0Walton 0 0 0 0Washington 0 0 0 0State of Florida Total 7,567 30,268 33,409 63,677 Sources: Florida Department of Health; Shimberg Center for Housing Studies, Assisted Housing Inventory.
26
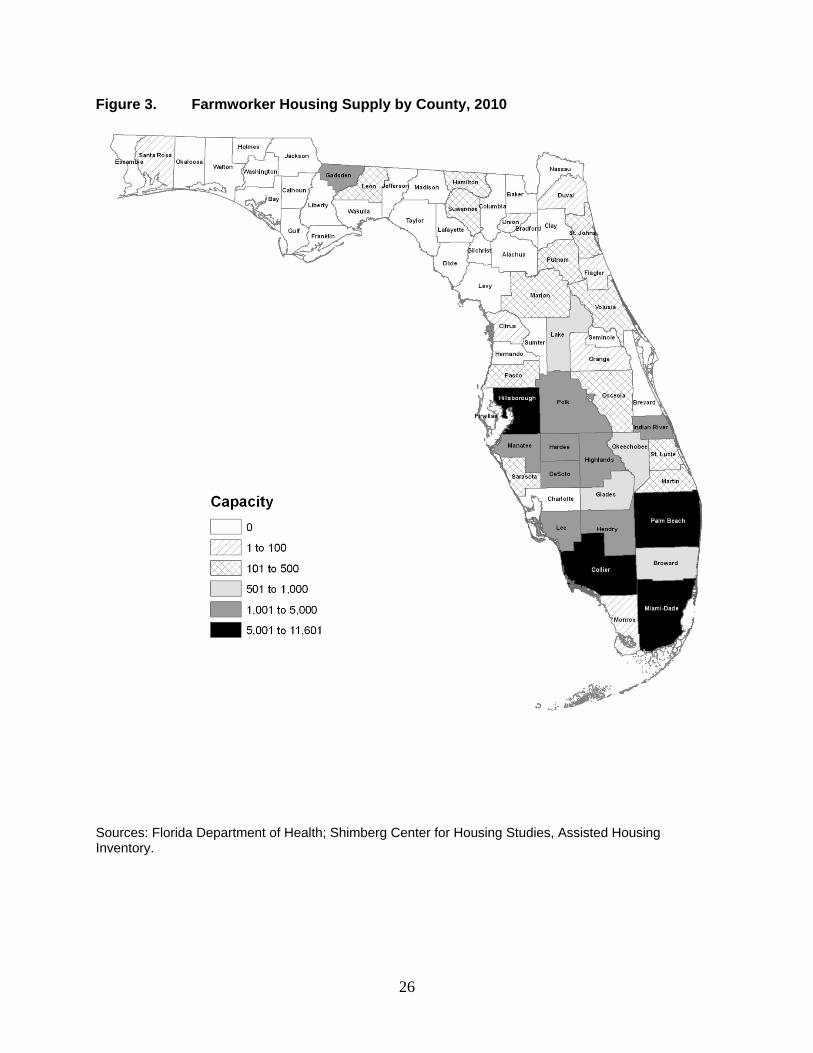
Figure 3. Farmworker Housing Supply by County, 2010
Sources: Florida Department of Health; Shimberg Center for Housing Studies, Assisted Housing Inventory.
27
The 13 counties with the capacity to house 1,000 or more farmworkers are Collier,
DeSoto, Gadsden, Hardee, Hendry, Highlands, Hillsborough, Indian River, Lee, Manatee, Miami-Dade, Palm Beach, and Polk. These counties contain 88% of the state’s farmworker housing capacity.
In most cases, the counties with the most farmworker housing supply also have the most
farmworkers. Hillsborough, Miami-Dade, Palm Beach, Manatee, Polk, Collier, Hendry, and Volusia Counties appear on the lists of counties with highest number of farmworkers and the largest farmworker housing capacity. There are, however, some disparities between the lists: Orange County ranks seventh in the number of farmworkers, St. Lucie County ranks eighth, and Volusia County ranks tenth, but these counties have housing capacity below 1,000.
It is important to note that many farmworkers meet their housing needs through the
private market or through subsidized housing not specifically reserved for farmworkers. Thus, the supply described in this section does not represent the full extent of affordable housing that might be available to farmworkers. When compared with the number of farmworker households and household members, as in the following section, this constrained definition of supply yields a higher need for farmworker housing than what a true accounting of the full supply of housing available to farmworkers would yield.
28
V. NEED ESTIMATE: COMPARISON OF SUPPLY AND HOUSEHOLDS
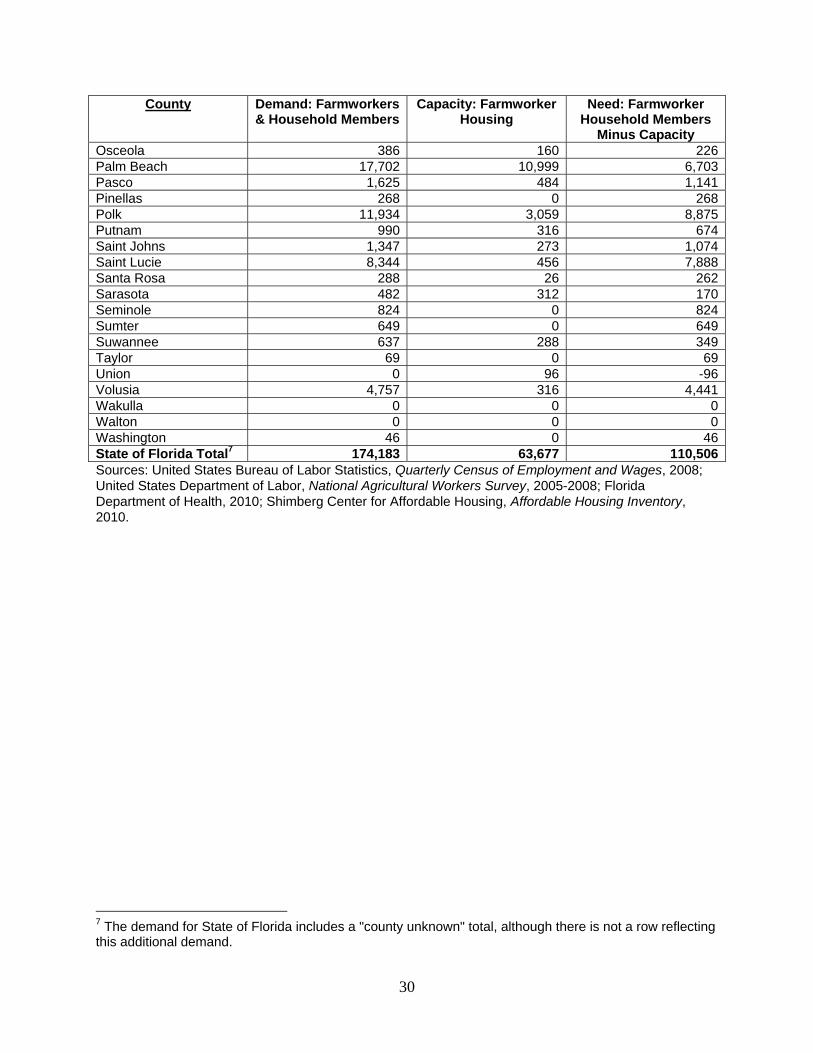
The following estimates of the need for additional farmworker housing in Florida compare the supply of farmworker housing in each county to the number of farmworker households and household members. Table 12 estimates the need for total capacity— the number of individuals who need farmworker housing in each county—by comparing the capacity of DOH-permitted camps, Section 514/516 housing, and Florida Housing-assisted farmworker housing to the number of farmworkers and household members. Note that each Section 514/516 and Florida Housing-assisted unit adds a capacity of four to the supply.
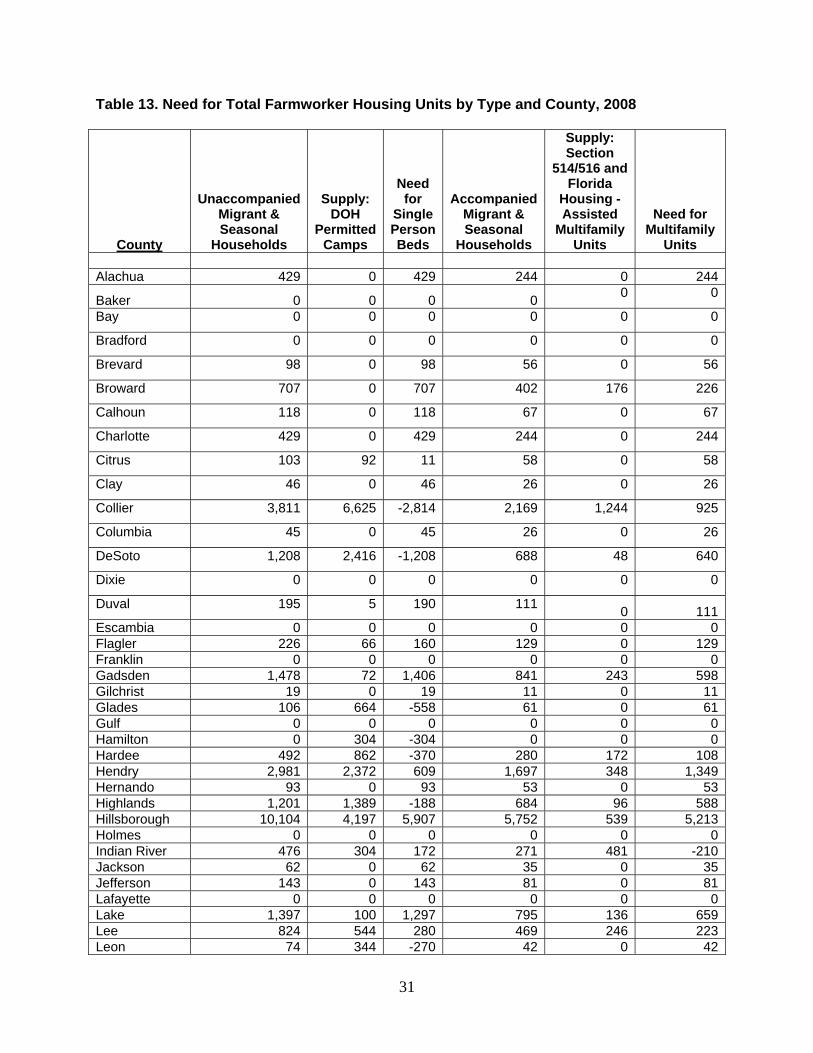
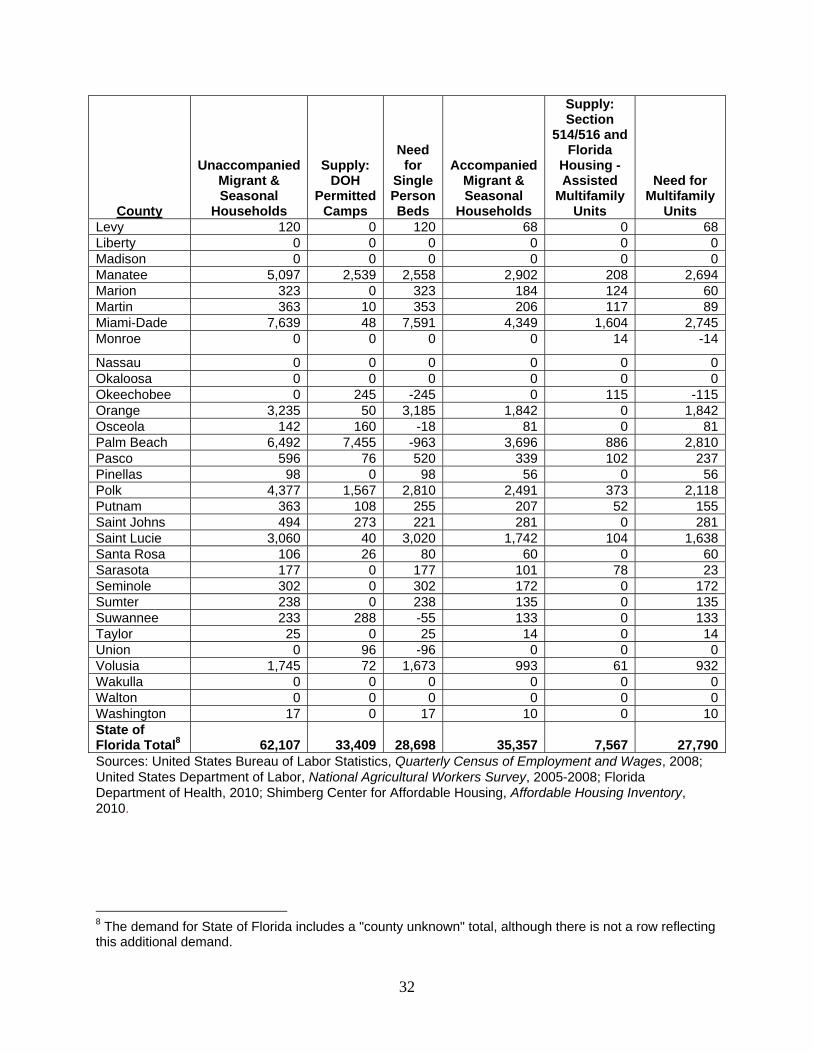
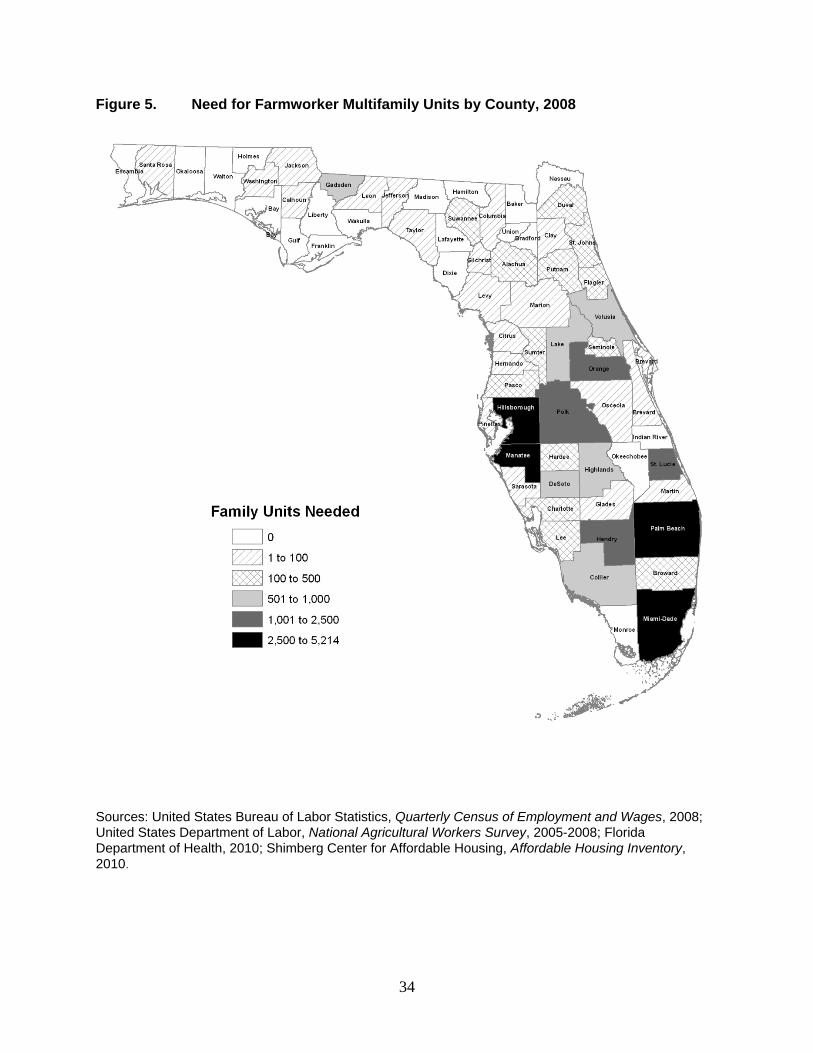
Table 13 estimates the need for beds for single farmworkers and housing units for
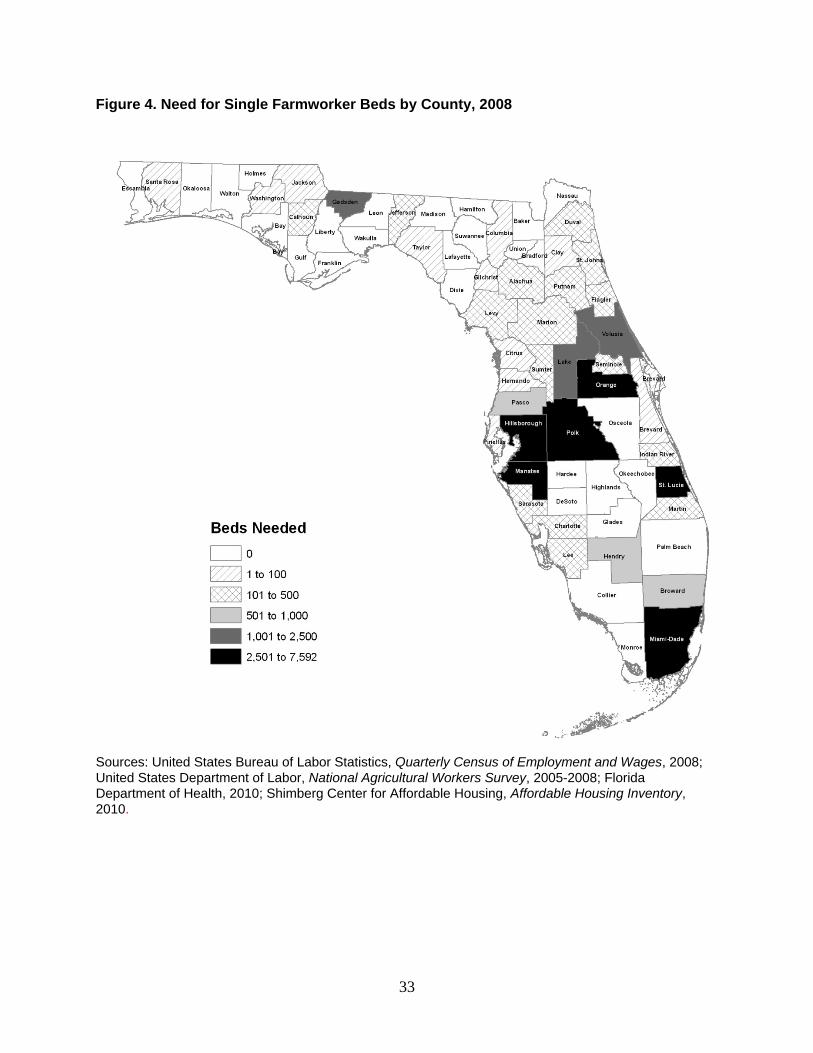
families by comparing the number of DOH-permitted units to the number of unaccompanied farmworkers and the number of multifamily Section 514/516 and Florida Housing-assisted units to the number of accompanied farmworker households. In this table, a single unit is counted once rather than as a capacity of four. Figures 4 and 5 are maps showing the need for beds for unaccompanied farmworkers and for multifamily units by county.
While we have compared the number of unaccompanied farmworkers to the number of
DOH-permitted camp beds in Table 13, it is important to note that groups of unaccompanied farmworkers also may share units in state- and federally-subsidized multifamily developments. Therefore, some of the Florida Housing and Section 514/516 units that we have assigned to accompanied farmworker households may serve unaccompanied workers. Moreover, because unaccompanied workers may share housing, the numbers of beds needed for them do not necessarily translate to the number of individual units needed. Multifamily units may provide several beds; for example, a two-bedroom unit may provide four beds for unaccompanied farmworkers. Finally, note that any developments appearing in both the Florida Housing/RD multifamily list and the DOH camp list will be reflected in the multifamily category only.
Analysis of the numbers in Table 12 and 13 reveals that the total statewide gap between
farmworker housing capacity and the number of farmworkers and their household members is 110,506 beds. The total gap between the number of single worker beds and the number of unaccompanied farmworkers is 28,698 beds. Nine counties have an unmet need for single worker housing exceeding 1,000 beds: Gadsden, Hillsborough, Lake, Manatee, Miami-Dade, Orange, Polk, St. Lucie, and Volusia. The total gap between the number of multifamily units and the number of accompanied farmworker households is 27,790 units. The eight counties with unmet need for multifamily farmworker units exceeding 1,000 units are Hendry, Hillsborough, Manatee, Miami-Dade, Orange, Palm Beach, Polk, and St. Lucie.
The supply and demand numbers show marked changes from the previous Rental
Market Study. The gap between unaccompanied workers and the supply of DOH-permitted camps dropped dramatically—a 42% drop from 49,568 beds in 2007 to 28,698 beds 2010. As noted above, the number of unaccompanied workers decreased from 2007 to 2010, while the capacity of DOH-permitted camps increased during the same time. However, the gap between accompanied worker households and multifamily units increased by 27%, from 21,768 units in 2007 to a 27,790 unit gap in 2010. The increase in multifamily units during this time was more than offset by a large increase in accompanied worker households.
29
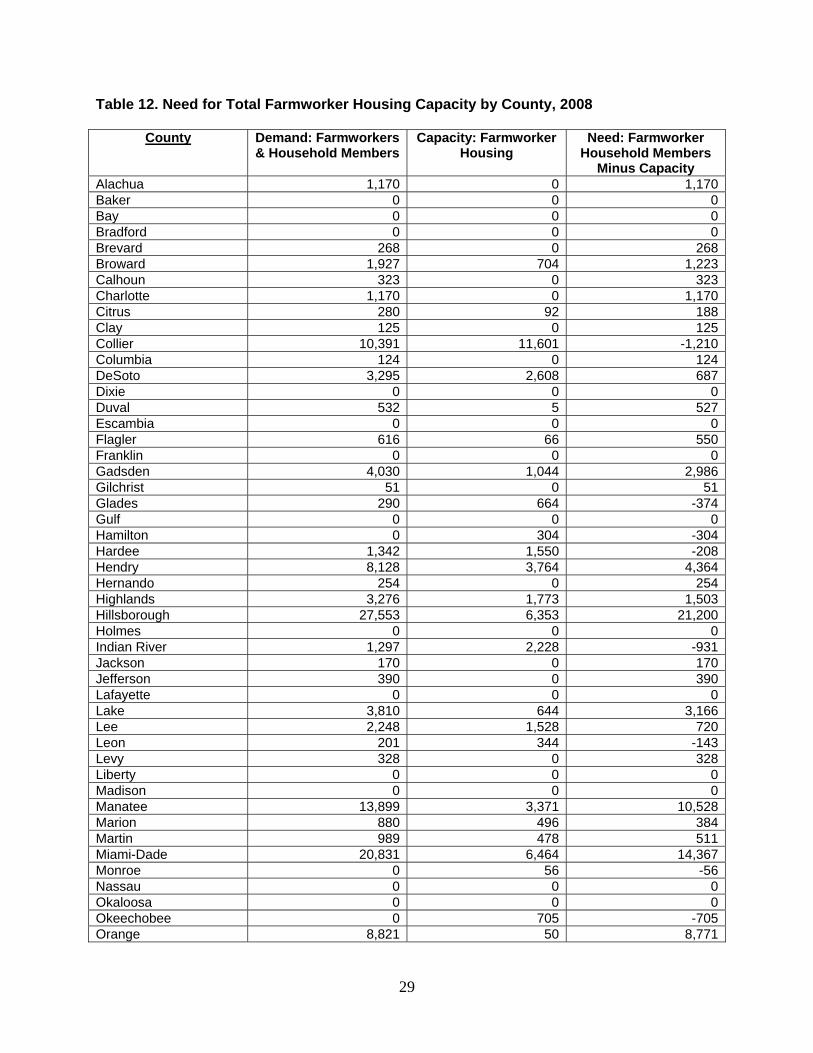
Table 12. Need for Total Farmworker Housing Capacity by County, 2008
County Demand: Farmworkers & Household Members
Capacity: Farmworker Housing
Need: Farmworker Household Members
Minus Capacity Alachua 1,170 0 1,170Baker 0 0 0Bay 0 0 0Bradford 0 0 0Brevard 268 0 268Broward 1,927 704 1,223Calhoun 323 0 323Charlotte 1,170 0 1,170Citrus 280 92 188Clay 125 0 125Collier 10,391 11,601 -1,210Columbia 124 0 124DeSoto 3,295 2,608 687Dixie 0 0 0Duval 532 5 527Escambia 0 0 0Flagler 616 66 550Franklin 0 0 0Gadsden 4,030 1,044 2,986Gilchrist 51 0 51Glades 290 664 -374Gulf 0 0 0Hamilton 0 304 -304Hardee 1,342 1,550 -208Hendry 8,128 3,764 4,364Hernando 254 0 254Highlands 3,276 1,773 1,503Hillsborough 27,553 6,353 21,200Holmes 0 0 0Indian River 1,297 2,228 -931Jackson 170 0 170Jefferson 390 0 390Lafayette 0 0 0Lake 3,810 644 3,166Lee 2,248 1,528 720Leon 201 344 -143Levy 328 0 328Liberty 0 0 0Madison 0 0 0Manatee 13,899 3,371 10,528Marion 880 496 384Martin 989 478 511Miami-Dade 20,831 6,464 14,367Monroe 0 56 -56Nassau 0 0 0Okaloosa 0 0 0Okeechobee 0 705 -705Orange 8,821 50 8,771
30
County Demand: Farmworkers & Household Members
Capacity: Farmworker Housing
Need: Farmworker Household Members
Minus Capacity Osceola 386 160 226Palm Beach 17,702 10,999 6,703Pasco 1,625 484 1,141Pinellas 268 0 268Polk 11,934 3,059 8,875Putnam 990 316 674Saint Johns 1,347 273 1,074Saint Lucie 8,344 456 7,888Santa Rosa 288 26 262Sarasota 482 312 170Seminole 824 0 824Sumter 649 0 649Suwannee 637 288 349Taylor 69 0 69Union 0 96 -96Volusia 4,757 316 4,441Wakulla 0 0 0Walton 0 0 0Washington 46 0 46State of Florida Total7 174,183 63,677 110,506Sources: United States Bureau of Labor Statistics, Quarterly Census of Employment and Wages, 2008; United States Department of Labor, National Agricultural Workers Survey, 2005-2008; Florida Department of Health, 2010; Shimberg Center for Affordable Housing, Affordable Housing Inventory, 2010.
7 The demand for State of Florida includes a "county unknown" total, although there is not a row reflecting this additional demand.
31
Table 13. Need for Total Farmworker Housing Units by Type and County, 2008
County
Unaccompanied Migrant & Seasonal
Households
Supply: DOH
Permitted Camps
Need for
Single Person Beds
Accompanied Migrant & Seasonal
Households
Supply: Section
514/516 and Florida
Housing - Assisted
Multifamily Units
Need for Multifamily
Units
Alachua 429 0 429 244 0 244
Baker 0 0 0 0 0 0
Bay 0 0 0 0 0 0
Bradford 0 0 0 0 0 0
Brevard 98 0 98 56 0 56
Broward 707 0 707 402 176 226
Calhoun 118 0 118 67 0 67
Charlotte 429 0 429 244 0 244
Citrus 103 92 11 58 0 58
Clay 46 0 46 26 0 26
Collier 3,811 6,625 -2,814 2,169 1,244 925
Columbia 45 0 45 26 0 26
DeSoto 1,208 2,416 -1,208 688 48 640
Dixie 0 0 0 0 0 0
Duval 195 5 190 111 0 111Escambia 0 0 0 0 0 0Flagler 226 66 160 129 0 129Franklin 0 0 0 0 0 0Gadsden 1,478 72 1,406 841 243 598Gilchrist 19 0 19 11 0 11Glades 106 664 -558 61 0 61Gulf 0 0 0 0 0 0Hamilton 0 304 -304 0 0 0Hardee 492 862 -370 280 172 108Hendry 2,981 2,372 609 1,697 348 1,349Hernando 93 0 93 53 0 53Highlands 1,201 1,389 -188 684 96 588Hillsborough 10,104 4,197 5,907 5,752 539 5,213Holmes 0 0 0 0 0 0Indian River 476 304 172 271 481 -210Jackson 62 0 62 35 0 35Jefferson 143 0 143 81 0 81Lafayette 0 0 0 0 0 0Lake 1,397 100 1,297 795 136 659Lee 824 544 280 469 246 223Leon 74 344 -270 42 0 42
32
County
Unaccompanied Migrant & Seasonal
Households
Supply: DOH
Permitted Camps
Need for
Single Person Beds
Accompanied Migrant & Seasonal
Households
Supply: Section
514/516 and Florida
Housing - Assisted
Multifamily Units
Need for Multifamily
Units Levy 120 0 120 68 0 68Liberty 0 0 0 0 0 0Madison 0 0 0 0 0 0Manatee 5,097 2,539 2,558 2,902 208 2,694Marion 323 0 323 184 124 60Martin 363 10 353 206 117 89Miami-Dade 7,639 48 7,591 4,349 1,604 2,745Monroe 0 0 0 0 14 -14
Nassau 0 0 0 0 0 0Okaloosa 0 0 0 0 0 0Okeechobee 0 245 -245 0 115 -115Orange 3,235 50 3,185 1,842 0 1,842Osceola 142 160 -18 81 0 81Palm Beach 6,492 7,455 -963 3,696 886 2,810Pasco 596 76 520 339 102 237Pinellas 98 0 98 56 0 56Polk 4,377 1,567 2,810 2,491 373 2,118Putnam 363 108 255 207 52 155Saint Johns 494 273 221 281 0 281Saint Lucie 3,060 40 3,020 1,742 104 1,638Santa Rosa 106 26 80 60 0 60Sarasota 177 0 177 101 78 23Seminole 302 0 302 172 0 172Sumter 238 0 238 135 0 135Suwannee 233 288 -55 133 0 133Taylor 25 0 25 14 0 14Union 0 96 -96 0 0 0Volusia 1,745 72 1,673 993 61 932Wakulla 0 0 0 0 0 0Walton 0 0 0 0 0 0Washington 17 0 17 10 0 10State of Florida Total8 62,107 33,409 28,698 35,357 7,567 27,790Sources: United States Bureau of Labor Statistics, Quarterly Census of Employment and Wages, 2008; United States Department of Labor, National Agricultural Workers Survey, 2005-2008; Florida Department of Health, 2010; Shimberg Center for Affordable Housing, Affordable Housing Inventory, 2010.
8 The demand for State of Florida includes a "county unknown" total, although there is not a row reflecting this additional demand.
33
Figure 4. Need for Single Farmworker Beds by County, 2008
Sources: United States Bureau of Labor Statistics, Quarterly Census of Employment and Wages, 2008; United States Department of Labor, National Agricultural Workers Survey, 2005-2008; Florida Department of Health, 2010; Shimberg Center for Affordable Housing, Affordable Housing Inventory, 2010.
34
Figure 5. Need for Farmworker Multifamily Units by County, 2008
Sources: United States Bureau of Labor Statistics, Quarterly Census of Employment and Wages, 2008; United States Department of Labor, National Agricultural Workers Survey, 2005-2008; Florida Department of Health, 2010; Shimberg Center for Affordable Housing, Affordable Housing Inventory, 2010.
35
VI. DATA LIMITATIONS
The numbers of farmworkers and housing units and the income numbers on which the analysis in this report is based should be used with caution due to several data limitations. First, as noted in the Methodology section, the method of using QCEW data on wages to estimate the number of farmworkers results in only 86% of farmworkers being assigned to specific counties. An additional two percent are designated as “County Unknown,” and the remaining 12% are distributed among counties based on those counties’ share of the 86% of workers already allocated. This will result in overestimates of workers in some counties, particularly those with the largest number of farmworkers, and underestimates of workers in some of the counties with fewer workers.
Second, the sample of workers questioned for the NAWS survey is small and may
under-represent people working on Florida citrus farms. Thus, the division between migrant and seasonal workers, the division between accompanied and unaccompanied workers, and the income numbers are subject to error.
Third, as noted in Section II, the lack of family income data by household led us to
extrapolate the number of households in each income range from the number of workers in that range. This may have led to an overestimate of accompanied worker households at the higher income levels and an underestimate of accompanied worker households at the lower income levels.
Finally, as noted in Section III, the count of housing units for farmworkers and their
families does not include farmworker housing that might be provided by the private market or local entities, other than those licensed as camps by the state. In some cases, the camps themselves may be able to house more workers, since the capacity recorded by DOH reflects point-in-time occupancy levels. Therefore, while the supply numbers do accurately reflect the stock of state- and federally-subsidized multifamily units reserved for farmworkers and likely account for the vast majority of beds in DOH camps, they do not reflect all of the housing choices that may be available to farmworkers.
36
REFERENCES Shimberg Center for Housing Studies. Affordable Housing Inventory, 2010. Gainesville, FL. United States Bureau of Labor Statistics. 2008 Quarterly Census of Employment and Wages. Washington, D.C. United State Department of Labor. 2005 National Agricultural Workers Survey. Washington, D.C. United State Department of Labor. 2006 National Agricultural Workers Survey. Washington, D.C. United State Department of Labor. 2007 National Agricultural Workers Survey. Washington, D.C. United State Department of Labor. 2008 National Agricultural Workers Survey. Washington, D.C.

Florida Housing Data ClearinghouseShimberg Center for Housing StudiesM.E. Rinker, Sr. School of Building ConstructionCollege of Design, Construction & PlanningUniversity of Florida203 Rinker HallP.O. Box 115703Gainesville, Florida 32611-5703
www.flhousingdata.shimberg.ufl.edu