Embed Size (px)
Citation preview

Running Title: Hurricanes and climate change 1
2
3
4
5
6
7
8
9
10
11
12
13
14
15 16 17 18 19
20 21 22 23 24 25 26 27
The water and energy budgets of hurricanes
and implications for climate change
Kevin E. Trenberth and John Fasullo
National Center for Atmospheric Research1
Boulder CO 80307
email: [email protected]
phone: (303) 497 1318
fax: (303) 497 1333
1 December, 2006 Revised 20 March, 2007
Revised 3 July 2007, 27 August 2007
JGR
Index terms: 1620 Climate dynamics 3305 Climate change and variability 3339 Ocean/atmosphere interactions 3354 Precipitation 3374 Tropical meteorology Keywords: hurricanes, precipitation, evaporation, climate change, tropical storms
1 The National Center for Atmospheric Research is sponsored by the National Science Foundation.
1

Abstract 28
29
30
31
32
33
34
35
36
37
38
39
40
41
42
43
44
45
46
47
48
Based on simulations of hurricane Katrina in August 2005 with the advanced Weather and
Research Forecasting (WRF) model at 4 km resolution without parameterized convection,
empirical relationships are computed between the maximum simulated wind and the surface
fluxes and precipitation, and provide a reasonable fit to the data. The best track dataset of global
observed tropical cyclones is used to estimate the frequency that storms of a given strength occur
over the globe after 1970. For 1990-2005 the total surface heat loss by the tropical ocean in
hurricanes category 1 to 5 within 400 km of the center of the storms is estimated to be about
0.53×10²² J per year (0.17 PW). The enthalpy loss due to hurricanes computed based on
precipitation is about a factor of 3.4 greater (0.58 PW), owing to the addition of the surface
fluxes from outside 400 km radius and moisture convergence into the storms typically from as
far from the eye as 1600 km. Globally these values correspond to 0.33 W m-2 for evaporation, or
1.13 W m-2 for precipitation. Changes over time reflect basin differences and a prominent role
for El Niño, and the most active period globally was 1989 to 1997. Strong positive trends from
1970 to 2005 occur in these inferred surface fluxes and precipitation arising from increases in
intensity of storms and also higher sea surface temperatures. Confidence in this result is limited
by uncertainties in the best track tropical cyclone data. Nonetheless, the results highlight the
importance of surface energy exchanges in global energetics of the climate system and are
suggestive of the deficiencies in climate models owing to their inadequate representation of
hurricanes.
2

1. Introduction 49
50
51
52
53
54
55
56
57
58
59
60
61
62
63
64
65
66
67
68
69
70
71
72
What role, if any, do hurricanes and tropical cyclones have in our climate system? Why do
hurricanes exist? These rather fundamental questions are the motivation for the research outlined
here and have substantial implications for both our understanding and modeling of the climate
system and its variability. For instance, if hurricanes do play a key role in climate, as many
researchers suspect, and such storms are not well simulated in climate models [e.g., Yoshimura et
al. 2006], then it means that climate models have basic errors as the tropical storm processes
have to be compensated for in some other way. Moreover, clear answers to these questions are
essential if we are to understand better how hurricanes are altered by and affect a changing
climate.
The perspective put forward here is in the context of the energy and water cycles. In a
companion paper [Trenberth et al., 2007], the bulk water budgets for some high-resolution
simulated hurricanes are assessed and some inferences regarding the energy transports and
overall energy budget are made. It is well known that the main fuel for hurricanes is the latent
heat release in convection acting collectively and organized by the hurricane circulation to drive
the storm [e.g., Krishnamurti et al., 2005; Braun, 2006]. This provides the reason to focus on the
water cycle and the latent energy that arises from condensation of moisture in precipitation,
while the moisture in turn comes from evaporation from the ocean surface, in part brought about
by the storm itself. Changes in precipitation and associated flooding over land are also of
considerable interest from a societal standpoint.
It is suggested here that a primary role for hurricanes comes about because they are the only
phenomenon that can effectively pump large amounts of heat out of the ocean, into the
3

atmosphere, and disperse it to regions where it can be radiated to space, thereby mitigating the
heat buildup that otherwise occurs. In this perspective, the organized strong surface winds in
hurricanes sufficiently increase the surface evaporation such that the latent heat losses by the
ocean can exceed 1,000 W m
73
74
75
76
77
78
79
80
81
82
83
84
85
86
87
88
89
90
91
92
93
94
95
96
-2, which is an order of magnitude larger than the summertime
climatological value. Although hurricanes can be analyzed in terms of vortex dynamics and the
favorable conditions required for them to exist and develop, the more fundamental question is
why those conditions develop in the first place? It is argued that at least somewhere around the
Tropics in summer, in the neighborhood of the highest sea surface temperatures (SSTs), is where
the main tropical cyclone activity will be favored [e.g., Yoshimura et al., 2006]. The tradewinds
are strongest away from that region and occur where the SST temperature gradients and
associated surface pressure gradients are strong. There may be two or perhaps three such regions
in the Tropics in any season, but large-scale tropical dynamics associated with monsoonal and
Walker circulations guarantees competition for the primary location and thus where conditions
for storm formation and intensification will be most favorable. Less favorable regions suffer
from vertical wind shear and atmospheric stability structures (such as inversions) associated with
the atmospheric circulation that make conditions less conducive to vortex development [Latif et
al., 2007].
A review of early estimates of the water and energy budgets in hurricanes is given in Trenberth
et al. [2007] and several estimates for individual tropical cyclones stand the test of time [Palmén
and Riehl, 1957; Malkus and Riehl, 1960; Riehl and Malkus, 1961; Miller, 1962; Anthes, 1974].
A comprehensive summary of the understanding of hurricanes and their relationship to climate is
given by Emanuel [2003] in which he describes the current understanding of the energetics of
tropical storms, the role of air-sea interaction and effects on upper-ocean mixing, and how
4

97
98
99
100
101
102
103
104
105
106
107
108
109
110
111
112
113
114
115
116
117
118
119
120
tropical storm activity may change as the climate changes, providing an excellent basis for the
perspective put forward here, and hence a summary is provided below.
In this paper we make use of the control run simulation results of Trenberth et al. [2007] for
Katrina in August 2005 made with the high-resolution (4 km) Advanced Research Weather and
Research Forecasting (WRF) model that avoids the use of parameterized convection. We also
make use of the historical “best track” global tropical cyclone record which originates from the
Tropical Prediction Center of NOAA and the Joint Typhoon Warning Center of the U. S.
Department of Defense. Concerns about this record are discussed in sections 3b and 4. Based
on the relationships between surface latent heat and enthalpy fluxes and maximum wind speed in
the model results, and with the observed frequency with which storms of certain intensities occur
from the best track data, we estimate a preliminary global value for the enthalpy and moisture
loss by the ocean due to hurricanes and how this has changed over recent decades. Values are
computed based on the direct exchanges within 400 km of the eye of the storms and also
approximately for the whole storm based on the resulting precipitation. While this may seem to
be a huge extrapolation of the data from both the limited model runs and the best track data, the
exercise itself demonstrates how far we can go and still get reasonable results. Even if not
quantitatively correct, the results provide what may be regarded as an index of changes over time
for this set of best track data, and they provide an initial estimate of the effects of hurricanes on
the ocean in terms of heat exchanges for the first time. Subsequent refinements in the
observational record of storms will undoubtedly improve upon the values presented here.
In the following section we first review the background state of knowledge on both the
energetics and water cycle of storms and tropical storms and introduce some outstanding issues.
5
121
122
123
124
125
126
127
128
129
130
131
132
133
134
135
136
137
138
139
140
141
142
143
144
Section 3 presents results using the best track data along with inferences based on WRF model
results and places them in the context of the global energy cycle. Section 4 discusses these
results, and ways to improve these preliminary estimates.
2. Storm energetics and water cycle
a. Energetics
An overall view of the flow of energy through the climate system and the annual cycle of uptake
and storage of heat by the ocean at the surface is given in Trenberth and Stepaniak [2003a, b;
2004]. The basic source of energy for tropical cyclones is heat transfer from the ocean.
Divergence of ocean heat in a column from heat transports is fairly small, and long-wave
radiation to space directly from the surface is limited by the optically-thick layer of water vapor.
Hence to a first approximation over the tropical oceans, absorption of solar radiation at the
surface is largely offset by evaporative cooling. While background climatological latent heat
fluxes in the tropical regions are order 120 W m-2 [Josey et al., 1998] it is likely that these
estimates do not reflect hurricane effects adequately.
Emanuel [2003] likens the energy cycle of a mature tropical cyclone to that of an ideal Carnot
cycle. In this analogy, air at the surface air spirals into the center of the storm in contact with the
ocean and picks up moisture from the surface, increasing entropy, while dissipating kinetic
energy in the boundary layer through surface friction and momentum exchange with the ocean
[Bister and Emanuel, 1998]. In the eyewall convection, predominantly adiabatic expansion and
cooling occurs as air rises and moisture is condensed in precipitation, with the latent heat
realized as sensible heat and potential energy (dry static energy), but entropy is roughly
conserved. The air diverges at the top of the storm, flows out and the now dry air warms
6

145
146
147
148
149
150
151
152
153
154
155
156
157
158
159
160
161
162
163
164
165
166
167
168
adiabatically as it subsides in the downward branch some distance from the storm center. It is in
these legs that radiation to space can occur as the air is above the boundary layer water vapor.
As some of this energy is transported out of the subtropics to higher latitudes before it is radiated
to space [Trenberth and Stepaniak, 2003b], the circulation is not closed. Also, as the lifetime of
a typical tropical cyclone is order 6 days, it is not in equilibrium with the environment. Hence
the Carnot cycle is approximate.
In tropical cyclones, work is used up in turbulent dissipation in the storm’s atmospheric
boundary layer, where it is turned back into heat. Because this conversion occurs at the highest
temperature in the system, the hurricane recycles some heat back into the Carnot cycle [Bister
and Emanuel, 1998]. Hence tropical cyclones are driven by enthalpy fluxes from the sea, mainly
in the form of evaporation of moisture, and are limited mostly by surface drag. Emanuel [2003]
discusses uncertainties at high wind speeds and how sea spray may enhance the sea-air enthalpy
flux at high wind speeds. Estimates of the kinetic energy dissipation in real storms [Emanuel,
2003] suggest that the average tropical cyclone dissipates approximately 3×10¹² W, and very
large and intense storms can dissipate an order of magnitude more power. However, as shown
here and in Palmén and Riehl [1957], tropical cyclones move even larger amounts of energy
around from the ocean to the atmosphere and ultimately to space.
From the standpoint of the ocean, therefore, the tropical storm produces a net cooling, but it
actually does much more. Emanuel [2001, 2003] review the evidence for the large effects of
hurricanes on the uppermost 200–300 m of the ocean, in which a storm deepens the mixed layer
by many tens of meters, and cools the SST locally by as much as 5ºC. Most of the cooling is
owing to entrainment caused by turbulence generated from the strong shear of the near-inertial
7

currents across the base of the mixed layer. A detailed analysis by Walker et al. [2005] of the
cold wake left behind hurricane Ivan in 2004 reveals SST cooling of 3-7°C in two areas along
Ivan’s track, related closely to the depth of the mixed layer and upper ocean heat content. Similar
results for hurricane Frances in 2004 are given by Chen et al. [2007] and for Katrina in 2005 by
Davis et al. [2007].
169
170
171
172
173
174
175
176
177
178
179
180
181
182
183
184
185
186
187
188
189
190
191
192
In spite of their intense air-sea interactions, tropical cyclones are usually considered to respond
passively to climate changes on many timescales [Emanuel, 2003]. Emanuel [2001] estimated
for 1996 the net cold wake from both effects of mixing and heat loss of 1.4±0.7 PW and
suggested that subsequent heating of the ocean would restore this, so that ocean heat transports
were required to achieve a balance. Accordingly, Emanuel [2001] has argued that much of the
thermohaline circulation is actually driven by global tropical cyclone activity, and this is
supported by observational evidence [Sriver and Huber, 2007]. Perhaps even more
fundamentally, tropical cyclones assist the climate system to moderate temperatures at the
surface and in the ocean in the Tropics through the evaporative heat losses. The question of how
much is taken up here.
Emanuel [1987, 2003] argued that increasing greenhouse gases alter the energy balance at the
surface of tropical oceans in such a way as to require a greater turbulent enthalpy flux out of the
ocean (largely in the form of greater evaporation), thereby requiring a greater degree of
thermodynamic disequilibrium between the tropical oceans and atmosphere. This theory provides
a theoretical basis for expected changes in the observational record as global warming proceeds.
b. Water vapor and precipitation in storms
8

Observations reveal increases in heavy precipitation in the United States [Groisman et al., 2004],
where heavy rains (the top 5%) increased 14% over the 20
193
194
195
196
197
198
th century, and many other parts of the
globe [Groisman et al., 2005; Alexander et al. 2006], often at the expense of more moderate
rains and even in places where overall precipitation amounts are declining. Although
precipitation estimates in hurricanes and tropical storms now exist [Lonfat et al., 2004] and are
regularly made every 6 hours in the Hydrological Data and Information System (HyDIS) project
http://hydis8.eng.uci.edu/hydis-unesco/, sampling issues remain [e.g., Fasullo, 2006]. Once
tropical storms make landfall, then the observed precipitation estimates, which often show
rainfalls over 300 mm (∼12 inches), can be used. For instance in Katrina, rainfalls exceed 300
mm in spots >100 mm over a 100 mile swath north from New Orleans, and 50-75 mm over a
wide swath from the Gulf Coast to Canada (Fig. 1). In Newton, MS (60 miles east of Jackson,
MS) measured rainfall rates exceeded 35mm/h on August 29
199
200
201
202
203
204 th (see
http://www.ncdc.noaa.gov/img/climate/research/2005/katrina/newton-prcp.jpg). 205
206
207
208
209
210
211
212
213
214
215
Observed changes in precipitation in hurricanes are uncertain, although Trenberth et al. [2007]
suggest that rainfall rates may have increased of order 6 to 8% since about 1970 in association
with increased water vapor in the atmosphere of about 4% over the global oceans[Trenberth et
al., 2005] and warming. This is because of the dominant reliance of storms on the resident
moisture in the atmosphere and the moisture convergence for precipitation and latent heating in
storms.
3. Empirical relationships
9

In Trenberth et al. [2007] it was argued that the surface flux has a component that should
respond with Clausius Clapeyron. The simplified bulk flux formula gives the evaporation as
216
217
218
219
220
221
222
223
224
225
226
227
228
229
230
231
232
233
234
235
236
237
238
E = ρaCLV(qs(Ts) – q(T)) = ρaCLVqs(Ts) (1-RH*) (1)
where CL is the exchange coefficient, ρa is the air density, q is the specific humidity at
temperature T or Ts=SST, qs is the saturation value of q, RH is the relative humidity, and V is the
wind speed. Here RH* = RH qs(T)/qs(Ts). Because the relative humidity is observed to not
change much, the term RH* may not vary much and a dominant dependency for E is the
saturation specific humidity at the SST which is governed by Clausius-Clapeyron and the wind
speed V. Hence for transient changes, a component of E is likely to go up at about the same rate
as observed in the atmosphere for the change in storage, or about 6% per K rise in atmospheric
temperature in the Tropics. E is also dependent on V.
The bulk flux formula (1) is simplified to give the evaporation as
E ≈ aVqs(Ts) + ε (2)
where a is a regression coefficient and ε is the error. Trenberth et al. [2007] used simulations of
Katrina 42 hours into the integration to allow equilibration to occur, and find that much of the
change in surface latent heat flux with changes in SST can be accounted for by the two variables
V and qs. We now use the Katrina control simulation results to empirically explore relationships
in (2).
a. WRF model
The WRF model [Skamarock et al., 2005; Davis et al., 2007], specifically the Advanced
Research WRF (hereafter referred to simply as WRF) has been used in real time to forecast
10

239
240
241
242
243
244
245
246
247
248
249
250
251
252
253
254
255
256
257
258
259
260
261
several hurricanes during 2004 and 2005. A brief description of the model and the experiments
run are given in Trenberth et al. [2007]. This version of WRF avoids the use of a cumulus
parameterization by using the 4-km grid and treating deep convection and precipitation
formation explicitly using a simple cloud scheme in which cloud water, rain and snow are
predicted variables. We consider this to be a major advantage over the parameterized convection
model results of Knutson and Tuleya [2004] and Oouchi et al. [2006]. Results with more
sophisticated schemes in WRF show similar results concerning fluxes and precipitation [Davis et
al., 2007]. The boundary layer scheme is a first-order closure scheme, meaning that turbulence is
diagnosed entirely in terms of grid-scale variables [Noh et al., 2001].
In the best track record, the information available about each storm is restricted although the
position of the storm and maximum wind speed are available every 6 hours. Accordingly, we
first empirically relate the storm-integrated surface fluxes over a 400 km radius from the model
experiments we have performed to the maximum 10 m wind speed Vmax. Thus we use the control
model results for Katrina described by Trenberth et al. [2007] to empirically estimate the surface
fluxes simply as a function of the maximum wind speed at any grid point. Perhaps remarkably,
the results suggest a fairly linear increase of both surface latent heat (LH) and sensible heat (SH)
flux with Vmax (Fig. 2). In any case, to the extent that it is nonlinear, we compute histograms of
storm-integrated flux vs Vmax for use in our global synthesis. Also, perhaps surprisingly, Vmax
correlates better with the LH flux (0.99) than with wind (0.98), while the correlation is 0.96 with
SH flux and 0.82 with precipitation. The poorer result in the latter is not surprising given the
dependence of precipitation on moisture convergence from as much as 1600 km from the center
of the storm [Trenberth et al., 2007]. Given the established physical linkages between these
11

262
263
264
265
266
267
268
269
270
271
272
273
274
275
276
277
278
279
280
281
282
283
284
fields, it is not surprising that all of these associations are highly statistically significant (< 0.01
%).
In Eq. (2) it would be possible to set b = aqs(Ts) and ignore the dependence on Clausius-
Clapeyron. However, as Katrina operated in an environment of high SSTs averaging about 31°C it
seems likely that the surface latent heat fluxes are much larger than they would be in a cooler SST
environment. For example, for simulations of Ivan [Trenberth et al. 2007], in which SST is about
29°C, surface fluxes are notably reduced. Including the SST dependence gives about a 12%
reduction for Ivan and goes a long way to accounting for the differences in the simulated fluxes.
b. Best track data
Over the globe, there is considerable uncertainty in the hurricane record prior to 1970 when
observations from satellites with suitable sensors became available. Even after that time the
techniques used to interpret satellite imagery have improved, and this casts some doubt on the
reliability of changes in tropical cyclones over time [Landsea et al., 2006]. Fasullo [2006] has
analyzed the observed best track hurricane record for sampling biases that might account for
trends in intense storms, but the signatures of increased duration and frequency of weaker storms
that might arise from such biases are not present in the data. In the North Atlantic, moreover, the
record is believed to be quite reliable after about 1944 owing to the advent of aircraft
surveillance of tropical storms, although coverage was incomplete over the eastern part of the
basin. We focus therefore only on the record after 1970, and proceed with recognition that a
much needed reanalysis of the satellite record to provide revised tropical cyclone statistics could
well improve results [e.g., Kossin et al., 2007].
12

According to Webster et al. [2005], hurricanes and named storms (above 18 m s-1) account for
about 640 to 840 storm days per year. Lonfat et al. [2004] consider all tropical storms and divide
them into categories given by the Saffir-Simpson scale of tropical storms for which they used TS
18−33 m s
285
286
287
288
289
290
291
292
293
294
295
296
297
298
299
300
301
302
303
304
305
306
307
-1, cat. 1+2 34−48 m s-1 and cat. 3-5 > 49 m s-1. For their analysis for 1998-2000, the
TS category makes up 67% of the total in the best track dataset (vs 64% from TRMM). Cat. 1+2
hurricanes make up 23% of the storms and cat. 3-5 storms 10%. However, for 1998−2000 they
find an average of 1875 observations of such storms for 6 hour observations per year.
Accordingly, cat 1+2 storms occur 29.17% of the time (106.5 days per year) and cat 3-5 storms
occur 13.05% of the time (47.6 days per year).
We have computed further tropical cyclone statistics, after verifying the Lonfat et al. results, and
broken them up into 5 knot categories (it is desirable to use knots rather than conversions into
other units owing to the way the original data were recorded; 1 knot = 0.51 m s-1). Hence we
have exploited the best track dataset to examine in detail the frequency of occurrence of storms
based on the recorded maximum wind speed and how that has changed over time from 1970 to
2005. Results are given in Fig. 3 by basin, and in Fig. 4 and Table 1 along with the surface flux
data. We also sort out only those tropical cyclones between 30°N and 30°S. The categories used
are given in Table 1 in m s-1 but are rounded and correspond to cat. 1: 64−82 kt; cat. 2: 83-95 kt;
cat. 3: 96-113 kt; cat. 4: 114−135 kt; and cat 5: > 135 kt. For 1990 to 2005, hurricanes occur
51.1% of the time. While cat. 1 storms dominate in numbers, there is a surprisingly similar
incidence of cat. 3 and 4 hurricanes (in part because the cat. 4 wind limits are wider); see Fig. 3
for the full histogram. The mode of the distribution is 15° latitude (Fig. 3) and it is mainly in the
North Atlantic, and to a lesser extent in the Northwest Pacific, where the storms extend outside
13

of 30°N to 30°S. Further, the higher latitude storms are weaker with winds mostly less than 50
m s
308
309
310
311
312
313
314
315
316
317
318
319
320
321
322
323
324
325
326
327
328
329
-1. The biggest change when storms outside 30° latitude are excluded is for the weaker
named tropical storms.
SST is not recorded with the best track data and, accordingly, we have taken a single SST value
for the center of each storm every 6 hours for the month of the storm from the HADISST
monthly dataset [Rayner et al., 2003] and assigned it to each storm and time. Obviously this
does not capture the detailed daily variations of SST distribution across the storm, but it does
capture the main changes with month and location that are dominant.
c. Inferred global climatology of surface fluxes from hurricanes
To make an assessment of the main component of the energy budget associated with hurricanes,
we use (i) the surface heat flux as estimated empirically from Katrina from (2), and (ii) the
precipitation amount. It is likely that the results based on Katrina alone, where there were
relatively high SSTs, are somewhat exaggerated relative to most storms. When we apply (2) to
the best track data, we therefore include the qs dependence of surface latent heat flux. This
reduces the magnitude of the inferred best track fluxes typically by up to 20% (for instance in
2003 the global LH flux is reduced from 5.1 to 4.3×10²¹ J), and the trend is reduced by 18%. In
other words, this is the change due to taking account of the observed SSTs vs those during
Katrina, and it suggests SSTs lower than for Katrina by about 3°C on average. The results
presented here are therefore conservative as the fluxes are generally reduced. The precipitation
estimate benefits from the transport from afar, including the moisture stored in the atmosphere at
14

330
331
332
333
334
335
336
337
338
339
340
341
342
343
344
345
346
347
348
349
350
351
352
the start of the storm and the surface flux from outside the storm’s precipitation bands, but which
spirals into the storm. We do this by basin as well as globally (e.g., Fig. 3).
To comprehend the sampling in time, Fig. 5 shows the inferred integrated surface fluxes for only
the ocean over the 400 km radius. Peak values occur in 1997 when the 1997-98 El Niño played a
major role in enhancing tropical cyclone activity in the Pacific, while suppressing activity in the
Atlantic, and second highest is 1992, also an El Niño year. These peaks also occur in the global
values of NOAA’s Accumulated Cyclone Energy (ACE) index [Levinson, 2004; Klotzbach, 2006].
Based on the 16 years 1990-2005, when these values are combined to provide the total from
hurricanes alone over 0-400 km radius (5×10¹¹ m2), the total evaporative (enthalpy) flux gives a
tropical ocean cooling of 5.08 (5.84) ×1021 J per year, or equivalently 0.16 (0.185) PW annual
average. For 30°N to 30°S these change to 4.60 (5.30) ×1021 J per year or 0.15 (0.17) PW. The
background value is order 4×10²³ J per year in the absence of such storms.
However, the estimated hurricane precipitation latent heat release from 30°N to 30°S is about 3.4
times these values (although this applies only to the latent component), as this accounts for the
transport of latent energy from outside the 400 km cylinder. This ratio is lower than the 3.9 for
Katrina or 4.95 for Ivan [Trenberth et al., 2007]. However, the precipitation latent heat is an
underestimate as it was computed only over the ocean, and the land precipitation, such as in Fig. 1,
is missing. Indeed, much of the heavy precipitation may occur after the storm has made landfall
and lost intensity. Nevertheless, the mean ocean latent heat for 1990 to 2005 is 1.84×10²² J per
year, or equivalently 0.58 PW over the year. As the hurricane precipitation inside 400 km radius is
15

353
354
355
356
357
358
359
360
361
362
363
364
365
366
367
368
369
370
371
372
373
374
375
376
typically accompanied by suppression of precipitation in surrounding areas owing to the hurricane-
related circulation, it partially constitutes a reorganization of rainfall.
In addition to the annual average values, Fig. 5 also reveals upward trends that are statistically
significant at < 1% level for both surface latent heat and precipitation, where significance is
gauged from comparison with both the distribution of trends generated by random recombination
of the yearly values in Fig. 5, and with randomly generated time series of equal variance, as well
as other methods. For precipitation, the trend corresponds to 1.4% per year, a factor of 10 larger
than water vapor trends over the global ocean based on independent data [Trenberth et al., 2005].
However, the changes in Fig. 5 over time are not linear, as they feature higher values from 1989
to 1997. This was an unusual period in that a prolonged El Niño occurred from about 1990 to
1995 (or a series of three El Niño events between which SSTs in the Pacific failed to return to
normal) [Trenberth and Hoar, 1996], followed by the 1997-98 El Niño event, as the biggest on
record by several measures. It was a period when the tropical cyclone activity was most
prominent in the Pacific. The prolonged El Niño terminated in 1995 just in time for the 1995
hurricane season which was the beginning of a burst of enhanced activity in the North Atlantic.
Activity was again suppressed in the North Atlantic in the 1997 El Niño season in spite of this
being the most active global year overall.
4. Discussion and conclusions
Surface fluxes are not well known even in the climatology [Josey et al., 2003; Liu and Curry,
2006]. A recent evaluation of two satellite based products and two reanalysis based products
find that agreements are better than in the past [Liu and Curry, 2006], but spurious changes are
evident as satellites have changed and reanalyses have biases and spurious trends [Trenberth et
16

al., 2005] and hurricanes are not well depicted. Large increases in SST with the 1997-98 El
Niño event correspond to large increases in atmospheric surface specific humidity [Liu and
Curry, 2005] and total column water vapor [Trenberth and Smith, 2005], as well as hurricane
activity (Fig. 5), although surface latent heat fluxes seem to depend more on changes in wind
speed [Chikamoto and Tanimoto, 2005; Liu and Curry, 2006]. The Coupled Boundary Layer
Air-Sea Transfer Experiment (CBLAST) [Black et al., 2007] was carried out to improve in part
the surface fluxes in hurricanes at high winds and results are being evaluated as to their effects
on models [Chen et al., 2007] including WRF [Davis et al., 2007].
377
378
379
380
381
382
383
384
385
386
387
388
389
390
391
392
393
394
395
396
397
398
399
400
The moisture budget in tropical cyclones is dominated by the inflow of moisture mainly in the
lowest 1 km of the storm and, inside about 100 km of the center of the storm, the inflow is about
a factor of 10 greater than the latent heat flux from the surface in spite of the fact that it is
ultimately the latter that mainly causes the inflow to occur [Trenberth et al., 2007]. Together
these moisture fluxes contribute to the heavy rainfall in tropical cyclones and thus latent heat
release that drives the storms. Moreover, the sensitivity experiments in Trenberth et al. [2007]
reinforce the likelihood of substantial increases in precipitation as the SSTs increase, with
important but small increases in intensity of the storms.
The climatic influence of tropical cyclones depends more on area and time-integrated quantities
than on local, instantaneous values. The use of maximum sustained wind may be useful to
classify hurricane damage, but it is not obviously useful to understand large-scale effects of
hurricanes, except to the extent that maximum wind correlates with other parameters, which we
found to be the case (Fig. 2). However, hurricanes Charley and Ivan from 2004 were both cat. 4
storms, but the circulation from Ivan was an order of magnitude larger than for Charley, and the
17

401
402
403
404
405
406
407
408
409
410
411
412
413
414
415
416
417
418
419
420
421
422
423
424
total fluxes and precipitation may not scale accordingly. Further, it is likely that tropical cyclones
in other basins, and hence somewhat different environments, may have systematically different
characteristics and this is a major caveat on efforts to generalize the satellite record globally by.
Kossin et al. [2007]. Further research is desirable to explore this aspect with TRMM data and
further model simulations. Nonetheless the issue is whether the integral values in Fig. 5 are
biased and the answer is far from obvious. Because the available observational data do not
include size and integrated metrics, it is not possible to address this issue, and hence it may be
better to regard the results in Fig. 5 as depicting a “hurricane surface flux index” or “hurricane
precipitation index”.
We have found that hurricanes pump a considerable amount of heat out of the oceans every year
and that the amount is apparently generally increasing over time after 1970 and depends strongly
on ENSO. These facts represent a fundamental role for hurricanes in the climate system. Palmén
and Riehl [1957] estimated an energy export of 0.88 PW for “average” hurricanes, while for
Bonnie [Braun, 2006] it was 1.34 PW. These values are consistent with ours which are extended
to the global domain for all seasons. As our values do not include the contributions from tropical
storms that do not reach hurricane strength, they are conservative in terms of the effects of
tropical cyclones on the climate system. However, they are probably representative of the effects
that are not included in climatologies because of lack of observations within hurricanes.
The main result of this work is that the net surface enthalpy flux from global hurricanes from
30°N to 30°S is 0.17 PW when the region within 400 km of the center of the storms is
considered, or about 0.58 PW for the full domain of hurricanes. The storms act to systematically
cool the ocean and thus play a vital role in climate. If the enhanced evaporation value inside 400
18

km radius were redistributed over the tropical ocean area from 30°N to 30°S it amounts to 0.9 W
m
425
426
427
428
429
430
431
432
433
434
435
436
437
438
439
440
441
442
443
444
445
446
-2 heat loss, or equivalently 0.7°C/year cooling over a 10 m thick layer. The evaporative
cooling corresponding to the tropical storm precipitation amounts to 2.3°C/year. Although this is
a modest rate, it is a systematic cooling of the tropical ocean by hurricanes over about 40% of the
globe, and in actuality is concentrated into perhaps just one fifth of that area. Globally, this
corresponds to 0.33 W m-2 for evaporation, or 1.13 W m-2 for precipitation. Although these
estimates are somewhat less than the human-induced radiative forcing (about 1.5 W m-2), the
latter is larger than the actual radiative imbalance which is estimated to be 0.7 to 1 W m-2
[Hansen et al., 2005]. Also for comparison, the global ocean to 3000 m depth gained 1.45×10²³
J [Levitus et al., 2005] from 1955 to1998, or an average of 0.33×10²² J per year, and most of this
increase took place after 1970 at a rate of 0.5 ×10²² J per year, which is very similar to the annual
hurricane heat loss within 400 km of the storm centers.
The surface flux values in Fig. 5 can be compared with the Emanuel [2001] estimate of 1.4 PW
for 1996 total cold wake effects which include ocean heat transport and surface fluxes. From
Fig. 5 in 1996 the surface flux estimate is 4.8×10²¹ J or about 0.15 PW from surface evaporative
and sensible heat cooling leaving about 1.2 PW that is mixed deeper into the ocean and which
must then be compensated for by ocean heat transports. This is consistent with the view that the
evaporative cooling is only a small component of the cold wake, but it is a local result in the
immediate vicinity of the hurricane track, whereas the enhanced evaporation extends out to a
radius of order 1600 km, and over that domain the 0.58 PW makes up 41% of the Emanuel
value. This also suggests that a lot of the compensation for this effect is likely to come from
19

other parts of the Tropics, leaving about 59% of Emanuel’s estimated value for ocean transport
to higher latitudes.
447
448
449
450
451
452
453
454
455
456
457
458
459
460
461
462
463
464
465
466
467
468
469
470
We have suggested that tropical cyclones are integral to the Earth’s climate system. Yet
hurricanes are not well depicted in global climate models. The distribution of tropical storms
can be somewhat simulated but the maximum winds and vortices are not realistic even in a
model at T106 (110 km) resolution [Yoshimura et al., 2006], and we suggest that the value of the
surface enthalpy flux computed in Fig. 5 is a reasonable estimate of that which is absent from
coarse resolution coupled climate models. If a model on a 50 km grid produces a cyclone, it will
probably have a circulation that is too large, but also too weak, although the integral of some
fields might be about right. A model with a grid spacing of 200 km can depict tropical cyclones,
although they are not realistically simulated [Broccoli and Manabe, 1990] and even at T106 (110
km) resolution, tropical cyclones with hurricane force winds are uncommon [Yoshimura et al.,
2006]. This highlights the large sensitivity to resolution and numerics.
In addition, there is large sensitivity to convective parameterization and the stability of the
atmosphere in global models [e.g., Shen et al., 2000; Yoshimura et al., 2006] even when
resolution has been increased to 20 km in the atmospheric runs on the Earth Simulator in Japan
[Oouchi et al., 2006] or in regional models [Knutson and Tuleya, 2004]. Climate models
prematurely trigger convection and stabilize the atmosphere as has been established by
examining the diurnal cycle, where model precipitation onsets too quickly and occurs too often
and with insufficient intensity compared with observations [Yang and Slingo, 2001; Trenberth et
al., 2003; Dai and Trenberth, 2004; Trenberth, 2005]. A consequence is that resolved
disturbances in the Tropics in global climate models are much too weak [Lin et al., 2006]. The
20

471
472
473
474
475
476
477
478
479
480
481
482
483
484
485
486
487
488
489
490
491
492
493
494
WRF model used here avoided use of parameterized convection and thus provides an alternative
basis for estimating tropical storm effects.
Given the missing hurricane processes, the climate models therefore compensate in other ways,
such as with somewhat stronger tradewinds in the control climate. However, a key question is
whether the changes projected to occur by such a model as the climate changes will be
realistically depicted in the absence of processes represented by hurricanes? Hence we raise the
question of whether tropical SSTs and associated upper-ocean heat content may not increase as
much as widely predicted in future climate projections with increases in greenhouse gases
[IPCC, 2001], and instead that there could be increases in intensity and more overall activity of
tropical cyclones [Trenberth, 2005]. We put forward this as a hypothesis to be tested in future
work.
In addition to the average values over a certain period, Fig. 5 also reveals an upward trend that is
consistent with results from Emanuel [2005a,b] and Sriver and Huber [2006] using the power
dissipation index (PDI), and Webster et al. [2005] who found a large increase in numbers and
proportion of hurricanes reaching categories 4 and 5 globally since 1970 even as total number of
cyclones and cyclone days decreased slightly in most basins. The largest increase was in the
North Pacific, Indian and Southwest Pacific oceans. These results have been challenged by
several studies [Landsea, 2005, 2006; Klotzbach, 2006] that have questioned the quality of the
data and the start date of 1970. The historical record typically records the central pressure and
the maximum winds, but these are not physically consistent in older records (mainly prior to
about the early 1970s). However, attempts at mutual adjustments result in increases in some
years and decreases in others, with little effect on overall trends. In particular, in the satellite era
21

after about 1970, the global trends found by Emanuel [2005a] and Webster et al. [2005] are
thought to be robust [Emanuel, 2005b, Fasullo, 2006]. Kossin et al. [2007] have reprocessed
some of the tropical storm record and raise questions about the quality of the best track data in
the Northwest Pacific, South Pacific and Indian Oceans, although PDI values are found to agree
in the Norwest Pacific provided missing storms from the Kossin dataset are included [Emanuel,
2007, personal communication]. Moreover there are questions about the applicability of a
method trained on the Atlantic to other basins. These uncertainties highlight the great need to
reanalyze the satellite record and produce more reliable and comprehensive tropical storm
characteristics that include size, intensity, duration, cyclone energy, and power, as well as track.
In the Atlantic and west Pacific combined, the PDI suggests higher values in recent decades in
strong association with higher SSTs [Emanuel, 2005b]. Our results (Fig. 5) also suggest that the
study by Klotzbach [2006] of hurricanes after 1986 is based on too short a period to establish
reliable trends, especially because of the large interannual variability and the El Niño-related
peaks in 1997 and 1992.
495
496
497
498
499
500
501
502
503
504
505
506
507
508
509
510
511
512
513
514
515
516
517
518
Observed and potential changes in hurricanes with global warming are discussed in detail in
Trenberth [2005], Emanuel [2005a, b] and Webster et al. [2005] who show that intense storms
are observed to be increasing and with longer lifetimes, in line with theoretical and modeling
expectations, and this is also evident in our preliminary results for energy exchange (Fig. 5).
Empirically there is a very strong relationship between intensity and potential destructiveness of
such storms with SSTs in the genesis regions in the Tropics [Emanuel, 2005a, b]. Our results
use a novel technique of exploiting model results from simulations to make extrapolations to the
global domain by also utilizing the best track data. They are only as good as the best track data
and accordingly subject to future revision, and can no doubt be improved upon. Moreover, they
22

519
520
521
522
523
524
525
526
527
528
depend on relationships established during Katrina which, while adjusted for SST effects, may
not apply to all other storms. Nonetheless they provide some high level diagnostics on aspects of
hurricanes over time that are likely to reflect real world changes. Use of other models, perhaps
run for each hurricane, may allow improved estimates and help determine the extent to which the
theory outlined here is valid. Future research can help to quantify these aspects. However, the
latent heat and precipitation time series given here provide a legitimate index of the changes over
time that complement the PDI and other indices.
Acknowledgments. This research is partially sponsored by the NOAA CLIVAR program under
grant NA17GP1376. We thank Chris Davis for providing the model Katrina data and comments.
23

References 529
530
531
532
533
534
535
536
537
538
539
540
541
542
543
544
545
546
547
548
549
550
Alexander, L., and co-authors (2006), Global observed changes in daily climate extremes of
temperature and precipitation. J. Geophys. Res., 111, D05109, doi:10.1029/2005JD006290.
Anthes, R. A., 1974: The dynamics and energetics of mature tropical cyclones. Rev. Geophysics
Space Physics, 12(3), 495-522.
Bister, M., and K. A. Emanuel (1998), Dissipative heating and hurricane intensity. Meteorol.
Atmos. Phys., 50, 233–40.
Black, P. G., and coauthors (2007), Air-sea exchange in hurricanes: Synthesis of observations
from the Coupled Boundary Layer Air-Sea Transfer Experiment (CBLAST). Bull. Amer.
Meteor. Soc., 88, 357−374.
Braun, S. A., (2006), High-resolution simulation of hurricane Bonnie (1968). Pt II: Water
budget. J. Atmos. Sci., 63, 43-64.
Chen, S. S., J. F. Price, W. Zhao, M. A. Donelan, and E. J. Walsh (2007), The CBLAST-
Hurricane Program and the next-generation fully coupled atmosphere-wave-ocean models for
hurricane research and prediction. Bull. Am. Meteorol. Soc, 88, 311-317.
Davis, C., and co-authors (2007), Prediction of landfalling hurricanes with the Advanced
Hurricane WRF model. Mon. Wea. Rev., submitted.
Chikamoto, Y. and Y. Tanimoto (2005), Role of specific humidity anomalies in Caribbean SST
response to ENSO. J. Meteor. Soc. Japan, 83, 959–975.
Dai, A., and K. E. Trenberth (2004), The diurnal cycle and its depiction in the Community
Climate System Model. J. Climate, 17, 930-951.
Emanuel K. A. (1987), The dependence of hurricane intensity on climate. Nature, 326, 483–485
24
551
552
553
554
555
556
557
558
559
560
561
562
563
564
565
566
567
568
569
570
571
572
573
Emanuel K. A. (2001), The contribution of tropical cyclones to the oceans’ meridional heat
transport. J. Geophys. Res, 106, 14771–14781.
Emanuel, K. (2003), Tropical cyclones. Ann. Rev. Earth Planet. Sci., 31, 75−104.
Emanuel, K. (2005a), Increasing destructiveness of tropical cyclones over the past 30 years.
Nature, 436, 686−688.
Emanuel, K. (2005b), Emanuel replies. Nature, 438, doi:10.1038/nature04427.
Fasullo, J. (2006), Assessing tropical cyclone trends in the context of potential sampling biases,
Geophys. Res. Lett., 33, L24808, doi:10.1029/2006GL027852.
Groisman, P.Ya., R. W. Knight, T. R. Karl, D. R. Easterling, B. M. Sun, and J. H. Lawrimore
(2004), Contemporary changes of the hydrological cycle over the contiguous United States:
Trends derived from in situ observations. J. Hydrometeorol., 5, 64–85.
Groisman, P.Ya., R.W.Knight, D. R. Easterling, T. R. Karl, G. C. Hegerl and V.N. Razuvaev
(2005), Trends in intense precipitation in the climate record. J. Climate, 18, 1326–1350.
Hansen, J., and co-authors (2005), Earth's energy imbalance: Confirmation and implications.
Science, 308: 1431−1435.
IPCC (2001), Climate Change 2001: The Scientific Basis. Contribution of Working Group 1 to the
Third IPCC Scientific Assessment. [Houghton, J.T., et al. (eds.)]. Cambridge University Press,
Cambridge, United Kingdom, 881 pp.
Josey, S. A., E. C. Kent and P. K. Taylor (1998), The Southampton Oceanographic Centre (SOC)
Ocean-Atmosphere heat, momentum and freshwater flux atlas. Southampton Oceanographic
Centre Rep.6, 30 pp and Figs.
Klotzbach, P. J. (2006), Trends in global tropical cyclone activity over the past twenty years
(1986–2005), Geophys. Res. Lett., 33, L10805, doi:10.1029/2006GL025881.
25

Knutson, T. R., and R. E. Tuleya (2004), Impact of CO2-induced warming on simulated
hurricane intensity and precipitation: Sensitivity to the choice of climate model and
convective parameterization. J. Climate, 17, 3477-3495.
574
575
576
577
578
579
580
581
582
583
584
585
586
587
588
589
590
591
592
593
594
595
596
Kossin, J. P., K. R. Knapp, D. J. Vimont, R. J. Murnane, and B. A. Harper (2007), A globally
consistent reanalysis of hurricane variability and trends, Geophys. Res. Lett., 34, L04815,
doi:10.1029/2006GL028836.
Krishnamurti, T. N., S. Pattnaik, L. Stefanova, T. S. V. Vijaya Kumar, B. P. Mackey and A. J.
O’Shay (2005), The hurricane intensity issue. Mon. Weather. Rev., 133, 1886-1912.
Landsea, C. W. (2005), Hurricanes and global warming: arising from Emanuel 2005a. Nature,
438, doi:10.1038/nature04477. E11-E13.
Landsea, C. W., B. A. Harper, K. Hoarau, and J. A. Knaff (2006), Can we detect trends in
extreme tropical cyclones? Science, 313, 452-454.
Latif, M., N. Keenlyside, and J. Bader (2007), Tropical sea surface temperature, vertical wind
shear, and hurricane development, Geophys. Res. Lett., 34, L01710,
doi:10.1029/2006GL027969.
Levinson, D. H. (ed) (2005), State of the climate in 2004. Bull. Am. Meteorol. Soc., 86, June
2005, S1-S84.
Levitus, S., J. Antonov, and T. Boyer (2005), Warming of the world ocean, 1955–2003,
Geophys. Res. Lett., 32, L02604, doi:10.1029/2004GL021592.
Lin, J. L., and co-authors (2006), Tropical intraseasonal variability in 14 IPCC AR4 climate
models. Pt I: convective signals. J. Climate, 19, 2665-2690.
Liu, J., and J. A. Curry (2006), Variability of the tropical and subtropical ocean surface latent
heat flux during 1989–2000, Geophys. Res. Lett., 33, L05706, doi:10.1029/2005GL024809.
26

597
598
599
600
601
602
603
604
605
606
607
608
609
610
611
612
613
614
615
616
617
618
619
Lonfat, M., F. D. Marks Jr. and S. S. Chen (2004), Precipitation distribution in tropical cyclones
using the Tropical Rainfall Measuring Mission (TRMM) microwave imager: A global
perspective. Mon. Weather Rev., 132, 1645−1660.
Malkus, J., and H. Riehl (1960), On the dynamics and energy transformations in steady-state
hurricanes. Tellus, 12, 1-20.
Miller, B. I. (1962), On the momentum and energy balance of hurricane Helene (1958). Natl.
Hurricane Res. Proj. Rep. No. 53, 19 pp.
Noh, Y., W. G. Cheon, and S. Raasch (2001), The improvement of the K-profile model for the
PBL using LES. Intl Wkshp Next Generation NWP Model, Seoul, South Korea, 65-66.
Oouchi, K., J. Yoshimura, H. Yoshimura, R. Mizuta, S. Kusunoki, and A. Noda (2006), Tropical
cyclone climatology in a global-warming climate as simulated in a 20km-mesh global
atmospheric model: Frequency and wind intensity analyses. J. Meteor. Soc. Japan, 84, 259-
276.
Palmén E., and H. Riehl (1957), Budget of angular momentum and energy in tropical cyclones. J.
Meteor., 14, 150-159.
Rayner, N. A., D. E. Parker, E. B. Horton, C. K. Folland, L. V. Alexander, D. P. Rowell, E. C.
Kent, and A. Kaplan (2003), Global analyses of sea surface temperature, sea ice, and night
marine air temperature since the late nineteenth century. J. Geophys. Res., 108, 4407,
doi:10.1029/2002JD002670.
Riehl, H., and J. S. Malkus (1961), Some aspects of hurricane Daisy, 1958. Tellus, 13, 181-213.
Shen, W., R.E. Tuleya, and I. Ginis (2000), A sensitivity study of the thermodynamic
environment on GFDL model hurricane intensity: implications for global warming. J.
Climate, 13, 109-121.
27

620
621
622
623
624
625
626
627
628
629
630
631
632
633
634
635
636
637
638
639
640
641
642
Skamarock, W. C., J. B. Klemp, J. Dudhia, D. O. Gill, D. M. Barker, W. Wang and J. G. Powers
(2005), A Description of the Advanced Research WRF Version 2. NCAR Tech. Note TN-
468+STR. 88 pp.
Sriver, R., and M. Huber (2006), Low frequency variability in globally integrated tropical
cyclone power dissipation. Geophys. Res. Lett., 33, L11705, doi:10.1029/2006GL026167.
Sriver, R., and M. Huber (2007), Observational evidence for an ocean heat pump induced by
tropical cyclones. Nature, 447, 577−580.
Trenberth, K. E. (2005), Uncertainty in hurricanes and global warming, Science, 308, 1753-1754.
Trenberth, K. E., and T. J. Hoar (1996), The 1990–1995 El Niño–Southern Oscillation Event:
Longest on record. Geophys. Res. Lett., 23, 57–60.
Trenberth, K. E., and L. Smith (2005), The mass of the atmosphere: A constraint on global
analyses. J. Climate, 18, 864-875.
Trenberth, K. E., and D. P. Stepaniak (2003a), Co-variability of components of poleward
atmospheric energy transports on seasonal and interannual timescales. J. Climate, 16, 3690-
3704.
Trenberth, K. E., and D. P. Stepaniak (2003b), Seamless poleward atmospheric energy
transports and implications for the Hadley circulation. J. Climate, 16, 3705–3721.
Trenberth, K. E., and D. P. Stepaniak (2004), The flow of energy through the Earth’s climate
system. Q. J. R. Meteorol. Soc., 130, 2677−2701.
Trenberth, K. E., A. Dai, R. M. Rasmussen, and D. B. Parsons (2003), The changing character of
precipitation. Bull. Am. Meteorol. Soc., 84, 1205–1217.
Trenberth, K. E., J. Fasullo, and L. Smith (2005), Trends and variability in column integrated
atmospheric water vapor. Climate Dyn., 24, 741−758.
28

643
644
645
646
647
648
649
650
651
652
653
Trenberth, K. E., C. A. Davis and J. Fasullo (2007), The water and energy budgets of hurricanes
and implications for climate change. J. Geophys Res., in press.
Walker, N. D., R. R. Leben and S. Balasubramanian (2005), Hurricane-forced upwelling and
Chlorophyll a enhancement within cold-core cyclones in the Gulf of Mexico. Geophys. Res.
Lett., 32, L18610, doi:10.1029/2005GL023716.
Webster, P. J., G. J. Holland, J. A. Curry, and H-R Chang (2005), Changes in tropical cyclone
number, duration and intensity in a warming environment. Science, 309, 1844-1846.
Yang, G.-Y. and J. Slingo (2001), The diurnal cycle in the Tropics. Mon. Weather Rev., 129,
784-801.
Yoshimura, J., M. Sugi, and A. Noda (2006), Influence of greenhouse warming on tropical
cyclone frequency. J. Meteor. Soc. Japan, 84, 405-428.
29

Figure captions 654
655
656
657
658
659
660
661
662
663
664
665
666
667
668
669
670
671
672
673
674
675
676
677
Fig. 1. Estimate of observed precipitation based on surface gauges, adapted from a compilation
by Climate Prediction Center, NOAA (printed with permission, courtesy Rich Tinker and Jay
Lawrimore). These may be underestimates as many data were missing in the vicinity of
New Orleans.
Fig. 2. Empirical relationships from WRF model runs for Katrina showing the ocean area
integrated over 0-400 km radius for the surface LH (top left) and SH (top right) fluxes in W
m-2, the wind speed m s-1 (lower left) and precipitation mm h-1 (lower right) as a function of
the maximum 10 m wind speed at any location.
Fig. 3. Histogram of wind speed recorded in the best track data by 5 knot category for 1990 to
2005. The top panel gives the frequency per report period for each basin as well as the
global total, and the lower panel gives the corresponding latitudes at which the tropical
cyclones occurred. Owing to lack of clearly defined boundaries, all the Southern
Hemisphere basins are combined (labeled as S. Indian-Australian-S. Pacific).
Fig. 4. As a function of maximum wind speed, given are (i) the frequency of occurrence of
storms with peak winds from observed best track data 1990-2005 (red, right axis) for the total
global domain and also for 30°N to 30°S (dotted); (ii) surface fluxes as latent (blue), sensible
(cyan) and total (black) energy (W m-2) based on the Katrina simulation.
Fig. 5. Based on best track data for the tropical cyclones observed each year, the total surface
energy loss by the global ocean is given, based on Katrina simulated fluxes within 400 km of
the eye of the storms as given by (2) for latent (blue), sensible (cyan) and total enthalpy
(black) flux in 1021 Joules per year. Also given in green (right hand scale) is the precipitation
in the same units. The dotted lines are linear trends and values are given in 1021 Joules per
decade.
30
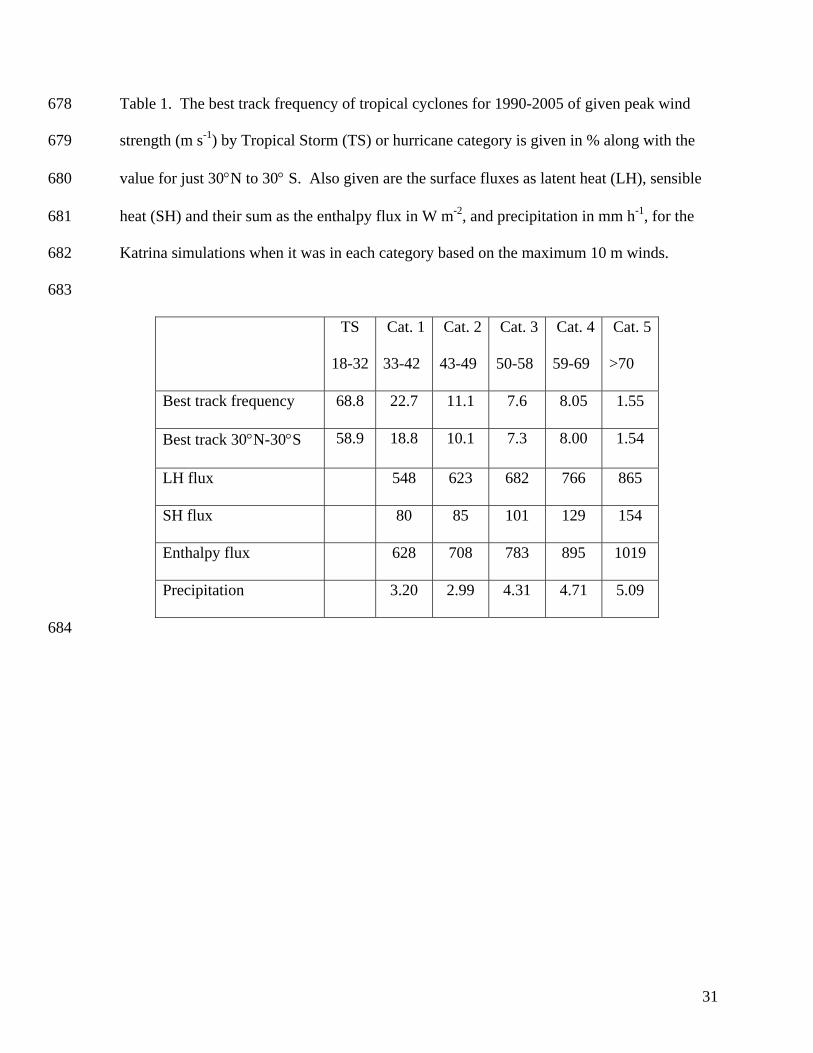
Table 1. The best track frequency of tropical cyclones for 1990-2005 of given peak wind
strength (m s
678
679
680
681
682
683
-1) by Tropical Storm (TS) or hurricane category is given in % along with the
value for just 30°N to 30° S. Also given are the surface fluxes as latent heat (LH), sensible
heat (SH) and their sum as the enthalpy flux in W m-2, and precipitation in mm h-1, for the
Katrina simulations when it was in each category based on the maximum 10 m winds.
TS
18-32
Cat. 1
33-42
Cat. 2
43-49
Cat. 3
50-58
Cat. 4
59-69
Cat. 5
>70
Best track frequency 68.8 22.7 11.1 7.6 8.05 1.55
Best track 30°N-30°S 58.9 18.8 10.1 7.3 8.00 1.54
LH flux 548 623 682 766 865
SH flux 80 85 101 129 154
Enthalpy flux 628 708 783 895 1019
Precipitation 3.20 2.99 4.31 4.71 5.09
684
31

685
686 687 688 689 690 691 692 693
Fig. 1. Estimate of observed precipitation based on surface gauges, adapted from a compilation by Climate Prediction Center, NOAA (printed with permission, courtesy Rich Tinker and Jay Lawrimore). These may be underestimates as many data were missing in the vicinity of New Orleans.
32

694 695 696 697 698 699
Fig. 2. Empirical relationships from WRF model runs for Katrina showing the ocean area integrated over 0-400 km radius for the surface LH (top left) and SH (top right) fluxes in W m-2, the wind speed m s-1 (lower left) and precipitation mm h-1 (lower right) as a function of the maximum 10 m wind speed at any location.
33

700 701 702 703 704 705 706
Fig. 3. Histogram of wind speed recorded in the best track data by 5 knot category for 1990 to 2005. The top panel gives the frequency per report period for each basin as well as the global total, and the lower panel gives the corresponding latitudes at which the tropical cyclones occurred. Owing to lack of clearly defined boundaries, all the Southern Hemisphere basins are combined (labeled as S. Indian-Australian-S. Pacific).
34

707
708 709 710 711 712 713 714
Fig. 4. As a function of maximum wind speed, given are (i) the frequency of occurrence of storms with peak winds from observed best track data 1990-2005 (red, right axis) for the total global domain and also for 30°N to 30°S (dotted); (ii) surface fluxes as latent (blue), sensible (cyan) and total (black) energy (W m-2) based on the Katrina simulation.
35

715 716 717 718 719 720 721 722
Fig. 5. Based on best track data for the tropical cyclones observed each year, the total surface energy loss by the global ocean is given, based on Katrina simulated fluxes within 400 km of the eye of the storms as given by (2) for latent (blue), sensible (cyan) and total enthalpy (black) flux in 1021 Joules per year. Also given in green (right hand scale) is the precipitation in the same units. The dotted lines are linear trends and values are given in 1021 Joules per decade.
36