Embed Size (px)
Citation preview

The ND-Scope:
Visual Exploration of High-Dimensional
Data
Klaus Mueller
Visual Analytics and Imaging Lab
Computer Science Department
Stony Brook University and SUNY Korea

The ND-Scope
Parallel Coordinate Plot
Dynamic Scatterplot
Sight Map
Network Display
Geospatial Display
Spreadsheet

The ND-Scope
Dynamic Scatterplot
Sight Map
Spreadsheet

The ND-Scope
Parallel Coordinate Plot
Network Display
Geospatial Display
Spreadsheet

3D
Comprehension
Navigation
Reconstruction

3D
Comprehension
Navigation
Reconstruction
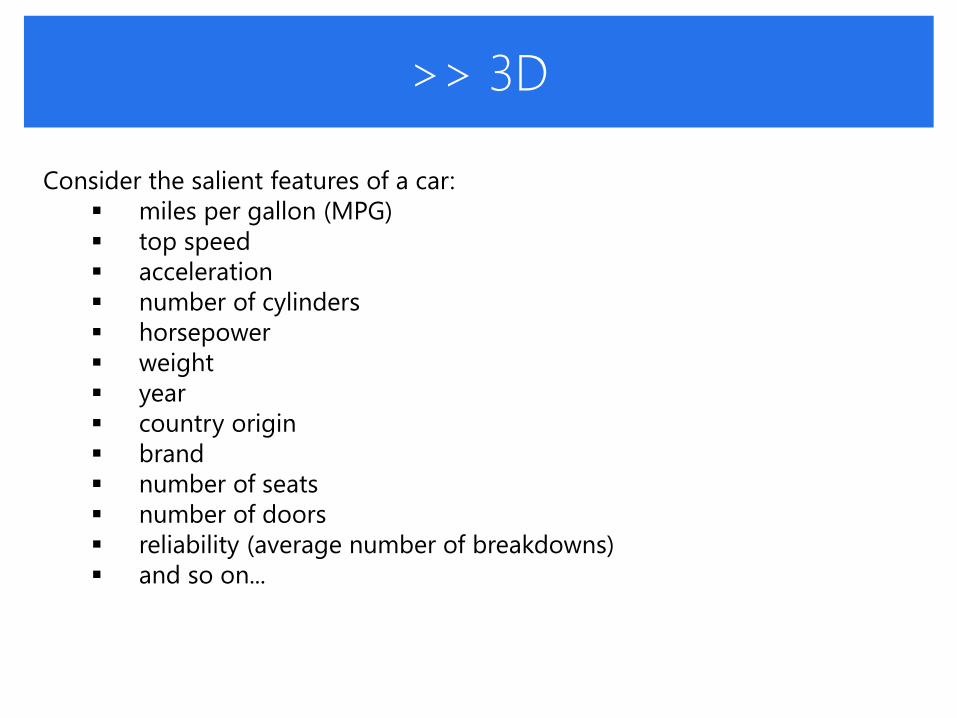
>> 3D
Consider the salient features of a car:
miles per gallon (MPG)
top speed
acceleration
number of cylinders
horsepower
weight
year
country origin
brand
number of seats
number of doors
reliability (average number of breakdowns)
and so on...

What Does This Object Look Like?
Hard to imagine….

How Many 3D Cubes in N-D?
Combinatorial explosion
So there is a clear need for ND-visualization tools
!
3!( 3)!
N
N
0
50
100
150
200
250
300
350
400
1 2 3 4 5 6 7 8 9 10 11 12 13 14

“How do you make these ND-vis tools
accessible to the main stream user?”
Audience question:

Parallel Coordinates – 3 Clusters

Parallel Coordinates – 1 Cluster
individual polylines
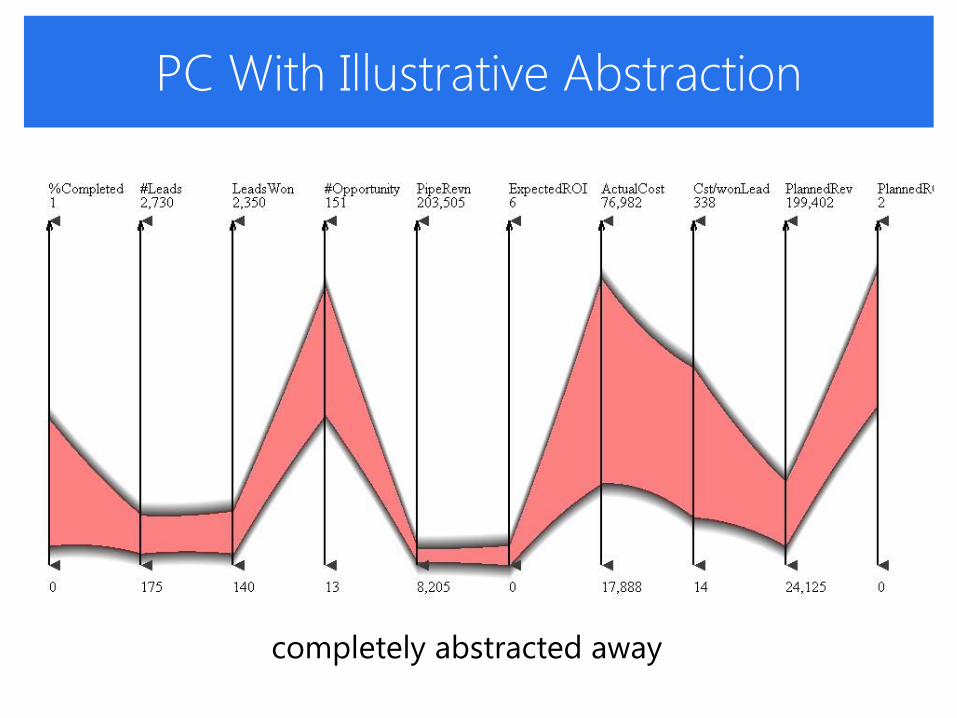
PC With Illustrative Abstraction
completely abstracted away

PC With Illustrative Abstraction
blended partially

PC With Illustrative Abstraction
all 3 clusters put together

Practical Analysis in N-D Space
A customer is born…

Visual Cause + Effect Analysis
3 sales teams, with sales people

Visual Cause + Effect Analysis
3 sales teams, with sales people

Visual Cause + Effect Analysis
3 sales teams, average performance

Visual Cause + Effect Analysis
Focusing on the green team…

Visual Cause + Effect Analysis
Putting the cost/won_lead into context…

Visual Cause + Effect Analysis
Revealing ineffective sales force factions…

Encoding Correlation
Need to know that negative correlation causes a bow-tie
could color code that as well
but could we visualize it more directly?

Correlation
Often of interest:
how are variables related?
Correlation is a strong indicator
indicates noisiness, direction, strength of relationship
correlated variables also indicate redundancies

Correlation
Often of interest:
how are variables related?
Correlation is a strong indicator
Pearson’s correlation
sample correlation
[( )( )]( , )( , )
x y
x y x y
E X YCov X YCorr X Y
1
2 2
1 1
( )( )
( ) ( )
n
i i
ixy
n n
i i
i i
x x y y
r
x x y x
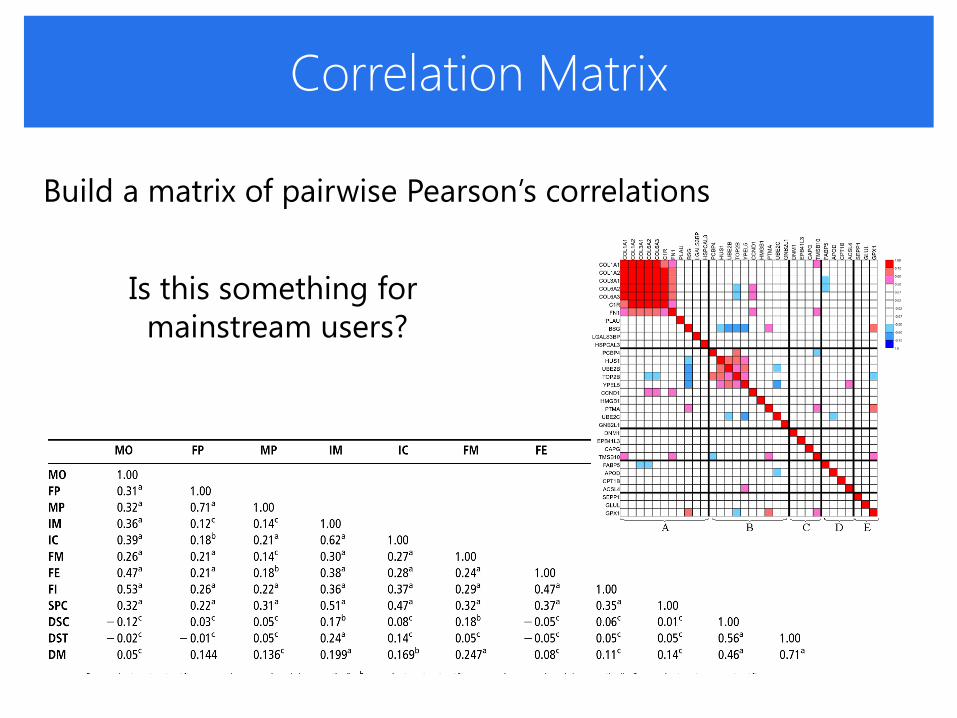
Correlation Matrix
Build a matrix of pairwise Pearson’s correlations
Is this something for
mainstream users?
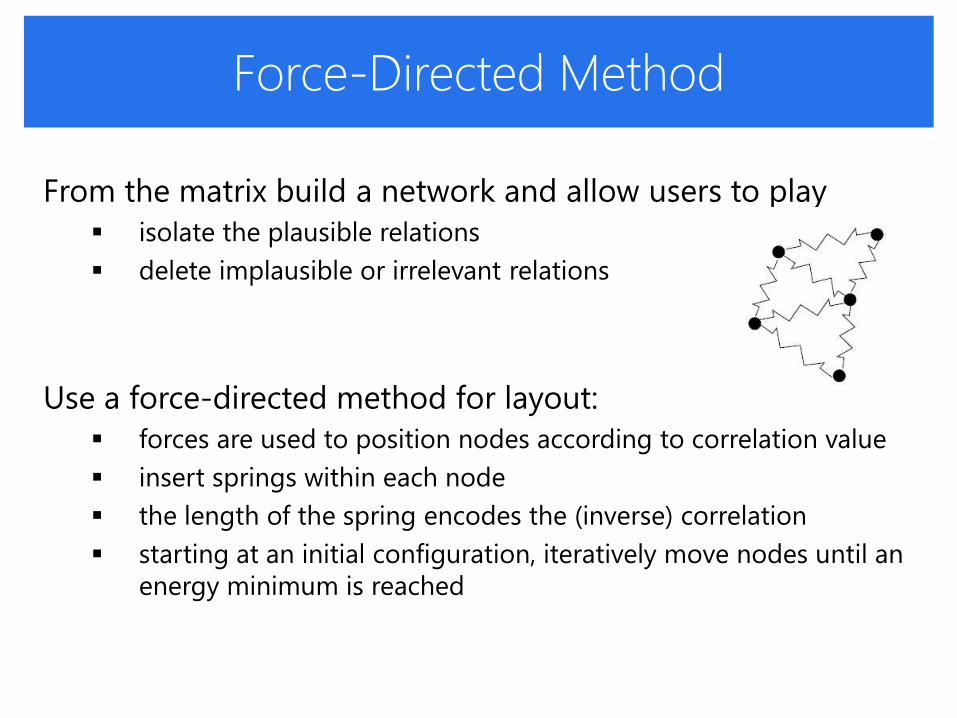
Force-Directed Method
From the matrix build a network and allow users to play
isolate the plausible relations
delete implausible or irrelevant relations
Use a force-directed method for layout:
forces are used to position nodes according to correlation value
insert springs within each node
the length of the spring encodes the (inverse) correlation
starting at an initial configuration, iteratively move nodes until an
energy minimum is reached
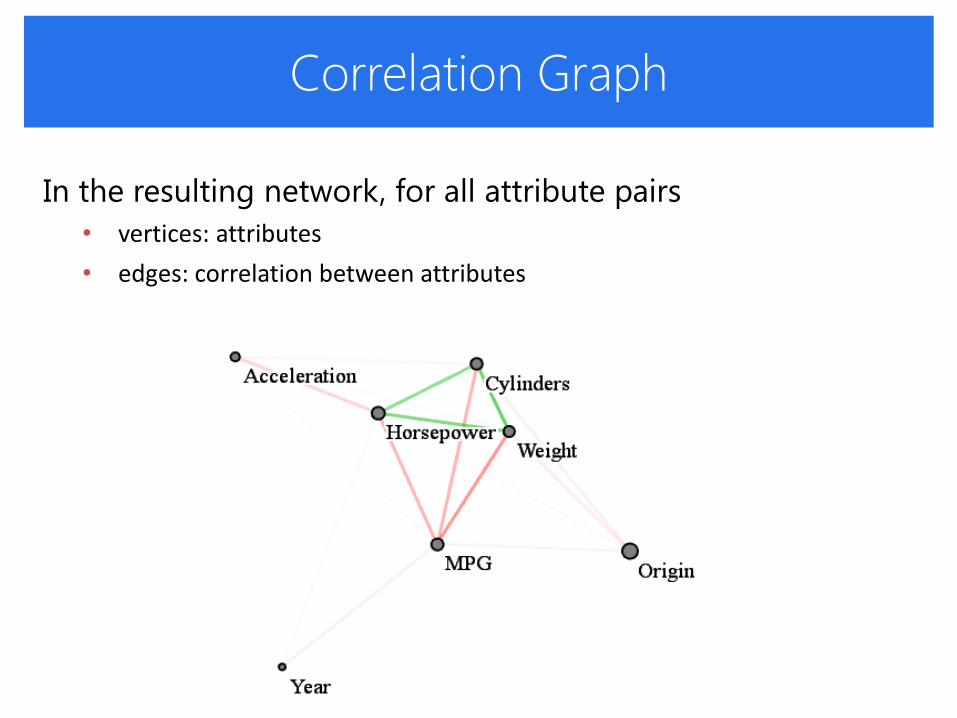
Correlation Graph
In the resulting network, for all attribute pairs
• vertices: attributes
• edges: correlation between attributes

Mass-Spring Model Layout
Highly correlated dimensions will be drawn close to another.
• distances of the nodes: correlation
Three configurations:
• correlation strength
• positive correlation preferred
• negative correlation preferred

Recall – Sales Campaign Dataset

Multivariate Analysis of University Data
Fused dataset of 50 US colleges
US News: academic rankings
College Prowler: survey on campus life attributes
Some interesting findings:
high variety in university settings
two clusters: academic + social
not overly correlated
higher academics fuller classes
lower income better sports
better academics lousy sports
higher population great nightlife

Interesting Study
Breakdown of visualization categories by visualization sources based on
2,070 single, static visualizations
M. Borkin et al. “What Makes a Visualization Memorable?” InfoVis 2013 -- TVCG 19(12)

Example #1: EnergyScout
Research collaboration with a local energy provider
Data: 24/7 15-min interval smart meter readings

Example #2: SpectraMiner
Research collaboration with a team of aerosol researchers
Data:
particle mass spectra (450-D)
concentrations
size distributions
shape
density
temperature
time and 3D location of acquisition
…
billions of particles per flight

Data Collection
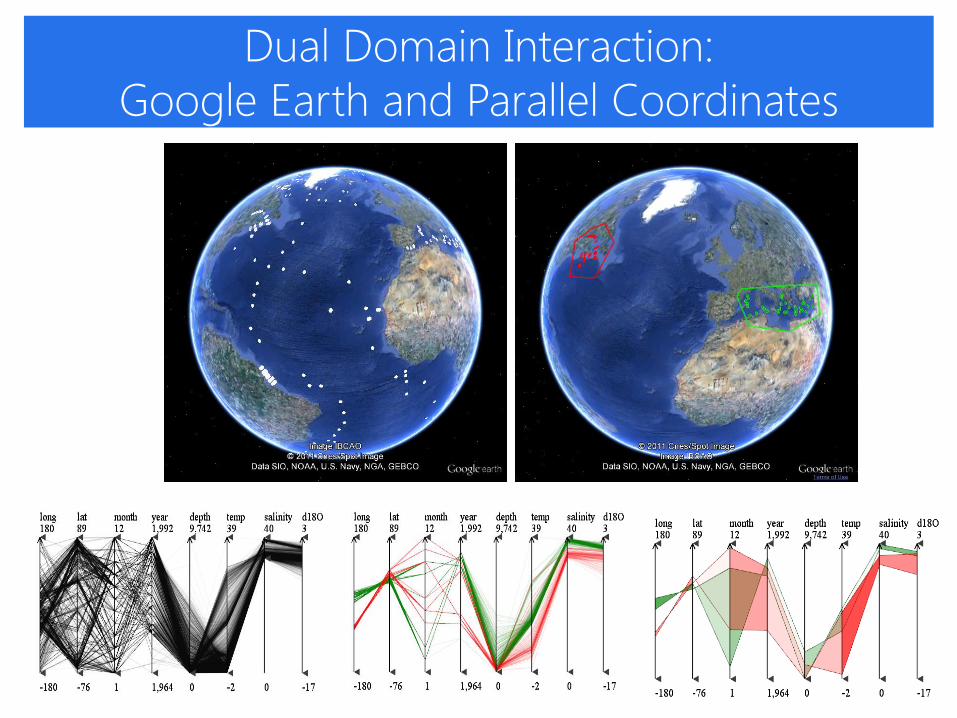
Dual Domain Interaction:
Google Earth and Parallel Coordinates

Google Earth Embedded Visualization

Google Earth Embedded Visualization

Integrated Pie Charts and Bar Charts

The ND-Scope
Parallel Coordinate Plot
Network Display
Geospatial Display
Spreadsheet

Evaluating the Work…
Visualizations are designed for humans
human perceptual response is complex
cannot be evaluated or modeled with machines (yet)
need to find humans to evaluate visualization methods
User studies are difficult
hard to get human volunteers to spend the time and effort
can recruit them via Amazon Mechanical Turk (crowd sourcing)
Amazon Mechanical Turk
very popular, but getting “turkers’ is competitive
also, “turkers’ are driven by money and not quality of result

Purpose-Driven Games
Humans love to play computer games
appeals to their competitive spirit
they will do the best job possible to win the game
A purpose-driven game is
a game that entices humans to solve problems machines cannot
exploits “human computation”
can we wrote one for visualization evaluation?
Yes, we can!

Disguise: The Purpose
A purpose-driven game to evaluate color blending algorithms
color blending is a difficult problem
is a function of color and transparency
Practical Example:

Disguise: The Purpose
Central perceptual question is:
which disk is o top?
not always clear
Quite a few algorithms have been developed
but none was really thoroughly tested

Color Blending Algorithms
1. Porter and Duff (standard)
𝐶𝑅𝐺𝐵𝛼 = 𝐴𝑅𝐺𝐵𝛼 ⊕ 𝐵𝑅𝐺𝐵𝛼 = 𝛼𝐴𝐴𝑅𝐺𝐵𝛼 + 1 − 𝛼𝐴 𝛼𝐵𝐵𝑅𝐺𝐵𝛼
2. Hue-preserving color blending [Chuang et al.]
3. Local method [Wang et al.]
4. 3. + blur back object edges

Disguise
Approach of the game presents to the player many instances of disk pairs each blended with
a random algorithm
for each make him/her choose which one is on top
judge the results
the algorithm with the most correct answers is the best
the player with the best score wins
these two scores are ideally unrelated

Results
Within 15 days of its opening:
261 players played the game (including guests)
these payers generated close to 30,000 data points
on average a player played the game for 298 seconds
each player produced 73 data points on average
Significance
on average each player produced 14.6 data points / minute
1,000 players for 24 hours would generate 21 M data points
Wang et al. recruited 72 subjects over 1 week (1,728 data points)

Results
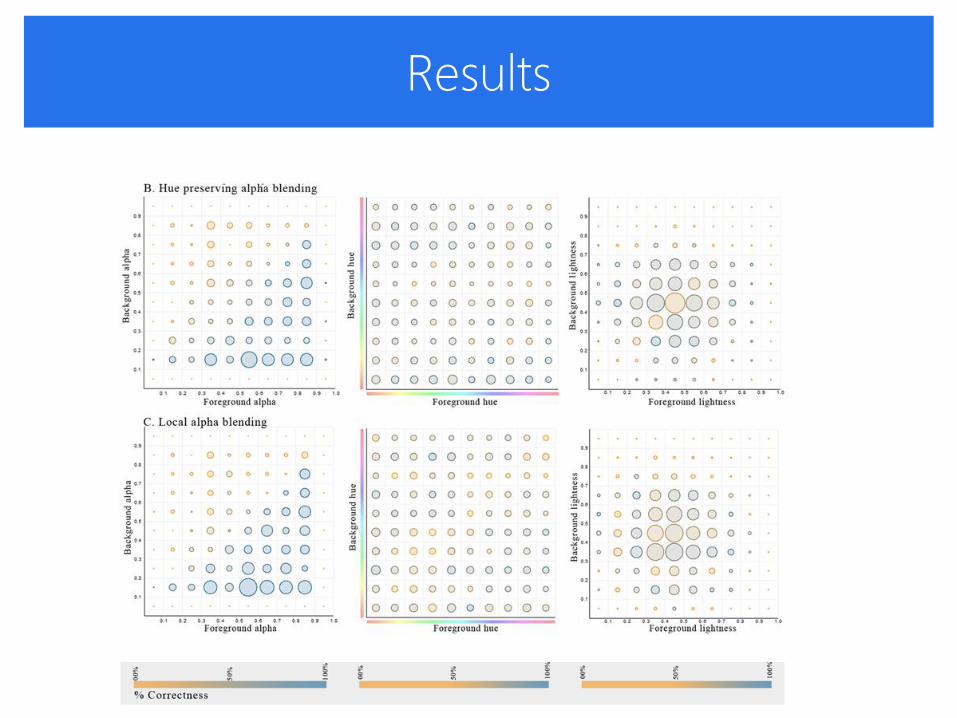
Results

Results

The ND-Scope
Parallel Coordinate Plot
Dynamic Scatterplot
Sight Map
Network Display
Geospatial Display
Spreadsheet

Relevant References
J. Lee, K. McDonnell, A. Zelenyuk, D. Imre, K. Mueller, "A Structure-Based Distance Metric for High-Dimensional Space Exploration with Multi-Dimensional Scaling," IEEE Trans. on Visualization and Computer Graphics, (to appear), 2014.
JB. Wang, P. Ruchikachorn, K. Mueller, “SketchPadN-D: WYDIWYG Sculpting and Editing in High-Dimensional Space,” IEEE Trans. Vis. and Computer Graphics, 19(12): 2060-2069, 2013.
Nam, K. Mueller, “TripTripAdvisorN-D: A Photo-Tourism Inspired High-Dimensional Space Exploration Framework with Overview and Detail,” IEEE Trans. on Visualization and Computer Graphics, 19(2): 291-305, 2013.
Z. Zhang, K. McDonnell, K. Mueller, "A Network-Based Interface for the Exploration of High-Dimensional Data Spaces, " IEEE Pacific Vis, Songdo, Korea, March, 2012
N. Ahmed, Z. Zheng, K. Mueller, "Human Computation in Visualization: Using Purpose Driven Games for Robust Evaluation of Visualization Algorithms," IEEE Trans. on Visualization and Computer Graphics, 18(12): 2104-2113, 2012.
Z. Zheng, N. Ahmed, K. Mueller, “iView: Feature Clustering Framework for Suggesting Informative Views in Volume Visualization,” IEEE Transactions on Visualization and Computer Graphics (Special Issue IEEE Visualization), 17(12):1959-1968, 2011.
L. Wang, J. Giesen, K. McDonnell, P. Zolliker, K. Mueller, "Color Design for Illustrative Visualization," IEEE Trans. on Visualization and Computer Graphics, 14(6):1739-1754, 2008.
K. McDonnell and K. Mueller, "Illustrative Parallel Coordinates," Computer Graphics Forum, vol. 27(3):1031-1038, 2008.
E. Nam, Y. Han, K. Mueller, A. Zelenyuk, D. Imre, "ClusterSculptor: A Visual Analytics tool for high-dimensional data," IEEE Symposium on Visual Analytics Science and Technology (VAST), pp. 75-82, November, 2007.

More Detail? Visit my Webpage…
http://www.cs.stonybrook.edu/~mueller
(for videos see dedicated paper web pages)
http://nd-scope.net
Any questions?