Embed Size (px)
Citation preview

THE NATURE OF THE NATURE OF INDUSTRYINDUSTRY
THE NATURE OF THE NATURE OF INDUSTRYINDUSTRY

Approaches to Studying Industry
• The Structure-Conduct-Performance (SCP) Paradigm:
• Different structures lead to different conducts and different performances

Market Structure
1. Number of buyers, Buyer Power, the number of firms that compete in a market, producer power
2. The relative size of the firm (concentration)
3. Technological and cost conditions; Economies of scale, Economies of scope, cost synergies, transaction costs
4. Ease of entry or exit into industry, regulations
5. Type of product (homogeneous or heterogeneous)
• Different industries have different structures that affect managerial decision

1. Firm Size:Some industries naturally give rise
to large firms than do other industries:
e.g. Industry = Aerospace, Largest firm = Boeing
Industry = Computer, office equipment
Largest firm = IBM
2. Industry concentration:Are there many small firms or only a
few large ones? (competition or little competition?)
2 ways to measure degree of concentration:a. Concentration ratiosb. Herfindahl-Hirschman Index (HHI)

Concentration ratios measure how much of the total output in an industry is produced by the largest firms in that industry.
Most common one used is the four-firm concentration ratio (C4) = the fraction of total industry sales produced by the 4 largest firms in the industry
If industry has very large number of firms, each of which is small, then is close to 0
When 4 or fewer firms produce all of industry output, is close to 1

• Four-Firm Concentration Ratio– The sum of the market shares of the top four
firms in the defined industry. Letting Si denote sales for firm i and ST denote total industry sales
– The closer C4 is to zero, the less concentrated the industry .
e.g. Industry has 6 firms. Sales of 4 firms = $10 and $5 for the other 2.
ST = 50
C4 = 40/50 = 0.8
4 largest firms account for 80% of total industry output
T
i
S
SwwherewwwwC 143214 ,

• Herfindahl-Hirschman Index (HHI)– The sum of the squared market shares of
firms in a given industry, multiplied by 10,000 (to eliminate decimals):
– By squaring the market shares, the index weights firms with high market shares more heavily
– HHI = 10,000 wi2, where wi = Si/ST.
0 <= HHI <= 10,000Closer to 0 means industry has numerous
infinitesimally small firms. Closer to 10,000 means little competition
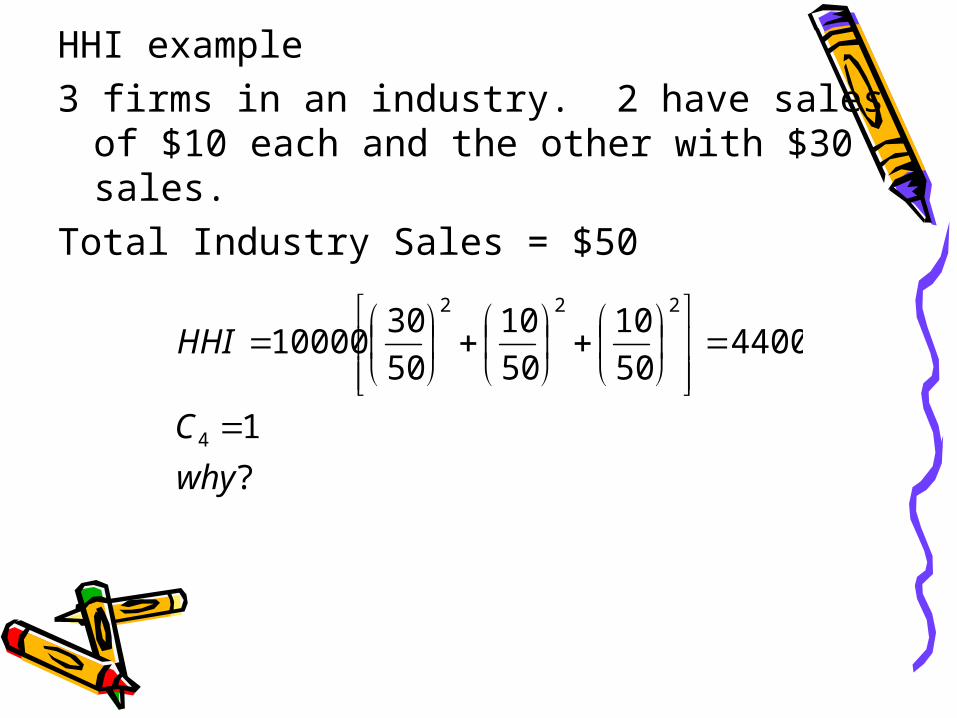
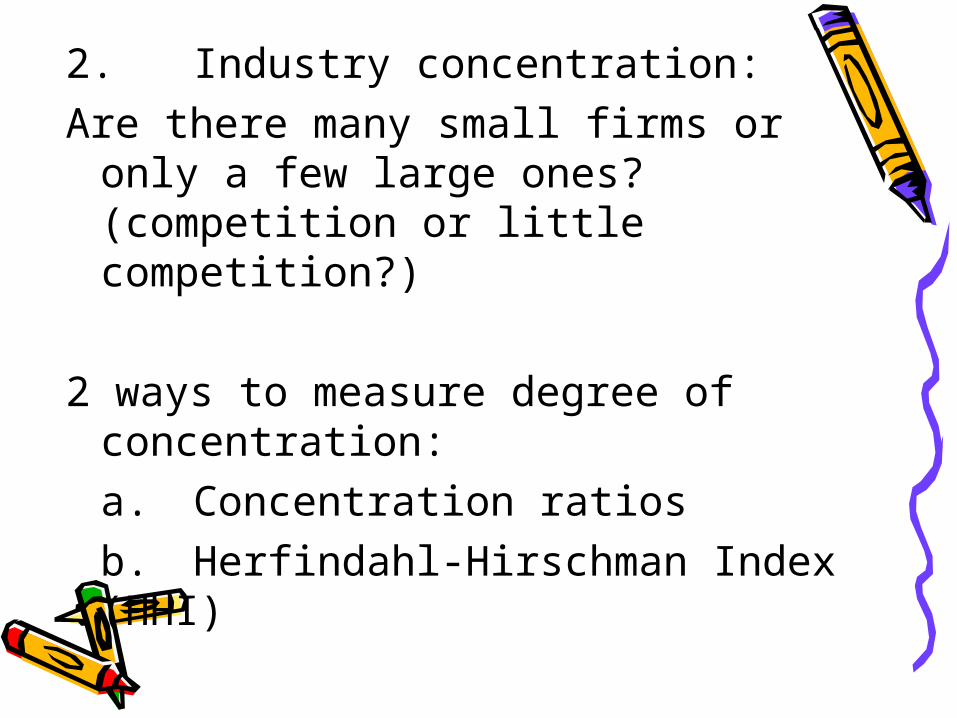
HHI example3 firms in an industry. 2 have sales of $10
each and the other with $30 sales.Total Industry Sales = $50
?
1
440050
10
50
10
50
3010000
4
222
why
C
HHI

Limitation of Concentration Measures
• Market Definition: National, regional, or local?
• Global Market: Foreign producers excluded.
• Industry definition and product classes.

Demand and Market Conditions
• Markets with relatively low demand will be able to sustain only few firms
• Access to information vary from industry to industry
• Elasticity of demand for products tend to vary from industry to industry
• Elasticity of demand for a firm’s product may differ from the market elasticity of demand for the product
Markets where there are no close substitutes for a given firm’s product, elasticity of demand for the firm’s product will be close to that of the market
Rothschild Index = R =Et/Ef
Et = market elasticityEf = firm’s elasticity
Measures how sensitive a firm’s demand is relative to the entire market.
When industry has many firms each producing a similar product, R will be close to zero
5. Potential for EntryEasier for new firms to enter some
industries than other industries.Barriers to entry:• Explicit cost of entering (Capital
requirements• Patents• Economies of scale: new firms cannot
generate enough volume to reduce average cost

CONDUCT: Conduct (behavior) of firms
differ across industries1. Some industries charge a higher
markup than others. (pricing behavior)
2. Some industries are more susceptible to mergers or takeovers
3. Amount spent on R&D tend to vary across industries

1. Pricing behavior:Lerner Index (L) = (P – MC)/PGives how firms in an industry mark
up their prices over MC.If firms vigorously compete, L is close
to zero.P = (1/1-L)MCIf L = 0, then the P=MCWhen L=1/2 firms charge price
that is 2x the MC of productione.g Tobacco industry. L = 76% P is
4.17x the actual MC of production

2. Integration and Merger ActivityUniting productive services.Can result from an attempt by firms
to• Reduce transaction cost• Reap the benefits of economies of
scale and scope• Increase market power• Gain better access to capital
markets

Types of integration:
1.Vertical : merging with your supplier to reduce transaction cost
2.Horizontal: merging similar companies to reduce cost and enjoy economies of scale or scope and market power
3.Conglomerate: merging firms in different industries to reduce the variability of firm’s earnings due to demand fluctuation

US Department of Justice considers industries with HHI > 1800 to be highly concentrated and may block any merger that will increase the HHI by more than 100
HHI < 1000 are considered unconcentrated.

Performance
• Performance refers to the profits and social welfare that result in a given industry.
• Social Welfare = CS + PS– Dansby-Willig Performance Index
measure by how much social welfare would improve if firms in an industry expanded output in a socially efficient manner.

Approaches to Studying Industry
• The Structure-Conduct-Performance (SCP) Paradigm: Causal View
Market Structure
Conduct Performance
e.g. Consider a highly concentrated industry. This structure
gives market power enabling them to charge higher prices for their products. This conduct (behavior of charging higher prices ) is caused by the market structure (few competitors). The high prices cause higher profits and poor performance (low social welfare)
Thus, a concentrated market causes high prices and poor performance
• The Feedback Critique– No one-way causal link.– Conduct can affect market
structure.– Market performance can affect
conduct as well as market structure.

Spectrum of Market Structures
Based on Power of Buyers and Sellers1.Monopsony (highest power of
buyers)2.Perfect Competition (Low power of
buyers and low power of sellers3.Oligopoly (Cartel) (medium power of
sellers, low power of buyers)4.Monopoly (highest power of sellers,
low power of buyers
Managing in Competitive,
Monopolistic, and Monopolistically
Competitive Markets
Four Basic Market Types
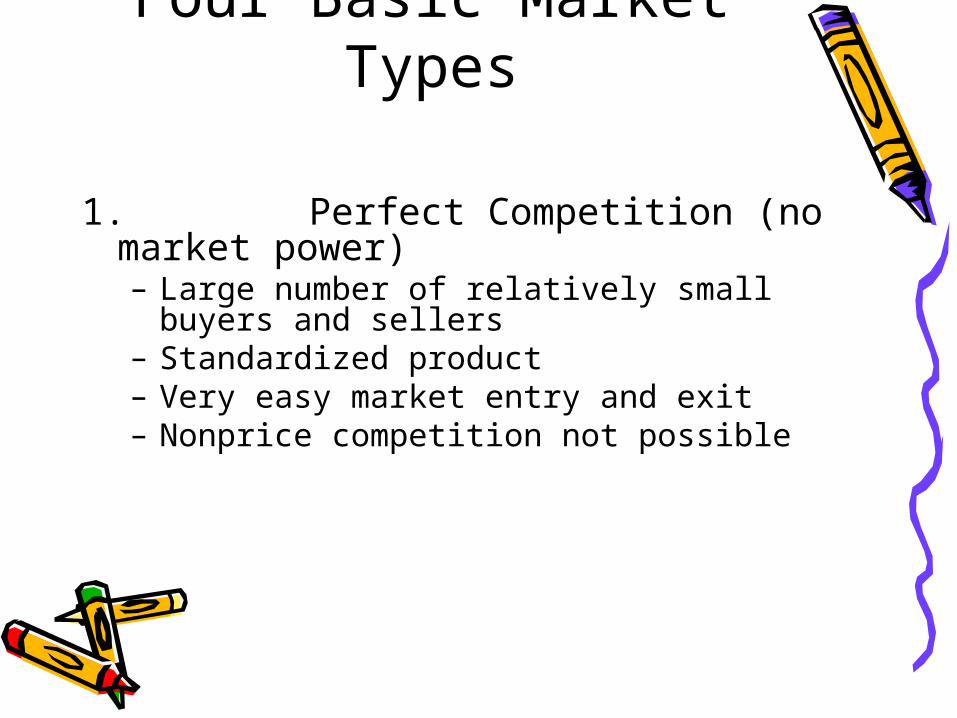
1. Perfect Competition (no market power)– Large number of relatively small buyers
and sellers– Standardized product– Very easy market entry and exit– Nonprice competition not possible

2. Monopoly (absolute market power subject to government regulation)– One firm, firm is the industry– Unique product or no close substitutes– Market entry and exit difficult or legally
impossible– Nonprice competition not necessary

3. Monopolistic Competition (market power based on product differentiation)– Large number of relatively small
firms acting independently– Differentiated product– Market entry and exit relatively easy– Nonprice competition very important
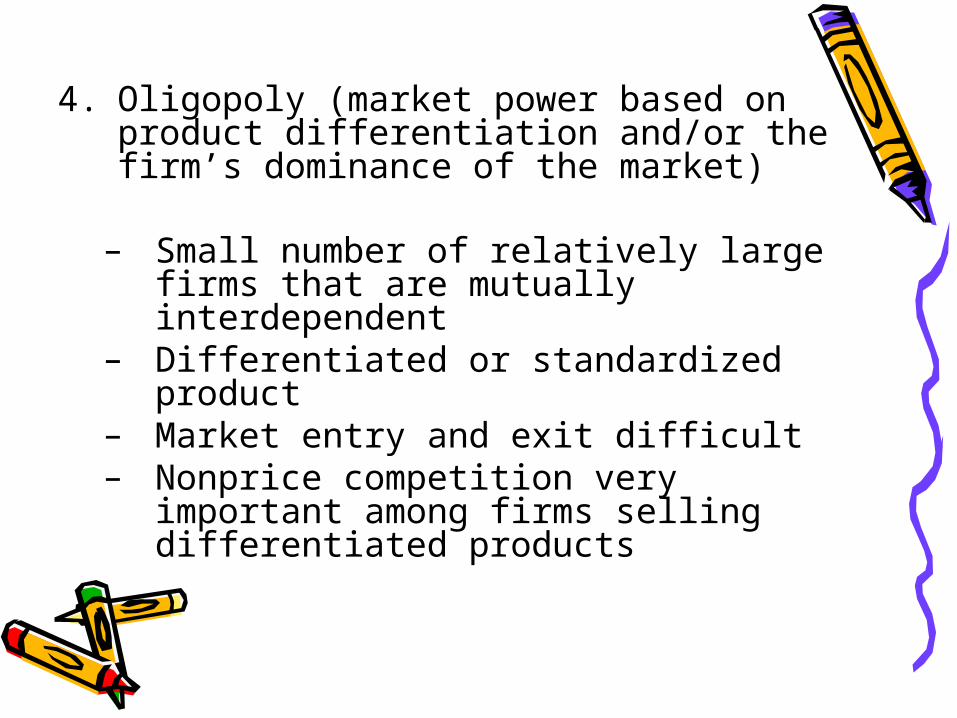
4. Oligopoly (market power based on product differentiation and/or the firm’s dominance of the market)
– Small number of relatively large firms that are mutually interdependent
– Differentiated or standardized product
– Market entry and exit difficult– Nonprice competition very
important among firms selling differentiated products


Pricing and Output Decisions in Perfect Competition
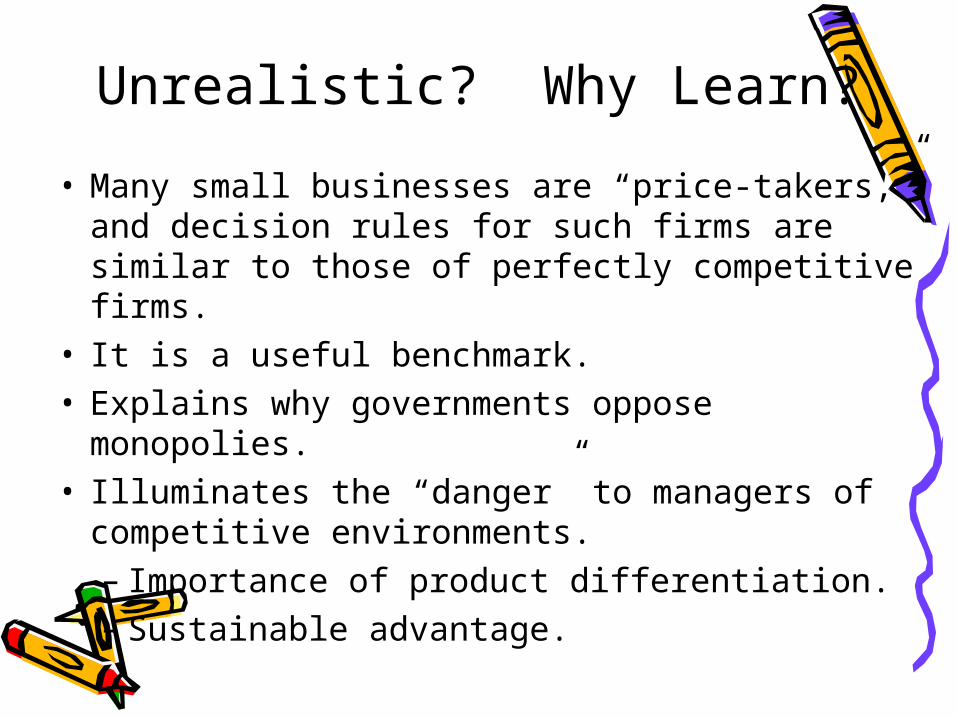
Unrealistic? Why Learn?
• Many small businesses are “price-takers,” and decision rules for such firms are similar to those of perfectly competitive firms.
• It is a useful benchmark.• Explains why governments oppose
monopolies.• Illuminates the “danger” to managers of
competitive environments.– Importance of product differentiation.– Sustainable advantage.

• Key assumptions of the perfectly competitive market– The firm operates in a perfectly competitive
market and therefore is a price taker.– The firm makes the distinction between the
short run and the long run.– The firm’s objective is to maximize its profit in
the short run. If it cannot earn a profit, then it seeks to minimize its loss.
– The firm includes its opportunity cost of operating in a particular market as part of its total cost of production.
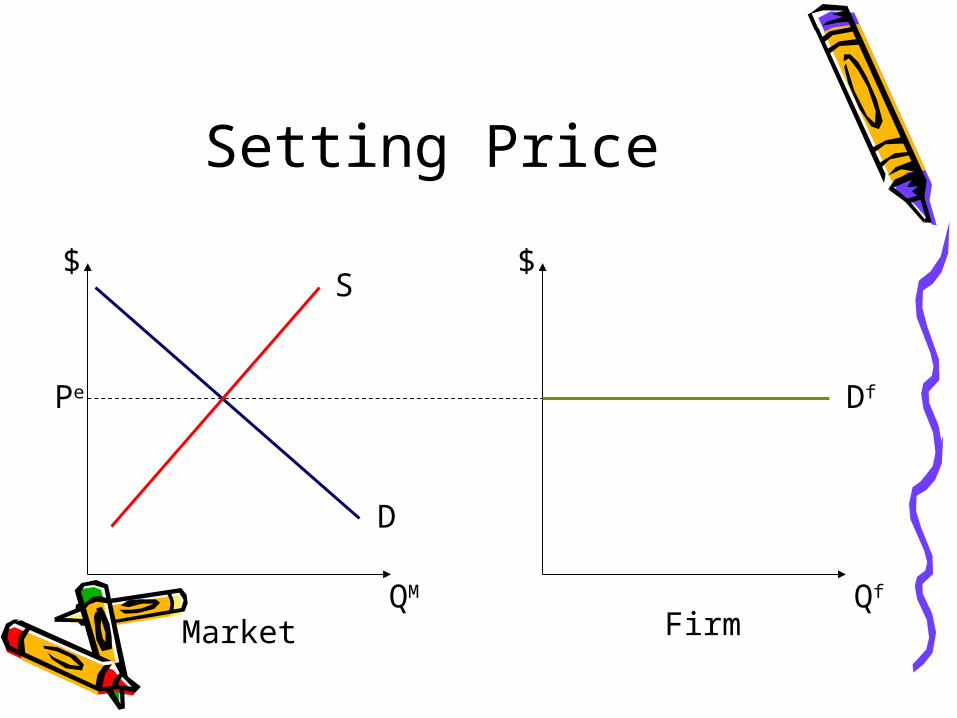
Setting Price
FirmQf
$
Df
MarketQM
$
D
S
Pe

Profit-Maximizing Output Decision
• MR = MC.• Since, MR = P, • Set P = MC to maximize profits.

Graphically: Representative Firm’s Output Decision
$
Qf
ATC
AVC
MC
Pe = Df = MR
Qf*
ATC
Pe
Profit = (Pe - ATC) Qf*

A Numerical Example
• Given– P=$10– C(Q) = 5 + Q2
• Optimal Price?– P=$10
• Optimal Output?– MR = P = $10 and MC = 2Q– 10 = 2Q– Q = 5 units
• Maximum Profits?– PQ - C(Q) = (10)(5) - (5 + 25) = $20

• The firm incurs a loss. At the optimum output level price is below average cost.
• However, since price is greater than average variable cost, the firm is better off producing in the short run, because it will still incur fixed costs greater than the loss.

Shutdown Decision Rule
• A profit-maximizing firm should continue to operate (sustain short-run losses) if its operating loss is less than its fixed costs.– Operating results in a smaller loss than
ceasing operations.
• Decision rule:– A firm should shutdown when P < min AVC.– Continue operating as long as P ≥ min AVC.

• Shutdown Point: the lowest price at which the firm would still produce.
• At the shutdown point, the price is equal to the minimum point on the AVC. This is where selling at the price results in zero contribution margin.
• If the price falls below the shutdown point, revenues fail to cover the fixed costs and the variable costs. The firm would be better off if it shut down and just paid its fixed costs.

$
Qf
ATC
AVC
MC
Qf*
P min AVC
Firm’s Short-Run Supply Curve: MC Above Min AVC

Long Run Adjustments?
• If firms are price takers but there are barriers to entry, profits will persist.
• If the industry is perfectly competitive, firms are not only price takers but there is free entry.– Other “greedy capitalists” enter the
market.

Effect of Entry on Price?
FirmQf
$
Df
MarketQM
$
D
S
Pe
S*
Pe* Df*
Entry

Summary of Logic
• Short run profits leads to entry.• Entry increases market supply, drives
down the market price, increases the market quantity.
• Demand for individual firm’s product shifts down.
• Firm reduces output to maximize profit.
• Long run profits are zero.
Features of Long Run Competitive Equilibrium
• P = MC– Socially efficient output.
• P = minimum AC– Efficient plant size.– Zero profits
• Firms are earning just enough to offset their opportunity cost.

Effect of an increase in DD in a PC market
Initial position P=AC (no economic profits= accounting profits cover opportunity cost)
Demand increasesMkt price increases in the SRFirms have an incentive to produce more output
with available capacityFirms make economic profitsProfits attract entrantsNew entrants increase SS and reduce market pricePrice decreases unit P=ACFinal Price is higher or lower depending on higher
or lower input prices as output increases

• As identical firms expand output and demand more inputs, price of inputs increase, increasing costs. Final price exceeds initial price
• As firms expand output and demand more inputs, price of inputs decrease, decreasing costs. Final price is lower than the initial price

Effects of an increase in variable cost in a PC market
Initial situation P=ACVariable cost increasesFirms have an incentive to produce
less output with available capacityFirms have economic lossesFirms exit marketMarket price increases (until P=AC)Final LR market price is higher to
compensate for higher variable cost

Effect of an increase in Fixed costs in a PC market
Initial situation P=ACFixed costs increaseMarket price does not change in the SR
because MC is not affectedFirms have economic lossesFirms exitSS decreases, market price increasesMarket price increases until P=ACLR market price is higher to compensate
for the higher fixed cost

Case: Trucking Industry• Higher gas prices increasing costs
increase in price of transporting cargo• Some truckers add airfoils to their truck
to compensate for higher gas prices• In the SR, the first truckers with airfoils
earn profits• Profits induce other truckers to add
airfoils or equivalent devices to their trucks
• In the LR, airfoils or equivalents are necessary for survival but not sufficient for profits

Monopoly Environment
• Single firm serves the “relevant market.”
• Most monopolies are “local” monopolies.
• The demand for the firm’s product is the market demand curve.
• Firm has control over price.– But the price charged affects the quantity
demanded of the monopolist’s product.

Managing a Monopoly• Market power
permits you to price above MC
• Is the sky the limit?• No. How much you
sell depends on the price you set!
“Natural” Sources of Monopoly Power
• Economies of scale• Economies of scope• Cost complementarities
“Created” Sources of Monopoly Power
• Patents and other legal barriers (like licenses)
• Tying contracts• Exclusive contracts• Collusion Contract...
I.
II.
III.

Monopoly Profit Maximization
$
Q
ATCMC
D
MRQM
PM
Profit
ATC
Produce where MR = MC.Charge the price on the demand curve that corresponds to that quantity.

A Numerical Example
• Given estimates of• P = 10 - Q• C(Q) = 6 + 2Q
• Optimal output?• MR = 10 - 2Q• MC = 2• 10 - 2Q = 2• Q = 4 units
• Optimal price?• P = 10 - (4) = $6
• Maximum profits?• PQ - C(Q) = (6)(4) - (6 + 8) = $10
Strategies to maintain a Monopoly market position
• Apply “limit” pricing• Threaten with “predatory pricing”• Invest in excess capacity• Raise cost of rivals by advertising• Control key inputs• As on substitutes and complements• Integrate vertically and horizontally• Influence politicians and regulators
Why Government Dislikes Monopoly?
• P > MC– Too little output, at too
high a price.
• Deadweight loss of monopoly.

$
Q
ATCMC
D
MRQM
PM
MC
Deadweight Loss of Monopoly
Deadweight Loss of Monopoly

Arguments for Monopoly
• The beneficial effects of economies of scale, economies of scope, and cost complementarities on price and output may outweigh the negative effects of market power.
• Encourages innovation.

Monopolistic Competition: Environment and Implications
• Numerous buyers and sellers• Differentiated products
– Implication: Since products are differentiated, each firm faces a downward sloping demand curve. • Consumers view differentiated products as
close substitutes: there exists some willingness to substitute.
• Free entry and exit– Implication: Firms will earn zero
profits in the long run.

Managing a Monopolistically Competitive Firm
• Like a monopoly, monopolistically competitive firms– have market power that permits pricing
above marginal cost.– level of sales depends on the price it sets.
• But … – The presence of other brands in the market
makes the demand for your brand more elastic than if you were a monopolist.
– Free entry and exit impacts profitability.
• Therefore, monopolistically competitive firms have limited market power.

Competing in Imperfectly
Competitive Markets• Non-price variables: any factor that managers can
control, influence, or explicitly consider in making decisions affecting the demand for their goods and services.– Advertising– Promotion– Location and distribution channels– Market segmentation– Loyalty programs– Product extensions and new product development– Special customer services– Product “lock-in” or “tie-in”– Pre-emptive new product announcements
Monopolistic Competition: Profit Maximization
• Maximize profits like a monopolist– Produce output where MR = MC.– Charge the price on the demand
curve that corresponds to that quantity.

Short-Run Monopolistic Competition
$ATC
MC
D
MRQM
PM
Profit
ATC
Quantity of Brand X

Long Run Adjustments?• If the industry is truly
monopolistically competitive, there is free entry. – In this case other “greedy capitalists”
enter, and their new brands steal market share.
– This reduces the demand for your product until profits are ultimately zero.

$AC
MC
D
MR
Q*
P*
Quantity of Brand XMR1
D1
Entry
P1
Q1
Long Run Equilibrium(P = AC, so zero profits)
Long-Run Monopolistic Competition

Monopolistic Competition
The Good (To Consumers)– Product Variety
The Bad (To Society)– P > MC– Excess capacity
• Unexploited economies of scale
The Ugly (To Managers)– P = ATC > minimum of
average costs.• Zero Profits (in the long
run)!
Maximizing Profits: A Synthesizing Example
• C(Q) = 125 + 4Q2
• Determine the profit-maximizing output and price, and discuss its implications, if– You are a price taker and other firms charge
$40 per unit;– You are a monopolist and the inverse demand
for your product is P = 100 - Q;– You are a monopolistically competitive firm
and the inverse demand for your brand is P = 100 – Q.
Marginal Cost• C(Q) = 125 + 4Q2,• So MC = 8Q.• This is independent of market
structure.

Price Taker• MR = P = $40.• Set MR = MC.
• 40 = 8Q.• Q = 5 units.
• Cost of producing 5 units.• C(Q) = 125 + 4Q2 = 125 + 100 = $225.
• Revenues:• PQ = (40)(5) = $200.
• Maximum profits of -$25.• Implications: Expect exit in the long-
run.
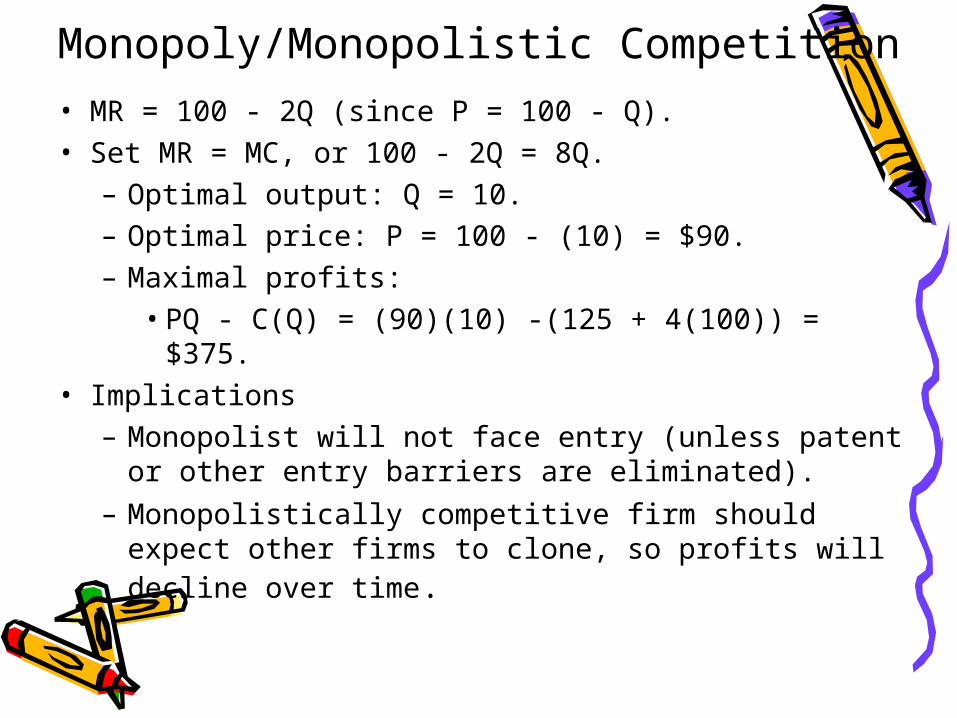
Monopoly/Monopolistic Competition
• MR = 100 - 2Q (since P = 100 - Q).• Set MR = MC, or 100 - 2Q = 8Q.
– Optimal output: Q = 10.– Optimal price: P = 100 - (10) = $90.– Maximal profits:
• PQ - C(Q) = (90)(10) -(125 + 4(100)) = $375.• Implications
– Monopolist will not face entry (unless patent or other entry barriers are eliminated).
– Monopolistically competitive firm should expect other firms to clone, so profits will decline over time.

Conclusion• Firms operating in a perfectly competitive
market take the market price as given.– Produce output where P = MC.– Firms may earn profits or losses in the short run.– … but, in the long run, entry or exit forces profits to
zero.
• A monopoly firm, in contrast, can earn persistent profits provided that source of monopoly power is not eliminated.
• A monopolistically competitive firm can earn profits in the short run, but entry by competing brands will erode these profits over time.

Oligopoly• Oligopoly is a market dominated by a
relatively small number of large firms» Unconcentrated markets have HH
< 1,000
• Products are either standardized or differentiated
• Barrier to entry exist• Price, Output and profits depend on
actions, reactions, and counteractions

Basic Oligopoly Models
• “Sweezy” Oligopoly – A firm assumes that rivals will cut prices when it reduces its price but will not increase prices when it increases the price – result: Price rigidity
• “Cournot” Oligopoly – A firm decides its output based on the output of rivals and vice versa – results: firms divide the market
• “Betrand” Oligopoly – Firms compete by undercutting each other’s price – result: Price wars and no profits
• “Stakelberg” Oligopoly: A firm moves first and commits to an output level before rivals. Rivals decide their output based on the leader’s output – results: staus quo

Cartel
Agreement among competing firms to fix prices, output and marketing.
Occurs in oligopoly marketsCan be explicit or ImplicitLegal or illegal
Explicit Cartels
• Pure – all firms join the cartel and all have the same costs and costs structure
• Perfect – all firms join the cartel but firms have different costs and cost structures
• Imperfect – Not all firms join and firms have the same or different costs and cost structures

Implicit Cartels
• Firms coordinate strategies without explicit cooperation while recognizing their interdependence.
• Firms play strategic games • Firms exploit gray area in anti-
trust laws
Dynamics of an Explicit Cartel (Explicit collusion)
Initial position: producers behave competitively P=AC (no economic profits)
Producers have an agreement to increase the price
Producers set quota to control cheatingFirms make economic profitsAs P>MC>AC, each producer has an incentive to
produce more than the quotaThe cartel breaks down as each producer cheatsThe cartel has to adopt additional strategies to
extend the life of the cartel
Some Strategies to facilitate strategic coordination
• Hire a cartel enforcer• Centralize or consolidate trade of members
and non-members• Control key inputs• Establish specifications and standards• Hire quota enforcers• Divide the market geographically• Limit market shares and set collusion terms
other than price• Influence government so that it ‘regulates”
industry• Pay for not producing or buy production from
others

Case: Government as an Enforcer of coordination
• Government imposes tax on producers• Variable cost rise, supply falls, PRP
(price received by producers) fall and PPC (price paid by consumers) increase
• This is equivalent to a government that figurative buys x for PRP and resells x for PPC

Mafioso Economics
• Merchants in a city compete and charge price = Po
• "Mafioso Jane" tells merchants that they have to charge P1 (higher than Po) and threatens merchants if they do not obey
• Merchants in general make more profits at higher price P1. They pay for a fee or “private tax” to "Mafioso Jane" for services rendered
• "Mafioso Jane" acts as a cartel enforcer.• Merchants gain by having "Mafioso Jane" put
order in the market and discipline cheaters• "Mafioso Jane" is acting like a government by
regulating entry and imposing taxes