Embed Size (px)
Citation preview
June 2016
The nature of food poverty: literature review and qualitative study in Greenwich (UK)
Master’s Thesis Nutrition and Health
Author: Daphné Duval Director: David Fornons Fontdevilla & Francesc Xavier Medina Luque External Tutor: Nicola Nzuza

2
3
ACKNOWLEDGEMENT
The research conducted for this Master’s Thesis has been realised in the team
‘Food and Health’ at Public Health Greenwich within the framework of a Food
Poverty Needs Assessment leaded by Nicola Nzuza.
Huge thanks to my external tutor Nicola Nzuza for giving me the opportunity
to realise this project in her team. She consistently allowed this research to be
my own work, but steered me in the right direction whenever it was needed.
This has been a fascinating and enriching experience, my only regret being
that it was too short!
I would also like to thank Diana Divajeva, Public Health Information Analyst in
Greenwich, for her invaluable help with data analyses. And big thanks to Pat
and Adam for having wandered in the most deprived areas of the borough to
collect all the data necessary for the healthy basket study.
I would also like to acknowledge the Made In Hackney team for giving me
access to their premium version of Survey Monkey and for allowing me to pilot
my survey in their food poverty cookery courses.
Last but not least, muchas gracias a mis directores de la UOC, por orden
alfabético: Alicia Aguilar Martínez, David Fornons Fontdevilla y Francesc
Xavier Medina Luque. Muchas gracias por haberme autorizado a realizar este
trabajo y haberme acompañado en la realización de esta tesis. Y muchas
gracias por haberme dejado escribir en ingles, soy consciente que para
algunos les he complicado el trabajo. ¡Gracias!

4
5
Contents
I. INTRODUCTION ................................................................................................................ 7
II. OBJECTIVES ........................................................................................................................ 9
1. General Objective ................................................................................................................................ 9
2. Specific Objectives ............................................................................................................................... 9
III. LITERATURE REVIEW .................................................................................................. 10
1. Food Poverty in the UK: National Reports ......................................................................................... 10
2. How to measure and quantify food poverty ..................................................................................... 11
3. Food poverty, diet, and health .......................................................................................................... 13
4. Physical access and affordability of food in deprived area ................................................................ 14
5. Conclusion ......................................................................................................................................... 15
IV. METHODOLOGY ............................................................................................................. 16
1. Healthy Food Basket .......................................................................................................................... 16
2. Survey ................................................................................................................................................ 17
3. Qualitative interview studies ............................................................................................................. 20
V. RESULTS & DISCUSSION .............................................................................................. 21
1. Price & access to healthy food in deprived areas of Greenwich ....................................................... 21
2. Findings from key workers ................................................................................................................. 22
3. Findings from individuals experiencing food poverty ........................................................................ 30
4. Discussion .......................................................................................................................................... 35
VI. CONCLUSIONS ................................................................................................................ 36
VII. APPENDICES ................................................................................................................... 37
1. Food retail environment in Greenwich .............................................................................................. 37
2. Healthy food basket ........................................................................................................................... 39
3. Shopping and Eating Habits Survey ................................................................................................... 42
4. Survey Results .................................................................................................................................... 47
5. Findings from the lived experience interviews .................................................................................. 55
VIII. REFERENCES .................................................................................................................. 60
6
Table of Figures
Figure III-1. Food insecurity severity along a continuous scale [18]. .......................................................... 12
Figure IV-1. Supermarket in Greenwich with 500 m buffer & LSOA IMD London quintiles. Circles 1 to 10:
deprived areas expected to have poor access to affordable healthy food. © Crown copyright and
database rights 2013 Ordnance Survey 100019153 .......................................................................... 16
Figure V-1. Prices of the healthy food basket in 18 shops in deprived areas with poor access to healthy
food (blue) and in 2 large supermarkets (orange). ............................................................................ 22
Figure V-2. Prices of the fruit and vegetable basket in 13 shops in deprived areas with poor access to
healthy food (blue) and in 2 large supermarkets (orange). ............................................................... 22
Figure V-3. Financial reasons for food poverty given by the key workers and expressed in percentage.
Poverty premium (1) = supermarket offers targeted at bulk requires bigger initial outlay; Poverty
premium (2) = fuel prices higher with key meter. ............................................................................. 23
Figure V-4. Percentage of key workers associating lacks of skills and knowledge with food poverty. ...... 25
Figure V-5. Percentage of key workers associating physical access with food poverty. ............................ 26
Figure V-6. Pictures of two takeaways front windows (Greenwich) highlighting cheap food prices. ........ 26
Figure V-7. Vulnerable groups for food poverty as expressed by the key workers, in percentage. ........... 28
Figure V-8. Picture of a fruit & veg stall in the Woolwich Common Community Centre, a deprived area of
Greenwich with poor access to affordable healthy food. ................................................................. 29
Figure V-9. Long-term solutions to food poverty as expressed by the key workers, in percentage. ......... 30
Figure V-10. Reported average consumption of specific food items (100% = 23; 1 respondent didn’t
answer). ............................................................................................................................................. 31
Figure V-11. Factors that prevent the respondents from eating more healthy food. (100% = 17
respondents) The ‘other’ reasons cited were health problems (2), lack of fridge and freezer (1) and
alcohol problem (1). .......................................................................................................................... 31
Figure V-12. Main problems reported by the respondents when shopping for food (100% = 22; 2
respondent didn’t answer). ............................................................................................................... 32
Figure V-13. Reported causes associated to food poverty. The four ‘other’ answers were related to a lack
cooking skills (1), a problem of alcohol (1) and to the dependence on other people choices (2).
(100% = 17 respondents) ................................................................................................................... 33
Figure VII-1. Food premises in Greenwich & LSOA IMD London quintiles. © Crown copyright and
database rights 2013 Ordnance Survey 100019153 .......................................................................... 37
Figure VII-2. Takeaway premises in Greenwich with 500 m buffer & LSOA IMD London quintiles. ©
Crown copyright and database rights 2013 Ordnance Survey 100019153 ....................................... 38
Figure VII-3. Supermarket in Greenwich with 500 m buffer & LSOA IMD London quintiles. © Crown
copyright and database rights 2013 Ordnance Survey 100019153 ................................................... 38
Figure VII-4. Food items availability in the 35 studied shops (%). .............................................................. 40
Figure VII-5. Shop availability for the 22 studied food items (%). .............................................................. 40
Figure VII-6. Minimum, average and maximum prices for the 22 food items considering all shops. ........ 41
7
I. Introduction
“Food poverty is worse diet, worse access, worse health, higher percentage of
income on food and less choice from a restricted range of foods. Above all
food poverty is about less or almost no consumption of fruits & vegetables”
Tim Lang, Professor of Food Policy at City University, London
Food poverty is often associated to food banks which are actually a crisis response to the
immediate needs of people without enough money for food. Nevertheless, food poverty also
includes underlying food insecurity. Less evident, this long-term condition is being experienced
by many more people than what the food banks data show. The Fabian Commission on Food
and Poverty defines ‘household food insecurity’ as “the inability to acquire or consume an
adequate quality or sufficient quantity of food in socially acceptable ways, or the uncertainty
that one will be able to do so” [1]. In the following, food poverty will refer to both crisis level
food poverty and longer-term food insecurity, according to the definition given by the UK
Department of Health: “Food poverty can be defined as the inability for individuals to afford,
or to have access to, foods which make up a healthy diet in ways that are socially acceptable to
them” [2].
Food poverty is affected by a complex interplay of factors that can be regrouped under the
three following barriers:
Affordability, defined as the cost of the diet of a household relative to the household’s
income. It depends on prices and incomes. Low-income households may find it difficult to
afford a healthy diet.
Access to food depends on geographical situation and income. Low-income households
may have difficulty to access healthy food. It can be due to a poor availability of healthy
foods in local shops and/or to a lack of transports and big shops in deprived areas.
Skills for planning, budgeting, shopping and cooking are bonded to healthy diet, especially
in households with less resource. Poor domestic facilities, lack of cooking equipment and
lack of healthy eating knowledge are other barriers to healthy eating.
Food poverty is about inequalities: wealth inequalities, diet inequalities and health
inequalities. Wealth inequalities as those most likely to be in food poverty are people living on
low incomes or/and in deprived areas as well as vulnerable groups such as destitute, homeless,
unemployed, older people, refugees, minority ethnic groups and people with physical or
mental health problems. Diet and health inequalities as food poverty can lead to a number of
diet-related health problems such as depression and anxiety, poor oral health, malnutrition
(obesity, under nutrition, or an imbalance of nutrients), diabetes, cardiovascular diseases and
some cancers. There is also a significant social stigma associated to food poverty which can
lead to difficulties in socialising [3,4].
In recent years, food poverty has become a subject of concern in the UK where the food
bank data show an increase in numbers of people experiencing food poverty at a crisis Level.
Emerging evidence also indicates an increasing number of households that are unable to
sustain normal patterns of food shopping and eating [5–8]. It is noteworthy that the UK ranks
among the bottom half of countries in the European Union in terms of food security, with 10%
of adults affected compared with 7% in Spain [8]. This is in part due to extremely high rate of
general and food inflation: in the eight years to August 2015, the price of food increased by
31% in the UK compared with 18% in Germany and 12% in France. And yet in the seven years
8
to 2014 annual earnings increased by just 13% in the United Kingdom compared with 14% in
France, and 17% in Germany [9]. Such data suggest a decrease of the affordability of healthy
food in low-income populations.
In this context, the Royal Borough of Greenwich (RBG) and the Greenwich Cooperative
Development Agency (GCDA) commissioned Good Food in Greenwich to evaluate the local
situation [10–12]. Greenwich, in South East London, is a place of great contrasts. On one hand,
it is a borough associated with internationally famous historical sites, including the Royal
Observatory, and it has hosted a third of the Olympic and Paralympics Games in 2012. On the
other hand, the borough has to face high levels of deprivation amongst significant proportions
of the population, especially in the north of the borough. The food poverty needs assessment
conducted in Greenwich takes a whole-systems approach to investigate how food poverty in
the wider sense is experienced in Greenwich and to identify potential local-level solutions.
The research conducted for this Master’s Thesis forms part of this needs assessment with a
special focus in gaining insights into factors affecting food poverty in Greenwich and the ways
in which it is experienced. To do so, a broad literature review has first been conducted to
support the Greenwich food poverty needs assessment and to find relevant references on how
to evaluate the situation of those in situation of food poverty. Secondly, the access and
affordability of healthy food in deprived area has been studied based on the pricing of a
healthy food basket. Face-to-face interviews with key workers in Greenwich have also been
conducted to get insights from their experiences of working with people in situation of food
poverty. Finally, a survey and lived experience interviews have been conducted for a better
understanding of the situation of people experiencing food poverty.
9
II. Objectives
1. General Objective
The objective of this work is to analyse the nature of food poverty in Greenwich from four
different levels:
- Through a literature review on food poverty
- Through a study on access and price of healthy food in deprived areas
- Through interviews with key workers
- Through a survey and interviews with individuals experiencing food poverty.
2. Specific Objectives
1. Establish the state-of-the-art related to food poverty assessment.
2. Identify relevant references on how to assess the situation of people in situation of food
poverty.
3. Assess access and affordability of healthy food in deprived areas.
4. Conduct interviews with key informants from public services and community organisations
to get insights from their field experiences.
5. Develop the methodology and implement the tools to conduct a survey and interviews with
people experiencing food poverty in Greenwich.
6. Conduct a survey and interviews with people experiencing food poverty in Greenwich.
7. Provide insights into the situation of people experiencing food poverty in Greenwich.
10
III. Literature Review
Within the framework of the Greenwich Needs Assessment, a review of the literature was
conducted using peer-reviewed primary research and grey literature sources. The review sets
out to identify relevant studies and reports that had been published in the area of food
poverty in the widest sense, and in particular on the measure and quantification of food
poverty, on the links between food poverty, diet and health, and on the physical access and
affordability of food in deprived area (‘food desert’ and ‘healthy food basket’). Food poverty
being a multi-layered problem influenced by socioeconomic, cultural and geographical factors,
the research has been mainly focused on studies conducted in the UK and published in the last
10 years. Exceptions have been made for pioneer studies such as the early works of Elizabeth
Dowler [13,14].
1. Food Poverty in the UK: National Reports
The rise in food poverty in the UK is documented by a number of recent key national
reports [1,5–9,15]. The most visible sign is the increase in demand for emergency food parcels
and food bank vouchers: Oxfam, Church Action on Poverty and Trussell Trust reported that
more than 20 millions of meals have been given to people in food poverty in 2013/14, which
corresponds to a 54% increase on 2012/13 [6]. Considering the wider definition of food
poverty, preliminary data from an international survey conducted by the Gallup® World Poll
for FAO/UN reported that 10.1% of people aged 15 or over in the UK were food insecure in
2014. Among these people, 4.5% experienced a severe level of food insecurity, typically having
gone a whole day without eating because they could not afford enough food [8].
The report “Child Hunger in London; understanding food poverty in the Capital” published
in 2013 by the Greater London Authority showed that 42% of parents have cut back on the
amount of food they buy between 2012 and 2013, that 21% have skipped meals so that their
children could eat and that 9% of children across London said that they sometimes or often go
to bed hungry. The report highlighted the problem of affordability of healthy food, including
fresh fruit and vegetables, with 30% of families cutting back on fresh fruit and vegetables, in
favour of cheaper, frozen foods which present better value as they last longer [5]. The problem
of child hunger has also been reported by the Fabian Commission on Food and Poverty who
pointed out that “there are multiple cases of parents – usually mothers – going hungry to feed
their children or having to prioritise calories over nutrients to afford their weekly food shop”
[1].
All the reports coincide in that the rise in food prices, the changes in the benefit systems,
the delay payment of benefits, the effective sanction regime, the underemployment, the very
low wages and the insecure and zero-hours contracts are the main causes of the recent
increase of food poverty.
To address these issues, the All-Party Parliamentary Inquiry into Hunger in the United
Kingdom has been created with the aim to provide immediate and long-term
recommendations [9,15]. In 2014, their first report concluded that they “are left with two
abiding impressions. The first is that hunger is here to stay in Britain until counteraction is
taken. The second is that appropriate action is not only desirable but possible” [15]. In their
second report, published in 2015, 68 recommendations were presented, among which we can
cite the creation of social supermarkets to improve the affordability of healthy food in
11
deprived area and the presence of trained welfare rights officers at each food bank session to
solve the crises that have led people to be hungry [9].
Similarly, the Fabian Commission on Food and Poverty, an independent Commission with
no affiliation to any political party, published in 2015 a list of recommendations towards the
creation of a fair and sustainable food system to tackle food poverty. According to this report,
the current approach is focused on the individual’s own responsibility to eat well, ignoring the
environments in which these choices are shaped. With this approach, governments have
moved responsibility to individuals, businesses and charities. The new approach proposed by
the Fabian Commission is based on the assessment that governments need to take direct
responsibility for food poverty. The report sets out the principles and actions to guide a
coordinated approach between local authorities and third section organisations to reduce
poverty and improve access to food [1].
If a need for coordinated action is also highlighted by the charity Sustain, their report
published in 2015 mainly focused in actions that should be taken by local councils. Taking into
account that 1.5 million of poor children are not eligible for free school meals or that 1 in 5
older Londoners live in a borough without meals on wheels, the report claims that publicly-
funded nutrition programmes such as Healthy Start vouchers [16], free school meals and meals
on wheels must be safeguarded and extended to reach all eligible participants [7].
Finally, a shared recommendation is that government authorities in the UK urgently need to
initiate regular, robust and comprehensive monitoring of food poverty in order to be able to
effectively tackle food poverty [8,9,15]
2. How to measure and quantify food poverty
The 2016 Food Poverty Workshop Report pointed out that in the UK, unlike in the US and
Canada, there is no official data on the number of adults and children who are food insecure
[17]. According to this report, the most direct way to measure and monitor food insecurity is
to include a set of questions on the topic on a survey, ideally routinely administrated to a large
enough sample of the population.
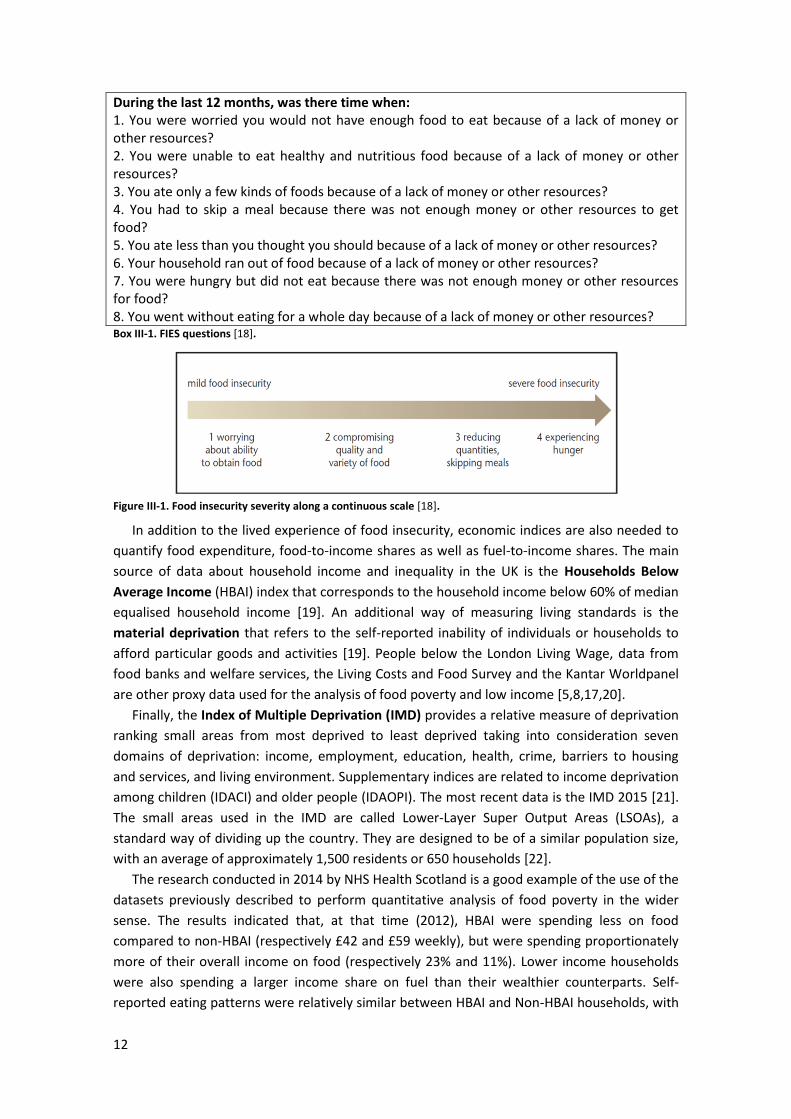
The two main measurements for food insecurity are the United Nations ‘Food Insecurity
Experience Scale’ (FIES) and the ‘Household Food Security Survey Module’ (HFSSM). The FIES,
developed by the FAO, is an experience-based food insecurity scale that has been used in the
US since 1995. Simple to use, it is composed of eight questions related to qualitative and
quantitative manifestations of food insecurity in the past 12 months (Box III-1). The questions
are based on the three domains that represent the experience of food insecurity: worry,
changes in food quality, changes in food quantity [18]. The answers are used to place
respondents on a scale from mild (‘worrying about ability to obtain food’) to severe food
insecurity (‘experiencing hunger’), as illustrated Figure III-1. The main limitation of the FIES
resides in that it does not consider children’s experience of food poverty.
The HFSSM has been regularly used in Canada since 2015. It is formed of 18 questions that
differentiate between adults’ and children’s experiences. Additional differences when
compared to the FIES is that some questions cover the reliance on low-cost foods and possible
weight loss in adults [17].
12
During the last 12 months, was there time when: 1. You were worried you would not have enough food to eat because of a lack of money or other resources? 2. You were unable to eat healthy and nutritious food because of a lack of money or other resources? 3. You ate only a few kinds of foods because of a lack of money or other resources? 4. You had to skip a meal because there was not enough money or other resources to get food? 5. You ate less than you thought you should because of a lack of money or other resources? 6. Your household ran out of food because of a lack of money or other resources? 7. You were hungry but did not eat because there was not enough money or other resources for food? 8. You went without eating for a whole day because of a lack of money or other resources? Box III-1. FIES questions [18].
Figure III-1. Food insecurity severity along a continuous scale [18].
In addition to the lived experience of food insecurity, economic indices are also needed to
quantify food expenditure, food-to-income shares as well as fuel-to-income shares. The main
source of data about household income and inequality in the UK is the Households Below
Average Income (HBAI) index that corresponds to the household income below 60% of median
equalised household income [19]. An additional way of measuring living standards is the
material deprivation that refers to the self-reported inability of individuals or households to
afford particular goods and activities [19]. People below the London Living Wage, data from
food banks and welfare services, the Living Costs and Food Survey and the Kantar Worldpanel
are other proxy data used for the analysis of food poverty and low income [5,8,17,20].
Finally, the Index of Multiple Deprivation (IMD) provides a relative measure of deprivation
ranking small areas from most deprived to least deprived taking into consideration seven
domains of deprivation: income, employment, education, health, crime, barriers to housing
and services, and living environment. Supplementary indices are related to income deprivation
among children (IDACI) and older people (IDAOPI). The most recent data is the IMD 2015 [21].
The small areas used in the IMD are called Lower-Layer Super Output Areas (LSOAs), a
standard way of dividing up the country. They are designed to be of a similar population size,
with an average of approximately 1,500 residents or 650 households [22].
The research conducted in 2014 by NHS Health Scotland is a good example of the use of the
datasets previously described to perform quantitative analysis of food poverty in the wider
sense. The results indicated that, at that time (2012), HBAI were spending less on food
compared to non-HBAI (respectively £42 and £59 weekly), but were spending proportionately
more of their overall income on food (respectively 23% and 11%). Lower income households
were also spending a larger income share on fuel than their wealthier counterparts. Self-
reported eating patterns were relatively similar between HBAI and Non-HBAI households, with
13
the exception of fruit and vegetable intakes. Particular groups known to be vulnerable to food
poverty were reported to be in worsening long-term food conditions while new groups
emerged as being of particular concern, such as families with young children and single-
mother [20]. Similarly, data from the 2013 Living Costs and Food Survey showed that the
poorest 10% of households in the UK only spent an average of £46 on food and non-alcoholic
drinks each week but that accounted for 15% of their household expenditure. In contrast, the
richest 10% spent more than £80 but this amounted to less than 7% of their expenditure [8].
3. Food poverty, diet, and health
The UK Low Income Diet and Nutrition Survey (LIDNS) was published in 2007, providing
robust, nationally representative, baseline data on the dietary habits and nutritional status of
bottom 15% of the population in terms of material deprivation [23]. The results showed that
the low-income population tended to consume more fat spreads and oils, soft drinks, meat
and processed meat, pizza, whole milk and table sugar. On the other hand, the low-income
population tended to consume less fruits and vegetables, less wholemeal bread/cereals and
less fish. As a result, the proportion of adults showing fibre consumption below the minimum
recommended level of 12 g per day was higher than in the general population. In term of
micronutrients, the low-income population showed similar patterns for most of vitamins and
minerals. The main difference resides in average iron intakes, which are much lower among
women in low-income than compared to women of the general population. Regarding causes,
a lack of money was the main reason expressed by the participant for not having enough to
eat (98%), followed distantly by a lack of storage facility (16%) and a lack of transport to the
shop (14%). Similarly, the reason for not having the appropriate kind or quality of food was a
lack of money (79%), followed by a poor availability/quality of food in local shop (38%) and a
difficulty to go to the shops (33%).
The National Diet and Nutrition Survey (NDNS), a UK continuous cross-sectional survey of
the food consumption, nutrient intakes and nutritional status, also undertakes statistical
comparisons for intakes of foods and nutrients in function of equivalised income. The last
report, published in 2014, confirmed a tendency to a poorer diet in low-income population
with significant differences in nutrient intake between the poorest 20% and richest 20% of the
population: the poorest people eat less fish, fruit and vegetables, fibre, protein and saturated
fat than the richest, but more sugar [24]. As in the LIDNS, low-income women appear to have
lower intake of iron than higher-income women.
In other words, being on low income tends to result in energy-dense and nutrient-poor diet
patterns [25]. Consequently, food poverty is a risk factor to non-communicable diseases
(NCDs) such as obesity, coronary heart disease and diabetes, resulting in poorer long-term
health outcomes [3,8,25–27]. For instance, the LIDNS survey showed a significantly higher
prevalence of obesity in women on low income than in the general population with
respectively 31% and 20% of obesity in women between 19 and 64 years old [23]. Poor diet is
also related to an increased falls and fractures in older people, low birth weight and increased
childhood morbidity and mortality, and increased dental caries in children [3].
A study published in 2015 has shown that deprivation is associated with how tall children
grow. The cross-sectional analysis of data on more than one million children measured across
England in 2012/3 showed that by the age of 10 years, the least deprived children were more
14
than a centimetre taller on average than the most deprived children (1.6 cm for boys and 1.2
cm for girls) [28]. Although not demonstrated in the study, it can be expected that such
difference in children height might be associated with the difference in diet described above.
4. Physical access and affordability of food in deprived area
Food poverty is often associated with the term ‘food desert’, which is considered to be an
area with poor access to healthy food. However, considerable scepticism has been expressed
in the academic literature over the existence of these so-called food deserts. The need to
define and map access to healthy food in an urban UK context was first demonstrated in 1999
by Donkin et al. [13,14]. Using Geographical Information System (GIS), they analysed the food
retail environment in an urban deprived area (2 km radius) and concluded that “physical
access does not appear to be a major problem within this area for those who will be able to
walk” [13]. In 2004, a report from the Food Standard Agency stated that food deserts exist only
for “a minority of people who, for a variety of reasons, do not or cannot shop outside their
immediate locality, and for whom, in addition, this locality suffers from poor retail provision of
foods that make up a ‘healthy’ diet” [29]. More recent works conducted by Cummins in
Scottish deprived neighbourhood confirmed that deprivation is not bound to poorer access to
healthy food [30,31].
Although physical access itself does not appear to be a major barrier, the affordability of
healthy food seems to contribute to the food poverty premium in most deprived areas. The
pricing of ‘healthy food baskets’ in the food retail environment of interest is usually used to
measure the affordability of healthy food. The composition of the basket should take into
consideration not only the official government healthy eating recommendations but also the
cultural background of the studied population to make up a healthy diet in ways that are
socially acceptable. Starting from her early works, Elizabeth Dowler has been considering the
ethnical preferences of the local population, as in this article from 2010 in which four different
food lists were compiled to reflect the cultural diversity in the studied neighbourhood of
London: White UK/Irish, Caribbean, African and Gujarati Hindu [14]. In a more recent study
conducted in another deprived area of London, Bowyer et al. designed food baskets taking into
consideration the four key communities of the area: White British, Black Caribbean, Turkish
and Black African [32].
To turn the official recommendations into ‘healthy food baskets’, different approaches
have been developed. For instance, Anderson et al. developed a nutrient-based healthy eating
indicator shopping basket tool using the UK Food Standards Agency definition of healthy food
combined with a population-based survey to identify culturally acceptable food [33]. A scoring
system was implemented to rate the overall balance of nutrients in a food item in order to
exclude ‘non-healthy’ food, i.e. high in saturated fat, salt or sugar. A simpler approach consists
in studying the availability of fresh fruits and vegetables as an indicator of healthy eating and
of takeaway foods as an indicator of unhealthy eating [34].
Most of the studies combined mapping techniques with food basket pricing to measure the
access and affordability of food in deprived area. According to the findings of Bowyer et al.,
fresh fruits and vegetables have a good availability in deprived area, but with prices ranging
from simple to double, while fresh meat, low fat dairy or wholemeal cereal (pasta and rice)
were not available in most of the shops. On the other hand, the mapping highlighted an
15
abundance of fast-food where poor access to fresh food were found [32]. Similar results were
found in Scotland, with a high availability of fresh fruits and vegetable in deprived area, but
often expensive, together with a very high availability of fast food outlets [30,34].
In Lewisham, borough adjoining Greenwich, research was conducted in 2014 to assess
healthy food accessibility through literature review, mapping techniques and healthy food
basket pricing. Data collection was performed in a variety of food retailers in highly deprived
area identified using IMD, IDACI, IDAOPI and LSOA data. The results show that large shops
provide better access to healthy food than small shops and that the healthy food basket was
32% more expensive in small shops. However, it appears that some small shops (affiliated
independents, supermarkets and co-ops) do provide good level of access, particularly with
regards to item availability [35].
In a review published in 2013 by INFORMAS, the International Network for Food and
Obesity [36], the authors claimed that despite all the work publish on this subject it is still not
clear whether ‘healthy’ foods are generally more expensive than ‘less healthy’ foods [25]. They
highlighted the need for robust indicators for monitoring the price and affordability of
‘healthy’ and ‘less healthy’ foods and diets to help inform economic and fiscal policy responses
to improve population diets and reduce NCDs [25]. The need for such indicators was also
highlighted by Jones et al. in a paper published in 2014 in Plos One [37]. Using food price and
nutrition data form publicly available sources, they showed that the price of healthy foods has
gone up more in the last 10 years than unhealthy foods.
Overall, the published literature tends to demonstrate that the access to food in deprived
area is a complex and multi-layered problem influenced by a combination of both structural
and individual influences such as dietary knowledge, cooking skills, shopping skills, budgeting
skills as well as cooking and storage facilities [29,32].
5. Conclusion
Even though there is no doubt that the levels of food poverty have significantly increased
recently in the UK, there is a lot of contradiction in the published literature regarding prices
and access to food, especially in deprived areas. However, it seems reasonable to assert that
without affordable access to healthy food, deprived communities have little chance of
improving their diets. Similarly, fresh fruits and vegetables appear to be good proxy data for
access, price and health related studies.
If no general conclusion can be drawn from this literature study, this is partly due to the
fact that food poverty is highly determined by the local demographics and politics. In this
context, it is essential to locally study the factors that affect food poverty to be able to
effectively tackle food poverty and reduce inequalities.
16
IV. Methodology
1. Healthy Food Basket
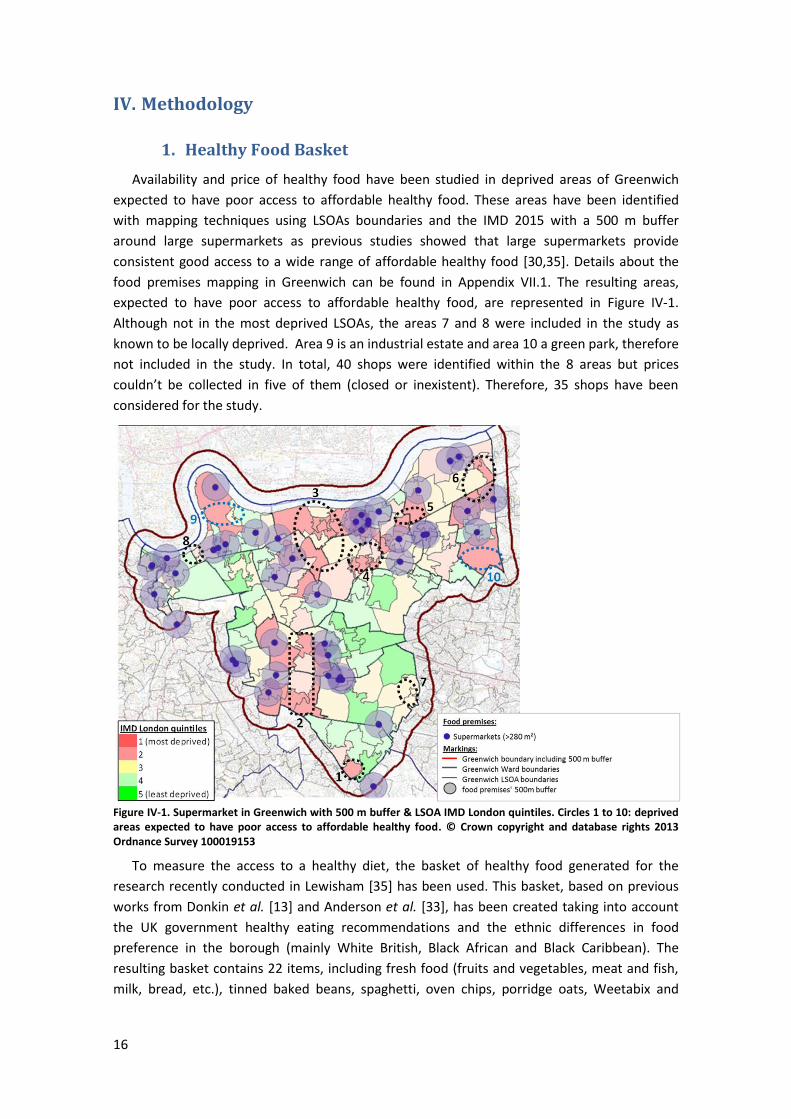
Availability and price of healthy food have been studied in deprived areas of Greenwich
expected to have poor access to affordable healthy food. These areas have been identified
with mapping techniques using LSOAs boundaries and the IMD 2015 with a 500 m buffer
around large supermarkets as previous studies showed that large supermarkets provide
consistent good access to a wide range of affordable healthy food [30,35]. Details about the
food premises mapping in Greenwich can be found in Appendix VII.1. The resulting areas,
expected to have poor access to affordable healthy food, are represented in Figure IV-1.
Although not in the most deprived LSOAs, the areas 7 and 8 were included in the study as
known to be locally deprived. Area 9 is an industrial estate and area 10 a green park, therefore
not included in the study. In total, 40 shops were identified within the 8 areas but prices
couldn’t be collected in five of them (closed or inexistent). Therefore, 35 shops have been
considered for the study.
Figure IV-1. Supermarket in Greenwich with 500 m buffer & LSOA IMD London quintiles. Circles 1 to 10: deprived areas expected to have poor access to affordable healthy food. © Crown copyright and database rights 2013 Ordnance Survey 100019153
To measure the access to a healthy diet, the basket of healthy food generated for the
research recently conducted in Lewisham [35] has been used. This basket, based on previous
works from Donkin et al. [13] and Anderson et al. [33], has been created taking into account
the UK government healthy eating recommendations and the ethnic differences in food
preference in the borough (mainly White British, Black African and Black Caribbean). The
resulting basket contains 22 items, including fresh food (fruits and vegetables, meat and fish,
milk, bread, etc.), tinned baked beans, spaghetti, oven chips, porridge oats, Weetabix and
17
brown rice. The list of items is presented in Appendix VII.2 together with the reference units
and brands used for the pricing.
Prices of the 22 food items have been collected in the 35 shops of the selected areas
between May and June 2016. For comparison, prices have also been collected in two large
supermarkets (Tesco and Lidl). Details about the calculation of comparable prices can be found
in Appendix VII.2.
Prices of a fruit and vegetable basket (apple, onions, tomatoes, lettuce and peppers) have
been generating for all the shops where the five items were available. Yam, grapes and frozen
berries have not been included in the basket due to their low availability.
Prices of the healthy food basket have been generated for 18 shops using 15 food items as
shops and items with low availability have been removed to minimise missing data. The
resulting basket is a vegetarian basket due to the low availability of meat and fish in the
studied shops. Particular attention has been paid in the selection of the 18 shops to avoid bias:
their prices are representative of the 35 shops and the excluded shops were neither especially
cheap nor expensive. With the resulting set of data, only 18 prices of the 270 prices were
missing (6.6% of the prices). Missing data were imputed using the average price of the item
considering all shops (Appendix VII.2, Figure VII-6). If the 35 shops and the 22 food items were
considered, 43% of the prices should have been imputed which was not considered as
acceptable for this study.
2. Survey
Survey Design
A survey aimed at individuals experiencing food poverty has been implemented with the
objective to get qualitative information on how food poverty is experienced in Greenwich, with
a special interest on long-term household food insecurity. To do so, the survey should include
questions on shopping habits, eating habits, kitchen facilities, cooking skills and food security.
These themes were addressed in details during the interviews conducted for the LIDNS, which
has been used as a baseline for the design of the survey [38]. The questions have been
adapted to the Greenwich context and presented as a self-completion questionnaire. The
number of questions were limited so that the survey would not take longer than 15 min to fill
in. The target was to collect about 100 surveys.
A reduced Food Frequency Questionnaire (FFQ) was included in the survey to study the
eating habits of the respondents. The choice of the food items included in the FFQ has been
done according to healthy eating indicators [33]. As a result, the items of the FFQ are all health
discriminators, i.e. sign of healthy or unhealthy choices. Even though the FFQ will not allow for
quantitative analyses of the respondent diet, it will give qualitative information on such diet.
The FFQ should have been validated, for instance by comparison with 24-hour recalls, but this
has not been done due to a lack of means. This has been considered as acceptable for this
study as the purpose of the FFQ was not to calculate nutrient intake but to estimate a food
consumption pattern.
Questions related to healthy eating has also been included in the survey. However, they are
placed after the questions about shopping habits and cooking facilities to avoid biasing
respondent answers. Regarding food security, the questions have been formulated in order to
address the different levels of food poverty with a minimum of questions.
18
Pilot Study
The first version of the survey contained one FFQ of 10 items, 9 questions on shopping
habits, 4 questions on cooking & storage facilities, 1 question on cooking skills, 3 questions on
healthy eating, and 6 questions on food security. A pilot study has been completed on 11
persons (i.e. 10% of the estimated final numbers of surveys). This pilot highlighted a problem
with the questions related to shopping habits. The survey has been modified to address these
issues and piloted again on 5 people, showing that the questions on shopping habits were
much better understood. The pilot study has therefore been useful as it has allowed improving
the survey.
The final version of the survey is presented in Appendix VII.3 . It comprised of one FFQ of 10
items, 7 questions on shopping habits, 4 questions on cooking & storage facilities, 1 question
on cooking skills, 3 questions on healthy eating, and 6 questions on food security. It also
includes a section about personal details. The survey has been called ‘Shopping and eating
habits survey’ and was presented as a research project to study ‘the difficulties people may
experience’ as it was not desired to use the expression ‘food poverty’.
Ethics
No major ethical issues have been foreseen as the surveys were anonymous.
Survey collection
Data were collected between May and June 2016 by two different ways. First, the survey
has been distributed through the Families 1st Service of the borough [39], following advices
from the Advisory Group of the Food Poverty Needs Assessment. It was estimated that about
50 surveys would be collected through this channel. Similarly, the survey has been distributed
in the Middle Park Lunch Club for older residents by a community worker of Public Health RBG.
The second method to collect survey was to go directly to different community centres and
public services in the borough where it was expected to find people experiencing food poverty,
such as the Woolwich Common Community Centre, the Migrant Hub, a Mental Health Centre,
a Breakfast Club for person with addictions and health issues, the Job Centre and one Elderly
Centre (Age UK Charlton).
Inclusion criteria
Eligible participants are individuals experiencing food poverty.
Inclusion Criteria 1:
For the survey distributed through Families 1st, the inclusion criteria was the judgment of
the key workers, i.e. if they estimated that their clients were experiencing food poverty
according to the definition previously described (an explanatory note for the key workers was
joined to the surveys).
Similar criteria were followed for the surveys collected by a community worker at the
Middle Park Lunch Club.
Inclusion Criteria 2:
For the surveys collected by the author across different services in the borough, the FIES
scale was used as inclusion criteria [18]. The first question of the FIES (Box III-1, p. 12) was used
as a screening question: respondents answering negatively were not considered whereas
respondents saying that they did worry about food running out because of money in the last
12 months were considered as eligible for the survey.
19
Exclusion criteria
Exclusion Criteria 1:
If more than 25% of the questions were not answered (≥ 6 questions on the 22 questions -
the personal details section were not considered), the survey was discarded.
Exclusion Criteria 2:
If the survey answers did not show that the respondent was experiencing any level of food
poverty, the survey was discarded. A respondent was considered not being in food poverty if
he/she was meeting all the following criteria:
Able to cook and adequate cooking facilities (question 8 to 12)
Enough food of the kind he/she wants (answer 1 at question 17)
Don’t miss main meal because of a lack of money (answer “no” at question 19)
Never use a food bank (answer “never” at question 22)
Data Collection & Analyse
After taking into consideration several methods (Excel only, Google Form + Excel, Survey
Monkey only, Excel + Survey Monkey), it was decided that the data will be collected using
Survey Monkey and analysed with Excel. Indeed, due to the number of questions with a large
choice of multi-answers, collecting data with Excel would have been quite laborious and,
above all, propitious to mistakes. Survey Monkey allows for a quick, easy and error-less
collection of data. Data are then easily exported to Excel format.
Number of surveys analysed
- Families 1st (inclusion criteria 1): 13 surveys received; 6 discarded for meeting exclusion
criteria 2.
- Middle Park Lunch Club (inclusion criteria 1): 16 surveys received; 2 discarded for meeting
exclusion criteria 1 and 13 discarded for not meeting criteria 2.
- Surveys collected by the authors across different centres in Greenwich (inclusion criteria 2):
18 surveys collected; 2 discarded for not meeting criteria 2.
Therefore, on a total of 47 surveys received, only 24 were eligible for analyse.
Survey limitations
Distributing the survey through public services (key workers and community workers) was
not as effective as expected as on the 29 surveys received, more than 70% had been discarded
for meeting one of the two exclusion criteria.
The inclusion criteria 2, based on the FIES scale, appear to be more effective as only 11% of
the surveys based on inclusion criteria 1 were discarded. However this method is more time-
consuming as it requires a trained interviewer to conduct the survey.
As a result, on the 100 expected surveys, only 24 were actually included for analyses.
Although this is not enough to obtain statistically significant results or to perform cross-
analyses of data, the results give a general picture of how food poverty is experienced across
the borough.
20
3. Qualitative interview studies
1-1 interviews with key workers
Interviews with key workers were conducted to gain insights from their work with clients
experiencing food poverty. The script used for the key worker interviews has been adapted
from the one used in the study conducted by NHS Scotland [20] and asked participants about:
Their perceptions and views of food poverty within the Greenwich context.
The extent to which they believe their client group experience food poverty.
Their views about the causes of food poverty.
The impact of food poverty on their client group.
Their organisation’s role in addressing food poverty.
Their ideas for local-level solutions.
Organisations and services supporting vulnerable groups in the borough were targeted, in
particular those working with families/mothers with young children, young adults, elderly
adults, people with mental health problems, destitute/homeless, refugees/asylum seekers and
those with underlying health problems [20]. A total of 46 organisations and services were
shortlisted and key contacts within them identified. Requests to conduct interviews were
emailed, with an outline of the nature of the needs assessment. From this initial list of 46, it
has been possible to conduct 26 interviews between February and June 2016.
All interviews were recorded, with participants’ permission, and then coded into an Excel
spreadsheet according to the themes and sub-themes identified during the interviews. Seven
of the interviews were fully transcribed and then coded. Due to time limitations, the 19
remaining interviews were coded straight from the recording.
Lived experience interviews
Interviews with person experiencing food poverty have been conducted to complete the
finding of the surveys with personal lived experiences. The objective was to get detailed
information about the dietary habits and the coping strategies of people in situation of food
poverty and of their children.
A script has been specifically developed for theses interviews. It is a detailed version of the
survey, completed with relevant questions from the LIDNS [38] about eating habits, coping
strategies, food security, and finances. At the difference of the survey, open questions were
asked and distinction was done between adults’ and children’s experiences. The script has
been successfully piloted with a community worker of RBG and no major modification has
been done to the script.
The persons interviewed were first contacted by key workers to explain the research and
ensure they agree to participate. Indeed, due to their difficult personal situation, it was not
straightforward to find individuals prepared to get involved. As a result, only five interviews
have been conducted between May and June 2016: two with users of a Breakfast Club for
people with addictions and long-term illness, two with young mothers on low income and one
with a user of the Migrant Hub. A £20 Tesco voucher was given to the participant for their
implication in the research.
All interviews were recorded, with participants’ permission. The five interviews were fully
transcribed and then coded into an Excel spreadsheet according to the themes and sub-
themes identified during the interviews.
21
V. Results & Discussion
The findings of the healthy food basket pricing, of the key workers interviews, and of the
surveys are presented followed by a discussion. The results of the lived experience interviews
are presented in Appendix VII.5. Quotes from these interviews have been included along the
result section (in grey, italic, right aligned) to illustrate the different themes addressed during
the study.
1. Price & access to healthy food in deprived areas of Greenwich
“Coop is closest but more expensive. [...] Sometimes we can’t even afford to buy it, so we’ll buy like pasta and cheese, like maybe make cheese pasta that’s cheap and easy to make.”
The results on availability are presented in Appendix VII.2. The semi-skimmed milk was the
item with the highest availability (30/35 shops) followed by baked beans and onions (29/35)
while frozen berries and salmon were the items with the lowest availability (3/35). In
agreement with previous research [32], meat appeared to have a low availability with the
chicken breast present in only 11 shops and the lean minced beef in 12 shops (Figure VII-4).
The shops showed a mean of 12.7 items available on a total of 22 items. One shop had 21 of
the 22 items and two others had 20 items available (Figure VII-5). In general, it appears that
these deprived areas have an acceptable access to healthy food.
As expected, a huge variation in prices has been observed, in particular for porridge oats
(from £1.19 to £8.92 per kilo), olive oil (from £0.62 to £5.98 per 500 ml), grapes (from £1.2 to
£7.95 per kilo) and brown rice (from £1.11 to £5.78 per kilo) (Figure VII-6). This is partly due to
the variation in pricing: olive oil was sold from bottle of 250 ml to 4L while brown rice was sold
per bag of 500 g to 4 kg. Nevertheless, it is a reality for the people living in these deprived
areas with poor access to healthy food and this contributes to the food poverty premium.
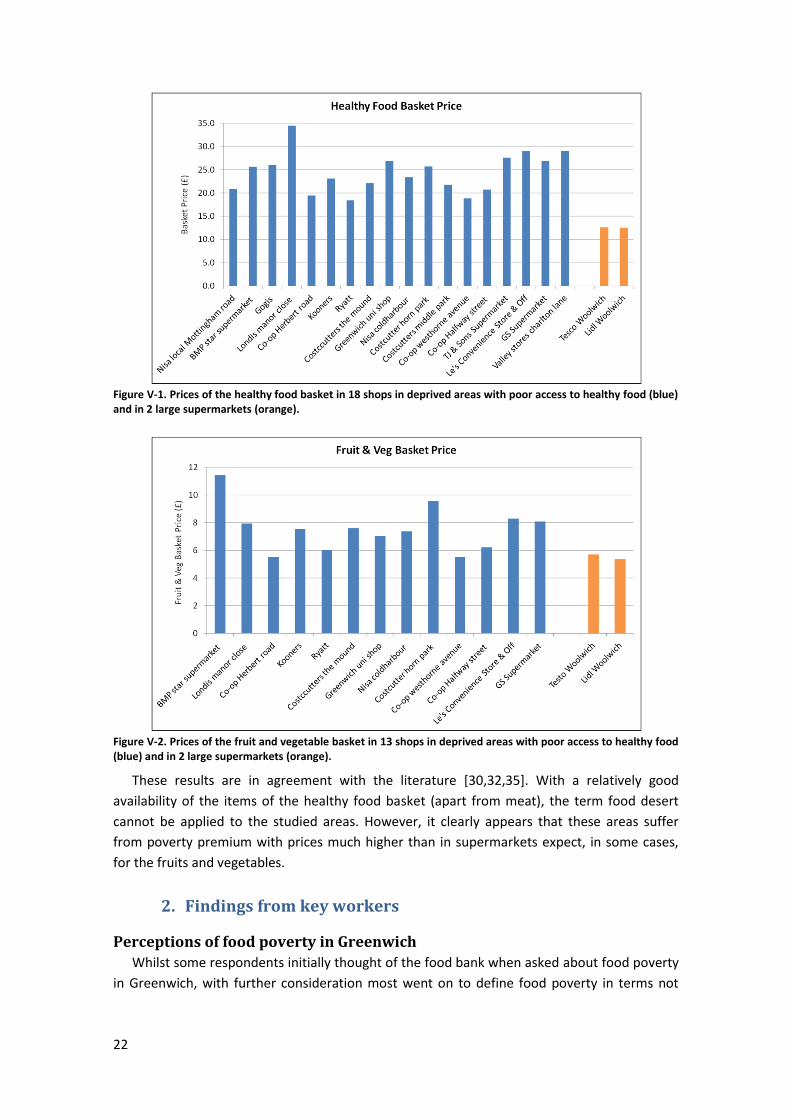
The prices of the healthy food basket (15 items) are presented Figure V-1 for the 18
selected shops: for the same basket, prices range from £18.4 to £34.5, with an average of
£24.4. The same basket costs £12.6 and £12.5 in the two supermarkets, respectively, Tesco
and Lidl. This means that in the studied deprived areas, the average price of the healthy basket
is the double than in the supermarket and can even goes up to the triple for the most
expensive shops. This confirms the assumption that these areas have a poor access to
affordable healthy food.
Similarly, the prices of the fruit and vegetable basket are presented Figure V-2. The
cheapest costs £5.51 and the more expensive £11.42 for an average price of £7.55. The same
basket costs £5.69 in Tesco and £5.37 in Lidl. Therefore, unlike for the general basket, some of
the local shops in deprived area offer affordable fruits and vegetables, as described in the
literature [30]. However, others are still really expensive as the same basket can cost the
double depending on the shops.
It can be noted that the cheapest shop for the healthy food basket (less than £20 at Ryatt,
Co-op Westhorne Avenue and Co-op Herbert Road) are also the cheapest ones for the fruit
and vegetable fruits. On the contrary, the shop where the healthy food basket was most
expensive (Londis Manor Close) is not the most expensive for fruits and vegetables. Similarly,
the shop where the fruit and vegetable basket was the most expensive (BMP Star
Supermarket) was not in the most expensive for the general healthy food basket.
22
Figure V-1. Prices of the healthy food basket in 18 shops in deprived areas with poor access to healthy food (blue) and in 2 large supermarkets (orange).
Figure V-2. Prices of the fruit and vegetable basket in 13 shops in deprived areas with poor access to healthy food (blue) and in 2 large supermarkets (orange).
These results are in agreement with the literature [30,32,35]. With a relatively good
availability of the items of the healthy food basket (apart from meat), the term food desert
cannot be applied to the studied areas. However, it clearly appears that these areas suffer
from poverty premium with prices much higher than in supermarkets expect, in some cases,
for the fruits and vegetables.
2. Findings from key workers
Perceptions of food poverty in Greenwich
Whilst some respondents initially thought of the food bank when asked about food poverty
in Greenwich, with further consideration most went on to define food poverty in terms not
23
just of insufficient food but also as insufficient healthy food. All respondents believed they had
clients experiencing food poverty. And almost all felt that levels have increased.
Respondents talked about a wide range of factors they have observed to cause food
poverty among their clients. Poor access (financial, physical or social and cultural reasons) was
recognised by many as an important component of food poverty. Some typical responses
were:
“I’m thinking of YMCA (cookery club), most of those people, maybe 80%, were either on
benefits or low wages, with children and struggling to feed the family healthily or in a
balanced way for one reason or another.”
“Lack of money, lack of skills, not understanding the choices that are available.”
Financial reasons for food poverty
“Lack of money, more like times when all bills come out or you’re a bit behind in something so you’ve got to top it up (rent arrears) or when the bank stupidly takes your money. I’m not working and he’s signed off sick (ESA) and we’re a bit behind on rent and council tax and that so we have to pay a bit extra to top that up. Then there’s the gas and electric and then travel. When we had the car it was always a tight budget.”
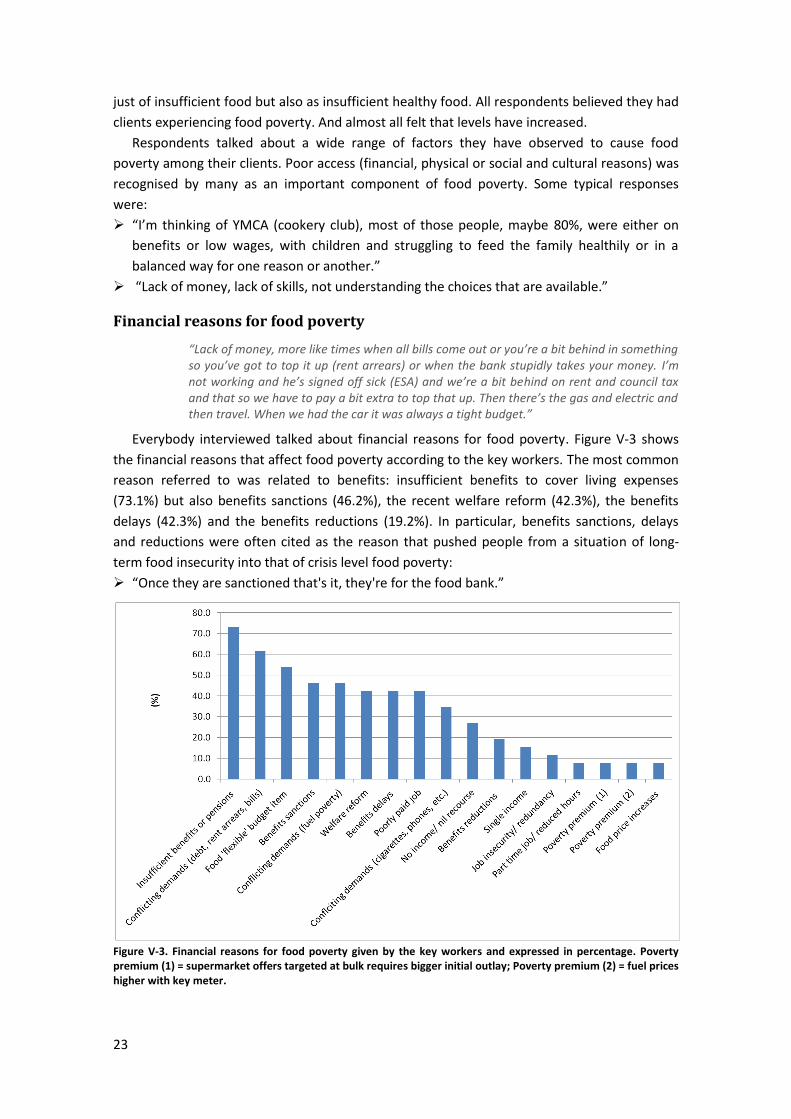
Everybody interviewed talked about financial reasons for food poverty. Figure V-3 shows
the financial reasons that affect food poverty according to the key workers. The most common
reason referred to was related to benefits: insufficient benefits to cover living expenses
(73.1%) but also benefits sanctions (46.2%), the recent welfare reform (42.3%), the benefits
delays (42.3%) and the benefits reductions (19.2%). In particular, benefits sanctions, delays
and reductions were often cited as the reason that pushed people from a situation of long-
term food insecurity into that of crisis level food poverty:
“Once they are sanctioned that's it, they're for the food bank.”
Figure V-3. Financial reasons for food poverty given by the key workers and expressed in percentage. Poverty premium (1) = supermarket offers targeted at bulk requires bigger initial outlay; Poverty premium (2) = fuel prices higher with key meter.
24
Some respondents considered people in low-waged employment to be more financially
insecure due to poorly paid job (42.3%), to job insecurity/redundancy (11.5%) and to part-time
job (7.7%):
“...these are people who are really struggling, more than those on benefits. Living cost have
increased so much, rent and travel. Rents have gone mad. They cannot afford good quality
food.”
“I have a new client, a young mother of 3 children, a baby under 9 months I think, and she's
had to go back to work, not because she wants to but because she has to. She's the only
income earner in the household, her partner’s been made redundant... her job is zero hours
contract and is also very low paid as well. She goes to work and works long hours and works
extra shifts to bring in more money. But the more hours you work the more you earn and
the more tax you pay.”
Most respondents talked about clients on low incomes having to manage conflicting
demands on the limited money they had available. The main conflicting demands on income
reported were debt, e.g. bills/rent/rent arrears (61.5%), fuel (46.2%) and items such as
cigarettes/mobile phones (34.6%). As expenses such as rent and bills have to be prioritised to
avoid debt, many respondents observed that food is the most flexible budget item and can
become severely restricted (53.8%).
“When your rent is half or maybe nearly 3/4 of your monthly income it's startling.”
“In our last session... there was a lady nearly crying telling me she has £10 to last for the
rest of the week and she didn’t know whether to buy some food for her children or to put
some electricity on the meter to get hot water and a bit of heating because it’s was still a
bit cold then.”
Finally, the recent food price increase that has been highlighted in the literature review has
been surprisingly mentioned by few respondents in Greenwich (7.7%):
“Food prices have increased... although it may be only £2-3, for some parents that's the
difference between a decent meal and something quick and not as healthy.”
Lack of knowledge and skills
“Balanced diet, that includes everything really. Cos if you’re just eating vegetables and all that, that’s not really very healthy. You need the bad stuff and the good stuff to have a good diet.”
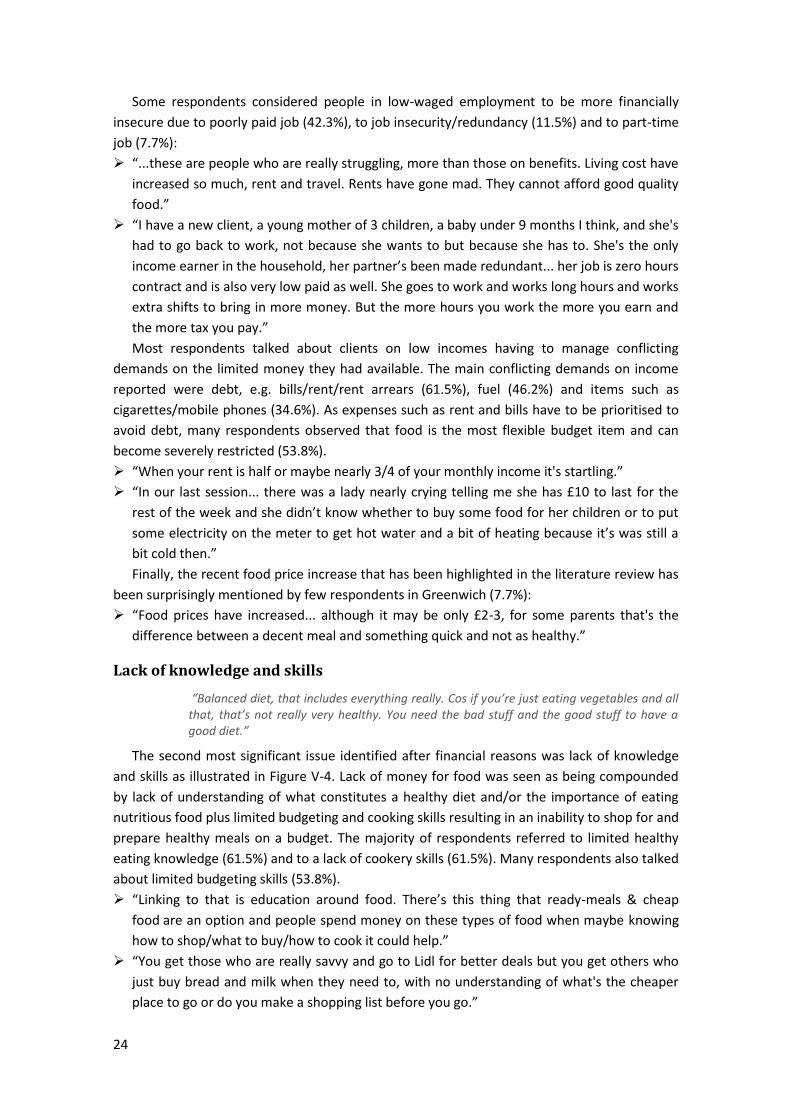
The second most significant issue identified after financial reasons was lack of knowledge
and skills as illustrated in Figure V-4. Lack of money for food was seen as being compounded
by lack of understanding of what constitutes a healthy diet and/or the importance of eating
nutritious food plus limited budgeting and cooking skills resulting in an inability to shop for and
prepare healthy meals on a budget. The majority of respondents referred to limited healthy
eating knowledge (61.5%) and to a lack of cookery skills (61.5%). Many respondents also talked
about limited budgeting skills (53.8%).
“Linking to that is education around food. There’s this thing that ready-meals & cheap
food are an option and people spend money on these types of food when maybe knowing
how to shop/what to buy/how to cook it could help.”
“You get those who are really savvy and go to Lidl for better deals but you get others who
just buy bread and milk when they need to, with no understanding of what's the cheaper
place to go or do you make a shopping list before you go.”
25
Figure V-4. Percentage of key workers associating lacks of skills and knowledge with food poverty.
The perception that healthy food is more expensive has been expressed by 42.3% of the
respondents:
“There’s been loads of occasions I’ve tipped a bag of ingredients out (at a cookery club) and
more than one person has gone, ‘Oh, I couldn’t afford that.’ And sometime that could be a
bag of wholemeal pasta... numerous occasions people have said they couldn’t afford what
we’re cooking and been surprised when I’ve said how much it cost, pleasantly surprised.”
Poor physical access to affordable healthy food
“The ideas are not the problem it’s not having the ingredients. There’s so many things we’d like to eat. [...] So stuff like meals we do enjoy, they are healthy and we enjoy them but it’s just too expensive to buy. That is the struggle.”
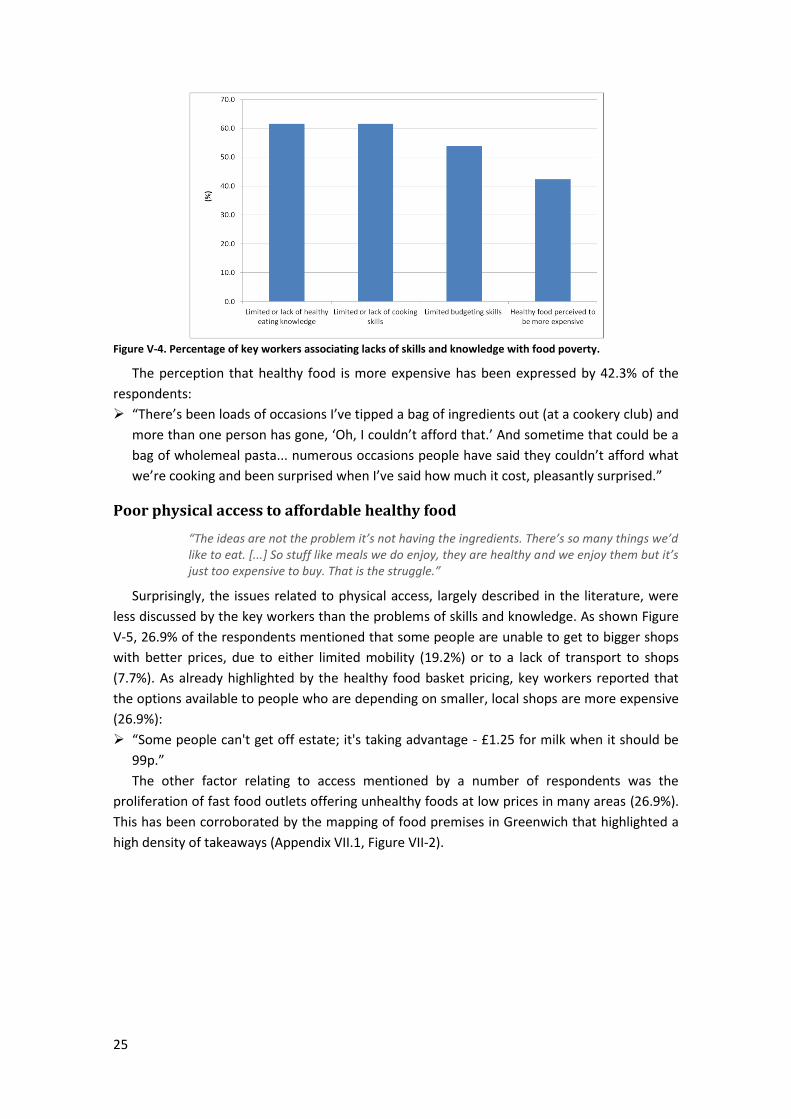
Surprisingly, the issues related to physical access, largely described in the literature, were
less discussed by the key workers than the problems of skills and knowledge. As shown Figure
V-5, 26.9% of the respondents mentioned that some people are unable to get to bigger shops
with better prices, due to either limited mobility (19.2%) or to a lack of transport to shops
(7.7%). As already highlighted by the healthy food basket pricing, key workers reported that
the options available to people who are depending on smaller, local shops are more expensive
(26.9%):
“Some people can't get off estate; it's taking advantage - £1.25 for milk when it should be
99p.”
The other factor relating to access mentioned by a number of respondents was the
proliferation of fast food outlets offering unhealthy foods at low prices in many areas (26.9%).
This has been corroborated by the mapping of food premises in Greenwich that highlighted a
high density of takeaways (Appendix VII.1, Figure VII-2).
26
Figure V-5. Percentage of key workers associating physical access with food poverty.
Dependence on cheap, poor quality food
“It’s hard but normally we’ll go for the cheap prices. We’ll get the cheapest meat, we’ll get the cheapest sauces or cheapest pasta. But that’s fine.”
Food poverty was often associated to a dependence on bargains and special offers which
usually are cheap food with poor nutritional quality (42.3%):
“Things on offer at bargain prices, more likely to be things high in fat/sugar/salt. They’re
less likely to go for fruit and veg, they’re more likely to get frozen pre-prepared food than
get fresh ingredients and make from scratch.”
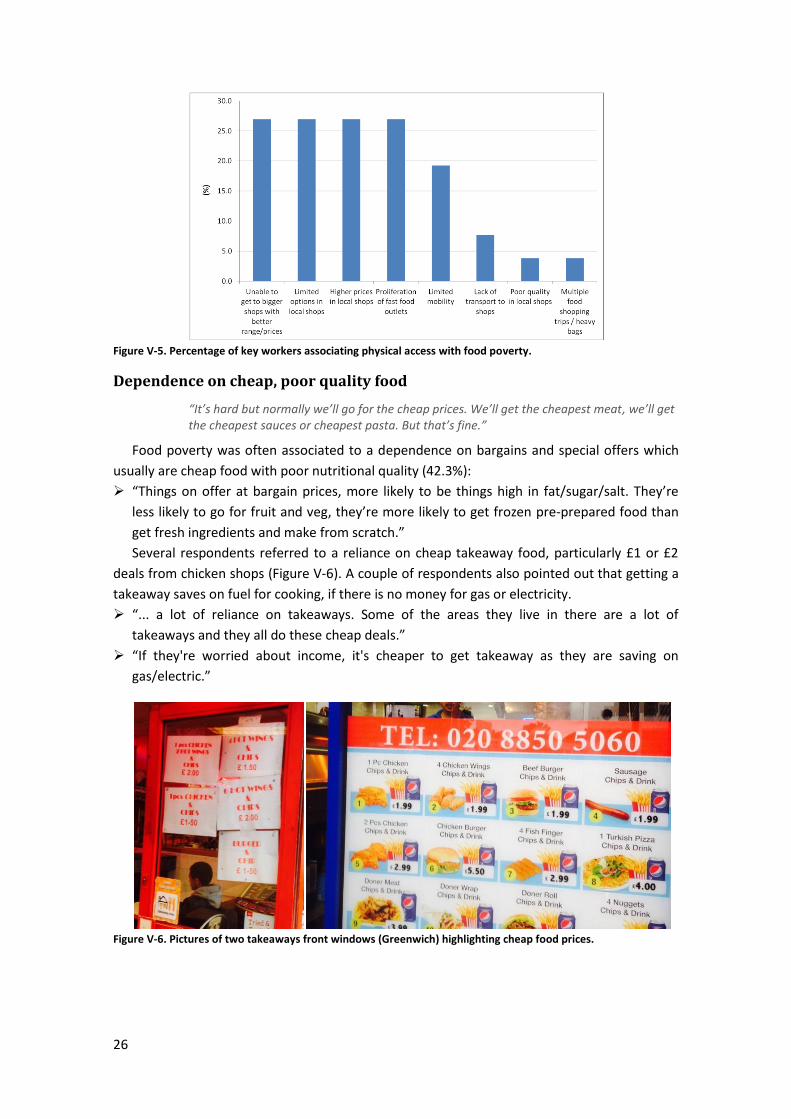
Several respondents referred to a reliance on cheap takeaway food, particularly £1 or £2
deals from chicken shops (Figure V-6). A couple of respondents also pointed out that getting a
takeaway saves on fuel for cooking, if there is no money for gas or electricity.
“... a lot of reliance on takeaways. Some of the areas they live in there are a lot of
takeaways and they all do these cheap deals.”
“If they're worried about income, it's cheaper to get takeaway as they are saving on
gas/electric.”
Figure V-6. Pictures of two takeaways front windows (Greenwich) highlighting cheap food prices.
27
Behaviours and choices
“Sometimes I don’t mind doing it [cooking] but sometimes if I’m tired, had a long day, I can’t be bothered. Sometimes I’d have beans on toast. Sometimes if we’ve got some spare change we’ll pop to the chip shop and get some chips.”
Respondents reported an increasing dependence on convenience foods – the so-called junk
food culture. Many respondents referred to people having high intake of
processed/convenience/takeaway foods (65.4%):
“They want it as quick and simple as possible. Can't be bothered... readymeals, takeaways
are cheap and filling.”
At times it was difficult to determine to what extent reliance on low-cost, convenience
foods is a coping strategy for those in food poverty or increasingly just a normal response to
the junk-food culture we live in. In some cases, particularly in relation to one service
supporting young people, it was felt that for many clients choosing takeaways is a matter of
preference and therefore there was uncertainty about whether this constituted food poverty.
Also relevant to this issue is the problem of generational behavior due to poor parenting
skills (15.4%) and the change in food culture (11.5%):
“Lack of role modelling – if parents haven’t been shown different ways of doing things they
won’t do it with their own children.”
“... changing perceptions - growing up with convenience foods.”
“We tried to have a conversation about what a balanced meal looks like, some of them are
just not interested. Like salad, we offer it with the jacket potatoes but so many times we've
had to check it away, now we ask them, ‘do you want it?’ It's a really nice salad with
dressing, avocado. They just won't touch it, not something their taste buds are used to.”
Vulnerable groups
“At the moment I cook very rarely because I’m more tired than anything because I’m not well. Mainly I’m putting meals together from packets etc. rather than cooking from scratch, just basic really.”
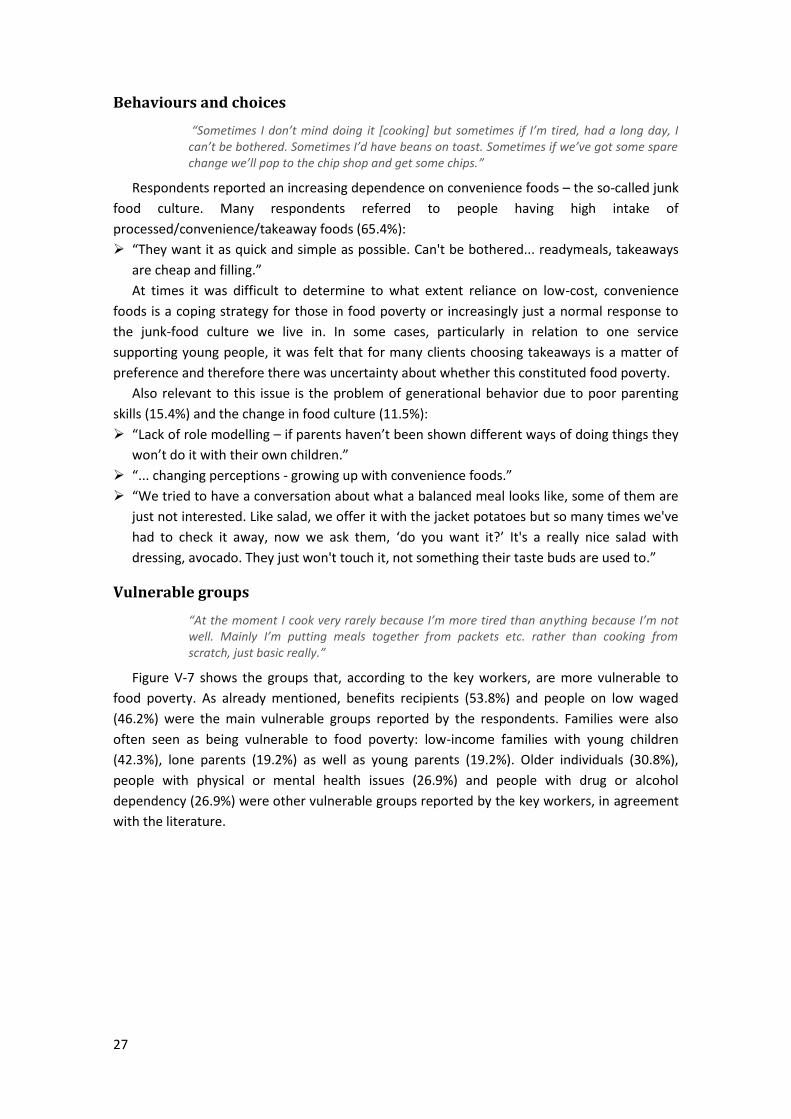
Figure V-7 shows the groups that, according to the key workers, are more vulnerable to
food poverty. As already mentioned, benefits recipients (53.8%) and people on low waged
(46.2%) were the main vulnerable groups reported by the respondents. Families were also
often seen as being vulnerable to food poverty: low-income families with young children
(42.3%), lone parents (19.2%) as well as young parents (19.2%). Older individuals (30.8%),
people with physical or mental health issues (26.9%) and people with drug or alcohol
dependency (26.9%) were other vulnerable groups reported by the key workers, in agreement
with the literature.
28
Figure V-7. Vulnerable groups for food poverty as expressed by the key workers, in percentage.
Other social issues
“I can’t have raw veg in my place because it gets terribly warm and they get shrivelled. I’ve got potatoes indoors but they’re all sprouting.”
A number of other issues were reported to be affecting levels of food poverty such as
housing insecurity (34.6%), poor network support and social isolation (30.8%) as well as limited
cooking equipment or/and food storage (26.9%).
“Multiple-occupancy housing is a major issue e.g. 8 families in one house...cooking and
keeping food safe from others is a problem. Instant noodles can be prepared in room.”
“People are quite isolated, living away from family or displaced, away from the area they
know. If I was in need I've got people around me I know can help.”
Help & Support
“Now that I just discovered this place [Migrant Hub], like today, I told my kids we are coming here to have our food, so we walked down here. Last week, the social worker gives us food bank.”
When asking to the key workers what kind of help their client seek when they are in
situation of food poverty, food bank was the most reported (70.8%), followed by community
services such as cookery clubs and shopping clubs (30.8%), community fruits and vegetables
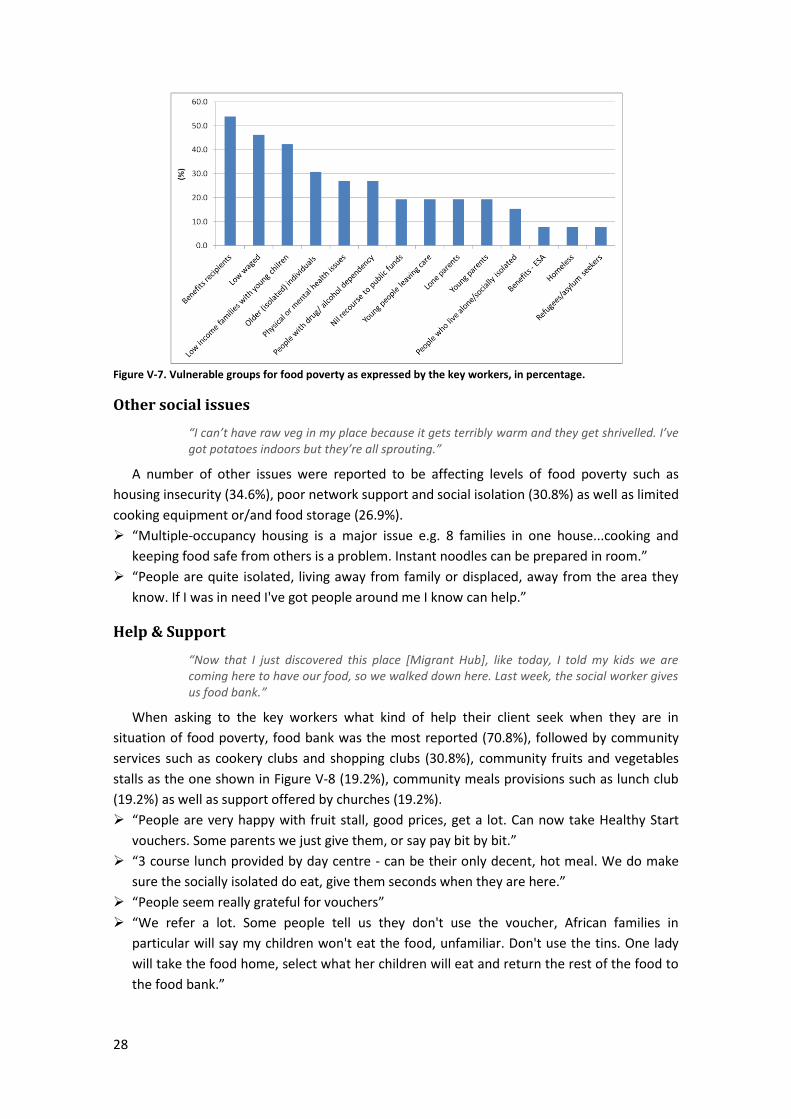
stalls as the one shown in Figure V-8 (19.2%), community meals provisions such as lunch club
(19.2%) as well as support offered by churches (19.2%).
“People are very happy with fruit stall, good prices, get a lot. Can now take Healthy Start
vouchers. Some parents we just give them, or say pay bit by bit.”
“3 course lunch provided by day centre - can be their only decent, hot meal. We do make
sure the socially isolated do eat, give them seconds when they are here.”
“People seem really grateful for vouchers”
“We refer a lot. Some people tell us they don't use the voucher, African families in
particular will say my children won't eat the food, unfamiliar. Don't use the tins. One lady
will take the food home, select what her children will eat and return the rest of the food to
the food bank.”
29
Figure V-8. Picture of a fruit & veg stall in the Woolwich Common Community Centre, a deprived area of Greenwich with poor access to affordable healthy food.
Help from the public services, such as the Emergency Support Scheme (19.2%), Healthy
Start Vouchers [16] (15.4%), Welfare rights (11.5%), Money advices (11.5%), and Social services
(7.7%) were also reported by the key workers as valuable helps for vulnerable groups.
“The biggest way is checking their tariffs [gas and electricity], what they’re currently paying
and see what they can save. Even if it’s come up with £200. [...] People have anecdotally
said ‘that could be 6 weeks food’.”
Long-term solution
“If you wanted to get junk food then there’s shops everywhere for that. So it’s like, in my eyes they’re promoting too much junk food to the healthy food. Because you step out there, there’s takeaways left-right-and-centre and there are tiny little shops that sell everything but normal food. It’s hard to say no when you’ve got the money and you don’t know what else to buy.”
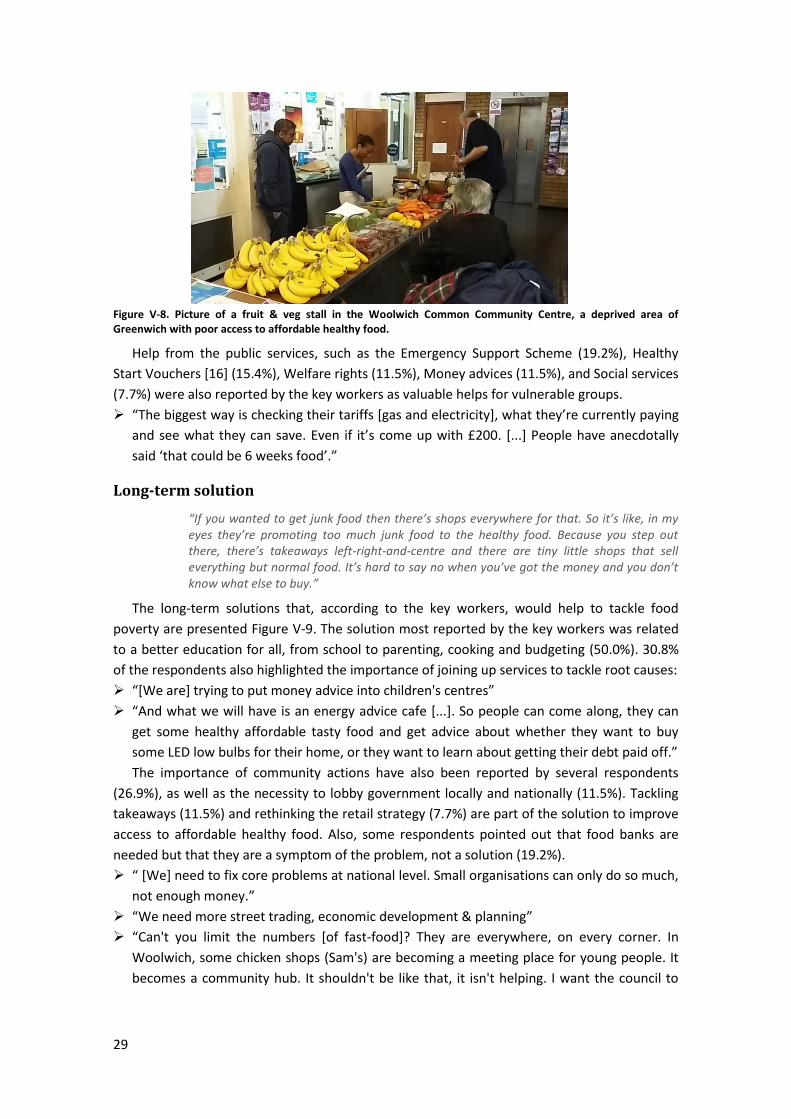
The long-term solutions that, according to the key workers, would help to tackle food
poverty are presented Figure V-9. The solution most reported by the key workers was related
to a better education for all, from school to parenting, cooking and budgeting (50.0%). 30.8%
of the respondents also highlighted the importance of joining up services to tackle root causes:
“[We are] trying to put money advice into children's centres”
“And what we will have is an energy advice cafe [...]. So people can come along, they can
get some healthy affordable tasty food and get advice about whether they want to buy
some LED low bulbs for their home, or they want to learn about getting their debt paid off.”
The importance of community actions have also been reported by several respondents
(26.9%), as well as the necessity to lobby government locally and nationally (11.5%). Tackling
takeaways (11.5%) and rethinking the retail strategy (7.7%) are part of the solution to improve
access to affordable healthy food. Also, some respondents pointed out that food banks are
needed but that they are a symptom of the problem, not a solution (19.2%).
“ [We] need to fix core problems at national level. Small organisations can only do so much,
not enough money.”
“We need more street trading, economic development & planning”
“Can't you limit the numbers [of fast-food]? They are everywhere, on every corner. In
Woolwich, some chicken shops (Sam's) are becoming a meeting place for young people. It
becomes a community hub. It shouldn't be like that, it isn't helping. I want the council to
30
give some thought to the businesses that are opening up on local high streets. Healthier
Catering Commitment - prepare it in a healthy way and sell in a positive way.”
Figure V-9. Long-term solutions to food poverty as expressed by the key workers, in percentage.
3. Findings from individuals experiencing food poverty
The detailed results of the survey are presented in Appendix VII.4. In the following, the
main findings of the survey are discussed together with findings from the lived experience
interviews (Appendix VII.5).
Eating Habits
“Sausage & mash, we’d have that and if I’d got the veg we’d have veg with it. Chicken stir-fry; chicken and rice; roast dinner. Majority of time there hasn’t been veg to put veg in there. That’s like our meals really, that’s it.”
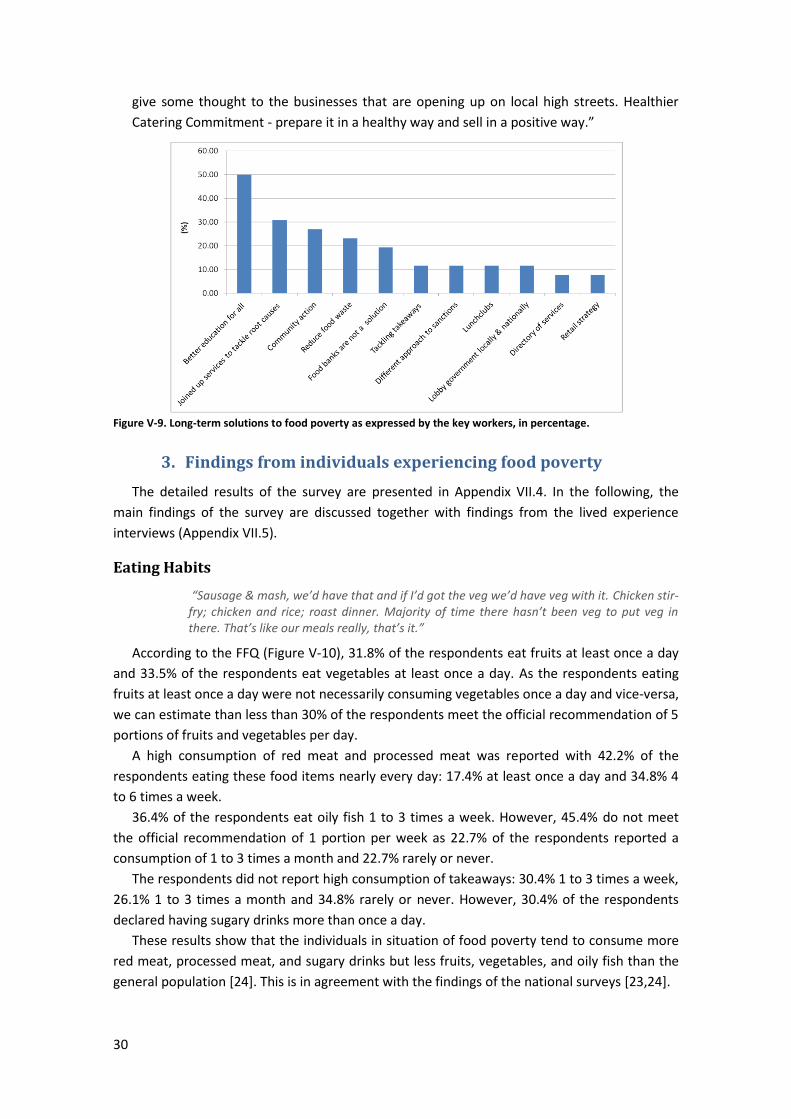
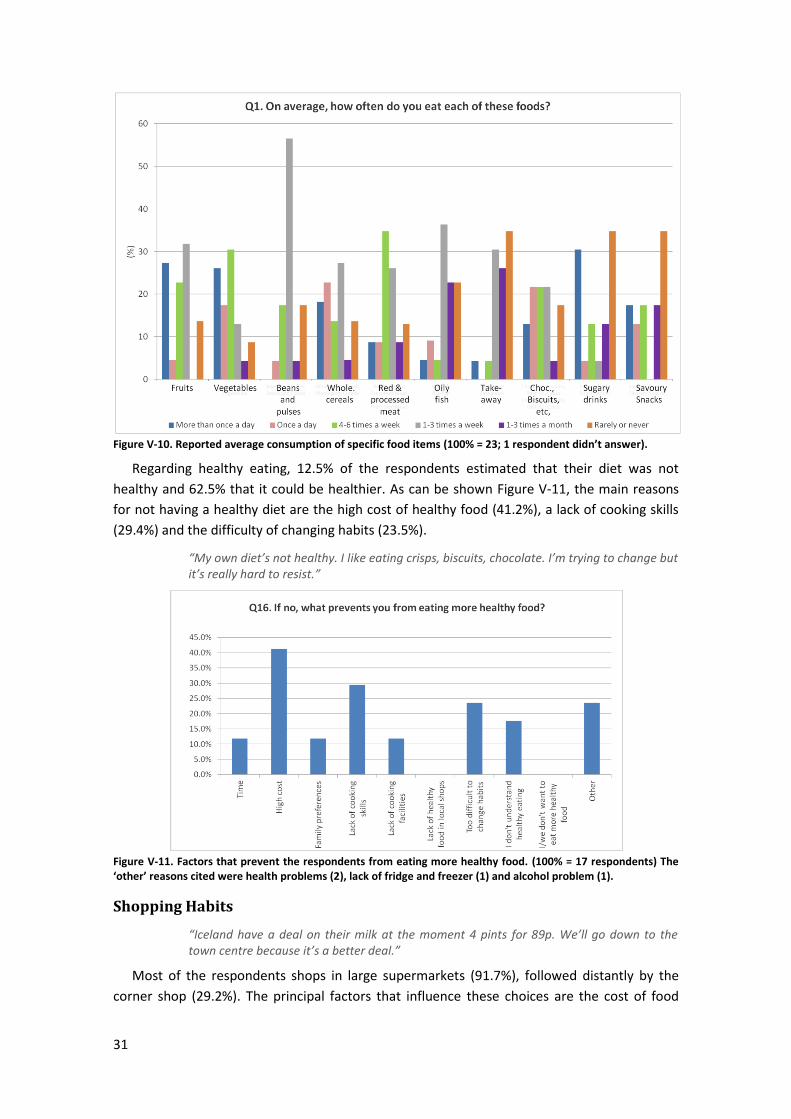
According to the FFQ (Figure V-10), 31.8% of the respondents eat fruits at least once a day
and 33.5% of the respondents eat vegetables at least once a day. As the respondents eating
fruits at least once a day were not necessarily consuming vegetables once a day and vice-versa,
we can estimate than less than 30% of the respondents meet the official recommendation of 5
portions of fruits and vegetables per day.
A high consumption of red meat and processed meat was reported with 42.2% of the
respondents eating these food items nearly every day: 17.4% at least once a day and 34.8% 4
to 6 times a week.
36.4% of the respondents eat oily fish 1 to 3 times a week. However, 45.4% do not meet
the official recommendation of 1 portion per week as 22.7% of the respondents reported a
consumption of 1 to 3 times a month and 22.7% rarely or never.
The respondents did not report high consumption of takeaways: 30.4% 1 to 3 times a week,
26.1% 1 to 3 times a month and 34.8% rarely or never. However, 30.4% of the respondents
declared having sugary drinks more than once a day.
These results show that the individuals in situation of food poverty tend to consume more
red meat, processed meat, and sugary drinks but less fruits, vegetables, and oily fish than the
general population [24]. This is in agreement with the findings of the national surveys [23,24].
31
Figure V-10. Reported average consumption of specific food items (100% = 23; 1 respondent didn’t answer).
Regarding healthy eating, 12.5% of the respondents estimated that their diet was not
healthy and 62.5% that it could be healthier. As can be shown Figure V-11, the main reasons
for not having a healthy diet are the high cost of healthy food (41.2%), a lack of cooking skills
(29.4%) and the difficulty of changing habits (23.5%).
“My own diet’s not healthy. I like eating crisps, biscuits, chocolate. I’m trying to change but it’s really hard to resist.”
Figure V-11. Factors that prevent the respondents from eating more healthy food. (100% = 17 respondents) The ‘other’ reasons cited were health problems (2), lack of fridge and freezer (1) and alcohol problem (1).
Shopping Habits
“Iceland have a deal on their milk at the moment 4 pints for 89p. We’ll go down to the town centre because it’s a better deal.”
Most of the respondents shops in large supermarkets (91.7%), followed distantly by the
corner shop (29.2%). The principal factors that influence these choices are the cost of food
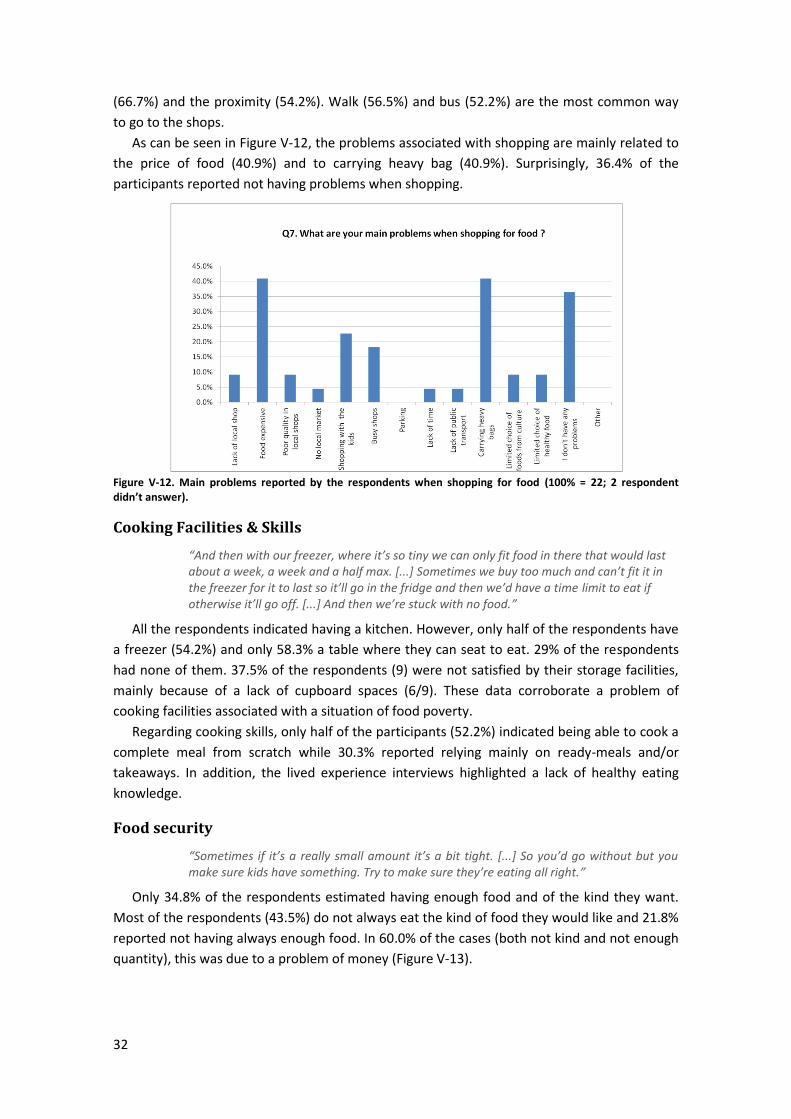
32
(66.7%) and the proximity (54.2%). Walk (56.5%) and bus (52.2%) are the most common way
to go to the shops.
As can be seen in Figure V-12, the problems associated with shopping are mainly related to
the price of food (40.9%) and to carrying heavy bag (40.9%). Surprisingly, 36.4% of the
participants reported not having problems when shopping.
Figure V-12. Main problems reported by the respondents when shopping for food (100% = 22; 2 respondent didn’t answer).
Cooking Facilities & Skills
“And then with our freezer, where it’s so tiny we can only fit food in there that would last about a week, a week and a half max. [...] Sometimes we buy too much and can’t fit it in the freezer for it to last so it’ll go in the fridge and then we’d have a time limit to eat if otherwise it’ll go off. [...] And then we’re stuck with no food.”
All the respondents indicated having a kitchen. However, only half of the respondents have
a freezer (54.2%) and only 58.3% a table where they can seat to eat. 29% of the respondents
had none of them. 37.5% of the respondents (9) were not satisfied by their storage facilities,
mainly because of a lack of cupboard spaces (6/9). These data corroborate a problem of
cooking facilities associated with a situation of food poverty.
Regarding cooking skills, only half of the participants (52.2%) indicated being able to cook a
complete meal from scratch while 30.3% reported relying mainly on ready-meals and/or
takeaways. In addition, the lived experience interviews highlighted a lack of healthy eating
knowledge.
Food security
“Sometimes if it’s a really small amount it’s a bit tight. [...] So you’d go without but you make sure kids have something. Try to make sure they’re eating all right.”
Only 34.8% of the respondents estimated having enough food and of the kind they want.
Most of the respondents (43.5%) do not always eat the kind of food they would like and 21.8%
reported not having always enough food. In 60.0% of the cases (both not kind and not enough
quantity), this was due to a problem of money (Figure V-13).
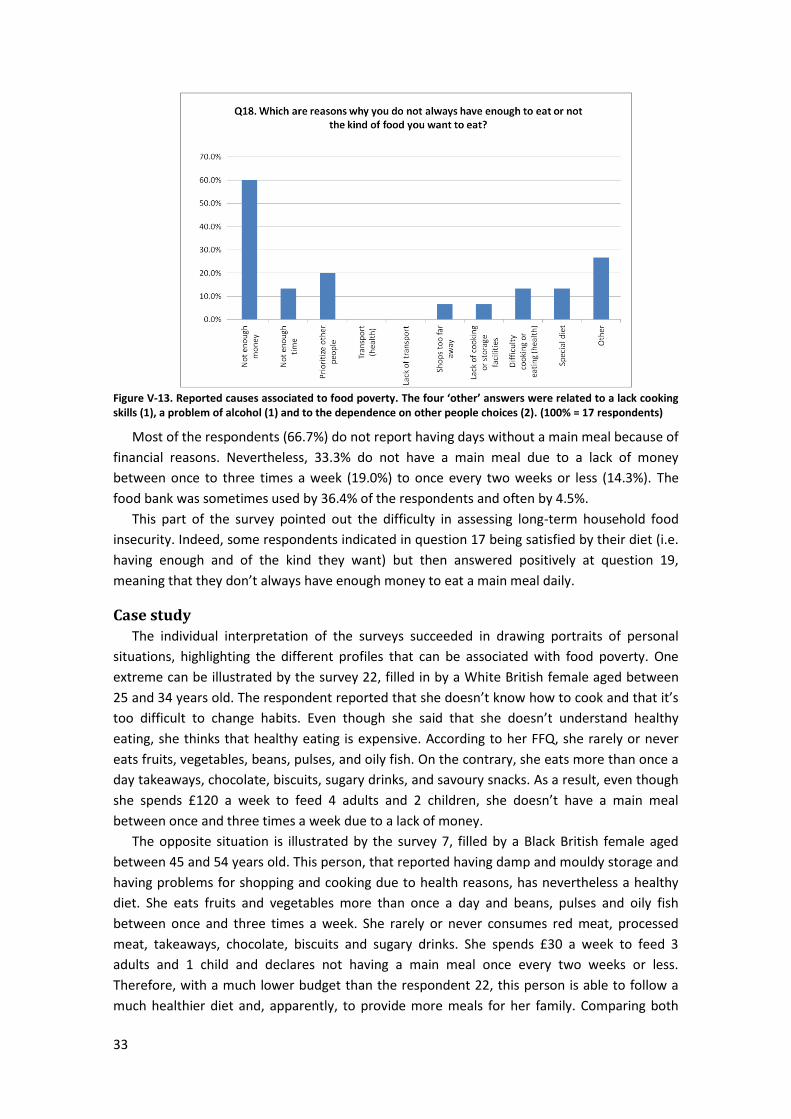
33
Figure V-13. Reported causes associated to food poverty. The four ‘other’ answers were related to a lack cooking skills (1), a problem of alcohol (1) and to the dependence on other people choices (2). (100% = 17 respondents)
Most of the respondents (66.7%) do not report having days without a main meal because of
financial reasons. Nevertheless, 33.3% do not have a main meal due to a lack of money
between once to three times a week (19.0%) to once every two weeks or less (14.3%). The
food bank was sometimes used by 36.4% of the respondents and often by 4.5%.
This part of the survey pointed out the difficulty in assessing long-term household food
insecurity. Indeed, some respondents indicated in question 17 being satisfied by their diet (i.e.
having enough and of the kind they want) but then answered positively at question 19,
meaning that they don’t always have enough money to eat a main meal daily.
Case study
The individual interpretation of the surveys succeeded in drawing portraits of personal
situations, highlighting the different profiles that can be associated with food poverty. One
extreme can be illustrated by the survey 22, filled in by a White British female aged between
25 and 34 years old. The respondent reported that she doesn’t know how to cook and that it’s
too difficult to change habits. Even though she said that she doesn’t understand healthy
eating, she thinks that healthy eating is expensive. According to her FFQ, she rarely or never
eats fruits, vegetables, beans, pulses, and oily fish. On the contrary, she eats more than once a
day takeaways, chocolate, biscuits, sugary drinks, and savoury snacks. As a result, even though
she spends £120 a week to feed 4 adults and 2 children, she doesn’t have a main meal
between once and three times a week due to a lack of money.
The opposite situation is illustrated by the survey 7, filled by a Black British female aged
between 45 and 54 years old. This person, that reported having damp and mouldy storage and
having problems for shopping and cooking due to health reasons, has nevertheless a healthy
diet. She eats fruits and vegetables more than once a day and beans, pulses and oily fish
between once and three times a week. She rarely or never consumes red meat, processed
meat, takeaways, chocolate, biscuits and sugary drinks. She spends £30 a week to feed 3
adults and 1 child and declares not having a main meal once every two weeks or less.
Therefore, with a much lower budget than the respondent 22, this person is able to follow a
much healthier diet and, apparently, to provide more meals for her family. Comparing both
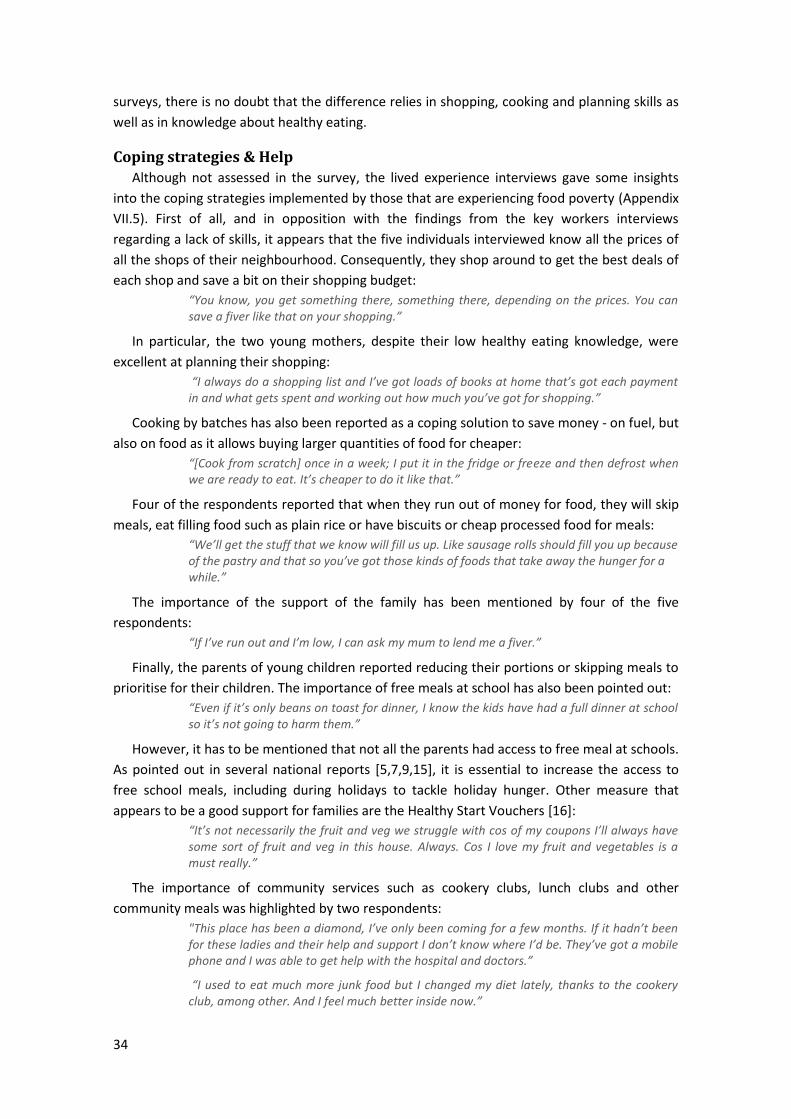
34
surveys, there is no doubt that the difference relies in shopping, cooking and planning skills as
well as in knowledge about healthy eating.
Coping strategies & Help
Although not assessed in the survey, the lived experience interviews gave some insights
into the coping strategies implemented by those that are experiencing food poverty (Appendix
VII.5). First of all, and in opposition with the findings from the key workers interviews
regarding a lack of skills, it appears that the five individuals interviewed know all the prices of
all the shops of their neighbourhood. Consequently, they shop around to get the best deals of
each shop and save a bit on their shopping budget:
“You know, you get something there, something there, depending on the prices. You can save a fiver like that on your shopping.”
In particular, the two young mothers, despite their low healthy eating knowledge, were
excellent at planning their shopping:
“I always do a shopping list and I’ve got loads of books at home that’s got each payment in and what gets spent and working out how much you’ve got for shopping.”
Cooking by batches has also been reported as a coping solution to save money - on fuel, but
also on food as it allows buying larger quantities of food for cheaper:
“[Cook from scratch] once in a week; I put it in the fridge or freeze and then defrost when we are ready to eat. It’s cheaper to do it like that.”
Four of the respondents reported that when they run out of money for food, they will skip
meals, eat filling food such as plain rice or have biscuits or cheap processed food for meals:
“We’ll get the stuff that we know will fill us up. Like sausage rolls should fill you up because of the pastry and that so you’ve got those kinds of foods that take away the hunger for a while.”
The importance of the support of the family has been mentioned by four of the five
respondents:
“If I’ve run out and I’m low, I can ask my mum to lend me a fiver.”
Finally, the parents of young children reported reducing their portions or skipping meals to
prioritise for their children. The importance of free meals at school has also been pointed out:
“Even if it’s only beans on toast for dinner, I know the kids have had a full dinner at school so it’s not going to harm them.”
However, it has to be mentioned that not all the parents had access to free meal at schools.
As pointed out in several national reports [5,7,9,15], it is essential to increase the access to
free school meals, including during holidays to tackle holiday hunger. Other measure that
appears to be a good support for families are the Healthy Start Vouchers [16]:
“It’s not necessarily the fruit and veg we struggle with cos of my coupons I’ll always have some sort of fruit and veg in this house. Always. Cos I love my fruit and vegetables is a must really.”
The importance of community services such as cookery clubs, lunch clubs and other
community meals was highlighted by two respondents:
"This place has been a diamond, I’ve only been coming for a few months. If it hadn’t been for these ladies and their help and support I don’t know where I’d be. They’ve got a mobile phone and I was able to get help with the hospital and doctors.”
“I used to eat much more junk food but I changed my diet lately, thanks to the cookery club, among other. And I feel much better inside now.”
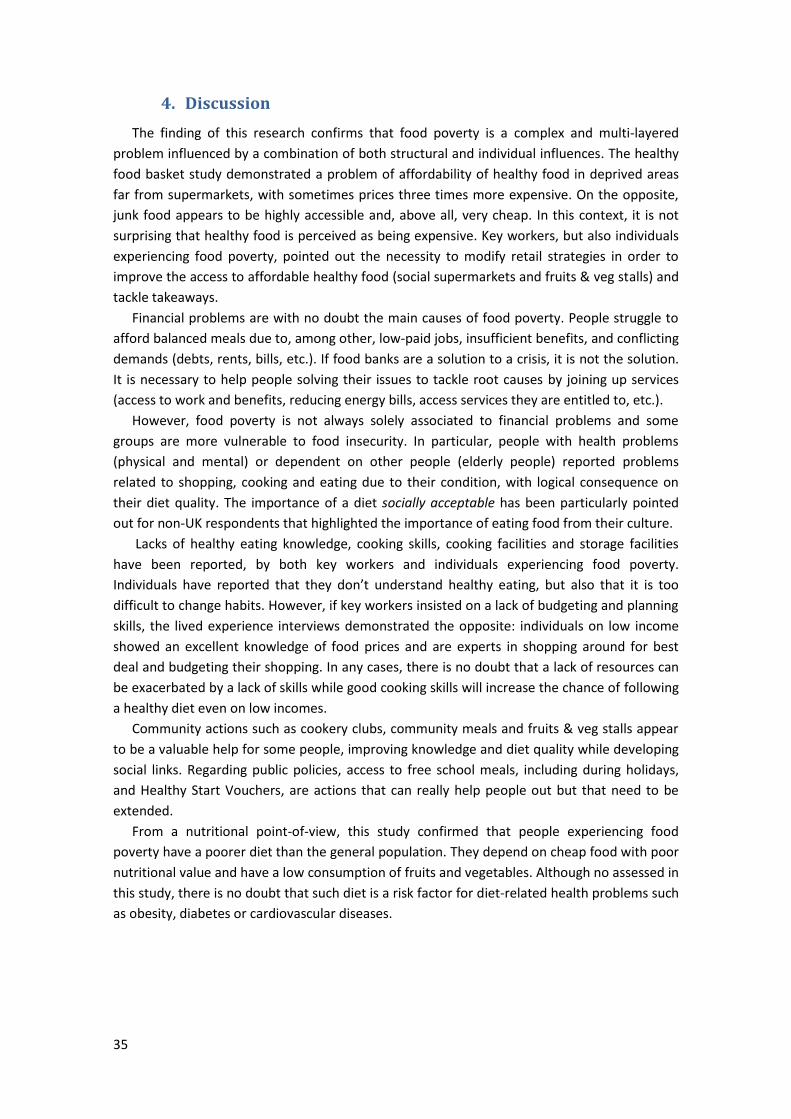
35
4. Discussion
The finding of this research confirms that food poverty is a complex and multi-layered
problem influenced by a combination of both structural and individual influences. The healthy
food basket study demonstrated a problem of affordability of healthy food in deprived areas
far from supermarkets, with sometimes prices three times more expensive. On the opposite,
junk food appears to be highly accessible and, above all, very cheap. In this context, it is not
surprising that healthy food is perceived as being expensive. Key workers, but also individuals
experiencing food poverty, pointed out the necessity to modify retail strategies in order to
improve the access to affordable healthy food (social supermarkets and fruits & veg stalls) and
tackle takeaways.
Financial problems are with no doubt the main causes of food poverty. People struggle to
afford balanced meals due to, among other, low-paid jobs, insufficient benefits, and conflicting
demands (debts, rents, bills, etc.). If food banks are a solution to a crisis, it is not the solution.
It is necessary to help people solving their issues to tackle root causes by joining up services
(access to work and benefits, reducing energy bills, access services they are entitled to, etc.).
However, food poverty is not always solely associated to financial problems and some
groups are more vulnerable to food insecurity. In particular, people with health problems
(physical and mental) or dependent on other people (elderly people) reported problems
related to shopping, cooking and eating due to their condition, with logical consequence on
their diet quality. The importance of a diet socially acceptable has been particularly pointed
out for non-UK respondents that highlighted the importance of eating food from their culture.
Lacks of healthy eating knowledge, cooking skills, cooking facilities and storage facilities
have been reported, by both key workers and individuals experiencing food poverty.
Individuals have reported that they don’t understand healthy eating, but also that it is too
difficult to change habits. However, if key workers insisted on a lack of budgeting and planning
skills, the lived experience interviews demonstrated the opposite: individuals on low income
showed an excellent knowledge of food prices and are experts in shopping around for best
deal and budgeting their shopping. In any cases, there is no doubt that a lack of resources can
be exacerbated by a lack of skills while good cooking skills will increase the chance of following
a healthy diet even on low incomes.
Community actions such as cookery clubs, community meals and fruits & veg stalls appear
to be a valuable help for some people, improving knowledge and diet quality while developing
social links. Regarding public policies, access to free school meals, including during holidays,
and Healthy Start Vouchers, are actions that can really help people out but that need to be
extended.
From a nutritional point-of-view, this study confirmed that people experiencing food
poverty have a poorer diet than the general population. They depend on cheap food with poor
nutritional value and have a low consumption of fruits and vegetables. Although no assessed in
this study, there is no doubt that such diet is a risk factor for diet-related health problems such
as obesity, diabetes or cardiovascular diseases.
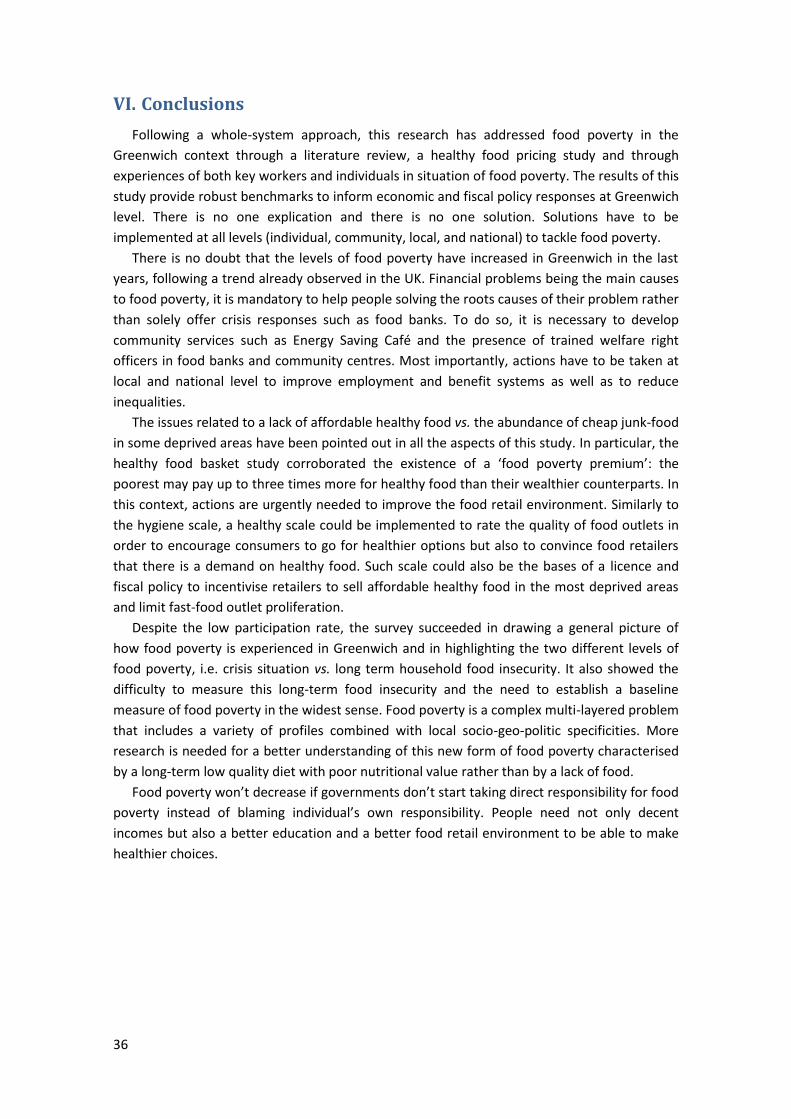
36
VI. Conclusions
Following a whole-system approach, this research has addressed food poverty in the
Greenwich context through a literature review, a healthy food pricing study and through
experiences of both key workers and individuals in situation of food poverty. The results of this
study provide robust benchmarks to inform economic and fiscal policy responses at Greenwich
level. There is no one explication and there is no one solution. Solutions have to be
implemented at all levels (individual, community, local, and national) to tackle food poverty.
There is no doubt that the levels of food poverty have increased in Greenwich in the last
years, following a trend already observed in the UK. Financial problems being the main causes
to food poverty, it is mandatory to help people solving the roots causes of their problem rather
than solely offer crisis responses such as food banks. To do so, it is necessary to develop
community services such as Energy Saving Café and the presence of trained welfare right
officers in food banks and community centres. Most importantly, actions have to be taken at
local and national level to improve employment and benefit systems as well as to reduce
inequalities.
The issues related to a lack of affordable healthy food vs. the abundance of cheap junk-food
in some deprived areas have been pointed out in all the aspects of this study. In particular, the
healthy food basket study corroborated the existence of a ‘food poverty premium’: the
poorest may pay up to three times more for healthy food than their wealthier counterparts. In
this context, actions are urgently needed to improve the food retail environment. Similarly to
the hygiene scale, a healthy scale could be implemented to rate the quality of food outlets in
order to encourage consumers to go for healthier options but also to convince food retailers
that there is a demand on healthy food. Such scale could also be the bases of a licence and
fiscal policy to incentivise retailers to sell affordable healthy food in the most deprived areas
and limit fast-food outlet proliferation.
Despite the low participation rate, the survey succeeded in drawing a general picture of
how food poverty is experienced in Greenwich and in highlighting the two different levels of
food poverty, i.e. crisis situation vs. long term household food insecurity. It also showed the
difficulty to measure this long-term food insecurity and the need to establish a baseline
measure of food poverty in the widest sense. Food poverty is a complex multi-layered problem
that includes a variety of profiles combined with local socio-geo-politic specificities. More
research is needed for a better understanding of this new form of food poverty characterised
by a long-term low quality diet with poor nutritional value rather than by a lack of food.
Food poverty won’t decrease if governments don’t start taking direct responsibility for food
poverty instead of blaming individual’s own responsibility. People need not only decent
incomes but also a better education and a better food retail environment to be able to make
healthier choices.
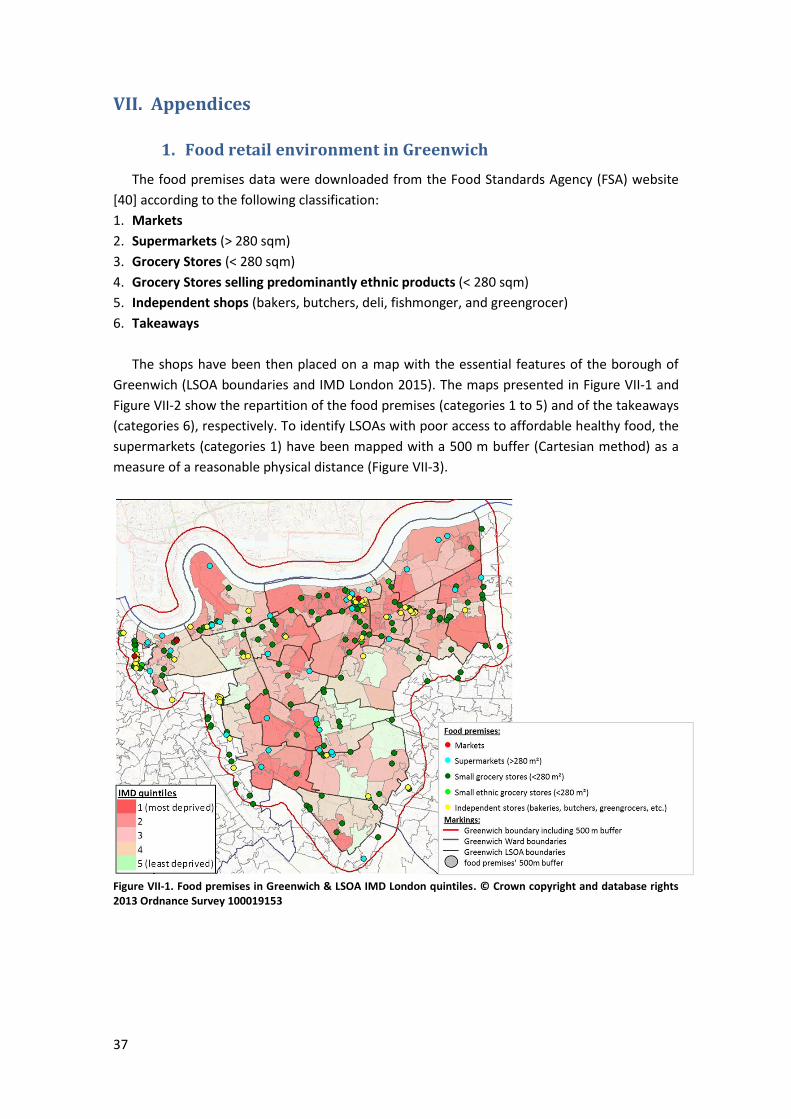
37
VII. Appendices
1. Food retail environment in Greenwich
The food premises data were downloaded from the Food Standards Agency (FSA) website
[40] according to the following classification:
1. Markets
2. Supermarkets (> 280 sqm)
3. Grocery Stores (< 280 sqm)
4. Grocery Stores selling predominantly ethnic products (< 280 sqm)
5. Independent shops (bakers, butchers, deli, fishmonger, and greengrocer)
6. Takeaways
The shops have been then placed on a map with the essential features of the borough of
Greenwich (LSOA boundaries and IMD London 2015). The maps presented in Figure VII-1 and
Figure VII-2 show the repartition of the food premises (categories 1 to 5) and of the takeaways
(categories 6), respectively. To identify LSOAs with poor access to affordable healthy food, the
supermarkets (categories 1) have been mapped with a 500 m buffer (Cartesian method) as a
measure of a reasonable physical distance (Figure VII-3).
Figure VII-1. Food premises in Greenwich & LSOA IMD London quintiles. © Crown copyright and database rights 2013 Ordnance Survey 100019153
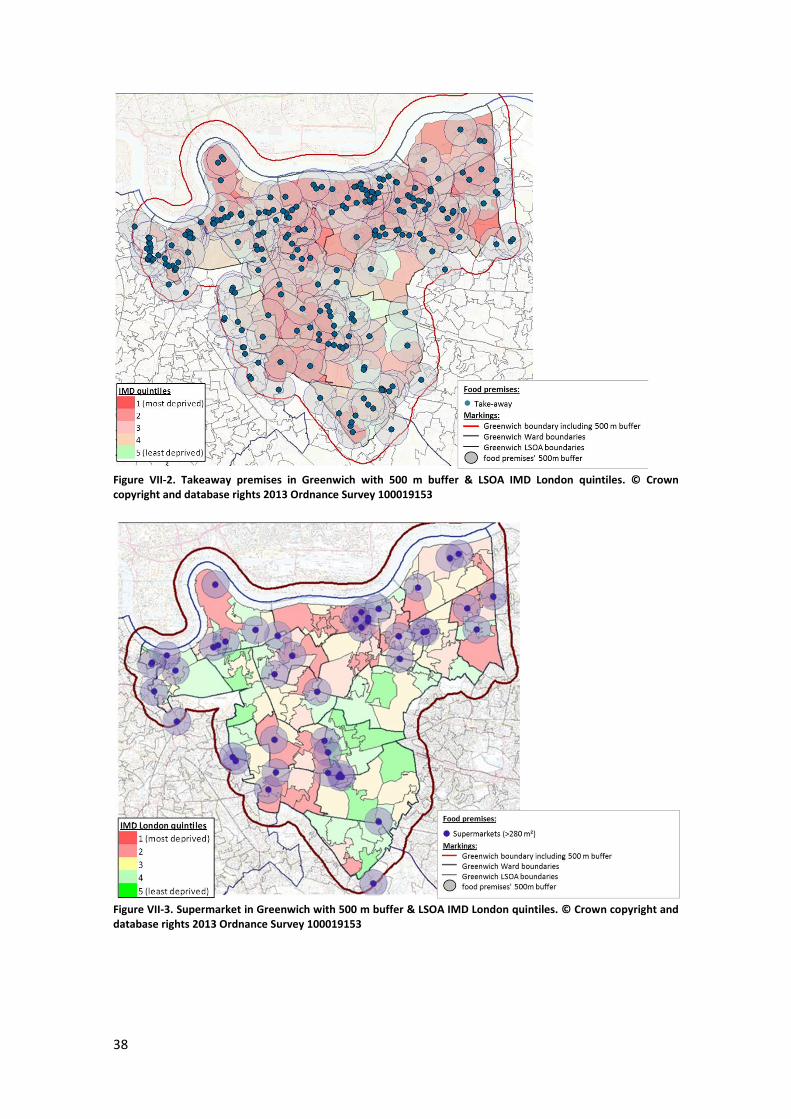
38
Figure VII-2. Takeaway premises in Greenwich with 500 m buffer & LSOA IMD London quintiles. © Crown copyright and database rights 2013 Ordnance Survey 100019153
Figure VII-3. Supermarket in Greenwich with 500 m buffer & LSOA IMD London quintiles. © Crown copyright and database rights 2013 Ordnance Survey 100019153
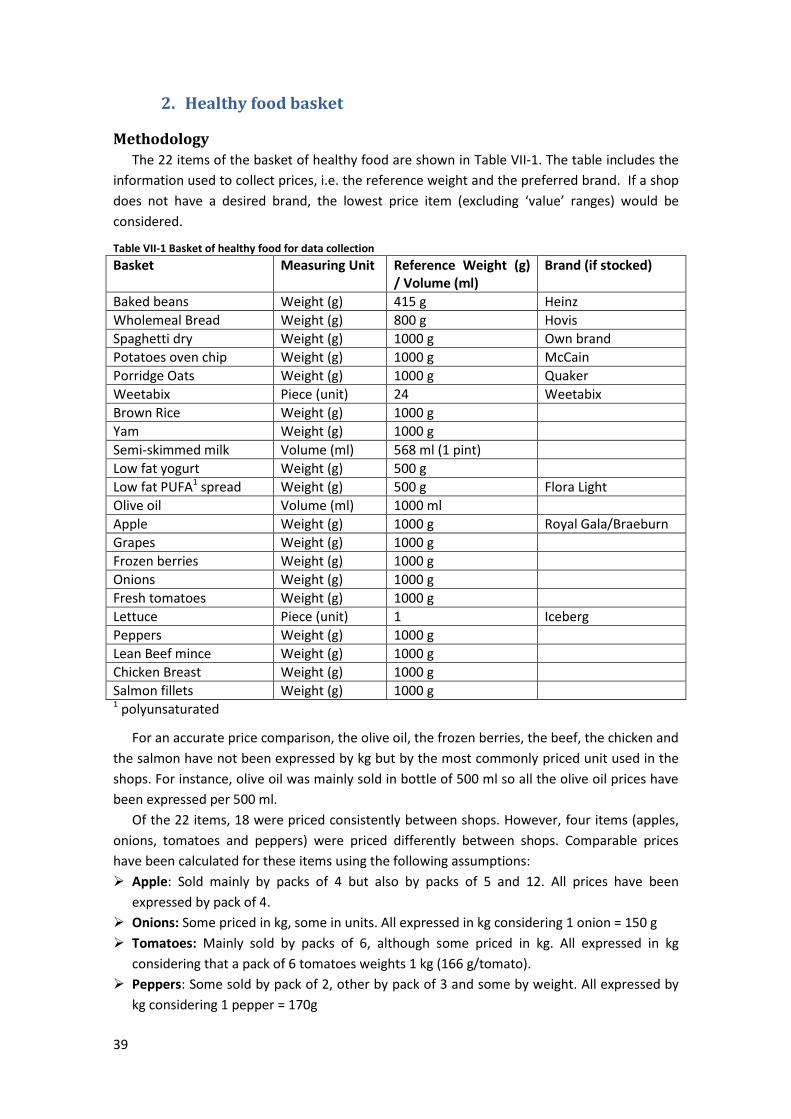
39
2. Healthy food basket
Methodology
The 22 items of the basket of healthy food are shown in Table VII-1. The table includes the
information used to collect prices, i.e. the reference weight and the preferred brand. If a shop
does not have a desired brand, the lowest price item (excluding ‘value’ ranges) would be
considered.
Table VII-1 Basket of healthy food for data collection
Basket Measuring Unit Reference Weight (g) / Volume (ml)
Brand (if stocked)
Baked beans Weight (g) 415 g Heinz
Wholemeal Bread Weight (g) 800 g Hovis
Spaghetti dry Weight (g) 1000 g Own brand
Potatoes oven chip Weight (g) 1000 g McCain
Porridge Oats Weight (g) 1000 g Quaker
Weetabix Piece (unit) 24 Weetabix
Brown Rice Weight (g) 1000 g
Yam Weight (g) 1000 g
Semi-skimmed milk Volume (ml) 568 ml (1 pint)
Low fat yogurt Weight (g) 500 g
Low fat PUFA1 spread Weight (g) 500 g Flora Light
Olive oil Volume (ml) 1000 ml
Apple Weight (g) 1000 g Royal Gala/Braeburn
Grapes Weight (g) 1000 g
Frozen berries Weight (g) 1000 g
Onions Weight (g) 1000 g
Fresh tomatoes Weight (g) 1000 g
Lettuce Piece (unit) 1 Iceberg
Peppers Weight (g) 1000 g
Lean Beef mince Weight (g) 1000 g
Chicken Breast Weight (g) 1000 g
Salmon fillets Weight (g) 1000 g 1 polyunsaturated
For an accurate price comparison, the olive oil, the frozen berries, the beef, the chicken and
the salmon have not been expressed by kg but by the most commonly priced unit used in the
shops. For instance, olive oil was mainly sold in bottle of 500 ml so all the olive oil prices have
been expressed per 500 ml.
Of the 22 items, 18 were priced consistently between shops. However, four items (apples,
onions, tomatoes and peppers) were priced differently between shops. Comparable prices
have been calculated for these items using the following assumptions:
Apple: Sold mainly by packs of 4 but also by packs of 5 and 12. All prices have been
expressed by pack of 4.
Onions: Some priced in kg, some in units. All expressed in kg considering 1 onion = 150 g
Tomatoes: Mainly sold by packs of 6, although some priced in kg. All expressed in kg
considering that a pack of 6 tomatoes weights 1 kg (166 g/tomato).
Peppers: Some sold by pack of 2, other by pack of 3 and some by weight. All expressed by
kg considering 1 pepper = 170g
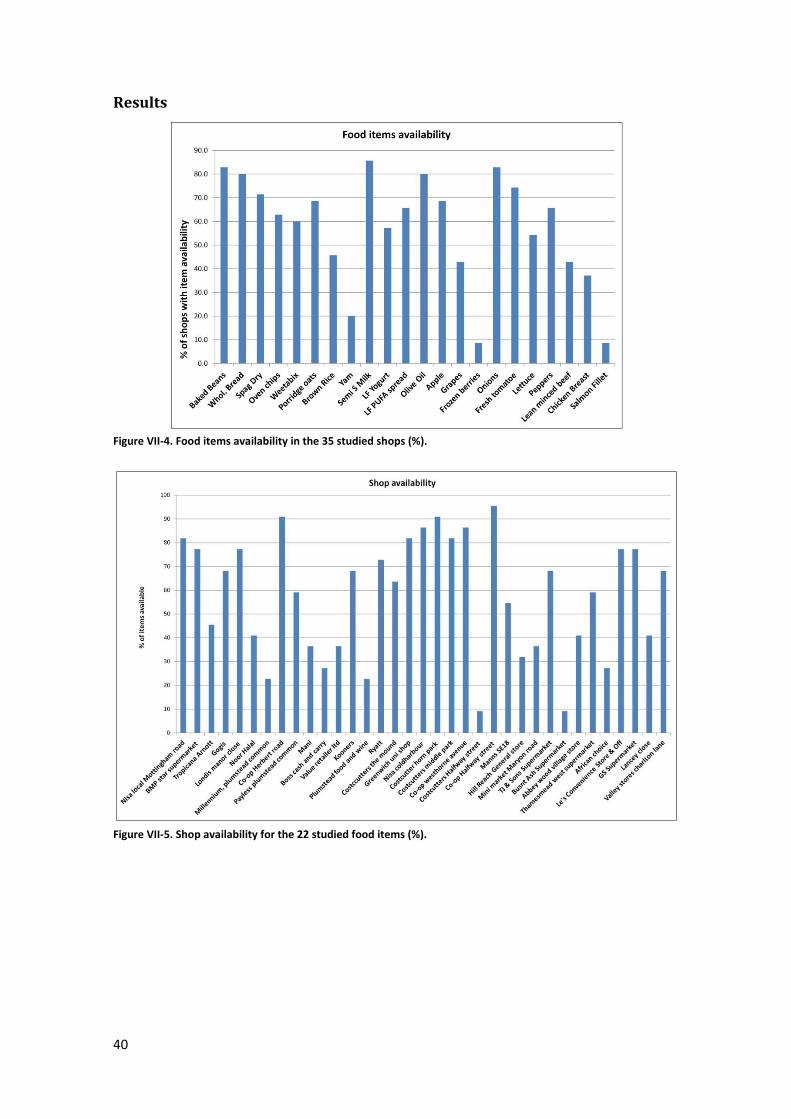
40
Results
Figure VII-4. Food items availability in the 35 studied shops (%).
Figure VII-5. Shop availability for the 22 studied food items (%).
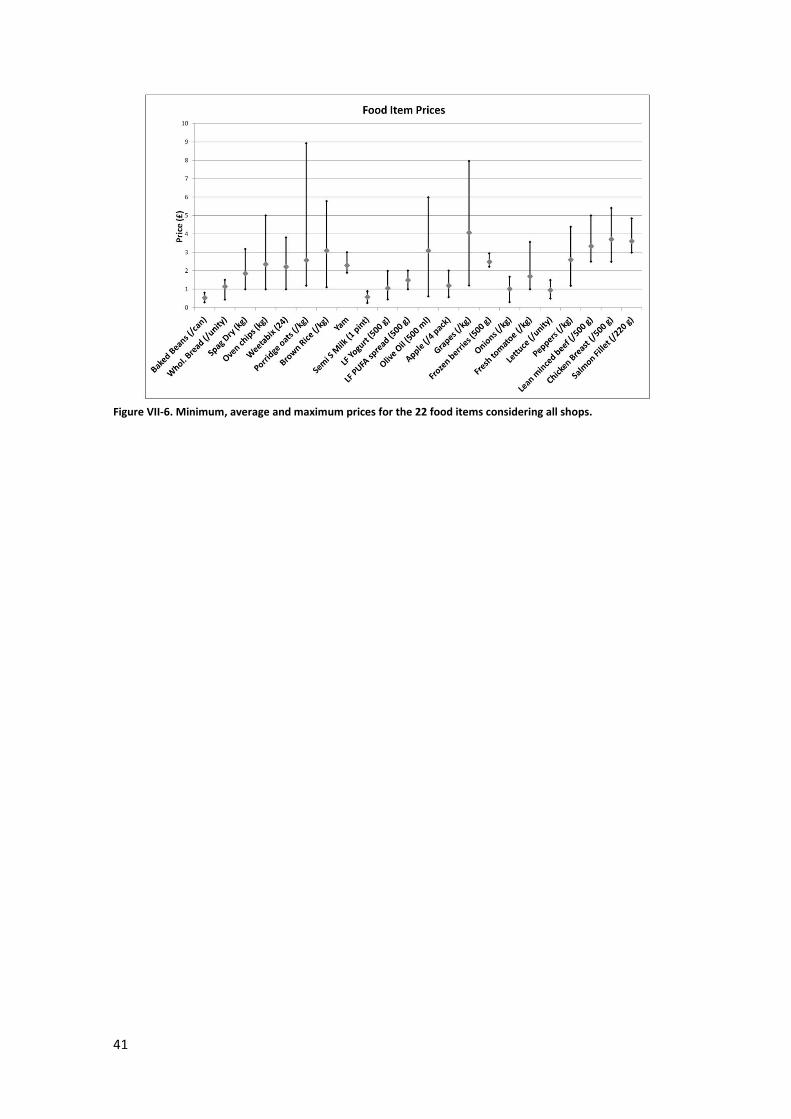
41
Figure VII-6. Minimum, average and maximum prices for the 22 food items considering all shops.
42
3. Shopping and Eating Habits Survey
The purpose of this research project is to study the shopping and eating habits in
the Greenwich population, with a focus on the difficulties people can experience. This
is a research project being conducted by Public Health and Wellbeing, Royal Borough
of Greenwich.
Your participation will require approximately 10 minutes. Taking part in this study is
completely voluntary. Your responses will be anonymous and kept strictly confidential.
Any report of this research that is made available to the public will not include your
name or any other individual information by which you could be identified. Completing
this survey indicates that you are 18 years of age or older and indicates your consent
to participate in the research.
The survey is aimed to be completed by the person usually in charge of the
shopping and the cooking in the household. In the following questions, “you” refers to
you as an individual.
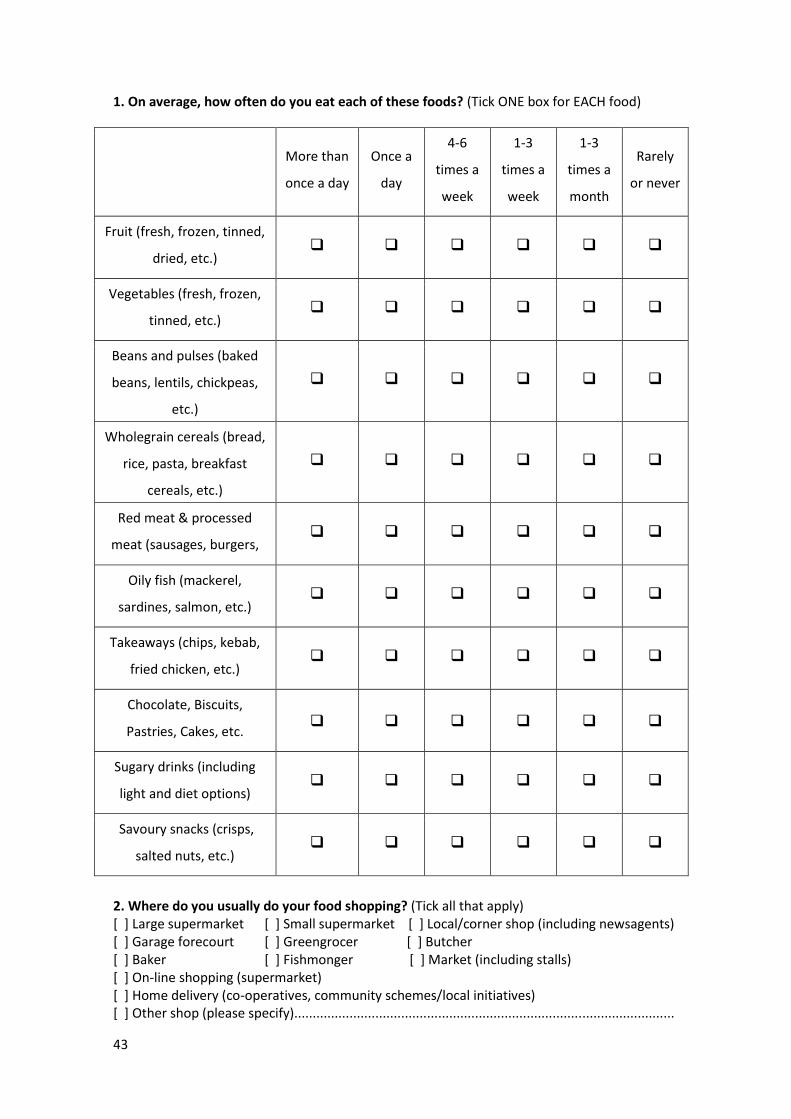
43
1. On average, how often do you eat each of these foods? (Tick ONE box for EACH food)
More than
once a day
Once a
day
4-6
times a
week
1-3
times a
week
1-3
times a
month
Rarely
or never
Fruit (fresh, frozen, tinned,
dried, etc.)
Vegetables (fresh, frozen,
tinned, etc.)
Beans and pulses (baked
beans, lentils, chickpeas,
etc.)
Wholegrain cereals (bread,
rice, pasta, breakfast
cereals, etc.)
Red meat & processed
meat (sausages, burgers,
etc.)
Oily fish (mackerel,
sardines, salmon, etc.)
Takeaways (chips, kebab,
fried chicken, etc.)
Chocolate, Biscuits,
Pastries, Cakes, etc.
Sugary drinks (including
light and diet options)
Savoury snacks (crisps,
salted nuts, etc.)
2. Where do you usually do your food shopping? (Tick all that apply) [ ] Large supermarket [ ] Small supermarket [ ] Local/corner shop (including newsagents) [ ] Garage forecourt [ ] Greengrocer [ ] Butcher [ ] Baker [ ] Fishmonger [ ] Market (including stalls) [ ] On-line shopping (supermarket) [ ] Home delivery (co-operatives, community schemes/local initiatives) [ ] Other shop (please specify).......................................................................................................
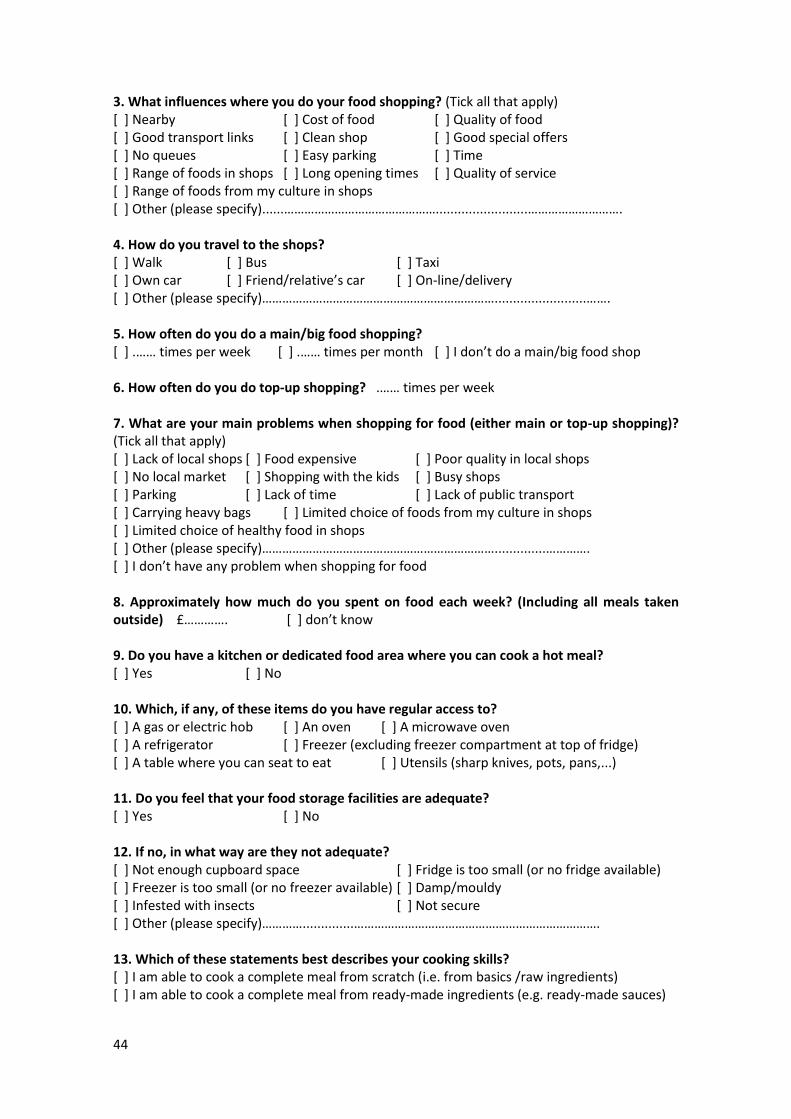
44
3. What influences where you do your food shopping? (Tick all that apply) [ ] Nearby [ ] Cost of food [ ] Quality of food [ ] Good transport links [ ] Clean shop [ ] Good special offers [ ] No queues [ ] Easy parking [ ] Time [ ] Range of foods in shops [ ] Long opening times [ ] Quality of service [ ] Range of foods from my culture in shops [ ] Other (please specify)......……………………………………….........................………………………. 4. How do you travel to the shops? [ ] Walk [ ] Bus [ ] Taxi [ ] Own car [ ] Friend/relative’s car [ ] On-line/delivery [ ] Other (please specify)…………………………………………………………….........................……. 5. How often do you do a main/big food shopping? [ ] .…… times per week [ ] .…… times per month [ ] I don’t do a main/big food shop 6. How often do you do top-up shopping? .…… times per week 7. What are your main problems when shopping for food (either main or top-up shopping)? (Tick all that apply) [ ] Lack of local shops [ ] Food expensive [ ] Poor quality in local shops [ ] No local market [ ] Shopping with the kids [ ] Busy shops [ ] Parking [ ] Lack of time [ ] Lack of public transport [ ] Carrying heavy bags [ ] Limited choice of foods from my culture in shops [ ] Limited choice of healthy food in shops [ ] Other (please specify)……………………………………………………………..............…………. [ ] I don’t have any problem when shopping for food 8. Approximately how much do you spent on food each week? (Including all meals taken outside) £…………. [ ] don’t know 9. Do you have a kitchen or dedicated food area where you can cook a hot meal? [ ] Yes [ ] No 10. Which, if any, of these items do you have regular access to? [ ] A gas or electric hob [ ] An oven [ ] A microwave oven [ ] A refrigerator [ ] Freezer (excluding freezer compartment at top of fridge) [ ] A table where you can seat to eat [ ] Utensils (sharp knives, pots, pans,...) 11. Do you feel that your food storage facilities are adequate? [ ] Yes [ ] No 12. If no, in what way are they not adequate? [ ] Not enough cupboard space [ ] Fridge is too small (or no fridge available) [ ] Freezer is too small (or no freezer available) [ ] Damp/mouldy [ ] Infested with insects [ ] Not secure [ ] Other (please specify)…………..............………………………………………………………………. 13. Which of these statements best describes your cooking skills? [ ] I am able to cook a complete meal from scratch (i.e. from basics /raw ingredients) [ ] I am able to cook a complete meal from ready-made ingredients (e.g. ready-made sauces)
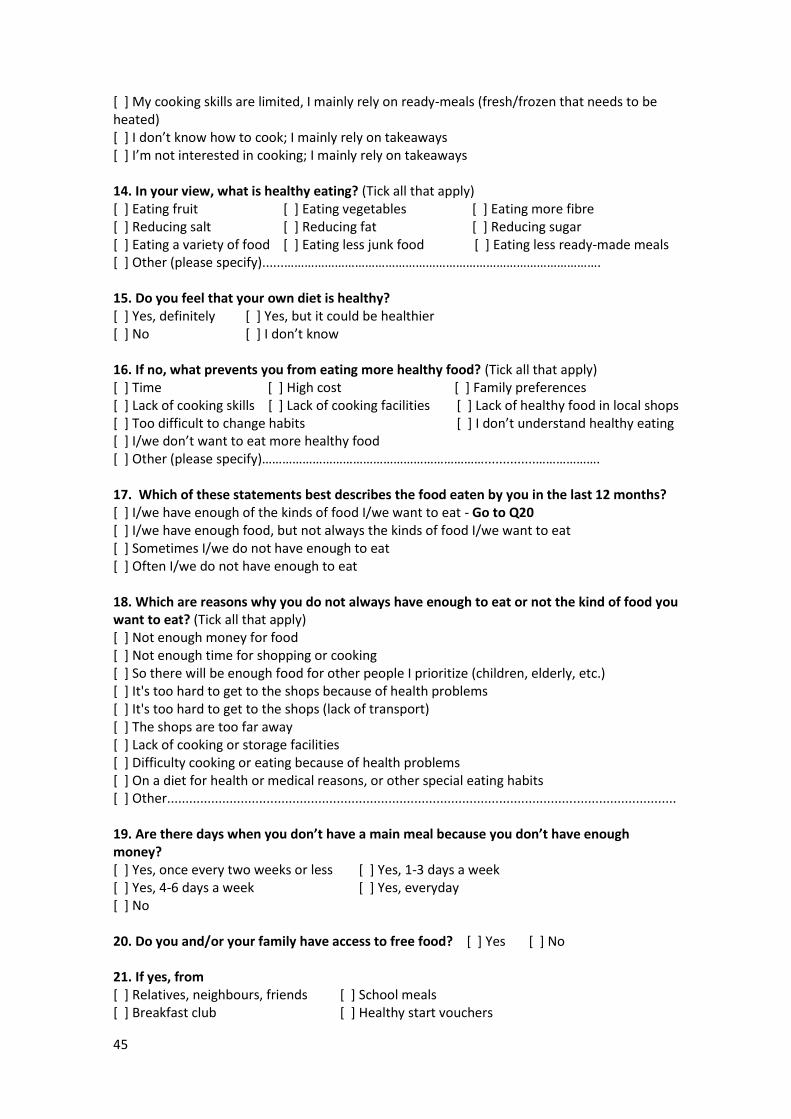
45
[ ] My cooking skills are limited, I mainly rely on ready-meals (fresh/frozen that needs to be heated) [ ] I don’t know how to cook; I mainly rely on takeaways [ ] I’m not interested in cooking; I mainly rely on takeaways 14. In your view, what is healthy eating? (Tick all that apply) [ ] Eating fruit [ ] Eating vegetables [ ] Eating more fibre [ ] Reducing salt [ ] Reducing fat [ ] Reducing sugar [ ] Eating a variety of food [ ] Eating less junk food [ ] Eating less ready-made meals [ ] Other (please specify)......…………………………………………………………………………………. 15. Do you feel that your own diet is healthy? [ ] Yes, definitely [ ] Yes, but it could be healthier [ ] No [ ] I don’t know 16. If no, what prevents you from eating more healthy food? (Tick all that apply) [ ] Time [ ] High cost [ ] Family preferences [ ] Lack of cooking skills [ ] Lack of cooking facilities [ ] Lack of healthy food in local shops [ ] Too difficult to change habits [ ] I don’t understand healthy eating [ ] I/we don’t want to eat more healthy food [ ] Other (please specify)…………………………………………………………..............………………. 17. Which of these statements best describes the food eaten by you in the last 12 months? [ ] I/we have enough of the kinds of food I/we want to eat - Go to Q20 [ ] I/we have enough food, but not always the kinds of food I/we want to eat [ ] Sometimes I/we do not have enough to eat [ ] Often I/we do not have enough to eat 18. Which are reasons why you do not always have enough to eat or not the kind of food you want to eat? (Tick all that apply) [ ] Not enough money for food [ ] Not enough time for shopping or cooking [ ] So there will be enough food for other people I prioritize (children, elderly, etc.) [ ] It's too hard to get to the shops because of health problems [ ] It's too hard to get to the shops (lack of transport) [ ] The shops are too far away [ ] Lack of cooking or storage facilities [ ] Difficulty cooking or eating because of health problems [ ] On a diet for health or medical reasons, or other special eating habits [ ] Other.......................................................................................................................................... 19. Are there days when you don’t have a main meal because you don’t have enough money? [ ] Yes, once every two weeks or less [ ] Yes, 1-3 days a week [ ] Yes, 4-6 days a week [ ] Yes, everyday [ ] No 20. Do you and/or your family have access to free food? [ ] Yes [ ] No 21. If yes, from [ ] Relatives, neighbours, friends [ ] School meals [ ] Breakfast club [ ] Healthy start vouchers
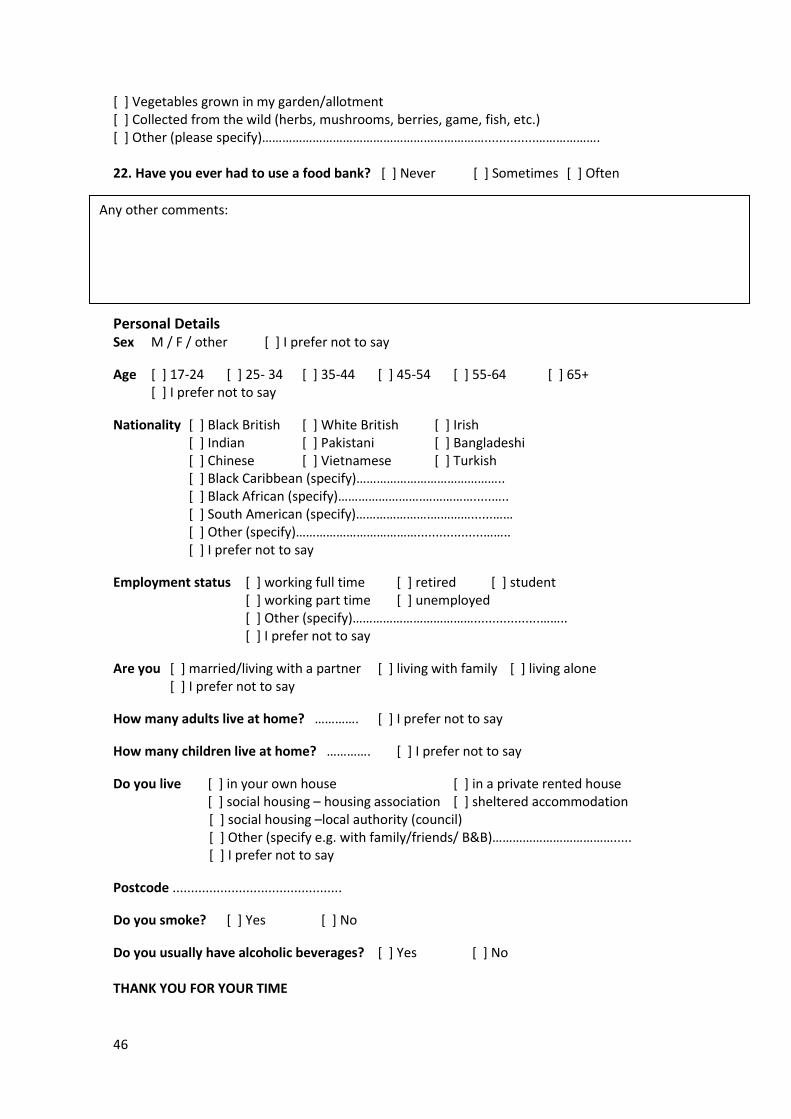
46
[ ] Vegetables grown in my garden/allotment [ ] Collected from the wild (herbs, mushrooms, berries, game, fish, etc.) [ ] Other (please specify)…………………………………………………………..............………………. 22. Have you ever had to use a food bank? [ ] Never [ ] Sometimes [ ] Often
Personal Details Sex M / F / other [ ] I prefer not to say
Age [ ] 17-24 [ ] 25- 34 [ ] 35-44 [ ] 45-54 [ ] 55-64 [ ] 65+ [ ] I prefer not to say
Nationality [ ] Black British [ ] White British [ ] Irish [ ] Indian [ ] Pakistani [ ] Bangladeshi [ ] Chinese [ ] Vietnamese [ ] Turkish [ ] Black Caribbean (specify)…………………………………….. [ ] Black African (specify)…………………….…………….....….. [ ] South American (specify)………………….…………......…… [ ] Other (specify)………………………………..................…….. [ ] I prefer not to say
Employment status [ ] working full time [ ] retired [ ] student [ ] working part time [ ] unemployed [ ] Other (specify)………………………………..................…….. [ ] I prefer not to say
Are you [ ] married/living with a partner [ ] living with family [ ] living alone [ ] I prefer not to say
How many adults live at home? …………. [ ] I prefer not to say
How many children live at home? …………. [ ] I prefer not to say
Do you live [ ] in your own house [ ] in a private rented house [ ] social housing – housing association [ ] sheltered accommodation
[ ] social housing –local authority (council) [ ] Other (specify e.g. with family/friends/ B&B)………………………………..... [ ] I prefer not to say
Postcode ..............................................
Do you smoke? [ ] Yes [ ] No
Do you usually have alcoholic beverages? [ ] Yes [ ] No THANK YOU FOR YOUR TIME
Any other comments:
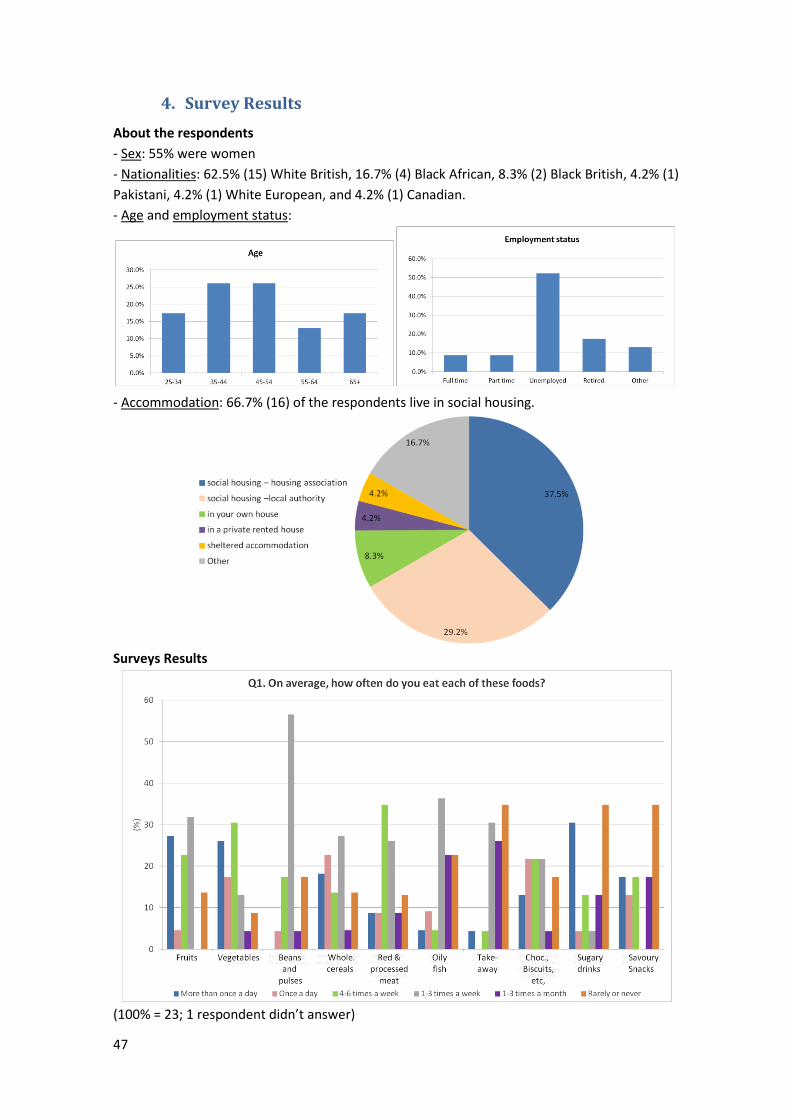
47
4. Survey Results
About the respondents
- Sex: 55% were women
- Nationalities: 62.5% (15) White British, 16.7% (4) Black African, 8.3% (2) Black British, 4.2% (1)
Pakistani, 4.2% (1) White European, and 4.2% (1) Canadian.
- Age and employment status:
- Accommodation: 66.7% (16) of the respondents live in social housing.
Surveys Results
(100% = 23; 1 respondent didn’t answer)
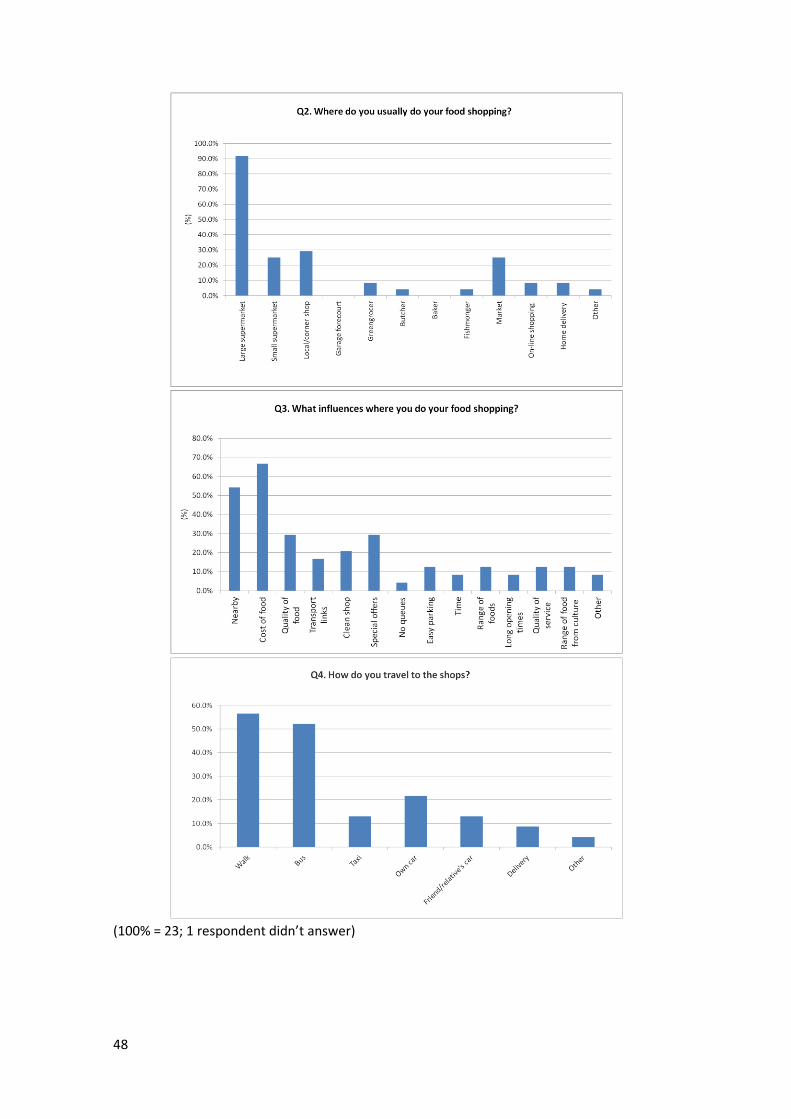
48
(100% = 23; 1 respondent didn’t answer)
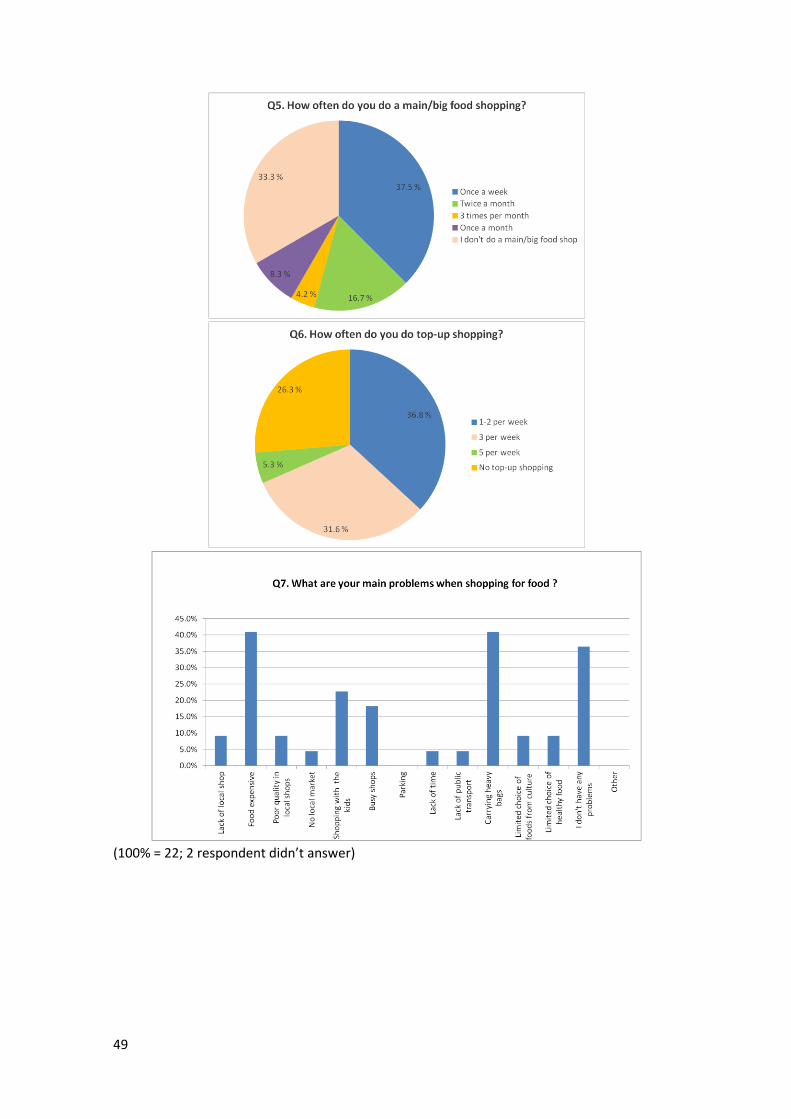
49
(100% = 22; 2 respondent didn’t answer)
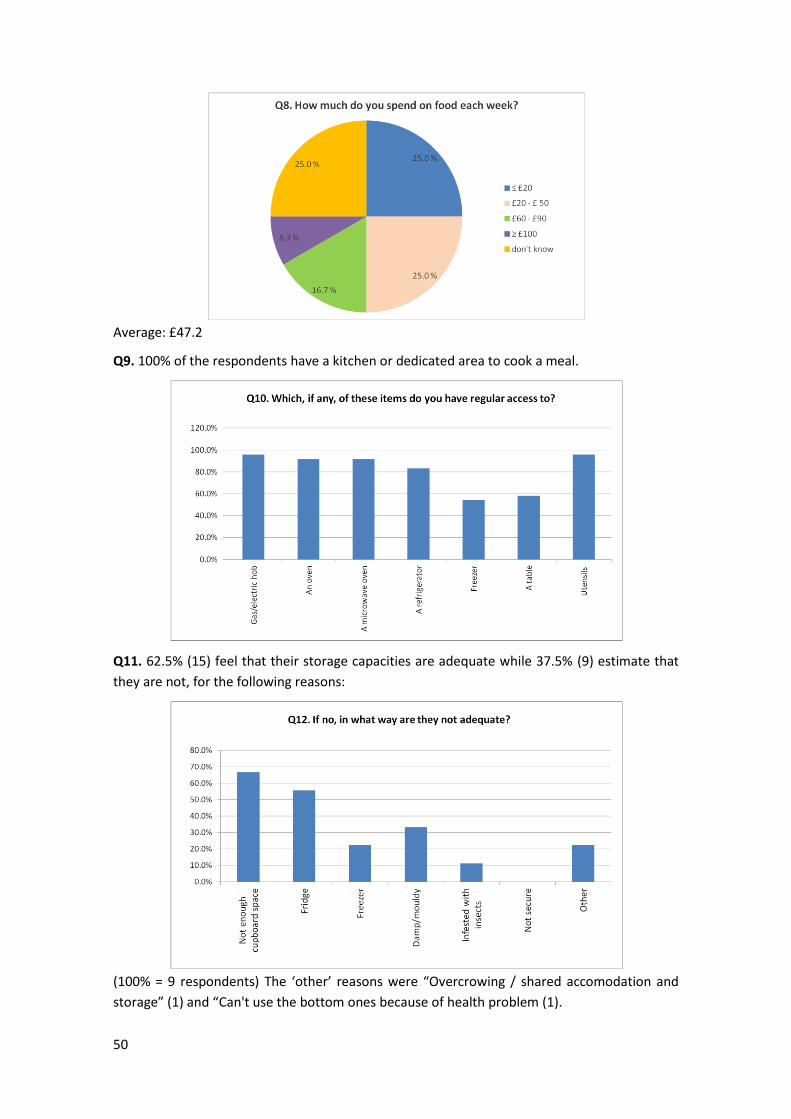
50
Average: £47.2
Q9. 100% of the respondents have a kitchen or dedicated area to cook a meal.
Q11. 62.5% (15) feel that their storage capacities are adequate while 37.5% (9) estimate that
they are not, for the following reasons:
(100% = 9 respondents) The ‘other’ reasons were “Overcrowing / shared accomodation and
storage” (1) and “Can't use the bottom ones because of health problem (1).
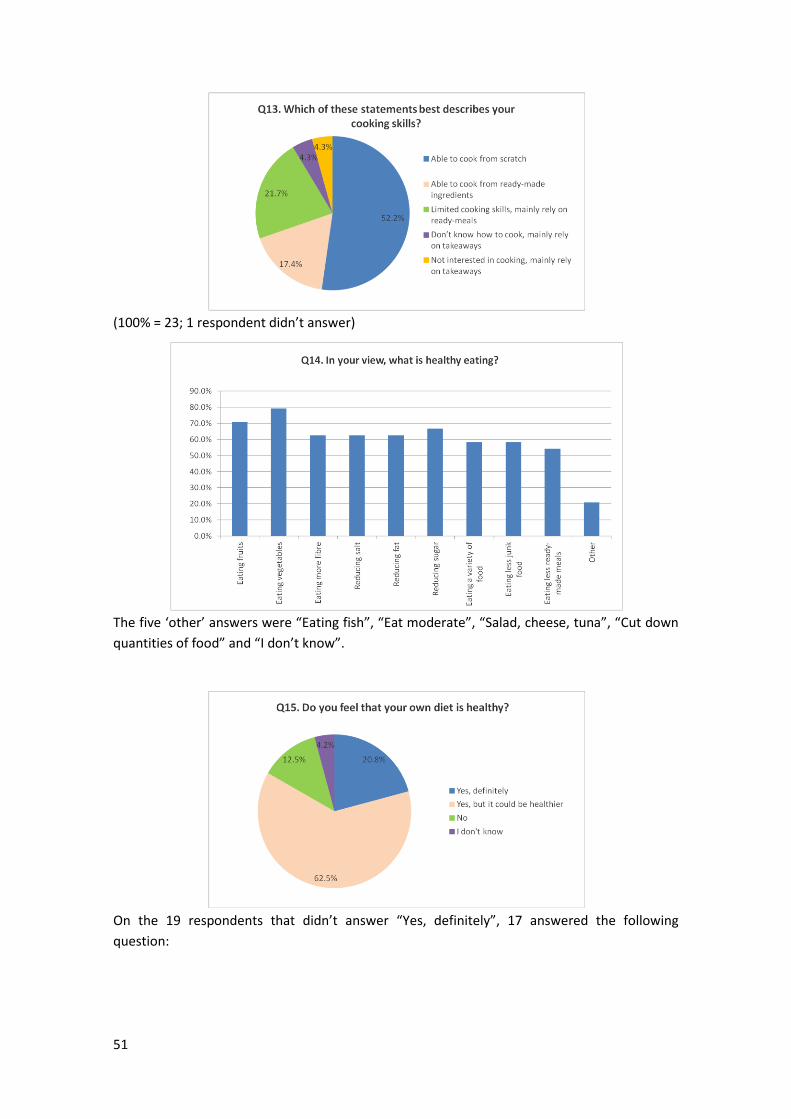
51
(100% = 23; 1 respondent didn’t answer)
The five ‘other’ answers were “Eating fish”, “Eat moderate”, “Salad, cheese, tuna”, “Cut down
quantities of food” and “I don’t know”.
On the 19 respondents that didn’t answer “Yes, definitely”, 17 answered the following
question:
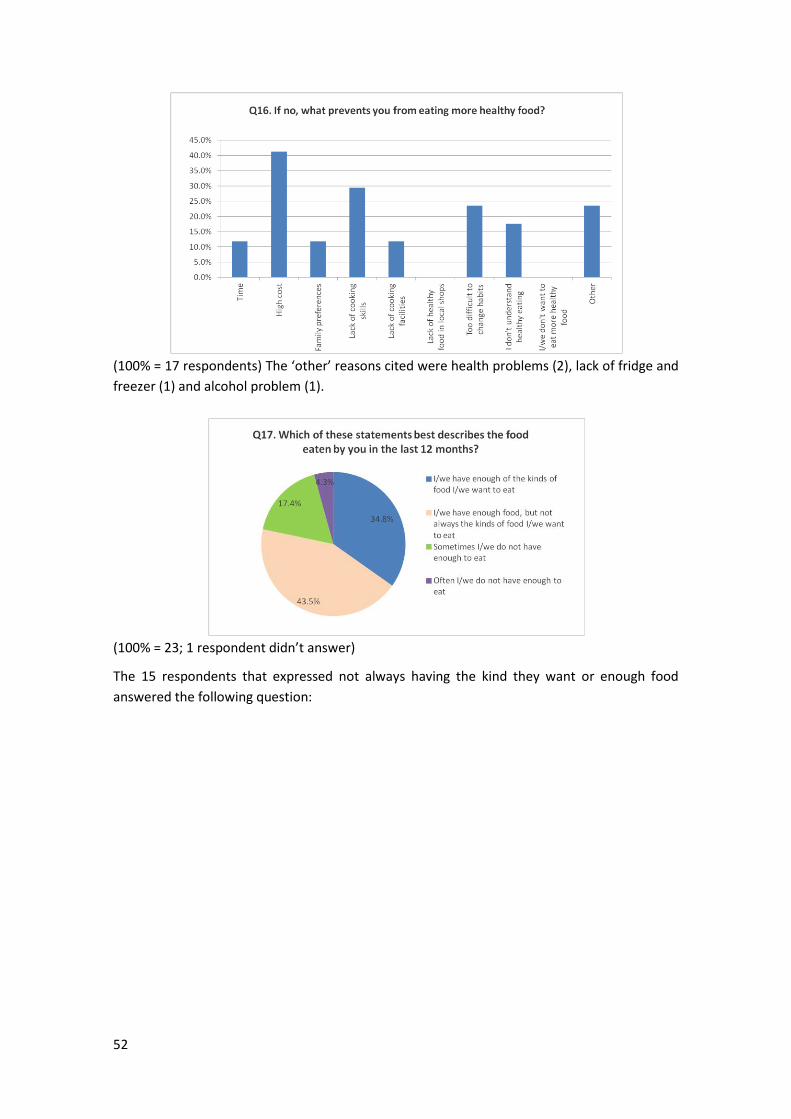
52
(100% = 17 respondents) The ‘other’ reasons cited were health problems (2), lack of fridge and
freezer (1) and alcohol problem (1).
(100% = 23; 1 respondent didn’t answer)
The 15 respondents that expressed not always having the kind they want or enough food
answered the following question:
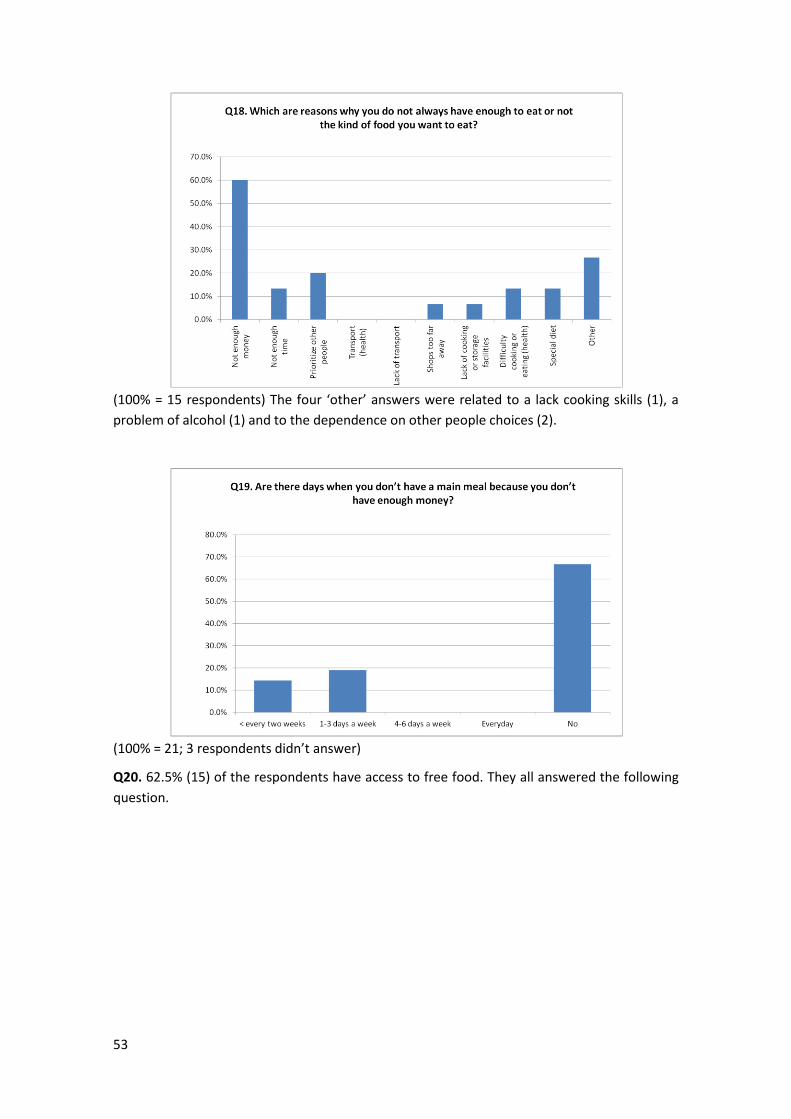
53
(100% = 15 respondents) The four ‘other’ answers were related to a lack cooking skills (1), a
problem of alcohol (1) and to the dependence on other people choices (2).
(100% = 21; 3 respondents didn’t answer)
Q20. 62.5% (15) of the respondents have access to free food. They all answered the following
question.
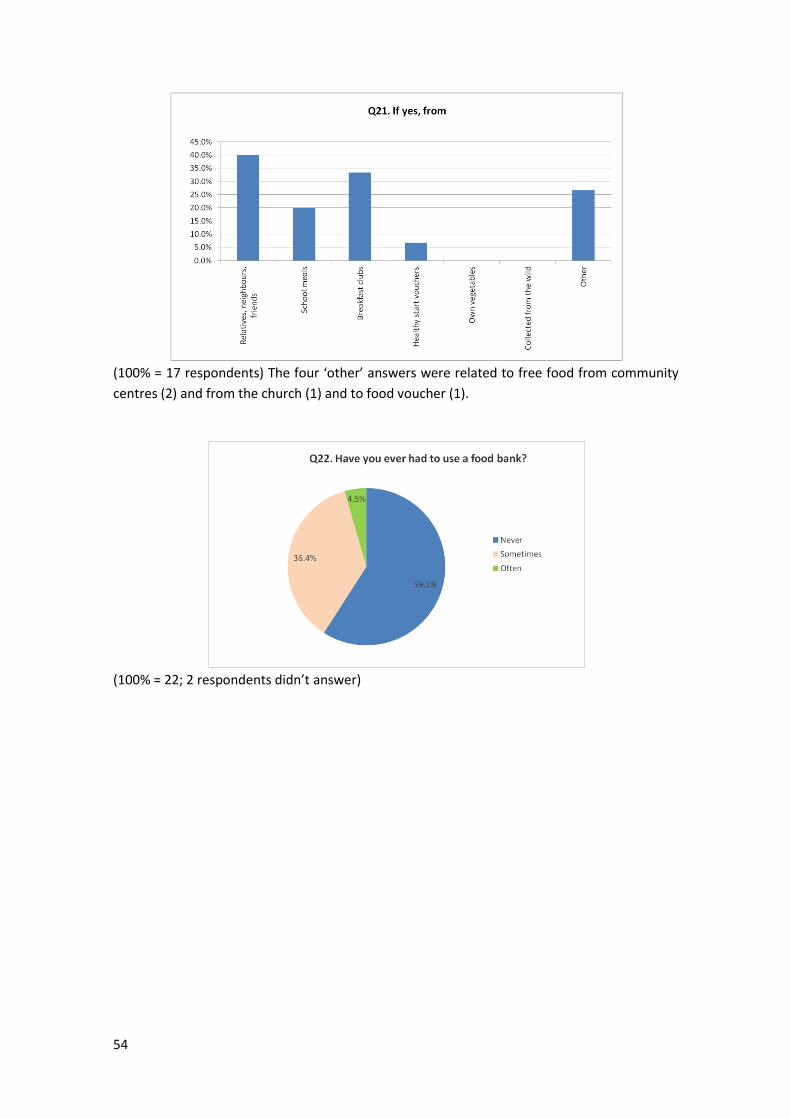
54
(100% = 17 respondents) The four ‘other’ answers were related to free food from community
centres (2) and from the church (1) and to food voucher (1).
(100% = 22; 2 respondents didn’t answer)
55
5. Findings from the lived experience interviews
Five interviews have been conducted between May and June 2016: two with users of a
Breakfast Club for people with addictions and long-term illness, two with young mothers on
low income and one with a user of the Migrant Hub. The five of them were unemployed, four
on benefits (one for health reason), and one with no resources (migrant). Three of the
respondents had families with young children.
In the following, the main themes and sub-themes identified during the lived interviews are
presented and illustrated by relevant quotes.
Eating habits
In agreement with the findings from the survey, respondents tend to have a low intake of
fruit & veg (4) and a high consumption of meat (3). Daily consumption of food high in sugar or
fat (3) and sugary drinks (2) have also been reported.
“Sausage & mash, we’d have that and if I’d got the veg we’d have veg with it. Chicken stir-fry; chicken and rice; roast dinner. Majority of time there hasn’t been veg to put veg in there. That’s like our meals really, that’s it.”
“My own diet’s not healthy. I like eating crisps, biscuits, chocolate. I’m trying to change but it’s really hard to resist. “
“Like chocolate or biscuits stuff like fizzy drinks. I wouldn’t say it’s bad bad, cos I’ve cut down a lot. [...] it used to be a lot worse.”
The fear of waste was reported by three of the respondents as a reason for not buying
much fresh food:
“Can’t afford waste.”
Only one respondent reported eating mostly home cooked food. The four other
respondents tend to rely on cheaper food with poor nutritional quality.
“It’s hard but normally we’ll go for the cheap prices. We’ll get the cheapest meat we’ll get the cheapest sauces or cheapest pasta. But that’s fine, [...] I add a bit of salt and pepper and it was fine.”
Two respondents expressed a preference for junk food:
“Like we used to eat junk food and not really eat meals at all but now it’s a lot better, like half and half.”
The problem related to cultural food pointed out by the survey has also been expressed by
the only respondent not from a UK background:
“My kids they like more African food’ Vegetable, meat & rice”
“Last week, the social worker gives us food bank. And today, food bank. Unfortunately, the food they give us, my kids don’t like it.”
Shopping habits
All the respondents expressed a preference for shopping in large supermarkets where food
is more affordable. Special offers and bargains have been reported by the five respondents as
an important factor in the choice of the shop:
“Lidl, Iceland, Aldi, Wilkinsons – cheap shops. I very rarely go in Morrisons because I think it’s very expensive. [...] I go in Poundland because they’ve got some good bargains like 12 toilet rolls for £1 – if I go in Iceland it’s 9 for £1. That’s what you have to do.”
“I usually go to Iceland cos you can get quite a bit in there. Milk in there is only 50p (UHT carton). Mainly prefer it as cheaper. I’m a person who likes to get more for my money so I
56
always look around for a bargain so I’ve always know Iceland is a bit cheaper than some supermarkets.”
Other factors that influence the choice are the proximity (2) and the transport (2) and the
presence of cultural food (1).
Food security
All the respondents said they sometimes or often worry that they will run out of food
because of a lack of money:
“Food has run out once before. Freezer was low and didn’t have the money. I panicked and then I though, Rich Tea biscuits and a bit of cheese on top, that’s a meal. I’ve been known to do that.”
“We do worry but that’s why we try and make it last.”
Similarly, all the respondents said that they can’t afford as much fresh food as they want:
“No, I don’t eat a much fresh food as I’d like to, I tend to eat more tinned food.”
“When the kids are hungry fruit doesn’t last as long as a pack of biscuits. Biscuits lasts longer so I’ve bought more of that. I can get a few packs of biscuits (5 packs for £2 in Iceland) which could last probably the week and then spend the same amount on the grapes that could last 2 days.”
“I’ve gone off of chicken because I can’t buy the sort I want to eat, cos I can’t afford it, cos I haven’t got a job.”
Four respondents reported no being able to always afford to eat balanced meal. Two of
them have days without a main meal because they don’t have money for food:
“All the time - or let’s say sometimes, because when the friends give us money, we have food. If they don’t give us money, we don’t have.”
At the question “Are you ever hungry because of a lack of food?”, one respondent
answered positively, for her and her children, but didn’t develop.
As a result, 2 respondents were at level 2 on the FIES scale (compromising quality and
variety of food), 2 respondents were at level 3 (reducing quantities, skipping meals) and 1 was
at level 4, experiencing severe food insecurity (experiencing hunger).
Causes - Financials
Financial issues were the main reason for being in food poverty for all the respondents. As
pointed out by the key workers, food is the first thing to be cut back when living on low
income (4), among others due to conflicting demands (fuel, bills, debts - rent arrears) (3):
“[Money for food] varies because I’ve only got benefits so I’ve got electric, rent, TV licence, council tax and then I’ve got to get shopping.”
“Lack of money, more like times when all bills come out or you’re a bit behind in something so you’ve got to top it up (rent arrears) or when the bank stupidly takes your money. I’m not working and he’s signed off sick (ESA) and we’re a bit behind on rent and council tax and that so we have to pay a bit extra to top that up. Then there’s the gas and electric and then travel. When we had the car it was always a tight budget.”
Two respondents reported paying higher fuel prices due to their key meter (poverty
premium) (2). Surprisingly, only one respondent commented on the food prices increase:
“I think if the prices of food weren’t so high it would be a lot easier to maintain actually being able to eat a lot more, a lot better.”
At the opposite of the key workers, the individual experiencing food poverty didn’t
especially complain about the benefits.
57
Causes - Access “The ideas are not the problem it’s not having the ingredients. There’s so many things we’d like to eat. [...] So stuff like meals we do enjoy, they are healthy and we enjoy them but it’s just too expensive to buy. That is the struggle.”
The issues related to a lack of affordable healthy food vs. the abundance of cheap junk-food
have already been pointed out in all the aspects of this study: mapping, healthy food basket,
key workers interviews and, to a lesser extent, the survey. This had been confirmed with the
lived experience interviews, the main reasons being the higher prices in the local shops (3) and
the limited options/poor quality in local shops (2):
“Coop is closest but more expensive. [...] Sometimes we can’t even afford to buy it, so we’ll buy like pasta and cheese, like maybe make a cheese pasta that’s cheap and easy to make.”
“Like if you want to get a meal you have to go to the Coop. There’s no other place you can go and that’s really expensive. But if you wanted to get junk food then there’s shops everywhere for that. So it’s like, in my eyes they’re promoting too much junk food to the healthy food. Because you step out there, there’s takeaways left-right-and-centre and there are tiny little shops that sell everything but normal food. It’s hard to say no when you’ve got the money and you don’t know what else to buy.”
Other issues related to food access were the lack of transports to shops (2) and the inability
to go to bigger shops wither better prices/quality (1):
“I would like to eat differently but it depends on shopping. Where there’s like a big shop in Asda it depends because like there’s a limited time we’ve got to go there because we have to wait because we haven’t got a car.”
“I’d like to live next to a big shopping centre, to be honest. I’d love it but obviously I can’t.”
Causes - Cooking facilities
The main issue related to cooking facilities was a limited storage (3), and in particular in the
freezer (2):
“And then with our freezer, where it’s so tiny we can only fit food in there that would last about a week, a week and a half max. [...] It does [influence shopping] cos sometimes we buy too much and can’t fit it in the freezer for it to last so it’ll go in the fridge and then we’d have a time limit to eat if otherwise it’ll go off. [...] And then we’re stuck with no food.”
Poor quality housing (1) and shared kitchen (1) were also reported:
“You know, I don’t know if I can complain, someone has given us the house, so ... so I just manage in it ... This person is doing help for us ... I cook in the kitchen and we eat in the room.”
“I can’t have raw veg in my place because it gets terribly warm and they get shrivelled. I’ve got potatoes indoors but they’re all sprouting.”
Causes - Education & skills
Three of the respondents showed a lack of healthy eating knowledge (3):
“As long of you have your 5 a day... I mean, I’m eating lots of beans so I’m ok. I used to have chips everyday in my own chip pan but I’ve cut back now. So I’m lucky if I have chips once a week. [...] I don’t eat much veg other than tinned stuff. The only veg I like is cucumber and tomatoes. Yes, I think my diet is healthy. It does what it does. At the end of the day I get by doing what I do.”
“Balanced diet, that includes everything really. Cos if you’re just eating vegetables and all that, that’s not really very healthy. You need the bad stuff and the good stuff to have a good diet. I suppose for us, we’ve been leaning more on the bad side. Like, I don’t know
58
how to explain it... we have our meals and our crap food. [...] With Ella [her 1 year-old baby] we give her as much proper food as she can have and then we have the crap food. [..] So it’s kind of like that’s our balanced diet. But for Ella, she’ll have her meals then for a snack, [...] she’ll have a biscuit. So that’s her balanced diet.”
One of the respondents had good cooking skills and was able to cook a complete meal from
scratch while three showed limited cooking skills. Lack of motivation/time and health
problems were reported as reasons for not cooking from scratch:
“Sometimes I don’t mind doing it [cooking] but sometimes if I’m tired, had a long day, I can’t be bothered. Sometimes I’d have beans on toast. Sometimes if we’ve got some spare change we’ll pop to the chip shop and get some chips.”
“It’s easier for me to use tinned stuff and packets. I mean the only thing I cook from basics is rice. At the moment I cook very rarely because I’m more tired than anything because I’m not well. Mainly I’m putting meals together from packets etc. rather than cooking from scratch, just basic really.”
Limited planning skills were showed by one of the respondents:
“I don’t know, I guess when I’m hungry I’ll feel like I want that more than the other. We tend to say like, we’ll have this tomorrow, or that but whether it goes to plan or not depends what we fancy. Have ingredients in so can choose.”
Coping strategies
Despite eventual lack of healthy eating knowledge and planning skills/wills, all the
respondents showed an excellent knowledge of all the prices in their neighbourhood, which
allow them to do their shopping lists and budget in function (4):
“I get a pen and paper and in the corner I put the days I’ve got to budget for and then I just put food down like sausage and mash. Then I work out how much money I’ve got left (after bills, gas/electric) and that’s what I’ve got for shopping.”
“I always do a shopping list and I’ve got loads of books at home that’s got each payment in and what gets spent and working out how much you’ve got for shopping.”
“So we think of the good set meals we have, then we have a certain amount of money, a target, and we’ll go around and get all those things, add them up on my phone calculator and then if we’ve got anything left we’ll just go around and pick what we want after that.”
Three of the respondents mentioned that they were shopping around in different shops,
taking advantages of the best deals of each shop:
“You know, you get something there, something there, depending on the prices. You can save a fiver like that on your shopping.”
“You have to weight up the options cos sometimes you can get chicken in Iceland for £4 and say you can get that in Tesco for £2.50 but how much are you getting out of it, like in Iceland it’s more expensive but I can do more with that (larger pack will do more meals). Weigh up options so I know how much I’m getting out of it. I’ve shopped there for quite a while so I roughly know what I’m getting.”
“Iceland have a deal on their milk at the moment 4 pints for 89p. We’ll go down to the town centre because it’s a better deal and it’s on the doorstep.”
Sharing shopping to decrease cost was also mentioned by one of the respondents:
“I’m helping my sister out at the moment because she hasn’t got any money. [...] So we combine my bit of money with her bit of money and we do a big shop. So we share. Once a month. [...] We help each other out. Without each other we’re lost."
When running out of money for food, the respondents reported relying on biscuits and
cheap processed food (3) and on “filling” food (2):
“We eat rice all the time, it’s filling and that’s cheap.”
59
“We’ll get the stuff that we know will fill us up. Like sausage rolls should fill you up because of the pastry and that so you’ve got those kinds of foods that take away the hunger for a while.”
The respondent at the highest level of food poverty on the FIES scale reported cooking by
batches, to save on fuel and to buy ingredients by large quantities:
“[Cook from scratch] once in a week; I put it in the fridge or freeze and then defrost when we are ready to eat. It’s cheaper to do it like that.”
Among the three respondents with children, coping strategies included prioritizing food for
children before themselves (2) and relying on free meals to help meet nutritional
requirements/prevent hunger (school meals and community meals) (2):
“It all depends on money I’ve got. Sometimes if it’s a really small amount it’s a bit tight. [...] So you’d go without but you make sure kids have something. Try to make sure they’re eating all right.”
“Even if it’s only beans on toast for dinner, I know the kids have had a full dinner at school so it’s not going to harm them.”
Help and support
Four of the respondents showed having support from their family in situation of crisis (4)
“If I’ve run out and I’m low, I can ask my mum to lend me a fiver.”
“He’s asked his dad (his dad owns a shop) so when we had the car we took it down there and his did said, ‘take what you want’. He doesn’t like asking cos he’s off work ill so he has that feeling his dad’s going to moan at him. I don’t think his dad understands the whole situation, how he got signed off work sick.”
“Cos maybe my mum’s done it or Ry’s mum did [put gas and electric], then we’d have that extra £40-50 to put towards the shopping. So it’s stuff like that that tends to help but obviously we’ve got family there to help but obviously we can’t lean on them too much so it does vary quite a lot.”
and two from friends and social network. Three reported having using food banks:
“The food bank is ideal, I just say if I need some coffee, if they’ve got it they’ve got it. You don’t want it too regular or people take the piss.”
“ Last week, the social worker gives us food bank. And today, food bank. Unfortunately, the food they give us, my kids don’t like it.”
The Healthy Start Vouchers [16] appears to be a good support for families (2):
“It’s not necessarily the fruit and veg we struggle with cos of my coupons I’ll always have some sort of fruit and veg in this house. Always. Cos I love my fruit and vegetables is a must really.”
The importance of community meals such as lunch clubs was highlighted (3):
"This place [breakfast club] has been a diamond, I’ve only been coming for a few months. If it hadn’t been for these ladies and their help and support I don’t know where I’d be. They’ve got a mobile phone and I was able to get help with the hospital and doctors.”
“Now that I just discovered this place [Migrant Hub], like today, I told my kids we are coming here to have our food, so we walked down here. Last week, the social worker gives us food bank.”
One of the respondents reported having improved his diet after attending a 6-weeks
cookery club:
“I used to eat much more junk food but I changed my diet lately, thanks to the cookery club, among other. And I feel much better inside now.”
60
VIII. References
1. Hungry for Change. Fabian Commission on Food and Poverty. 2015. 2. Choosing a better diet: a food and health action plan. London: Department of Health.
2005. 3. Press V. Nutrition and Food Poverty Toolkit. National Heart Forum. 2004. 4. Mwatsama M, Stewart L. Food Poverty and Health. Faculty of Public Health, Briefing
Statement. 2005. 5. Hall S, Knibbs S, Medien K, Davies G. Child Hunger in London. Ipsos MORI for Greater
London Authority. 2013. 6. Cooper N, Purcell S, Jackson R. Below the Breadline: The relentless rise of food poverty
in Britain. Church Action on Poverty, Oxfam GB and Trussell Trust. 2014. 7. Beyond the Food Bank - London Food Poverty Profile. Sustain. 2015. 8. Taylor A, Loopstra R. Too Poor to Eat - Food insecurity in the UK. The Food Foundation.
2016. 9. A route map to ending hunger as we know it in the United Kingdom - Feeding Britain in
2015-16. All-Party Parliamentary Inquiry into Hunger in the UK. 2015. 10. Royal Borough of Greenwich [Internet]. [cited 2016 Jun 15]. Available from:
www.royalgreenwich.gov.uk 11. Greenwich Co-operative Development Agency (GCDA) [Internet]. [cited 2016 May 18].
Available from: www.gcda.coop 12. Good Food in Greenwich [Internet]. [cited 2016 Jun 18]. Available from:
www.goodfoodingreenwich.org 13. Donkin AJM, Dowler EA, Stevenson SJ, Turner SA. Mapping access to food at a local
level. British Food Journal. 1999;101(7):554–64. 14. Donkin AJM, Dowler EA, Stevenson SJ, Turner SA. Mapping access to food in a deprived
area: the development of price and availability indices. Public Health Nutrition. 2000;3(01):31–8.
15. Feeding Britain - A strategy for zero hunger in England, Wales, Scotland and Northern Ireland. All-Party Parliamentary Inquiry into Hunger in the UK. 2014.
16. Healthy Start [Internet]. [cited 2016 Jun 28]. Available from: www.healthystart.nhs.uk 17. Time to count the hungry: the case for a standard measure of household food
insecurity in the UK. Food Poverty Workshop Report, London; 2016. 18. Ballard T, Kepple A, Cafiero C, Schmidhuber J. Better measurement of food insecurity in
the context of enhancing nutrition. Ernahrungs Umschau. 2014;61(2):38–41. 19. Households Below Average Income: An analysis of the income distribution 1994/95 to
2013/14. Department for Work & Pensions (UK). 2015. 20. Douglas F, Ourega-Zoé Ejebu, Garcia A, MacKenzie F, Whybrow S, McKenzie F, et al. The
nature and extent of food poverty. NHS Health Scotland. 2015. 21. English Index of Multiple Deprivation 2015 [Internet]. [cited 2016 Jun 15]. Available
from: https://www.gov.uk/government/statistics/english-indices-of-deprivation-2015 22. Lower Layer Super Output Area (LSOA) [Internet]. [cited 2016 Jun 15]. Available from:
https://data.gov.uk/dataset/lower-layer-super-output-areas-lsoas 23. Nelson M, Erens B, Bates B, Church S, Boshier T. Low Income Diet and Nutrition Survey.
TSO; 2007. 24. National Diet and Nutrition Survey: Results from Years 1-4 (combined) of the Rolling
Programme (2008/2009 – 2011/12): Executive summary. Public Health England. 2014. 25. Lee A, Mhurchu CN, Sacks G, Swinburn B, Snowdon W, Vandevijvere S, et al. Monitoring
the price and affordability of foods and diets globally. Obesity Reviews. 2013;14(S1):82–95.
26. Seligman HK, Schillinger D. Hunger and Socioeconomic Disparities in Chronic Disease.
61
New England Journal of Medicine. 2010 Jul;363(1):6–9. 27. Kirkpatrick SI, McIntyre L, Potestio ML. Child Hunger and Long-term Adverse
Consequences for Health. Archives of Pediatrics & Adolescent Medicine. 2010;164(8):781–6.
28. Hancock C, Bettiol S, Smith L. Socioeconomic variation in height : analysis of National Child Measurement Programme data for England. Archives of disease in childhood. 2015;1–5.
29. White M, Bunting J, Williams L, Raybould S, Adamson A, Mathers J. Do food deserts exist? A multi-level, geographical analysis of the relationship between retail food access, socio-economic position and dietary intake. Food Standards Authority, London; 2004.
30. Cummins S, Smith DM, Aitken Z, Dawson J, Marshall D, Sparks L, et al. Neighbourhood deprivation and the price and availability of fruit and vegetables in Scotland. Journal of human nutrition and dietetics. 2010;23(5):494–501.
31. Smith DM, Cummins S, Taylor M, Dawson J, Marshall D, Sparks L, et al. Neighbourhood food environment and area deprivation: spatial accessibility to grocery stores selling fresh fruit and vegetables in urban and rural settings. International journal of epidemiology. 2010;39(1):277–84.
32. Bowyer S, Caraher M, Eilbert K, Carr-Hill R. Shopping for food: lessons from a London borough. British Food Journal. 2009;111(5):452–74.
33. Anderson A, Dewar J, Marshall D, Cummins S, Taylor M, Dawson J, et al. The development of a healthy eating indicator shopping basket tool (HEISB) for use in food access studies-identification of key food items. Public health nutrition. 2007;10(12):1440–7.
34. Sauveplane-Stirling V, Crichton D, Tessier S, Parrett A, Garcia AL. The food retail environment and its use in a deprived, urban area of Scotland. Public Health. 2014;128(4):360–6.
35. Master’s Thesis No107277 (Supervisor: Steve Cummins). Assessing Neighbourhood Accessibility to a Healthy Diet in Inner London: a Cross-Sectional Study Using Food Price Data and Geographic Information Systems. London School of Hygiene & Tropical Medicine; 2014.
36. INFORMAS, International Network for Food and Obesity / non-communicable Diseases Research, Monitoring and Action Support [Internet]. [cited 2016 Jun 15]. Available from: www.informas.org
37. Jones NR V., Conklin AI, Suhrcke M, Monsivais P, Mozaffarian D, Appel L, et al. The Growing Price Gap between More and Less Healthy Foods: Analysis of a Novel Longitudinal UK Dataset. PLoS ONE. 2014;9(10):e109343.
38. Nelson M, Erens B, Bates B, Church S, Boshier T. Low income diet and nutrition survey: Report appendices. TSO; 2007.
39. Families 1st [Internet]. [cited 2016 Jun 26]. Available from: www.royalgreenwich.gov.uk/info/200017/children_and_family_care/1391/family_advice_and_support
40. Food Standards Agency [Internet]. [cited 2016 Jun 25]. Available from: www.food.gov.uk