Embed Size (px)
Citation preview


Praise for The Natural Gas Revolution
“Robert Kolb has written an excellent and comprehensive volume on the changing energy landscape. Both specialists and non-experts will benefit from the deep analysis he provides.”
—Gawdat Bahgat, Professor of National Security, National Defense University’s Near East South Asia Center for Strategic Studies
“…a very comprehensive scan of the gas landscape with associated shifts from unconventional developments.”
—Matthew Hulbert, Chief Political Advisor, Saudi Aramco
“I have gone over [this] fine effort and can find no reason to be critical or even add anything! Very well done and easy to understand. I enjoyed [the] sections on shale plays and China very much.”
—Randy Brown, Managing Partner, Tremont House Enterprises (Energy Group)
“I was very impressed with the in-depth information and historical data the book provides. It should be required reading for anyone in the industry now and in particular new employees coming into the energy business to help them understand the ‘big picture’ when it comes to energy in the world.”
—Paul Belflower, Vice President, Marketing & Supply, Mustang Fuel Corporation/Mustang Fuel Marketing
“In this crisp and compact book, Robert Kolb pulls together the fast, world-changing transformation in energy across the globe. As dessert, we get a delicious treat of maps and charts that make the new picture visually clear. If you want to understand how your world may change, read this book.”
—Steve LeVine, author of The Oil and the Glory
“This book is a ‘must read’ for anyone working in or interested in the natural gas industry. Kolb’s discourse is eloquent and very insightful as he takes the reader through history up to present day of the natural gas revolution. The book is a pleasure to read!”
—Betty J. Simkins, Professor of Finance and Williams Companies Professor of Business, Spears School of Business, Oklahoma State University
9780133353518_Book 1.indb i 7/24/13 10:25 AM

“In The Natural Gas Revolution, Robert Kolb presents a thorough yet readable insight into the natural gas industry and its prospects for the future. While he does not shy away from explanation of the technical aspects of natural gas production, he does so in a manner that makes the concepts understandable to a reader with no background in the industry. Neither does he avoid the controversy surrounding fracking and other environmental concerns. The book is well researched and documented and a compelling read even for those of us who are familiar with the energy sector. Anyone concerned with the future of energy on a domestic or global scale should find a few hours with this book as time well spent.”
—James L. Williams, WTRG Economics
9780133353518_Book 1.indb ii 7/24/13 10:25 AM

The Natural Gas Revolution
9780133353518_Book 1.indb iii 7/24/13 10:25 AM

This page intentionally left blank
The Natural Gas Revolution
Robert W. Kolb
At the Pivot of the World’s Energy Future
9780133353518_Book 1.indb v 7/24/13 10:25 AM

Vice President, Publisher: Tim Moore Associate Publisher and Director of Marketing: Amy Neidlinger Executive Editor: Jim Boyd Development Editor: Russ Hall Operations Specialist: Jodi Kemper Marketing Manager: Lisa Loftus Cover Designer: Chuti Prasertsith Managing Editor: Kristy Hart Senior Project Editor: Jovana San Nicholas-Shirley Project Editor: Elaine Wiley Copy Editor: Kitty Wilson Proofreader: Anne Goebel Senior Indexer: Cheryl Lenser Senior Compositor: Gloria Schurick Manufacturing Buyer: Dan Uhrig
© 2014 by Robert W. Kolb Publishing as Pearson Upper Saddle River, New Jersey 07458
Pearson offers excellent discounts on this book when ordered in quantity for bulk purchases or special sales. For more information, please contact U.S. Corporate and Government Sales, 1-800-382-3419, [email protected] . For sales outside the U.S., please contact International Sales at [email protected] .
Company and product names mentioned herein are the trademarks or registered trade-marks of their respective owners.
All rights reserved. No part of this book may be reproduced, in any form or by any means, without permission in writing from the publisher.
Printed in the United States of America
First Printing August 2013
ISBN-10: 0-13-335351-6 ISBN-13: 978-0-13-335351-8
Pearson Education LTD. Pearson Education Australia PTY, Limited. Pearson Education Singapore, Pte. Ltd. Pearson Education Asia, Ltd. Pearson Education Canada, Ltd. Pearson Educación de Mexico, S.A. de C.V. Pearson Education—Japan Pearson Education Malaysia, Pte. Ltd.
Library of Congress Control Number: 2013940896
9780133353518_Book 1.indb vi 7/24/13 10:25 AM

To Lori.
9780133353518_Book 1.indb vii 7/24/13 10:25 AM

This page intentionally left blank

Contents
Preface . . . . . . . . . . . . . . . . . . . . . . . . . . . . . . . . . . . . . . . . xv
A Note on Energy Values and Conversions. . . . . . . . . . . . . xix
Plates . . . . . . . . . . . . . . . . . . . . . . . . . . . . . . . . . . . . . . . . . . 1
Plate 1: The Structure of Oil and Gas Reservoirs . . . . . . . . 1Plate 2: The Natural Gas Resource Triangle . . . . . . . . . . . . 2Plate 3: Unconventional Natural Gas and Oil Plays in the
United States . . . . . . . . . . . . . . . . . . . . . . . . . . . . . . 3Plate 4: The Barnett and Eagle Ford Shale Formations. . . 4Plate 5: The Marcellus and Utica Shale Formations. . . . . . 5Plate 6: The Bakken Shale Formation . . . . . . . . . . . . . . . . . 6Plate 7: The Process for Liquefying Natural Gas . . . . . . . . 7Plate 8: The South Pars and North Fields of Qatar and
Iran. . . . . . . . . . . . . . . . . . . . . . . . . . . . . . . . . . . . . . 8Plate 9: The Shale Gas Basins of China . . . . . . . . . . . . . . . . 9Plate 10: The Constricted Sea Lanes of the Middle East . . 10Plate 11: The Constricted Sea Lanes of Southeast Asia . . . 11Plate 12: The South China Sea and Its Contested Regions:
Paracel Islands, the Spratly Islands, the Senkaku/Diaoyu Islands, and the Scarborough Shoal . . . . . . 12
Plate 13: Principal Shale Basins of Western Europe. . . . . . 13Plate 14: The Nord Stream Pipeline . . . . . . . . . . . . . . . . . . 14Plate 15: Pipelines of the Southern Corridor . . . . . . . . . . . 15Plate 16: Gas Fields of Southern South America . . . . . . . . 16Plate 17: General Map of Central Asia . . . . . . . . . . . . . . . . 17Plate 18: Major International Pipelines from Iran and
Central Asia Eastward. . . . . . . . . . . . . . . . . . . . . . 18Plate 19: Turkmenistan’s Key Pipelines. . . . . . . . . . . . . . . . 19Plate 20: Pipelines from the Caspian Sea Westward. . . . . . 20Plate 21: Gas Fields of the Eastern Mediterranean . . . . . . 21Plate 22: Gas Fields of Tanzania and Mozambique . . . . . . 22Plate 23: The Monterey Shale . . . . . . . . . . . . . . . . . . . . . . . 23Plate 24: Typical Methane Hydrate Deposits . . . . . . . . . . . 24Plate 25: The Pressure and Temperature Interface for
Methane Hydrates. . . . . . . . . . . . . . . . . . . . . . . . . 25
9780133353518_Book 1.indb ix 7/24/13 10:25 AM

x THE NATURAL GAS REVOLUTION
Chapter 1 To the Brink of Innovation . . . . . . . . . . . . . . . . . . . . . . . . 27
World Energy—A Rapid Tour of the Past 200 Years . . . . . 27Hydrocarbons: From the Beginnings to Maturity . . . . . . . . 32A Rude Awakening . . . . . . . . . . . . . . . . . . . . . . . . . . . . . . . . 34U.S. Oil and Natural Gas at the Turn of the Millennium . . 35Notes . . . . . . . . . . . . . . . . . . . . . . . . . . . . . . . . . . . . . . . . . . . 41
Chapter 2 They Call It a Revolution . . . . . . . . . . . . . . . . . . . . . . . . . 45
The Early History of Natural Gas . . . . . . . . . . . . . . . . . . . . 46The Creation of Oil and Natural Gas. . . . . . . . . . . . . . . . . . 48The Basics of Extraction, Production, and Completion . . . 52Hydraulic Fracturing . . . . . . . . . . . . . . . . . . . . . . . . . . . . . . 54Horizontal Drilling . . . . . . . . . . . . . . . . . . . . . . . . . . . . . . . . 56Contrasting Conventional and Unconventional Gas and Oil Production Techniques . . . . . . . . . . . . . . . . . . . . . . . . . 58Unconventional Gas Resources and Production in the United States. . . . . . . . . . . . . . . . . . . . . . . . . . . . . . . . . . . . . 60The U.S. Position in Natural Gas . . . . . . . . . . . . . . . . . . . . . 64World Natural Gas Resources . . . . . . . . . . . . . . . . . . . . . . . 66Notes . . . . . . . . . . . . . . . . . . . . . . . . . . . . . . . . . . . . . . . . . . . 69
Chapter 3 Liquid Natural Gas and the World Gas Revolution . . . . . 73
Creating and Shipping LNG . . . . . . . . . . . . . . . . . . . . . . . . 74The LNG Industry . . . . . . . . . . . . . . . . . . . . . . . . . . . . . . . . 78The LNG Infrastructure Today . . . . . . . . . . . . . . . . . . . . . . 83The Potential for Exports of U.S. Natural Gas . . . . . . . . . . 88LNG Pricing and Markets . . . . . . . . . . . . . . . . . . . . . . . . . . 94Notes . . . . . . . . . . . . . . . . . . . . . . . . . . . . . . . . . . . . . . . . . . . 98
Chapter 4 Environmental Costs and Benefits . . . . . . . . . . . . . . . . . 101
Water Supply. . . . . . . . . . . . . . . . . . . . . . . . . . . . . . . . . . . . 102Fracking Fluid. . . . . . . . . . . . . . . . . . . . . . . . . . . . . . . . . . . 107Hydraulic Fracturing and Aquifers . . . . . . . . . . . . . . . . . . 110“Produced Water”. . . . . . . . . . . . . . . . . . . . . . . . . . . . . . . . 116Air Quality and the Industry’s Carbon Footprint . . . . . . . 119Physical Effects at the Earth’s Surface . . . . . . . . . . . . . . . 121The Social Dimension. . . . . . . . . . . . . . . . . . . . . . . . . . . . . 122Conclusion: From Coal to Natural Gas or from Natural Gas to Coal? . . . . . . . . . . . . . . . . . . . . . . . . . . . . . . . . . . . . . . . . 124Notes . . . . . . . . . . . . . . . . . . . . . . . . . . . . . . . . . . . . . . . . . . 127
9780133353518_Book 1.indb x 7/24/13 10:25 AM

CONTENTS xi
Chapter 5 The United States and China . . . . . . . . . . . . . . . . . . . . . 133
Energy in the United States and China . . . . . . . . . . . . . . . 133China’s Shale Gas Resources . . . . . . . . . . . . . . . . . . . . . . . 139Energy Imports for China and the United States . . . . . . . 143The Geopolitical Dimension of Energy Imports. . . . . . . . 148The Shale Gas Revolution and the Future of Energy Geopolitics . . . . . . . . . . . . . . . . . . . . . . . . . . . . . . . . . . . . . 153Notes . . . . . . . . . . . . . . . . . . . . . . . . . . . . . . . . . . . . . . . . . . 155
Chapter 6 The World’s Other Large Economies. . . . . . . . . . . . . . . 159
Japan . . . . . . . . . . . . . . . . . . . . . . . . . . . . . . . . . . . . . . . . . . 165The Eurozone Economies: Germany, France, and Italy. . . . . . . . . . . . . . . . . . . . . . . . . . . . . . . . . . . . . . . . 167Russian Federation . . . . . . . . . . . . . . . . . . . . . . . . . . . . . . . 172United Kingdom . . . . . . . . . . . . . . . . . . . . . . . . . . . . . . . . . 178India and Brazil. . . . . . . . . . . . . . . . . . . . . . . . . . . . . . . . . . 180Conclusion. . . . . . . . . . . . . . . . . . . . . . . . . . . . . . . . . . . . . . 186Notes . . . . . . . . . . . . . . . . . . . . . . . . . . . . . . . . . . . . . . . . . . 187
Chapter 7 The Other Contending Nations. . . . . . . . . . . . . . . . . . . . 191
Iran, Qatar, and Iraq. . . . . . . . . . . . . . . . . . . . . . . . . . . . . . 192Central Asia and Turkey . . . . . . . . . . . . . . . . . . . . . . . . . . . 197The “Quiet Exporters” . . . . . . . . . . . . . . . . . . . . . . . . . . . . 202Poland and Ukraine . . . . . . . . . . . . . . . . . . . . . . . . . . . . . . 204Australia. . . . . . . . . . . . . . . . . . . . . . . . . . . . . . . . . . . . . . . . 207The Eastern Mediterranean . . . . . . . . . . . . . . . . . . . . . . . . 209Mozambique and Tanzania . . . . . . . . . . . . . . . . . . . . . . . . 211Argentina. . . . . . . . . . . . . . . . . . . . . . . . . . . . . . . . . . . . . . . 212Conclusion. . . . . . . . . . . . . . . . . . . . . . . . . . . . . . . . . . . . . . 214Notes . . . . . . . . . . . . . . . . . . . . . . . . . . . . . . . . . . . . . . . . . . 215
Chapter 8 The Next Energy Revolutions . . . . . . . . . . . . . . . . . . . . . 221
The Shale Oil Revolution . . . . . . . . . . . . . . . . . . . . . . . . . . 221The Bakken Play . . . . . . . . . . . . . . . . . . . . . . . . . . . . . . . . . 223The Eagle Ford in Texas . . . . . . . . . . . . . . . . . . . . . . . . . . 225The Monterey Shale . . . . . . . . . . . . . . . . . . . . . . . . . . . . . . 227The Tight Oil Effect . . . . . . . . . . . . . . . . . . . . . . . . . . . . . . 229A Methane Hydrate Energy Revolution? . . . . . . . . . . . . . 231A Concluding Note . . . . . . . . . . . . . . . . . . . . . . . . . . . . . . . 234Notes . . . . . . . . . . . . . . . . . . . . . . . . . . . . . . . . . . . . . . . . . . 235
9780133353518_Book 1.indb xi 7/24/13 10:25 AM

References . . . . . . . . . . . . . . . . . . . . . . . . . . . . . . . . . . . . 239
Index. . . . . . . . . . . . . . . . . . . . . . . . . . . . . . . . . . . . . . . . . 265
9780133353518_Book 1.indb xii 7/24/13 10:25 AM

Acknowledgments
Like any other author, I have a variety of debts that it is my plea-sure to acknowledge. First, I would like to thank my home institu-tion, the Quinlan School of Business at Loyola University, Chicago, for its continuing support of my research program and for giving me the freedom to pursue my interests, wherever they lead. Ira G. Liss in Boulder, Colorado, prepared the many maps and diagrams that appear in this book. I believe they add considerably to the clarity of the story I have to tell. I wish I had had access to them as I did the research for this book! I would also like to thank Jim Boyd and Russ Hall at Pearson/FT Press. Jim was committed to the book from first hearing, or at least so it seemed. Russ was always prompt and helpful in shepherding the book through its development. I would also like to thank the editor of the Journal of Social, Political, and Economic Studies , Roger Pearson, for his continuing interest in my work.
A number of people have been very helpful in reviewing a pre-liminary draft of the text and making helpful comments. I would espe-cially like to offer my sincere appreciation to: Steve LeVine, author of The Oil and the Glory; Betty Simkins, the Williams Energy Com-panies Professor of Finance at Oklahoma State University; Matthew Hulbert, Chief Political Advisor for Saudi Aramco; Randy Brown at Tremont House Enterprises; Paul Belflower at Mustang Fuel Corpo-ration; Gawdat Bahgat at the National Defense University; and Jim Williams, at WTRG Economics.
9780133353518_Book 1.indb xiii 7/24/13 10:25 AM

About the Author
Robert W. Kolb holds two Ph.D.’s from the University of North Carolina at Chapel Hill (philosophy 1974, finance 1978) and has been a finance professor at five universities. He is currently a professor of finance at Loyola University Chicago, where he also holds the Consi-dine Chair of Applied Ethics.
Kolb’s recent writings include Futures, Options, and Swaps 5e , and Understanding Futures Markets 6e, both co-authored with James A. Overdahl. Recent edited volumes are: Lessons from the Financial Crisis: Causes, Consequences, and Our Economic Future, Sovereign Debt: From Safety to Default , and Financial Contagion: The Viral Threat to the Wealth of Nations , both published by Wiley. Kolb’s most recent books are The Financial Crisis of Our Time (2011) and Too Much Is Not Enough: Incentives in Executive Compensation (2012), both published by Oxford University Press and both selected for the Financial Management Association’s Survey and Synthesis Series.
9780133353518_Book 1.indb xiv 7/24/13 10:25 AM

Preface
We live in the midst of a revolution in energy that has already changed the energy future of the United States and now is beginning to transform the rest of the world as well. Because energy is so vital to all modern economies, these developments are rearranging the relative strengths of many of the most important nations in the world. This book tells the story of how this revolution began, where it stands now, and how it is likely to transform the world.
Less than 10 years ago, the United States faced what appeared to be a permanent fate of massive imports of oil and natural gas. In the ensuing years, the country has suffered a massive financial crisis, has endured a deep and persistent recession, and currently struggles through a period of less-than-satisfying anemic economic growth. This malaise has been accompanied by the dynamic rise of China and the perception of many that the United States is on an irretrievable path toward losing its customary preeminence and, perhaps, even to becoming a second-tier nation. In addition, environmental problems in the form of climate change have been gaining increased world attention. Compared to many other leading nations, the United States has done little to address its carbon footprint. There has been almost unanimous agreement that reducing carbon emissions is going to be extremely difficult in an economy used to relying on hydrocarbon energy sources.
Much—perhaps all—of that anticipated dismal future is no lon-ger part of the forecast for the United States. Because of remarkable technological advances in accessing energy and a continuing wave of new discoveries of gas and oil, it now appears almost certain that the United States will soon become a reliable net exporter of energy. Largely benefiting from improved methods in petroleum geology, major new discoveries are occurring almost monthly around the
9780133353518_Book 1.indb xv 7/24/13 10:25 AM
xvi THE NATURAL GAS REVOLUTION
world, even in areas long thought to be bereft of oil or gas, such as the eastern Mediterranean and the shores of Tanzania and Mozambique.
In the United States, geologists have long known of enormous quantities of gas and oil trapped in deep strata of shale and other sedimentary rocks that have held them inaccessible and beyond the reach of existing technology. But the twin technological innovations of hydraulic fracturing (“fracking”) and horizontal drilling have unlocked these resources and led to an energy renaissance in the United States. Over the same time, the world has extended its ability to ship gas in liquid form around the world, opening economic possibilities that have long been closed and freeing some nations from the grasp of limited supply options.
For 40 years, many of the world’s large economies, including those of the United States, Western Europe, and Japan, have been held as virtual energy hostages, a precarious circumstance of deep concern to policymakers and much of the public. This dependency of the West has been made worse by the nature of the countries that have been the world’s energy jail keepers: Russia and the exporting nations of the Mideast. Following the United States, other nations are starting to extract their own shale gas and oil resources that appear to be abundant and widely distributed around the globe. Even nations that truly possess no gas or oil, such as Japan, can now at least look forward to a variety of suppliers, including many allies.
Chapter 1 , “To the Brink of Innovation,” examines the U.S. energy situation just after the turn of the twenty-first century. It was not a pretty picture. U.S. oil production peaked in 1970 and fell steadily for almost 40 years, until 2008. The United States also faced a serious deficit of natural gas and a future of gas imports. The longstanding failure to develop alternative energy sources, an inability to confront the problems of global climate change, and a general environmen-tally inspired hostility toward hydrocarbon sources of energy all con-spired to create quite a serious energy situation. Yet unknown to almost everyone, the United States was about to enjoy a sudden large
9780133353518_Book 1.indb xvi 7/24/13 10:25 AM

PREFACE xvii
increase in energy production. In 2008, as if from another planet, came the first significant increase in oil production.
In contemporary public discourse in the United States, few topics generate more passion than the technology behind the new wave of energy production. Chapter 2 , “They Call It a Revolution,” explains this technology in nontechnical terms. Opponents of hydraulic frac-turing fear that the process will taint aquifers on which populations depend for their very lives. The technique requires the pumping of water, sand, and chemicals into a well under high pressure to fracture the shale beds in which the gas or oil has been locked. Doing so frees the gas or oil to flow into the well and to the earth’s surface for cap-ture and use. While hydraulic fracturing has been in use for decades, what makes the technique so newly powerful is its combination with horizontal drilling. The sedimentary rocks containing the gas or oil lie in horizontal beds. To reach into them, the driller sinks a vertical well for some distance and then turns the drill to operate at a 90-degree angle and to traverse the shale bed. From any point of view, the abil-ity to drill horizontally at a depth of a mile or more below the earth’s surface is a marvelous technological tour de force.
Merely acquiring energy without a means of transporting it to the point of use remains only a half-achievement. Chapter 3 , “Liq-uid Natural Gas and the World Gas Revolution,” explains the long, slow, and now-maturing development of a worldwide transportation network that allows natural gas to be liquefied by chilling, pumped onto ships, transported to its destination, re-gasified, and then taken to the ultimate consumer. This aspect of the gas revolution is impor-tant because it allows producing nations to cash in on their newly dis-covered bounty, and it also makes it possible for receiving countries to secure needed energy resources at a more favorable price and to diversify their suppliers.
Chapter 4 , “Environmental Costs and Benefits,” considers the very real environmental challenges of the natural gas revolution. As mentioned, these include the danger of polluting critical water
9780133353518_Book 1.indb xvii 7/24/13 10:25 AM

xviii THE NATURAL GAS REVOLUTION
sources. But there are a number of other issues as well, including water consumption, the disposal of water laced with chemical and other pollutants generated in the production process, the disturbance of the land around the well site, and the changes that are brought to communities rich in these newly accessible resources. If all these challenges can be addressed successfully, we still face the issue of relying on hydrocarbons as opposed to once and for all, somehow, making a rapid transition to truly renewable and carbon-neutral sources of energy. There is another side to the environmental balance sheet, however. While waiting for the perfect world of completely renewable energy to arrive, substituting natural gas for coal and oil promises significant environmental benefits. Generating electricity by burning natural gas rather than coal is much cleaner. China derives 70% of all its energy from coal, and the environmental costs of that policy are well known. Also, as the United States moves ever more away from coal and toward natural gas for electricity generation, the large economies of the Eurozone are becoming more coal dependent as they close gas-fired plants and accelerate the building of coal-fired power plants.
Chapter 5 , “The United States and China,” begins an extended treatment of the effects of the world energy revolution as it will play out around the world. The United States and China have the two larg-est economies in the world, and both stand to be major beneficiaries from the natural gas revolution. The United States has already begun to cash in, while China sits atop the world’s largest shale gas reserves, waiting to be tapped once China succeeds in assembling the neces-sary expertise and infrastructure. Chapter 6 , “The World’s Other Large Economies,” turns attention to the other eight countries that make up the world’s 10 largest economies: Japan, Germany, France, Italy, the United Kingdom, Brazil, India, and Russia. As we will see, most of these countries are beneficiaries of the natural gas revolution, but Russia almost certainly will be a big loser.
9780133353518_Book 1.indb xviii 7/24/13 10:25 AM

PREFACE xix
Beyond the big 10 economies, many other nations have a stake in the natural gas revolution, and Chapter 7 , “The Other Contending Nations,” explores the role that these countries will play. Iran, Qatar, and Turkmenistan, occupying second through fourth places in total world reserves of natural gas, following Russia in first place, have dif-ferent problems and opportunities. But many other countries are also dramatically affected, ranging from Argentina to Australia, Turkey to Tanzania, and Malaysia to Mozambique. Developments in the world energy revolution have brought many small or even previously insig-nificant producing countries into the energy spotlight.
Chapter 8 , “The Next Energy Revolutions,” the book’s conclud-ing chapter, considers two further energy revolutions that are on the horizon. The first of these is the development of shale oil on par-allel with what is already well under way with shale gas. The chapter also introduces a completely new and untapped resource that is the world’s largest hydrocarbon resource—the mysterious and previously inaccessible “fire ice”—or methane hydrates.
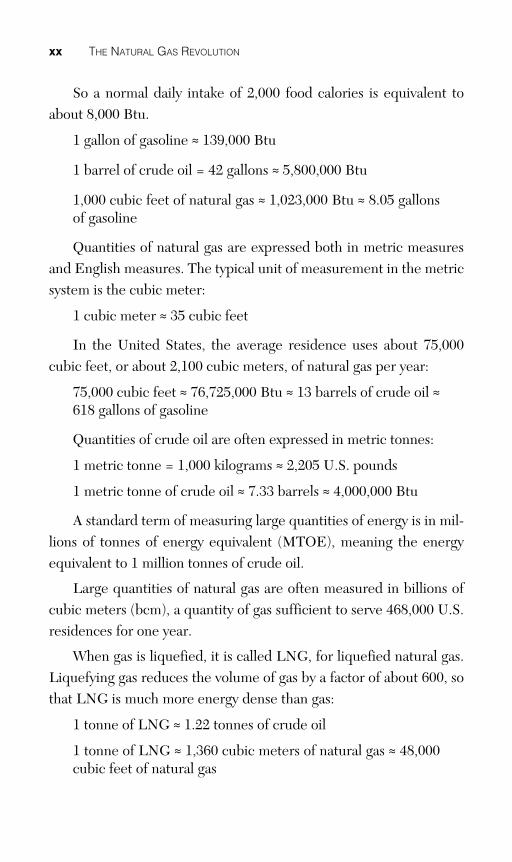
A Note on Energy Values and Conversions
Quantities of energy are expressed in a variety of measures and forms, due in part to our continuing reliance on both the metric and English systems. Also, hydrocarbon energy comes in a variety of forms—solid, liquid, and gaseous—and different measures are suitable to each. But in whatever form, these energy sources are all reducible to a common measure—their energy content. These brief notes are intended to help you understand and compare the basic measures.
We begin with a measure of energy, the British thermal unit (Btu). 1 Btu is the energy required to raise 1 pound of water by 1 degree Fahrenheit. To make the Btu more salient, we can note the following approximate equivalences of energy content:
1 food calorie ≈ 4 Btu
9780133353518_Book 1.indb xix 7/24/13 10:25 AM
xx THE NATURAL GAS REVOLUTION
So a normal daily intake of 2,000 food calories is equivalent to about 8,000 Btu.
1 gallon of gasoline ≈ 139,000 Btu
1 barrel of crude oil = 42 gallons ≈ 5,800,000 Btu
1,000 cubic feet of natural gas ≈ 1,023,000 Btu ≈ 8.05 gallons of gasoline
Quantities of natural gas are expressed both in metric measures and English measures. The typical unit of measurement in the metric system is the cubic meter:
1 cubic meter ≈ 35 cubic feet
In the United States, the average residence uses about 75,000 cubic feet, or about 2,100 cubic meters, of natural gas per year:
75,000 cubic feet ≈ 76,725,000 Btu ≈ 13 barrels of crude oil ≈ 618 gallons of gasoline
Quantities of crude oil are often expressed in metric tonnes:
1 metric tonne = 1,000 kilograms ≈ 2,205 U.S. pounds
1 metric tonne of crude oil ≈ 7.33 barrels ≈ 4,000,000 Btu
A standard term of measuring large quantities of energy is in mil-lions of tonnes of energy equivalent (MTOE), meaning the energy equivalent to 1 million tonnes of crude oil.
Large quantities of natural gas are often measured in billions of cubic meters (bcm), a quantity of gas sufficient to serve 468,000 U.S. residences for one year.
When gas is liquefied, it is called LNG, for liquefied natural gas. Liquefying gas reduces the volume of gas by a factor of about 600, so that LNG is much more energy dense than gas:
1 tonne of LNG ≈ 1.22 tonnes of crude oil
1 tonne of LNG ≈ 1,360 cubic meters of natural gas ≈ 48,000 cubic feet of natural gas
9780133353518_Book 1.indb xx 7/24/13 10:25 AM

1
Plates
Plate 1 The Structure of Oil and Gas Reservoirs Source: Adapted from Christopher J. Schenk and Richard M. Pollastro, “Natural Gas Production
in the United States: National Assessment of Oil and Gas Fact Sheet,” U.S. Geological Survey,
January 2002, Figure 1. Artwork prepared by Ira G. Liss.
9780133353518_Book 1.indb 1 7/24/13 10:25 AM

2 THE NATURAL GAS REVOLUTION
Plate 2 The Natural Gas Resource Triangle Source: Slightly adapted from Stephen A. Holditch, “Tight Gas Sands,” Journal of Petroleum Technology, June 2006, 84–90. Figure 1, p. 84.
9780133353518_Book 1.indb 2 7/24/13 10:25 AM

PLATES 3
Plate 3 Unconventional Natural Gas and Oil Plays in the United States Source: Adapted from U.S. Energy Information Administration, “Review of Emerging Resources:
U.S. Shale Gas and Shale Oil Plays,” July 2011, Figure 1, p. 6. Artwork prepared by Ira G. Liss.
9780133353518_Book 1.indb 3 7/24/13 10:25 AM
4 THE NATURAL GAS REVOLUTION
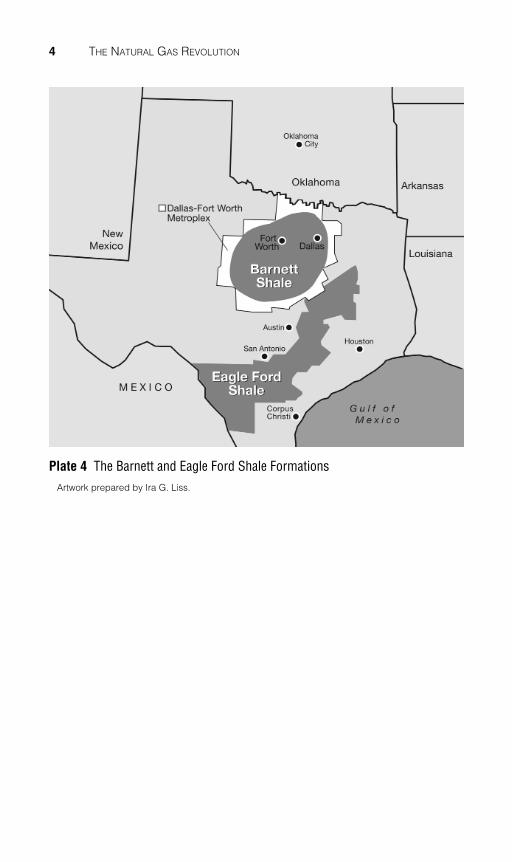
Plate 4 The Barnett and Eagle Ford Shale Formations Artwork prepared by Ira G. Liss.
9780133353518_Book 1.indb 4 7/24/13 10:25 AM

PLATES 5
Plate 5 The Marcellus and Utica Shale Formations Artwork prepared by Ira G. Liss.
9780133353518_Book 1.indb 5 7/24/13 10:25 AM

6 THE NATURAL GAS REVOLUTION
Plate 6 The Bakken Shale Formation Artwork prepared by Ira G. Liss.
9780133353518_Book 1.indb 6 7/24/13 10:25 AM

PLATES 7
Plate 7 The Process for Liquefying Natural Gas
9780133353518_Book 1.indb 7 7/24/13 10:25 AM

8 THE NATURAL GAS REVOLUTION
Plate 8 The South Pars and North Fields of Qatar and Iran Artwork prepared by Ira G. Liss.
9780133353518_Book 1.indb 8 7/24/13 10:25 AM

PLATES 9
Plate 9 The Shale Gas Basins of China Artwork prepared by Ira G. Liss.
9780133353518_Book 1.indb 9 7/24/13 10:25 AM

10 THE NATURAL GAS REVOLUTION
Plate 10 The Constricted Sea Lanes of the Middle East Artwork prepared by Ira G. Liss.
9780133353518_Book 1.indb 10 7/24/13 10:25 AM

PLATES 11
Plate 11 The Constricted Sea Lanes of Southeast Asia Artwork prepared by Ira G. Liss.
9780133353518_Book 1.indb 11 7/24/13 10:25 AM

12 THE NATURAL GAS REVOLUTION
Plate 12 The South China Sea and Its Contested Regions: Paracel Islands, the Spratly Islands, the Senkaku/Diaoyu Islands, and the Scarborough Shoal
Artwork prepared by Ira G. Liss.
9780133353518_Book 1.indb 12 7/24/13 10:25 AM

PLATES 13
Plate 13 Principal Shale Basins of Western Europe Artwork prepared by Ira G. Liss.
9780133353518_Book 1.indb 13 7/24/13 10:25 AM

14 THE NATURAL GAS REVOLUTION
Plate 14 The Nord Stream Pipeline Artwork prepared by Ira G. Liss.
9780133353518_Book 1.indb 14 7/24/13 10:25 AM

PLATES 15
Plate 15 Pipelines of the Southern Corridor Artwork prepared by Ira G. Liss.
9780133353518_Book 1.indb 15 7/24/13 10:25 AM

16 THE NATURAL GAS REVOLUTION
Plate 16 Gas Fields of Southern South America Artwork prepared by Ira G. Liss.
9780133353518_Book 1.indb 16 7/24/13 10:25 AM

PLATES 17
Plate 17 General Map of Central Asia Artwork prepared by Ira G. Liss.
9780133353518_Book 1.indb 17 7/24/13 10:25 AM

18 THE NATURAL GAS REVOLUTION
Plate 18 Major International Pipelines from Iran and Central Asia Eastward Artwork prepared by Ira G. Liss.
9780133353518_Book 1.indb 18 7/24/13 10:25 AM
PLATES 19
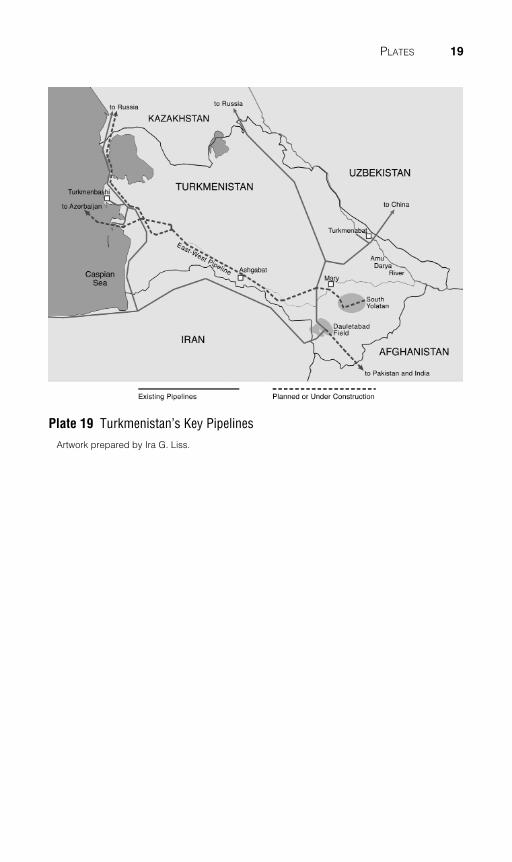
Plate 19 Turkmenistan’s Key Pipelines Artwork prepared by Ira G. Liss.
9780133353518_Book 1.indb 19 7/24/13 10:25 AM

20 THE NATURAL GAS REVOLUTION
Plate 20 Pipelines from the Caspian Sea Westward Artwork prepared by Ira G. Liss.
9780133353518_Book 1.indb 20 7/24/13 10:25 AM

PLATES 21
Plate 21 Gas Fields of the Eastern Mediterranean Artwork prepared by Ira G. Liss.
9780133353518_Book 1.indb 21 7/24/13 10:25 AM
22 THE NATURAL GAS REVOLUTION
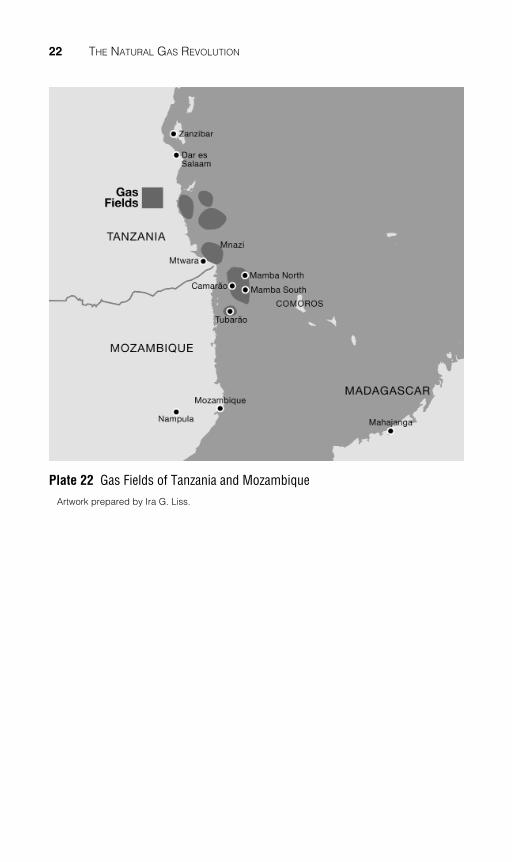
Plate 22 Gas Fields of Tanzania and Mozambique Artwork prepared by Ira G. Liss.
9780133353518_Book 1.indb 22 7/24/13 10:25 AM

PLATES 23
Plate 23 The Monterey Shale Artwork prepared by Ira G. Liss.
9780133353518_Book 1.indb 23 7/24/13 10:25 AM

24 THE NATURAL GAS REVOLUTION
Plate 24 Typical Methane Hydrate Deposits Source: Adapted from National Energy Technology Laboratory, “Energy Resource Potential of
Methane Hydrate,” U.S. Department of Energy, February 2011, p. 10.
Artwork prepared by Ira G. Liss.
9780133353518_Book 1.indb 24 7/24/13 10:25 AM

PLATES 25
Plate 25 The Pressure and Temperature Interface for Methane Hydrates Source: Adapted from National Energy Technology Laboratory, “Energy Resource Potential of
Methane Hydrate,” U.S. Department of Energy, February 2011, p. 8.
Artwork prepared by Ira G. Liss.
9780133353518_Book 1.indb 25 7/24/13 10:25 AM

This page intentionally left blank

27
1 To the Brink of Innovation
World Energy—A Rapid Tour of the Past 200 Years
From the beginning of human history until about 1750, a com-mon date for the start of the Industrial Revolution, the world was poor, and societies were equal—or at least very roughly so, and dra-matically so compared to the state of the world today. 1 Over the past 250 years, some nations have succeeded in building economic institu-tions and deploying technological innovations to facilitate economic growth. These movements have been the primary drivers of a rapid increase in wealth that was initially concentrated in the United King-dom and soon spread to other early-moving nations. More recently, other societies have adopted institutions and technologies that permit economic progress, and wealth has spread to many other nations. The original Industrial Revolution has been superseded by further indus-trial and societal revolutions.
Some historians emphasize the role of the rapid technological changes that occurred starting about 1750, while others emphasize what they see as the greater importance of improving institutions that guarantee property rights and propel economic growth. 2 Whatever the ultimate cause of the prosperity that began some 250 years ago, the world’s new wealth arrived on a drip, then a trickle, and finally a flood of energy derived from hydrocarbons. Pre-industrial societies
9780133353518_Book 1.indb 27 7/24/13 10:25 AM
28 THE NATURAL GAS REVOLUTION
consumed relatively little energy, deriving virtually all energy from organic sources. These sources were either human or animal mus-cle power, or substances that were burned for energy, like wood and peat. Before about 1700, power derived from wind, water, and hydro-carbons played only a negligible or nonexistent role. 3 No matter the sophistication of intellect or the brilliant organization of society, a total reliance on these organic energy sources placed an upper bound on human consumption and wealth, so the almost universal condition of poverty “did not arise from lack of personal freedom, from dis-crimination, or from the nature of the political or legal system, though it might be aggravated by such factors. It sprang from the nature of organic economies.” 4
Only the past few centuries have seen a significant increase in energy use. The increased exploitation of new energy sources has par-alleled the development of technologies that have been able to actu-ally make productive use of that newfound energy. Without industrial technologies, new energy sources could only be used for heating, and the difficulty of accessing new energy supplies has helped to limit human energy consumption.
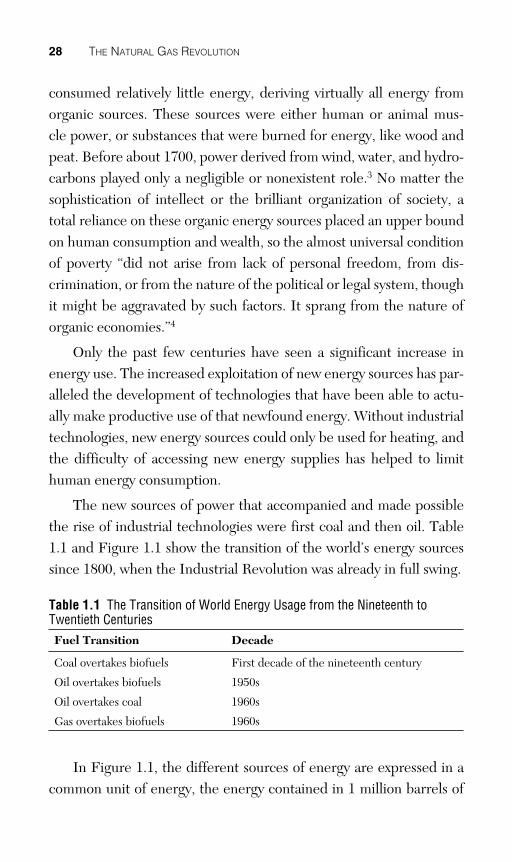
The new sources of power that accompanied and made possible the rise of industrial technologies were first coal and then oil. Table 1.1 and Figure 1.1 show the transition of the world’s energy sources since 1800, when the Industrial Revolution was already in full swing.
Table 1.1 The Transition of World Energy Usage from the Nineteenth to Twentieth Centuries Fuel Transition Decade
Coal overtakes biofuels First decade of the nineteenth century
Oil overtakes biofuels 1950s
Oil overtakes coal 1960s
Gas overtakes biofuels 1960s
In Figure 1.1 , the different sources of energy are expressed in a common unit of energy, the energy contained in 1 million barrels of
9780133353518_Book 1.indb 28 7/24/13 10:25 AM

CHAPTER 1 • TO THE BRINK OF INNOVATION 29
oil. Perhaps most surprisingly, the entire nineteenth century, with all its rapid technological change and innovation, was still dominantly fueled by organic energy sources—non-petroleum resources includ-ing wood, peat, and the muscle power of animals and humans. Coal, however, gained an ever-more-prominent role starting in the mid-dle of the nineteenth century. Nonetheless, coal surpassed organic energy as a world energy source only at the beginning of the twentieth century. Oil surpassed organic energy sources in world usage only in the 1950s, and it did not surpass coal until the 1960s.
Figure 1.1 The Succession of Energy Sources: Biofuels, Coal, and Crude Oil Source: Adapted from Vaclav Smil, Energy Transitions: History, Requirements, Prospects, Oxford,
UK: Praeger, 2010, p. 154.
Coal’s slow move to ascendancy over organic energy sources stemmed from the relatively slow spread of the Industrial Revolution to other parts of the world. Only northern Europe and the United States saw rapid industrialization following the breakthroughs in the United Kingdom. In these advanced economies, coal was king, sup-plying more than 90% of all of England’s energy as early as the 1850s. 5 Meanwhile, though it was relatively close to the source of innovation,
9780133353518_Book 1.indb 29 7/24/13 10:25 AM

30 THE NATURAL GAS REVOLUTION
Italy had a distribution of energy sources in the 1850s much like Eng-land’s in the 1550s. 6
Figure 1.2 shows that the past 200 years of energy history has fea-tured a falling share for organic energy sources, and that trend con-tinues to the present, with biofuels now constituting less than 10% of world energy usage. Nuclear and hydropower are together even less important than biofuels, constituting slightly more than 8% of total world energy usage. Solar power and wind power are both too slight to be factors. Thus, the world currently relies on hydrocarbons—coal, oil, and natural gas—for more than 80% of energy. Focusing on energy derived just from the three main hydrocarbons, oil provides 37%, slightly leading coal at 35%, with natural gas following at 28%. However, the importance of gas is rising and even accelerating. Natu-ral gas supplied 7% of the world’s energy in 1950, and it supplies 23% today; its proportion is almost certain to increase.
Figure 1.2 Shares of World Energy Sources, 1800–2008 Source: Adapted from Vaclav Smil, Energy Transitions: History, Requirements, Prospects, Oxford,
UK: Praeger, 2010, p. 154.
9780133353518_Book 1.indb 30 7/24/13 10:25 AM

CHAPTER 1 • TO THE BRINK OF INNOVATION 31
That natural gas has gone from a 7% to a 23% share of total world energy in 60 years is all the more impressive when measured against the vast acceleration of world energy usage, as Figure 1.3 shows. In 2008, world energy usage was 10 times as large as in 1900 and 22 times as large as in 1800. Only a relatively small part of this increased energy usage can be attributed to population growth. Rather, there has been a marked increase in energy usage per capita, which has fueled a dra-matic increase in per capita gross domestic product (GDP) as well. From 1820 to today, world per capita GDP has risen by a factor of 10, while in the industrialized West, per capita income has surged by a factor of 20 over the same period. 7
Figure 1.3 The World’s Energy Sources, 1800–2008 Source: Adapted from Vaclav Smil, Energy Transitions: History, Requirements, Prospects, Oxford,
UK: Praeger, 2010, p. 154.
9780133353518_Book 1.indb 31 7/24/13 10:25 AM
32 THE NATURAL GAS REVOLUTION
Hydrocarbons: From the Beginnings to Maturity
Today our lives depend so fully on energy derived from hydrocar-bons that it is almost impossible to realize how recently these energy sources began to play a significant role in human history. Coal’s dominance gave way to oil due in large measure to oil’s role in trans-portation. Today, oil rules the energy day and captures our geopoliti-cal attention. A Russian engineer drilled the world’s first oil well in 1848, in Baku on the Caspian Sea. Baku was producing almost the entirety of the world’s oil supply around 1860. Today, as the capital of Azerbaijan, Baku continues to be an important hub of hydrocar-bon production and transportation. In the United States, oil collected from surface seeps was first used as an ingredient in patent medi-cine around 1850, but some innovators recognized oil’s potential as a source of energy for lighting.
The first oil well in the United States was drilled in Titusville, Pennsylvania, in 1859 by “Colonel” Edwin Drake; it set off the first American oil boom. 8 The following decades saw a competition among several players. John D. Rockefeller’s Standard Oil was big in the United States, and the Swedish Nobel family came to be the most important players around Baku. The Nobels were soon joined by a succession of other non-U.S. firms, with the French Rothschilds also playing a prominent role.
It is not too much to say that crude oil made the automobile and that the automobile made oil one of the world’s most important com-modities. Although it was not the first country to drill, the United States quickly came to lead world production. Over the 1900 to 1950 period, the United States produced more than half of the world’s oil. The bounty of U.S. oil played a critical role in both world wars. Within days of the 1918 armistice, the French Senator Victor-Henri Bérenger stated, “Oil, the blood of the earth, has become the blood of victory.” Not to be outdone by French metaphors, Earl Curzon of England remarked that the Allies had “floated to victory on a wave of
9780133353518_Book 1.indb 32 7/24/13 10:25 AM

CHAPTER 1 • TO THE BRINK OF INNOVATION 33
oil.” 9 Although obtaining some oil from Mexico and Persia, the real source of the blood, or wave of victory, came from the United States, which supplied 80% of the Allies’ oil in the last year of World War I. 10 By contrast, Germany had sufficient coal and natural gas but could draw only on Romania for a secure supply of oil.
Oil from the United States played a similar dramatic role in the winning of World War II, as Table 1.2 shows. Germany had adequate supplies of coal, outproducing every other combatant, even able to convert coal and natural gas to oil and then to gasoline. Nonetheless, the Allied powers outproduced the Axis collective by 63%. But with the war truly being a world war, navies and armies could only get to the front by using oil power, not coal. It was in crude oil production and availability that the Axis suffered the most serious disadvantage. Collectively, the Allies outproduced the Axis in oil by a factor of more than 15. Of that total Allied production, the United States contributed 80%, as it also did in World War I. So if the Allies in World War I rode to victory on a wave of oil, the Allies got to and won World War II on the strength of its massive superiority in crude oil, which was overwhelmingly provided by the United States.
Table 1.2 Coal and Crude Oil Suppliers in World War II (Millions of Metric Tons) Allies
USA USSR UK Canada Total
Coal 2,149.7 590.8 1,441.2 101.9 4,283.6
Crude oil 833.2 110.6 90.8 8.4 1,042.0
Axis Powers
Germany Italy Hungary Romania Japan Total
Coal 2,420.3 16.9 6.6 1.3 184.5 2,629.6
Crude oil 33.4 0.2 3.2 25.0 5.2 67.0
Source: John Ellis, World War II: A Statistical Survey , New York: Facts on File, 1993. Coal figures
are from Table 79, and crude oil figures appear in Table 81.
Note: Approximately two-thirds of German oil production was in the form of synthetic oil derived
from coal or natural gas.
9780133353518_Book 1.indb 33 7/24/13 10:25 AM
34 THE NATURAL GAS REVOLUTION
A Rude Awakening
U.S. crude oil production continued to increase after World War II, peaking in 1970, at a production of 9.6 million barrels per day. From this high mark, the United States suffered a persistent slide in production for decades.
Coming almost immediately after the peak in U.S. oil production, the Organization of the Petroleum Exporting Countries (OPEC) oil embargo of 1973–1974 was a rude awakening. The United States had experienced other shortages in the many decades of previous oil his-tory, including the West Coast Oil Famine of 1920, probably the first oil shock of the transportation era. 11 But the 1973–1974 experience was several orders of magnitude larger than any previous supply inter-ruption, and it galvanized the attention of the American public, which was forced for the first time in memory to wait in line to fuel its cars.
Within days after the initiation of the oil embargo, President Nixon put the United States on the road to energy independence, declaring on November 7, 1973, “Let us set as our national goal, in the spirit of Apollo, with the determination of the Manhattan Project, that by the end of this decade we will have developed the potential to meet our own energy needs without depending on any foreign energy source.” Ever since that time, the nation has been on the long road to that elusive and seemingly ever-receding goal, with every president since Richard Nixon renewing the pledge and commitment to energy independence. 12
Thus, the three decades that followed the oil embargo were largely unhappy ones for energy in the United States. For oil—the critical energy source—the story was one of ever-increasing usage, ever-falling production, and ever-larger imports, and the same was
9780133353518_Book 1.indb 34 7/24/13 10:25 AM
CHAPTER 1 • TO THE BRINK OF INNOVATION 35
largely true of natural gas. Even in those times, and continuing to the present day, coal has presented no supply problems. Presently, the United States has about 240 billion metric tons of coal, and even though it is producing almost 1 billion metric tons per year, that is less than one-half of 1% of proved reserves. “Proved reserves” are essentially in-ground resources confidently known to exist that can be extracted profitably under current economic conditions. Generally, “reserves” refers to “proved reserves.” Put another way, the United States has almost 250 years’ worth of coal at present levels of con-sumption, and it is actually producing more than it consumes. With oil and gas, the situation has been quite otherwise.
U.S. Oil and Natural Gas at the Turn of the Millennium
Figure 1.4 shows the recent history of oil production and con-sumption in the United States. Even at the height of production, the United States consumed more oil than it produced, and in the 30 years from 1970 to 2000, the gap generally widened, with increasing consumption and falling production. The situation for natural gas has been superficially different but similar in actual fact. As shown in Fig-ure 1.5 , in the United States, the production and consumption of nat-ural gas were in a rough balance initially, but starting in about 1986, consumption increased rapidly, even while production increased. The ultimate result was that the gap between consumption and produc-tion grew ever wider toward the end of the twentieth century.
9780133353518_Book 1.indb 35 7/24/13 10:25 AM

36 THE NATURAL GAS REVOLUTION
Figure 1.4 U.S. Crude Oil Consumption and Production, 1970–2000 Source: BP, “Statistical Review of World Energy,” June 2012.
Figure 1.5 U.S. Natural Gas Consumption and Production, 1970–2000 Source: U.S. Energy Information Administration.
9780133353518_Book 1.indb 36 7/24/13 10:25 AM

CHAPTER 1 • TO THE BRINK OF INNOVATION 37
Also, U.S. oil and gas reserves fell significantly from 1970 to 2000, as Figure 1.6 shows. From this dwindling resource base, the United States continued to extract more and more of both oil and gas, as shown in Figure 1.7 . By 2000, the United States was extracting about 10% of its oil reserves and about 11% of its gas reserves each year. While there had been fluctuation in the production-to-reserves ratio for both oil and gas, the general trend was upward, and this was partic-ularly true for natural gas. Further, part of the reason that these rates of production were not higher was resistance to oil and gas production on environmental grounds. Thus, the energy picture for the United States at the start of the new millennium was certainly perilous.
Figure 1.6 U.S. Oil and Natural Gas Proved Reserves, 1970–2000 (1970 = 100.0)
Source: U.S. Energy Information Administration.
9780133353518_Book 1.indb 37 7/24/13 10:25 AM

38 THE NATURAL GAS REVOLUTION
Figure 1.7 U.S. Oil and Gas Produced, as a Percentage of Proved Reserves, 1970–2000
Source: U.S. Energy Information Administration.
The geopolitical situation around the turn of the millennium could only exacerbate reasonable fears about the energy future for the United States and its principal allies. The war between Iraq and Iran had dragged on for almost the entire decade of the 1980s, reducing production for both countries. Iraq’s invasion of Kuwait in 1991 only emphasized the turbulence of the Persian Gulf region, with its critical energy supplies. Then came the attack on the World Trade Center in New York in September 2001, ushering in a new era of conflict and supply disruption in the region. In assessing the near- and short-term futures for natural gas in May 2001, the U.S. Energy Information Administration (USEIA) noted that gas prices had more than doubled in the decade 1990 to 2000, and it forecast that prices would rise by 34% in just the next two years. 13 Further, so much gas had been with-drawn from storage that the USEIA saw its replenishment as a chal-lenge that would add to price pressure. The same report noted that some policy analysts were questioning the ability of natural gas to play its expected role in supporting economic growth.
9780133353518_Book 1.indb 38 7/24/13 10:25 AM

CHAPTER 1 • TO THE BRINK OF INNOVATION 39
Looking out to 2020, the USEIA predicted that total U.S. energy consumption would increase by about one-third over the period, as would the use of oil. The report also predicted that the use of natural gas would increase by almost two-thirds. As a result of these increases, the USEIA predicted that the United States would have to increase gas imports by about three-quarters and oil imports by two-thirds. 14
The natural gas supply and demand problems for the United States stemmed from several sources. In the aftermath of the embargo-induced energy crisis of the early 1970s, Congress passed the Powerplant and Industrial Fuel Use Act of 1978 as a center-piece of President Carter’s energy policy. One of the key purposes cited in the act was “to encourage and foster the greater use of coal and other alternate fuels, in lieu of natural gas and petroleum, as a primary energy source.” In essence, the law required that new electricity-generating plants that were designed to run on natural gas had to also be capable of using coal or some other non-gas fuel. The act also restricted the use of natural gas in large boilers. In the years following the enactment of the act, demand for natural gas waned, prices fell, gas came into excess supply, and exploration for and devel-opment of new gas resources slowed. Given the long lead times for energy development, the disincentives to exploration and develop-ment inherent in the act soon caused significant problems.
In recognition of the excess supply that developed right after and partially in response to the 1978 act, Congress voted for repeal of the act in 1987. As the USEIA noted, this repeal “set the stage for a dramatic increase in the use of natural gas for electric genera-tion and industrial processing.” 15 Soon after this repeal came “third-generation” combined-cycle gas-fired power plants, which were much more efficient and economically attractive than prior technologies. The repeal of the 1978 act, improved technology, and low gas prices stimulated a switchover to the construction of gas-fired power plants, which contributed to a demand surge for gas. In the next 20 years, the use of gas jumped more than 100%, due largely to the expanded use of gas in generating electricity. 16
9780133353518_Book 1.indb 39 7/24/13 10:25 AM

40 THE NATURAL GAS REVOLUTION
Natural gas sources can be either conventional or unconventional. In short, a conventional natural gas deposit is essentially gas trapped in a single underground reservoir, much like a subterranean pool of water. By contrast, unconventional natural gas deposits consist of gas dispersed over a wider area and held in a variety of rock formations, such as shale, coal, or sandstone. (These types of deposits are explored more fully in Chapter 2 , “They Call It a Revolution,” as they play an important role in the natural gas revolution.) In 2000, the USEIA published an assessment of technically recoverable natural gas in the lower 48 states, both conventional and unconventional, as shown in Table 1.3 . (Technically recoverable oil and gas are resources that it is possible to access with current technology, without reference to the economic viability of doing so.) The total estimate was more than 22 trillion cubic meters, divided almost exactly evenly between con-ventional and unconventional deposits. This is enough gas to fill the volume of the New Orleans Superdome more than 5 million times.
Table 1.3 U.S. Unproved Technically Recoverable Natural Gas Resources Onshore in the Lower 48 States, as of January 1, 2000 (Billion Cubic Meters)
Conventional Unconventional
Region Tight Sands
Coal Bed
Gas Shales
Total Unconventional
West Coast 623 170 0 0 170
Rocky Mountains 1,557 5,380 1,303 57 6,739
Midcontinent 2,633 425 85 0 510
Southwest 1,586 425 0 198 623
Gulf Coast 4,502 736 85 0 821
Northeast 368 680 227 1,274 2,180
Total 11,270 7,815 1,699 1,529 11,044
Source: U.S. Energy Information Administration, “U.S. Natural Gas Markets: Mid-Term Prospects
for Natural Gas Supply December 2001,” p. 18.
Thus, there was lots of gas onshore, but it needed to be extracted. However, legal restrictions prohibited the development of much of
9780133353518_Book 1.indb 40 7/24/13 10:25 AM

CHAPTER 1 • TO THE BRINK OF INNOVATION 41
this gas, particularly in the Rocky Mountain region. Further, while the industry had the technology to develop much of this gas, it was not feasible economically. Often the difference between a proved reserve and a technically recoverable reserve depends simply on the price of the resource and the cost of exploiting the resource. Off-shore the United States, there are also vast amounts of technically recoverable gas. The USEIA’s analysis divided them into the Pacific, Gulf of Mexico, and Atlantic regions, holding a total of 6.7 trillion cubic meters. However, the entire Pacific and Atlantic regions were legally out of bounds for development, as was one of the three sub-regions of the Gulf of Mexico. These legal restrictions excluded 1.7 trillion cubic meters of offshore gas from production. Thus, with the new millennium, the prospects for natural gas in the United States appeared highly forbidding on both the supply and demand sides of the equation. Far from being a single voice of doom, the bleak future portrayed by the USEIA represented the consensus of wisdom on the subject of hydrocarbons in general and natural gas in particular.
Contrasted with these dire predictions, and not fully understood or anticipated by anyone, the energy future of the United States and the world stood on the cusp of a dramatic change. As we will see, there was soon to be a remarkable jump in estimates of gas resources, and new technologies would make it economically feasible to develop much gas that previously had been only technically recoverable.
Notes 1. See, for instance, Robert E. Lucas, Jr., “The Industrial Revolution: Past and
Future,” Minneapolis Federal Reserve Bank Annual Report , May 1, 2004, p. 1: “Living standards in all economies in the world 300 years ago were more or less equal to one another and more or less constant over time.”
2. As Douglass North and Robert Thomas put it, “The industrial revolution was not the source of modern economic growth. It was the outcome of raising the private rate of return on developing new techniques and applying them to the production process.” It was, in short, the development of secure property rights protected by a system of laws enforced by a capable government that made
9780133353518_Book 1.indb 41 7/24/13 10:25 AM
42 THE NATURAL GAS REVOLUTION
economic growth possible. See Douglass C. North and Robert Paul Thomas, The Rise of the Western World: A New Economic History , Cambridge, UK: Cam-bridge University Press, 1973, p. 173.
3. This is not to minimize or neglect the intellectual achievements of an earlier time. For example, Lynn White chronicles the amazing inventions and techno-logical innovation of the medieval period. Rather, these inventions and technolo-gies were not deployed in a large-scale, sustained, and society-changing way until the advent of the Industrial Revolution. See Lynn White, Jr., Medieval Technol-ogy and Social Change , Oxford, UK: Oxford University Press, 1966.
4. E. A. Wrigley, Energy and the English Industrial Revolution , Cambridge, UK: Cambridge University Press, 2010, p. 239.
5. E. A. Wrigley, Energy and the English Industrial Revolution , Cambridge, UK: Cambridge University Press, 2010, p. 37.
6. E. A. Wrigley, Energy and the English Industrial Revolution , Cambridge, UK: Cambridge University Press, 2010, p. 92.
7. Angus Maddison, Contours of the World Economy 1–2030 AD: Essays in Macro-Economic History , Oxford, UK: Oxford University Press, 2007. See Table 2.1 , “Levels of per Capita GDP, Population, and GDP: World and Major Regions, 1–2003 AD.”
8. In his Pulitzer-winning book, on which this section largely relies, Daniel Yergin includes a compelling narrative of these early days of oil. See The Prize: The Epic Quest for Oil, Money, and Power , New York: Free Press, 1991.
9. “Floated to Victory on a Wave of Oil,” New York Times , November 23, 1918.
10. “Oil: Oil and World Power,” Encyclopedia of the New American Nation. Available at www.americanforeignrelations.com/O-W/Oil-Oil-and-world-power.html#b . Accessed October 14, 2012.
11. James D. Hamilton, “Historical Oil Shocks,” forthcoming in the Handbook of Major Events in Economic History . Working paper, February 2011.
12. “I am recommending a plan to make us invulnerable to cutoffs of foreign oil....new stand-by emergency programs to achieve the independence we want.” (President Gerald Ford, January 15, 1975). “This intolerable dependence on foreign oil threatens our economic independence and the very security of our nation” (President Jimmy Carter, July 15, 1979). “We will continue supportive research leading to development of new technologies and more independence from foreign oil” (President Ronald Reagan, February 18, 1981). “There is no security for the United States in further dependence on foreign oil” (President George H. Bush, August 18, 1988). “We need a long-term energy strategy to maximize conservation and maximize the development of alternative sources of energy” (President Bill Clinton, June 28, 2000). “This country can dramatically improve our environment, move beyond a petroleum-based economy, and make our dependence on Middle Eastern oil a thing of the past” (President George
9780133353518_Book 1.indb 42 7/24/13 10:25 AM

CHAPTER 1 • TO THE BRINK OF INNOVATION 43
W. Bush, January 31, 2006). “These are extraordinary times, and it calls for swift and extraordinary action. At a time of such great challenge for America, no single issue is as fundamental to our future as energy. America’s dependence on oil is one of the most serious threats that our nation has faced....It falls on us to choose whether to risk the peril that comes with our current course or to seize the promise of energy independence” (President Barack Obama, January 26, 2009). “For decades, we have known the days of cheap and accessible oil were num-bered....Now is the moment for this generation to embark on a national mission to unleash America’s innovation and seize control of our own destiny” (President Barack Obama, June 15, 2010).
13. U.S. Energy Information Administration, “U.S. Natural Gas Markets: Recent Trends and Prospects for the Future,” May 2001, p. viii.
14. U.S. Energy Information Administration, “Annual Energy Outlook 2001: With Projections to 2020,” December 2000, pp. 3, 4, 7.
15. U.S. Energy Information Administration, “Repeal of the Powerplant and In-dustrial Fuel Use Act (1987),” www.eia.gov/oil_gas/natural_gas/analysis_publications/ngmajorleg/repeal.html .
16. U.S. Energy Information Administration, “Repeal of the Powerplant and Industrial Fuel Use Act (1987),” www.eia.gov/oil_gas/natural_gas/analysis_publications/ngmajorleg/repeal.html .
9780133353518_Book 1.indb 43 7/24/13 10:25 AM

This page intentionally left blank

Index
A Afghanistan, 185 - 186 , 194 Ahura Mazda, 46 air quality
natural gas emissions and, 119 - 121 United States versus Europe,
124 - 126 aircraft carriers, by country, 150 Algeria
future role of, 214 liquefaction terminal capacity, 84 liquefaction terminals under
construction, 83 LNG exports, 79 , 81 natural gas exports to Western
Europe, 168 Allied powers, coal and crude oil
supply in World War II, 33 Angola, 83 “Annual Energy Outlook” (U.S.), 88 Aphrodite field, 209 aquifer contamination, 110 - 116 Arab nations, proved reserves in,
193 Argentina
LNG imports, 80 proved reserves, 207 regasification terminal capacity, 85
265
regasification terminals under construction, 83
shale gas resources in, 212 - 213 Armenia, 194 Australia
liquefaction terminal capacity, 84 liquefaction terminals under
construction, 83 LNG exports, 79 , 81 - 82 , 207 - 208
to Japan, 167 , 196 proved reserves, 192 , 207
Austria, 177 Axis powers, coal and crude oil
supply in World War II, 33 Azerbaijan, 175
border with Caspian Sea, 201 border with Iran, 194 proved reserves, 198
B Bahrain, 193 Bakken Shale play, 62 - 63 , 120 ,
223 - 225 Baku, Azerbaijan, 32 , 46 Baku-Tbilisi-Ceyhan (BTC)
pipeline, 200 Barnett Shale play, 60 Basel, Switzerland, 118 bcm (billions of cubic meters), xx
9780133353518_Book 1.indb 265 7/24/13 10:26 AM

266 INDEX
Belgium LNG exports, 79 LNG imports, 80 natural gas exports from United
Kingdom, 179 - 180 regasification terminal capacity, 85
Bérenger, Victor-Henri, 32 billions of cubic meters (bcm), xx biofuels, 28 - 30 biogenic formation of natural gas
and oil, 49 Blackpool, England, 118 , 178 Blue Stream pipeline, 176 boiling points of gases, 75 Bolivia, 184 Brazil
aircraft carriers, 150 comparison with China and India,
180 - 186 energy consumption/efficiency
and GDP, 135 LNG imports, 80 LNG prices, 96 natural gas production/
consumption rates, 164 primary energy sources, 160 regasification terminal capacity, 85 shale gas resources in, 163 , 213
Brendon, Piers, 148 Brownlow, Darrell, 105 Brunei
liquefaction terminal capacity, 84 LNG exports, 79 , 81
Btu (British thermal unit) , xix Bulgaria, 176 - 177 Bunsen, Robert, 47 butane, 74 - 75
C California, shale oil production,
227 - 228 Canada
LNG imports, 80 proved reserves, 192 as “quiet exporter,” 202 - 204 regasification terminal capacity, 85
carbon capture and storage (CCS), 119
carbon footprint of natural gas, 119 - 121
Carter, Jimmy, 39 Caspian Sea, Turkmenistan border
with, 200 - 201 CCS (carbon capture and
storage), 119 Central Asia
natural gas exports, 198 - 199 proved reserves, 197 - 198
Chicago, early use of natural gas, 47 Chile
LNG imports, 80 regasification terminal capacity, 85
China aircraft carriers, 149-151 comparison with Brazil and India,
180 - 186 early use of natural gas, 46 energy consumption/efficiency
and GDP, 134-137 energy imports, 143-147 geopolitics with United States
current situation, 147-148 future of, 151-152
hydrocarbon production/consumption/import reliance, 140-141
LNG imports, 80 , 82 LNG prices, 96
9780133353518_Book 1.indb 266 7/24/13 10:26 AM
INDEX 267
pipelines Central Asia, 198 Turkmenistan, 200
primary energy sources, comparison with United States, 145-146
regasification terminal capacity, 85 regasification terminals under
construction, 83 shale gas resources in , 161 - 162 water availability, 107
climate change. See greenhouse gases
coal environmental impact versus
natural gas, 124 - 126 for power generation, 89 - 90 role in world energy usage history,
28 - 30 , 32 - 33 United States supply of, 35
coal bed methane, 50 - 51 Colorado Oil and Gas Conservation
Commission (COGCC), 112 - 113 completion of conventional
deposits, 52 - 53 consumption
in Australia and Argentina, 207 in Central Asia and Turkey,
197 - 198 GDP and
by country, 135 for India, Brazil, China,
181 - 180 of LNG (liquefied natural gas), by
country, 78 in Persian Gulf nations, 193 in Poland and Ukraine, 204 of “quiet exporters,” 202 - 203 in Saudi Arabia, 197 in United Arab Emirates, 197
in United States, 35 - 41 in world’s largest economies,
162 - 164 A Contest for Supremacy: China,
America, and the Struggle for Mastery in Asia (Friedberg), 148
conventional deposits crude oil, 50
extraction, production, completion, 52 - 53
hydraulic fracturing of, 54 - 56 natural gas, 40 - 41 , 50
extraction, production, completion, 52 - 53
hydraulic fracturing of, 54 - 56 worldwide resources, 51 - 52
production techniques, comparison with unconventional techniques, 58 - 59
conversion equivalences for energy , xix-xx
cost of LNG production facilities, 76 of LNG production/transportation,
96 - 98 of LNG regasification plants, 77 water usage in hydraulic
fracturing, 102 - 107 crude oil . See also shale gas and oil
in Bakken Shale play, 62 - 63 conventional deposits, 50 energy conversions for , xx energy density, comparison with
natural gas, 73 formation of, 48 - 50 imports, United States versus
China, 143-145 indexing LNG prices to, 95 - 96 ,
165 - 166 oil embargo of 1973-1974, 34 - 35 role in world energy usage history,
28 - 30 , 32 - 33
9780133353518_Book 1.indb 267 7/24/13 10:26 AM

268 INDEX
transportation, comparison with natural gas, 73 - 74
unconventional deposits, 50 - 51 in United States, recent
production and consumption rates, 35 - 37
cubic meters , xx Curzon, Earl, 32 Cyprus
natural gas resources in Eastern Mediterranean, 209 - 211
proved reserves, 192 Czech Republic, 177
D dangers of LNG (liquefied natural
gas), 77 Delphi, 46 , 112 Denmark, 168 Dominican Republic
LNG imports, 80 regasification terminal capacity, 85
Drake, Edwin, 32 , 47 , 52 drilling
conventional versus unconventional production techniques, 58 - 59
conventional wells, 52 - 53 horizontal drilling, 56 - 58 hydraulic fracturing, 54 - 56
dry gas, converting wet gas into, 75 - 76
Dubai, 85
E Eagle Ford Shale play, 225 - 227 earthquakes from injection well
usage, 118 - 119
East Africa, natural gas resources, 211 - 212
Eastern Mediterranean, natural gas resources, 209 - 211
Economides, Michael, 210 Egypt
liquefaction terminal capacity, 84 LNG exports, 79 natural gas exports to Western
Europe, 168 proved reserves, 193
electrical power, natural gas as fuel for, 89 - 90
Ellsworth, Aimee, 113 The End of Country (McGraw), 122 energy
conversion equivalences , xix-xx density
LNG (liquefied natural gas), 74
natural gas versus crude oil, 73
efficiency and GDP, by country, 135
imports, United States versus China, 143-147
primary sources United States versus China,
145-146 in world’s largest economies,
159 - 161 recent production and
consumption rates in United States, 35 - 41
world usage history since Industrial Revolution,
27 - 31 in World Wars I and II, 32 - 33
energy independence, 153-154 Energy Policy Act of 2005, 115
9780133353518_Book 1.indb 268 7/24/13 10:26 AM
INDEX 269
environmental impact conventional versus
unconventional production techniques, 58 - 59
of hydraulic fracturing aquifer contamination,
110 - 116 fracking fluid components,
107 - 109 “produced water,” 116 - 119 water usage, 102 - 107
of hydrocarbons, 101 - 102 land use requirements, 121 - 122 of natural gas
carbon footprint of, 119 - 121 coal versus, 124 - 126
of recovering China’s shale gas resources, 142
EPA (Environmental Protection Agency), 113 , 115
Equatorial Guinea liquefaction terminal capacity, 84 LNG exports, 79
Eternal Flame Falls of Chestnut Ridge Park, 112
ethane, 74 - 75 Europe . See also names of specific
European countries (France, Germany, United Kingdom, etc.)
environmental impact versus United States, 124 - 126
natural gas imports, 167 - 169 , 172 - 178
exports of LNG (liquefied natural gas)
in 2001, 78 - 81 from Australia, 207 - 208 by country, 78 from East Africa, 211 - 212 from Qatar, 196 - 197 “quiet exporters,” 202 - 204
shifts in, 2001-2011, 78 - 81 support/opposition in United
States, 91 - 93 via pipelines
from Central Asia, 198 - 199 from Iran, 194 - 195 “quiet exporters,” 202 - 204 from Russia, 172 - 178 ,
204 - 207 from Turkmenistan, 199 - 201
extraction of conventional deposits, 52 - 53
F FERC (Federal Energy Regulatory
Commission), 87 Finland, 177 “ fire ice.” See methane hydrates Fisher, Daniel, 212 flaring, 120 - 121 flowback water, disposal of, 116 - 119 food calories , xix Fox, Josh, 111 fracking. See hydraulic fracturing fracking fluid
aquifer contamination, 110 - 116 components of, 107 - 109 “ produced water,” 116 - 119
France aircraft carriers, 150 energy consumption/efficiency
and GDP, 135 LNG imports, 80 - 82 natural gas imports, 167 - 169 natural gas production/
consumption rates, 164 primary energy sources, 160 regasification terminal capacity, 85
9780133353518_Book 1.indb 269 7/24/13 10:26 AM

270 INDEX
regasification terminals under construction, 83
Russian natural gas prices, 177 shale gas resources in, 163 ,
169 - 171 Fredonia, New York, 47 Friedberg, Aaron, 148 future
of geopolitics between United States and China, 151-152
of tight oil production in United States, 229 - 230
G gases, melting and boiling points, 75 Gasland (documentary), 111 - 113 Gaza, 209 - 211 Gazprom, 177 - 178 GDP, energy consumption/energy
efficiency and by country, 135 for India, Brazil, China, 181 - 180
geographical effects of oil and gas production, 121 - 122
geopolitics of Eastern Mediterranean
resources, 209 - 211 of Japan’s LNG imports, 167 of Russia’s pipeline infrastructure,
168 - 169 , 174 of United States and China
current situation, 147-148 future of, 151-152
Germany energy consumption/efficiency
and GDP, 135 natural gas imports, 167 - 169 natural gas production/
consumption rates, 164
primary energy sources, 160 Russian natural gas prices, 177 shale gas resources in, 163 ,
169 - 171 World War I role, 33 World War II role, 33
Gjelten, Tom, 45 global warming. See greenhouse
gases Great Britain. See United Kingdom Greece
LNG imports, 80 regasification terminal capacity, 85 Russian natural gas prices, 177
greenhouse gases methane hydrates, 233 produced by natural gas, 119 - 121 United States versus Europe,
124 - 126 groundwater contamination,
110 - 116 guar gum, 56
H Hart, William, 47 Hickenlooper, John, 116 history
of LNG usage, 76 - 77 of natural gas usage, 46 - 47 of world energy usage
since Industrial Revolution, 27 - 31
in World Wars I and II, 32 - 33 horizontal drilling, 56 - 58 Hulbert, Matthew, 170 Hungary, 177
9780133353518_Book 1.indb 270 7/24/13 10:26 AM
INDEX 271
hydraulic fracturing conventional versus
unconventional production techniques, 58 - 59
environmental impact aquifer contamination,
110 - 116 fracking fluid components,
107 - 109 “ produced water,” 116 - 119 water usage, 102 - 107
process of, 54 - 56 social impact, 122 - 124
hydrocarbons environmental impact, 101 - 102 primary energy sources in world’s
largest economies, 159 - 161 United States versus China
imports, 141 usage history, 137, 139, 141
usage history of world energy, 32 - 33
I imports
of all energy India and Brazil, 182 United States and China,
143-147 of LNG (liquefied natural gas)
in 2001, 78 - 81 Brazil, 184 by country, 78 Japan, 165 - 167 shifts in, 2001-2011, 78 - 81
of natural gas in India, 184 - 186 in Turkey, 201 - 202 in Western Europe, 167 - 169
India aircraft carriers, 150 comparison with Brazil and China,
180 - 186 energy consumption/efficiency
and GDP, 135 LNG imports, 80 , 82 , 196 LNG prices, 96 natural gas pipelines, 184 - 186 natural gas production/
consumption rates, 164 primary energy sources, 160 regasification terminal capacity, 85 regasification terminals under
construction, 83 shale gas resources in, 163
Indiana, early use of natural gas, 47 Indonesia
liquefaction terminal capacity, 84 liquefaction terminals under
construction, 83 LNG exports, 79 , 81 , 167 as “quiet exporter,” 202 - 204 regasification terminals under
construction, 83 Industrial Revolution, 27 - 31 injection wells, 116 - 119 Iran
natural gas exports, 194 - 195 natural gas imports, 198 pipelines to India, 185 - 186 proved reserves, 191 , 193 shared reservoir with Qatar, 196
Iraq border with Iran, 194 flaring in, 120 proved reserves, 191 - 193
Ireland, 179 - 180
9780133353518_Book 1.indb 271 7/24/13 10:26 AM

272 INDEX
Israel natural gas resources in Eastern
Mediterranean, 209 - 211 proved reserves, 192 regasification terminals under
construction, 83 Italy
aircraft carriers, 150 energy consumption/efficiency
and GDP, 135 LNG imports, 80 - 81 natural gas imports, 167 - 169 natural gas production/
consumption rates, 164 primary energy sources, 160 regasification terminal capacity, 85 regasification terminals under
construction, 83 Russian natural gas prices, 177 shale gas resources in, 163 ,
169 - 171
J Japan
aircraft carriers, 150 energy consumption/efficiency
and GDP, 135 LNG imports, 80 - 82 , 165 - 167 , 196 LNG prices, 96 LNG usage, 74 long-term LNG contracts with
Qatar, 94 natural gas production/
consumption rates, 164 primary energy sources, 160 regasification terminal capacity, 85 regasification terminals under
construction, 83 shale gas resources in, 163
K Kaplan, Robert D., 148 Kazakhstan
flaring in, 120 natural gas exports, 198 proved reserves, 198
kerogen, 48 Keystone XL pipeline, 203 Korea. See South Korea Krauss, Clifford, 45 Kuwait
LNG imports, 80 proved reserves, 193 regasification terminal capacity, 85
Kyrgyzstan, 198
L land use requirements for oil and
gas production, 121 - 122 Lebanon
natural gas resources in Eastern Mediterranean, 209 - 211
proved reserves, 192 legal restrictions on energy
production, 41 Leviathan field, 209 LeVine, Steve, 45 , 97 Libya
liquefaction terminal capacity, 84 LNG exports, 79
Lipton, Eric, 45 liquefaction terminals
under construction, 83 cost, 76 by country, 83 - 84 production techniques in, 74 - 76 in United States, current and
planned, 86 - 88
9780133353518_Book 1.indb 272 7/24/13 10:26 AM
INDEX 273
LNG (liquefied natural gas) cost of production, 96 - 98 creating, 74 - 76 dangers of, 76 - 77 energy conversions for , xx energy density, 74 exports
from Australia, 207 - 208 by country, 78 from East Africa, 211 - 212 from Qatar, 196 - 197 “quiet exporters,” 202 - 204
history of usage, 76 - 77 imports
Brazil, 184 by country, 78 Japan, 165 - 167 United States versus China,
146-147 Western Europe, 167 - 169
infrastructure availability, 83 - 88 liquefaction terminals, by
country, 83 - 84 liquefaction terminals, under
construction, 83 regasification terminals, by
country, 84 - 85 regasification terminals,
under construction, 83 - 86 in Japan, 74 major importers/exporters in 2001,
78 - 81 potential uses in United States,
88 - 93 pricing, 94 - 96 , 165 - 166 shifts in imports/exports
2001-2011, 81 - 83 United States’ role in world trade,
86 - 88 Luttwak, Edward, 149
M Malaysia
liquefaction terminal capacity, 84 LNG exports, 79 , 81 , 167 as “quiet exporter,” 202 - 204 regasification terminals under
construction, 83 manufacturing, natural gas usage in,
90 - 91 Marcellus Shale play, 61 - 62 , 122 Markham, Mike, 113 “The Math Doesn’t Add Up on the
US’s Ambitions to Export Natural Gas” (LeVine), 97
McClure, Renee, 113 McGraw, Seamus, 122 melting points of gases, 75 methane
air quality impact of, 119 - 121 creating LNG, 74 - 76 water contamination, 111 - 113
methane hydrates, 51 , 231 - 233 metric tonnes , xx Mexico
LNG imports, 80 regasification terminal capacity, 85 regasification terminals under
construction, 83 Middle East, export chokepoints in,
147 migration of natural gas and oil,
49 - 50 military capabilities of United States
and China current situation, 148-153 future of, 152-155
Miller, Alexei, 177 millions of tonnes of energy
equivalent (MTOE) , xx Milner, Brian, 45
9780133353518_Book 1.indb 273 7/24/13 10:26 AM

274 INDEX
mineral rights, 171 Mitchell, George, 60 Monsoon: The Indian Ocean and
the Future of American Power (Kaplan), 148
Monterey Shale play, 227 - 228 Moore, Stephen, 45 Morse, Ed, 45 Mozambique
LNG exports, 211 - 212 proved reserves, 192
MTOE (millions of tonnes of energy equivalent) , xx
Myers Jaffe, Amy, 45
N Nabucco pipeline, 175 natural gas . See also LNG (liquefied
natural gas); shale gas and oil carbon footprint of, 119 - 121 conventional deposits, 40 - 41 , 50 early history of, 46 - 47 energy conversions for , xx energy density, comparison with
crude oil, 73 environmental impact versus coal,
124 - 126 exports
Central Asia, 198 - 199 East Africa, 211 - 212 Iran, 194 - 195 Russia, 172 - 178 , 204 - 207 Turkmenistan, 199 - 201
formation of, 48 - 50 imports
India, 184 - 186 Turkey, 201 - 202 United States versus China,
144-147
Western Europe, 167 - 169 melting and boiling points of gases
in, 75 methane hydrates, 51 , 231 - 233 production versus consumption
in United States, 35 - 41 in world’s largest economies,
162 - 164 resources in Eastern
Mediterranean, 209 - 211 role in world energy usage history,
28 - 31 transportation, comparison with
crude oil, 73 - 74 unconventional deposits, 40 - 41 ,
50 - 51 United States reserves, 64 worldwide resources, 51 - 52 , 66 - 69
natural gas liquids (NGLs), 75 - 76 Netherlands
LNG imports, 80 natural gas exports
to United Kingdom, 179 - 180 to Western Europe, 168
Russian natural gas prices, 177 NGLs (natural gas liquids), 75 - 76 Nigeria
flaring in, 120 future role of, 214 liquefaction terminal capacity, 84 LNG exports, 79 , 81- 82 , 184
Nixon, Richard, 34 Nobel family, 32 Nord Stream pipeline, 174 North Dakota, shale oil production,
221 - 225 Norway
liquefaction terminal capacity, 84 LNG exports, 79
9780133353518_Book 1.indb 274 7/24/13 10:26 AM
INDEX 275
natural gas exports, 168 , 179 - 180 as “quiet exporter,” 202 - 204
nuclear power in Japan, 165
O oil. See crude oil; shale gas and oil oil embargo of 1973-1974, 34 - 35 oil shale, 48 - 49 Oman
liquefaction terminal capacity, 84 LNG exports, 79 , 81 proved reserves, 193
Onnes, Heike Kamerlingh, 76 OPEC (Organization of the
Petroleum Exporting Countries), 34 - 35
Oracle at Delphi, 46 , 112 organic energy sources. See biofuels
P Pakistan, 185 - 186
border with Iran, 194 pipeline from Iran, 195
Papua New Guinea, 83 Paraná basin, 183 Parnaíba basin, 183 pentane, 74 - 75 Persian Gulf nations, proved
reserves in, 193 Peru
liquefaction terminal capacity, 84 LNG exports, 79
physical effects on land of oil and gas production, 121 - 122
pipelines for natural gas exports
from Central Asia, 198 - 199 from Iran, 194 - 195
“quiet exporters,” 202 - 204 from Russia, 172 - 178 in Turkmenistan, 199 - 201 from United Kingdom,
179 - 180 for natural gas imports
in Brazil, 184 in India, 184 - 186 from United Kingdom,
179 - 180 United States versus China,
144-147 Western Europe, 167 - 169
in Poland and Ukraine, 204 - 207 Plutarch, 46 Poland
natural gas imports from Qatar, 196 from Russia, 204 - 206
proved reserves, 204 regasification terminals under
construction, 83 Russian natural gas prices, 177
Portugal LNG imports, 80 regasification terminal capacity, 85 regasification terminals under
construction, 83 power generation, natural gas as
fuel for, 89 - 90 Powerplant and Industrial Fuel Use
Act of 1978, 39 pre-salt offshore formations, 183 pricing
of LNG (liquefied natural gas), 94 - 96 , 165 - 166
in Japan, 165 in United States, 165
of Russian natural gas, 176 - 177 “ produced water,” disposal of,
116 - 119
9780133353518_Book 1.indb 275 7/24/13 10:26 AM

276 INDEX
production in Australia and Argentina, 207 in Central Asia and Turkey,
197 - 198 of conventional deposits, 52 - 53 conventional versus
unconventional techniques, 58 - 59
environmental impact. See environmental impact
in Persian Gulf nations, 193 in Poland and Ukraine, 204 of “quiet exporters,” 202 - 203 in United States
at Bakken Shale play, 223 - 225 at Eagle Ford Shale play,
225 - 227 future of tight oil production,
229 - 230 at Monterey Shale play,
227 - 228 recent production and
consumption rates, 35 - 41 shale oil production, 221 - 223
in world’s largest economies, 162 - 164
propane, 74 - 75 proppants, 55 - 56 proved reserves
Argentina, 207 Australia, 207 Central Asia and Turkey, 197 - 198 defined, 35 impact, by country, 191 - 192 Persian Gulf nations, 193 Poland and Ukraine, 204 of “quiet exporters,” 202 - 203
of shale gas resources India and Brazil, 182 United States and China,
139-143 Western Europe, 169 - 171 world’s largest economies,
161 - 162 United Kingdom, 178 United States, 64 worldwide natural gas, 51 - 52 ,
66 - 69 worldwide shale gas, 67 - 69
Puerto Rico LNG imports, 80 regasification terminal capacity, 85
Q Qatar
liquefaction terminal capacity, 84 LNG exports, 79 , 81 - 82 , 196 - 197
to Brazil, 184 to Japan, 94 , 167 to Western Europe, 168
proved reserves, 191 , 193 shared reservoir with Iran, 196
“ Quadrennial Defense Review Report” (U.S. Department of Defense), 153
“ quiet exporters,” 202 - 204
R Rao, Vikram, 106 regasification terminals
under construction, 83 - 86 cost, 77 by country, 85 - 83 in United States, current and
planned, 86 - 88
9780133353518_Book 1.indb 276 7/24/13 10:26 AM
INDEX 277
religious usage of natural gas, 46 Repsol, 213 reserves. See proved reserves Richter, Wolf, 45 The Rise of China vs. the Logic of
Strategy (Luttwak), 149 Rockefeller, John D., 32 Romania, 177 Rothschild family, 32 Russia
aircraft carriers, 150 Eastern Mediterranean resources
and, 210 energy consumption/efficiency
and GDP, 135 flaring in, 120 liquefaction terminal capacity, 84 LNG exports, 79 , 82 , 167 natural gas production/
consumption rates, 164 pipelines
in Central Asia, 198 in Poland and Ukraine,
204 - 207 in Turkmenistan, 199 to Western Europe, 167 - 169
position in world gas market, 172 - 178
primary energy sources, 160 proved reserves, 191 shale gas resources in, 163
S Safe Drinking Water Act of 1974,
115 Saudi Arabia
consumption versus production rates, 197
proved reserves, 192 - 193
sea-denial strategy, 152 Serbia, 177 shale gas and oil, 50 - 51
in Argentina, 212 - 213 in China, 139-143 horizontal drilling, 56 - 58 in India and Brazil, 182 - 184 in Russia, 172 - 178 in United Kingdom, uncertainty
concerning, 178 - 180 United States deposits, 60 - 63 United States production, 221 - 223
in Bakken Shale play, 223 - 225 in Eagle Ford Shale play,
225 - 227 future of, 88 , 229 - 230 in Monterey Shale play,
227 - 228 in Western Europe, 169 - 171 in world’s largest economies,
161 - 162 worldwide resources, 67- 69
Shtokman project, 173 Singapore, 83 slickwater fracturing, 55 Slovakia, 177 social impact of hydraulic
fracturing, 122 - 124 South Korea
LNG imports, 80 - 82 , 196 LNG prices, 96 regasification terminal capacity, 85 regasification terminals under
construction, 83 South Stream pipeline, 176 Spain
LNG exports, 79 LNG imports, 80 - 82 LNG prices, 96
9780133353518_Book 1.indb 277 7/24/13 10:26 AM
278 INDEX
regasification terminal capacity, 85 regasification terminals under
construction, 83 spot market pricing of LNG, 95 - 96 ,
165 - 166 storage of LNG, 76 - 77 string-of-pearls strategy, 151-152 Syria
imports from Iran, 194 natural gas resources in Eastern
Mediterranean, 209 - 211
T Tabriz-Dogubayazit pipeline, 194 Taiwan
LNG imports, 80 - 82 regasification terminal capacity, 85
Tajikistan, 198 Tamar reservoir, 209 TANAP (Trans-Anatolian Pipeline
Project), 175 Tanzania
LNG exports, 211 - 212 proved reserves, 192
TAP (Trans-Adriatic Pipeline), 175 TAPI (Turkmenistan-Afghanistan-
Pakistan-India) pipeline, 185 - 186 , 201
Tarim Basin, 140 technically recoverable resources
defined, 40 in India and Brazil, 182 - 183 in United States and China,
139-140 in world’s largest economies,
161 - 162 Texas shale oil production, 221 - 223 ,
225 - 227 Thailand, 80
thermogenic formation of natural gas and oil, 48 - 49
tight gas and oil, 50 - 51 , 229 - 230 Titusville, Pennsylvania, 47 trains. See liquefaction terminals Trans-Adriatic Pipeline (TAP), 175 Trans-Anatolian Pipeline Project
(TANAP), 175 transportation of natural gas
comparison with crude oil, 73 - 74 LNG (liquefied natural gas), 77 as vehicle fuel, 90 - 91
Trinidad and Tobago liquefaction terminal capacity, 84 LNG exports, 79 , 82
Turkey border with Iran, 194 Eastern Mediterranean resources
and, 210 LNG imports, 80 natural gas imports, 201 - 202 proved reserves, 197 - 198 regasification terminal capacity, 85 Russian natural gas prices, 177
Turkmenistan, 168 - 169 , 174 - 175 border with Iran, 194 future of pipelines, 199 - 201 natural gas exports, 198 proved reserves, 191 , 198
Turkmenistan-Afghanistan-Pakistan-India (TAPI) pipeline, 185 - 186 , 201
U Ukraine, 168 - 169 , 174
imports from Russia, 206 - 207 proved reserves, 204
9780133353518_Book 1.indb 278 7/24/13 10:26 AM

INDEX 279
unconventional deposits crude oil, 50 - 51
horizontal drilling, 56 - 58 hydraulic fracturing of, 54 - 56
natural gas, 40 - 41 , 50 - 51 defined, 57 horizontal drilling, 56 - 58 hydraulic fracturing of, 54 - 56 worldwide resources, 51 - 52
production techniques, comparison with conventional techniques, 58 - 59
in United States, 60 - 63 United Arab Emirates
consumption versus production rates, 197
liquefaction terminal capacity, 84 LNG exports, 79 , 81 LNG imports, 80 proved reserves, 193
United Kingdom aircraft carriers, 150 early use of natural gas, 46 energy consumption/efficiency
and GDP, 135 LNG imports, 80 , 82 , 196 LNG prices, 96 natural gas
exports to Western Europe, 168
production/consumption rates, 164
primary energy sources, 160 regasification terminal capacity, 85 Russian natural gas prices, 177 shale gas resources in, 163 uncertainty of natural gas future,
178 - 180
United States aircraft carriers, 149-151 coal supply, 35 early use of natural gas, 47 energy consumption/efficiency
and GDP, 134-137 energy imports, 143-147 environmental impact versus
Europe, 124 - 126 geopolitics with China
current situation, 147-148 future of, 151-152
hydrocarbon production/consumption/import reliance, 140-141
initial oil drilling, 32 liquefaction terminal capacity, 84 LNG exports, 79 LNG imports, 80 LNG infrastructure in, 86 - 88 LNG potential uses, 88 - 93 LNG prices, 96 natural gas reserves in, 64 oil embargo effect, 34 - 35 primary energy sources,
comparison with China, 145-146 proved reserves, 191 recent production and
consumption rates, 35 - 41 regasification terminal capacity, 85 shale gas resources in
comparison with China, 139-143
comparison with world’s largest economies, 161 - 162
shale oil production, 221 - 223 in Bakken Shale play, 223 - 225 in Eagle Ford Shale play,
225 - 227
9780133353518_Book 1.indb 279 7/24/13 10:26 AM
280 INDEX
future of, 229 - 230 in Monterey Shale play,
227 - 228 total cost of LNG production/
transportation, 96 - 98 unconventional deposits in, 60 - 63 water availability, 102 - 107 World War I role, 32 - 33 World War II role, 33
usage history of world energy since Industrial Revolution, 27 - 31 in World Wars I and II, 32 - 33
Utica Shale play, 61 - 62 Uzbekistan
natural gas exports, 198 proved reserves, 198
V vehicle fuel, natural gas as, 90 - 91 Venezuela
flaring in, 120 future role of, 214
venting, 120 viscosity of hydraulic fracturing
fluid, 55 - 56 von Linde, Carl, 76
W-X water contamination
in aquifers, 110 - 116 flowback water, disposal of,
116 - 119 water treatment plants, 116 - 117 water usage
conventional versus unconventional production techniques, 58 - 59
environmental impact of hydraulic fracturing, 102 - 107
recovering China’s shale gas resources, 142-143
well pads, land use requirements, 121 - 122
Western Europe. See France; Germany; Italy
wet gas, 74 - 76 Wolf, Martin, 45 world energy usage history
since Industrial Revolution, 27 - 31 in World Wars I and II, 32 - 33
“ World Shale Gas Resources: An Initial Assessment of 14 Regions Outside the United States” (USEIA), 162
World War I, role of crude oil, 32 - 33
World War II, role of coal and crude oil, 33
worldwide resources natural gas, 51 - 52 , 66 - 69 shale gas, 67- 69
Y Yamal Peninsula project, 173 Yemen
liquefaction terminal capacity, 84 LNG exports, 79 proved reserves, 193
YPF (Argentinian oil and gas company), 213
Z Zoroastrianism, 46
9780133353518_Book 1.indb 280 7/24/13 10:26 AM