Embed Size (px)
Citation preview

The Natural Basis of Synthetically
Augmented CAR T Cell Therapy
J. Joseph Melenhorst, PhD

Group Median Human T-cells/mcL at peak
(10/mcL threshold)
Duration of T cell engraftment in
peripheral Blood (days)
Mock 26 ± 8 10 ± 4
19-zeta 124 ± 41* 32 ± 5*
19-28-zeta 102 ± 70* 36 ± 5*
19-28-41BB-zeta 327 ± 72*, ** 45 ± 3*, **
19-41BB-zeta 6494 ± 1180*, ** 35 ± 4*
Meso-41BB-zeta 18 ± 5 7 ± 2
Saline 7 ± 3 0
CAR Costimulatory Domains Do Appear to Influence T Cell Engraftment –
mouse data
SS1 CIR expression
ntd
100 101 102 103 104
97%
Zeta
(3160)
100 101 102 103 104
76%(2467)
BBz
100 101 102 103 104
81%(981)
28z
100 101 102 103 104
89%
28BBz
(695)
100 101 102 103 104
Δz
94%(2367)
100 101 102 103 104
ce
ll c
ou
nts
Carpenito; Milone; Barrett
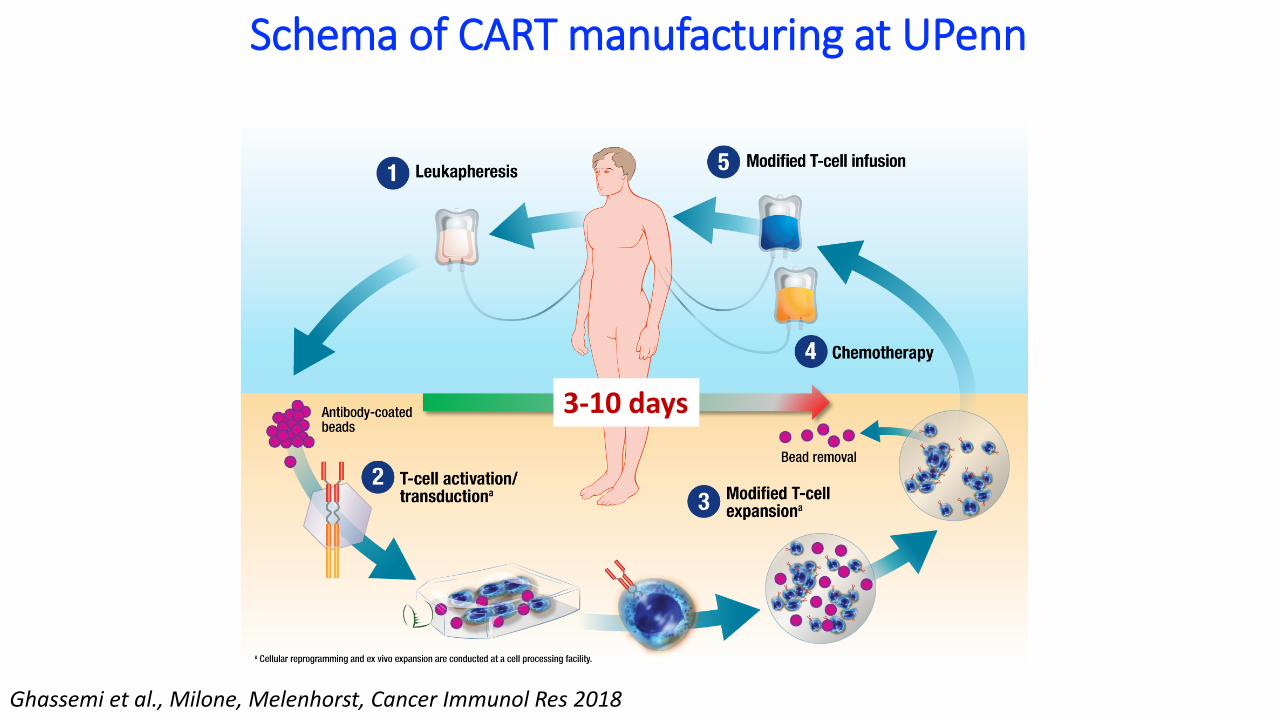
Schema of CART manufacturing at UPenn
3-10 days
Ghassemi et al., Milone, Melenhorst, Cancer Immunol Res 2018

CLL Background
Chronic lymphocytic leukemia (CLL) accounts for 25% of all newly diagnosed leukemias, with 20,940 new cases diagnosed in the US in 2018
Average at diagnosis: 70 years
Male:female ratio is 2:1
Current drug-based therapies e.g.
• first and second generation Bruton’s tyrosine kinase inhibitors (e.g. Ibrutinib),
• PI3Kd inhibition (e.g. Idelalisib),
• Bcl-2 inhibition (e.g. Venetoclax) or
• antibody-based therapies (e.g. Rituximab; targets CD20)
are not curative and all come with severe clinical and financial toxicities
Cell-based therapies, on the other hand, can be curative
ACS 2018 statistics https://www.cancer.org/cancer/chronic-lymphocytic-leukemia/about/key-statistics.html

Longest Persistence of Functional CAR T-Cells
Fraietta et al.,
(2018). Nature
Med 24:563-571
0 2 4 6 8 1 0 1 2
0
2
4
6
M o n th s P o s t-in fu s io n
0 2 4 6 8 1 0 1 2
0
2
4
6
M o n th s P o s t-in fu s io n
0 2 4 6 8 1 0 1 2
0
2
4
6
M o n th s P o s t-in fu s io n
0 2 4 6 8 1 0 1 2
0
2
4
6
Lo
g1
0 C
AR
Co
pie
s/
g
Ge
no
mic
DN
A
M o n th s P o s t-in fu s io n
No Response (NR)Partial Response (PR)Partial Response with
Transformed Disease (PRTD)Complete Response (CR)
Months post-infusion
C R P R T D P R N R
0
1
2
3
4
5
6
**
****
Pe
ak
lo
g1
0 C
AR
Co
pie
s/
g
Ge
no
mic
DN
A
*
****
C R P R T D P R N R
0
2 0 0
4 0 0
6 0 0
8 0 0
*
****
AU
C l
og
10 C
AR
Co
pie
s/
g
Ge
no
mic
DN
A O
ve
r T
ime
***
Peak Expansion Persistence
C R P R T D P R N R
0
5 0
1 0 0
1 5 0 *
*
CT
L0
19
Ce
ll
Fo
ld-E
xp
an
sio
n
**
**
-2 0 2 4 6 8
1 0 0
1 0 1
1 0 2
1 0 3
1 0 4
1 0 5
1 0 6
1 0 7
R h o : 0 .5
P = 0 .0 0 1
D ay 9 E x v iv o C T L 0 1 9 E x p a n s io n
Pe
ak
CA
R C
op
ies
/g
Ge
no
mic
DN
A
In vitro
Proliferation
In vitro Proliferation
vs. In vivo Expansion
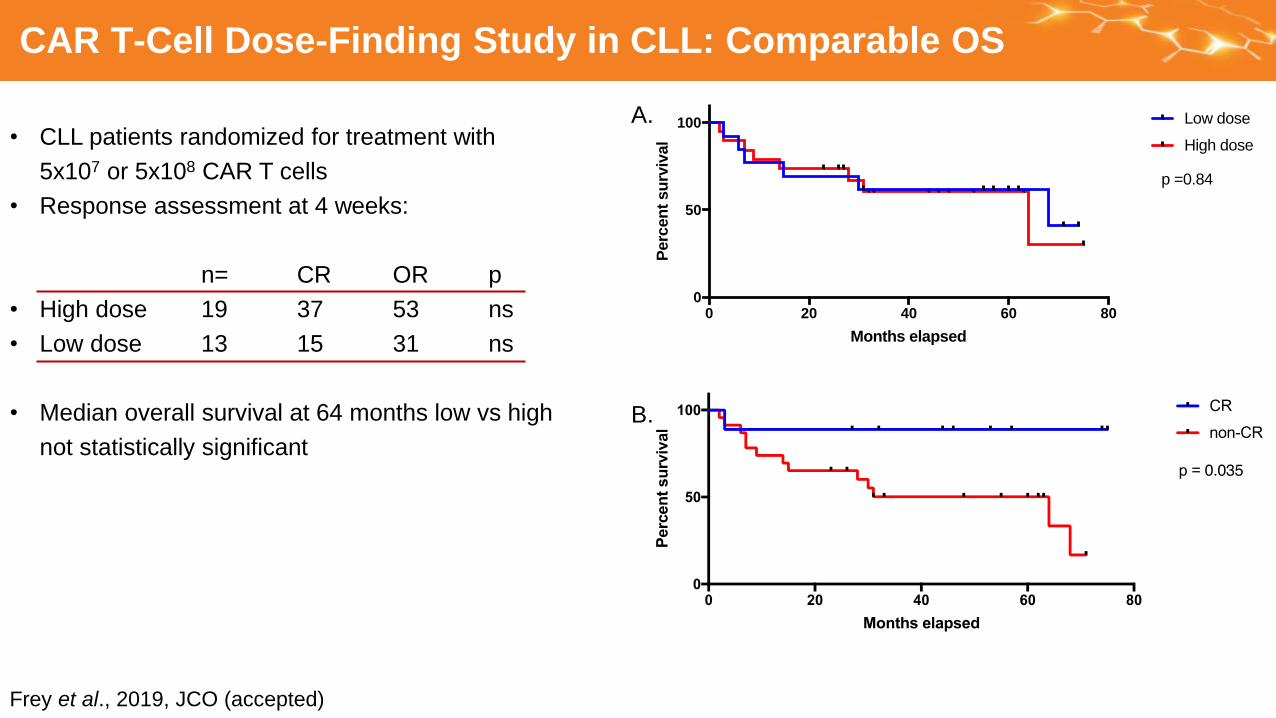
CAR T-Cell Dose-Finding Study in CLL: Comparable OS
0 20 40 60 800
50
100
Overall survival
Months elapsed
Perc
en
t su
rviv
al
Low dose
High dose
p =0.84
A.
B.
• CLL patients randomized for treatment with
5x10⁷ or 5x10⁸ CAR T cells
• Response assessment at 4 weeks:
n= CR OR p
• High dose 19 37 53 ns
• Low dose 13 15 31 ns
• Median overall survival at 64 months low vs high
not statistically significant
Frey et al., 2019, JCO (accepted)

Mechanism(s) of Response to CAR T-Cell Therapy
CR
PRTD
PR
NR-2
Genes Differentially
ExpressedSelected Pathways GSEA: T cell Memory and
Exhaustion
• Gene expression profiles of CTL019 cells generated from CR and PRTD patients exhibit marked differences compared to
those from PR and NR patients
• Gene set enrichment analysis (GSEA) revealed that CTL019 cells from CR and PRTD patients were enriched in gene
expression profiles involved in early memory differentiation
• CTL019 cells from PR and NR patients exhibited increased expression levels of key regulators of late memory cell as well
as effector differentiation, pro-apoptotic signaling and exhaustion
Fraietta et al. (2018). Nature Med 24:563-571
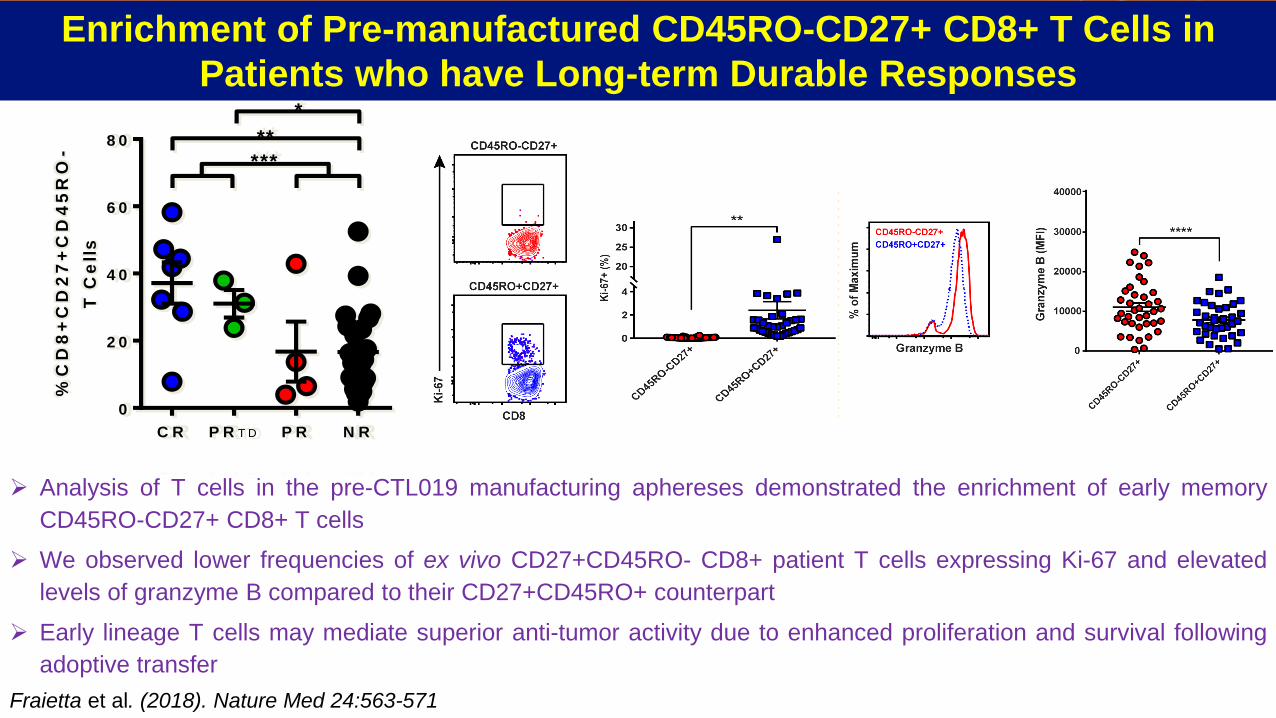
Enrichment of Pre-manufactured CD45RO-CD27+ CD8+ T Cells in
Patients who have Long-term Durable Responses
C R P R T D P R N R
0
2 0
4 0
6 0
8 0
%C
D8
+C
D2
7+
CD
45
RO
-
T C
ell
s
**
*
***
Analysis of T cells in the pre-CTL019 manufacturing aphereses demonstrated the enrichment of early memory
CD45RO-CD27+ CD8+ T cells
We observed lower frequencies of ex vivo CD27+CD45RO- CD8+ patient T cells expressing Ki-67 and elevated
levels of granzyme B compared to their CD27+CD45RO+ counterpart
Early lineage T cells may mediate superior anti-tumor activity due to enhanced proliferation and survival following
adoptive transfer
Fraietta et al. (2018). Nature Med 24:563-571
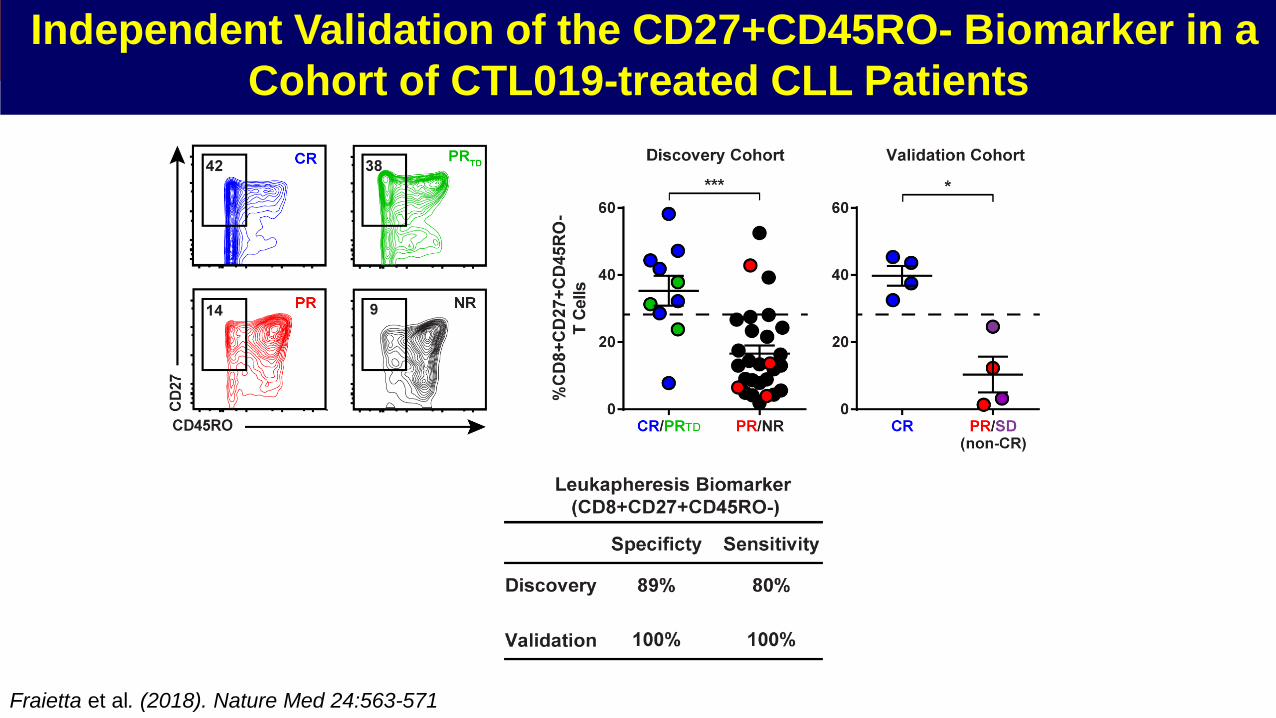
Independent Validation of the CD27+CD45RO- Biomarker in a
Cohort of CTL019-treated CLL Patients
Fraietta et al. (2018). Nature Med 24:563-571

TM | BMD | QSI
Materials
1. Porter et al., 2011, New England Journal of Medicine 365:725-33.
• Flow cytometry/FACS panels (T Cell Differentiation and Immune Checkpoint Inhibitors)
• Patient cohort and response definition:
R - Responders; NR - NonResponders
• The same CART manufacturing process was used for both CD19 (ALL, CLL, DLBCL,
FL, MCL, pedALL) and BCMA (MM) CAR-T trials1
ALL(Acute Lymphoblastic
Leukemia)
CLL(Chronic Lymphocytic
Leukemia)
NHL(Non-Hodgkin Lymphoma)
MM(Multiple Myeloma)
pedALL(pediatric ALL)
NR 7 27 14 13 5
R 23 9 18 12 53
TOTAL 30 36 32 25 58
Meng, Pruteanu et al., unpublished

TM | BMD | QSI
In-vivo proliferation: AUC (0-30 days post infusion)
In-vitro proliferation: PDL (Population Doubling Levels, between days 3-9)
In-vivo and In-vitro experience with CARTs
●
●
●
●
●
●
●
●
●
●
●
●
●
●
●
●
●
●
●
●
●
●●
●
●
●
●
●
●
●
●
●
●
●
●
●
●
●
●
●
●●
●
●
●
●
●
●
●
●
●
●
●
●
●
●●
●
●
●
●
●
●
●
●●
●
●
●
●
●
●
● ●
●
●
●
●
●
●
●
●
●
●
●
●
●
●
●
●●
●
●
●
●
●
●
●
●
●
● ●
●
●
●
●
●
●
●
●
●
●
●
●●
●●
●
●
●
●
●
●
●
●
●
●
●
●
●
●●
●
●
●
●
●
●
●
●
●
●
●
●
●
●
●
●
●
●
●
●
●
●●
●
●
●
●
●
●
●
●
●
●
●●
●● ●
●
●●
●
●
●●
●
●
●
●
●
●
●
●●●
●
●●
●
●
●
●
●
●
● ●
●
●
●
●
●
CLL MM NHL ALL pALL
CR PR−TD PR NR sCR CRVGPRPR MR SD PD CR PR PD CR CRi NR PD CR CRi NR PD
1 ´ 102
1 ´ 103
1 ´ 104
1 ´ 105
1 ´ 106
qPC
R A
UC
0-30
●
●
●
●
●
●
●
●
●
●●●
●
●
●
●
●
●
●
●
●
●●
●
●
●
●
●
●
●●
●
●
●
●
●
●
●●●
●
●
●
●
●
●
●
●●
●
●
●
●●
●
●
●
●
●
●
●
●
●
●
●
●●
●
●
●
● ●
●●
●
●
● ●●
● ●
●
●
●
●
●●
●
●
●
●
●
●●
●●
●
●
●●
●●
●
●
●
●
●
●
●
●●
●
●
●
●
●
●
●
●
●
●●
●●
●
●
●
●
●
●
●●
●
●
● ●
●
●
●
●
CLL MM NHL ALL
CR PR−TD PR NR sCR CR VGPR PR MR SD PD CR PR PD CR CRi NR PD
−2.5
0.0
2.5
5.0
7.5
PD
L3
-9
CLL MM NHL ALL pALL
CLL MM NHL ALL
CR PR-TD PR NR sCR CR VGPR PR MR SD PD CR PR PD CR CRi NR PD CR CRi NR PD
qP
CR
AU
C0
-30
PD
L3
-9
CR PR-TD PR NR sCR CR VGPR PR MR SD PD CR PR PD CR CRi NR PD
Meng, Pruteanu et al., unpublished

TM | BMD | QSI
Identifying T cell sub-populations through gating, PCA, UMAP and Cohen’s distance
Preprocessing Batch Effect Correction1
Identifying distinct T cell
populations2
Identifying response
associated populations3
Aphaeresis samples
Gating for CD3+ cells
(both CD4 and CD8
compartments)
Sample 1000 cells per
FCS file
1. Stuart et al., 2019, Cell 177(7):P1888-1902.E21
2. L.J.P van der Maaten et al., 2014, JMLR 15:3221-3245
3. Cohen, 1992, Psychological Bulletin 112:155-159
HLA−DR
CCR7
CD127
CD27
CD95
CD45RO
CD28
KLRG1
5 4 7 1 2 3 0 6
−2
−1
0
1
2

TM | BMD | QSI
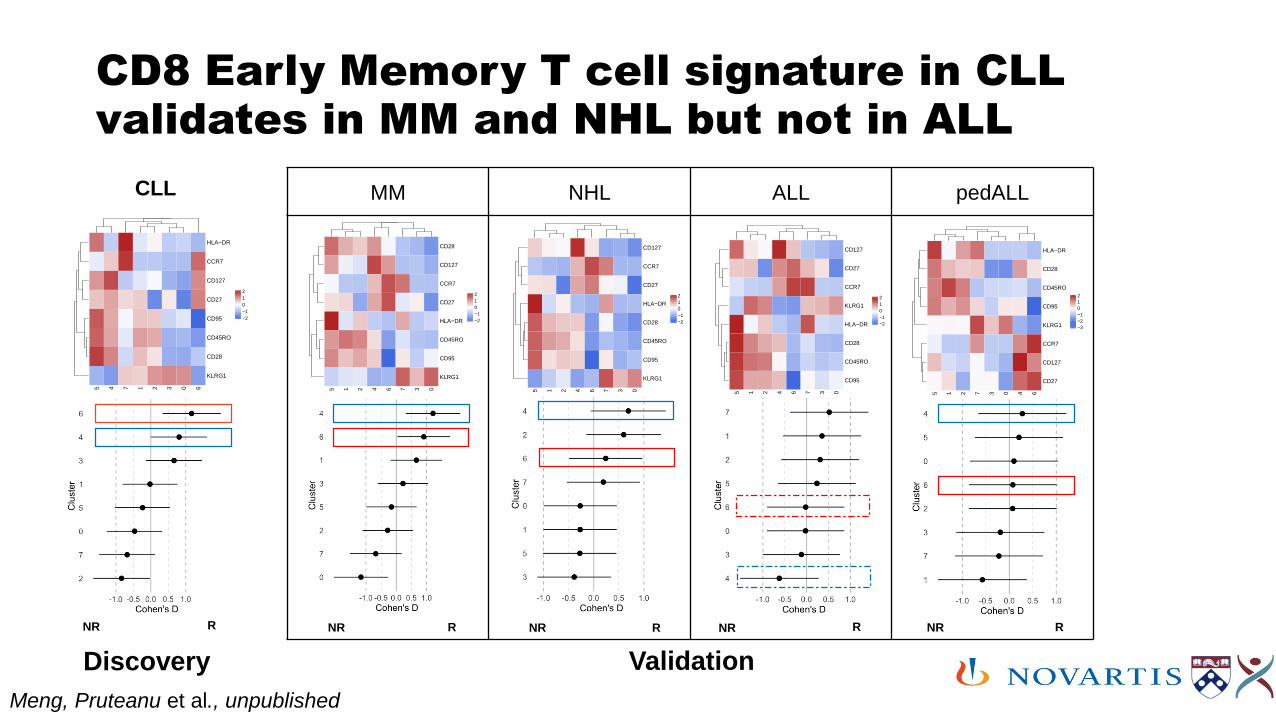
Biomarker Discovery
CLL aphaeresis data are used as discovery cohort for cluster identification:
Clustering structure from CLL (clusters 0-7) is then validated within MM, DLBCL, ALL and
pedALL cohorts.
HLA−DR
CCR7
CD127
CD27
CD95
CD45RO
CD28
KLRG1
5 4 7 1 2 3 0 6
−2
−1
0
1
2
Cohen’s distance (D): indicates standardized
difference between two means
NR R
Meng, Pruteanu et al., unpublished
TM | BMD | QSI
CD8 Early Memory T cell signature in CLL validates in MM and NHL but not in ALL
HLA−DR
CCR7
CD127
CD27
CD95
CD45RO
CD28
KLRG1
5 4 7 1 2 3 0 6
−2
−1
0
1
2
CLL MM NHL ALL pedALL
CD28
CD127
CCR7
CD27
HLA−DR
CD45RO
CD95
KLRG1
5 1 2 4 6 7 3 0
−2
−1
0
1
2
CD127
CCR7
CD27
HLA−DR
CD28
CD45RO
CD95
KLRG1
5 1 2 4 6 7 3 0
−2
−1
0
1
2
CD127
CD27
CCR7
KLRG1
HLA−DR
CD28
CD45RO
CD95
5 1 2 4 6 7 3 0
−2
−1
0
1
2
HLA−DR
CD28
CD45RO
CD95
KLRG1
CCR7
CD127
CD27
5 1 2 7 3 0 4 6
−3
−2
−1
0
1
2
Discovery Validation
NR R NR R NR R NR RNR R
Meng, Pruteanu et al., unpublished

TM | BMD | QSI
Naïve and Central Memory T-cells abundance across diseases
●
●
●●
●
●
●
●
●
●
●● ●
●
●●
●
●
●
●
●
●
●
●
●
● ●
●
●
●
●
●
●
●
●
●
●
●
●
●
●●
●
●
●● ●●
●
● ●●● ● ●
●
●
●
●
● ●● ● ●● ●● ●● ●
●
●●
●
●
● ● ●● ●●
●
●
●
●●
●
●
●●
●
●
●
●
●
●
●
●
●
●
●
●
●
●
●
●●
●●●
●
●
●
●
● ●
●
●
● ●
●●
●
●
●
●●
●●●
●
●
●
●
●
●●
●
●
●
●
●
●
●
●
●
●
●
●
●
●
●
●
●
●
●
●
●
●
●
●
●
●
●
●
●
●
●
●
●
●
●
●
●●
●
●
●
●●●
●
●
●
●
●
●
●
●
● ●
●
●●
●●●
●
●
●
●
●
●
●
●
●
●
●
●
●
●●
●
●
●
●
●●
●
●
●
●
●
●
●●
●
●
●
●
●
●
●
●
●
●
●
●
●
●
●
●
●
●
●
●
●
●
●
●
●
●
●
●
●●
●
●
●
●
●
●
●
●
●
●
●●
●
●
●● ●
●
●
●
●
●● ●●
●
●
●
●
●
●
●
●●●
●
●
●
●
●
●
●●●
●
●
●
●
●
●
●
●
●
●●
●
●●
●
●
●
●
● ●●
●
●
●
●
●
●
●
●
●
●
●
●
●
●
●
●
●
●
●●
●
●
●
●
●
●
●
●
●
●
●
●
●
●
●
●
●
●
●
●
●
●
●
●
●
●
●
●
●
●
●
●
●
●
●
●
●
●
●
●
●
●
●
6
CLL
6
MM
6
NHL
6
ALL
6
pALL
4
CLL
4
MM
4
NHL
4
ALL
4
pALL
R NR R NR R NR R NR R NR
0
25
50
75
0
25
50
75
% C
D8
Cluster 4 (Central Memory)
Cluster 6 (Naïve)
wit
hin
CD
8+
cells
Meng, Pruteanu et al., unpublished

Immunobiology of CAR T Cell Therapies
TN TEM TEFFTSCM TCM
Self-renewal
Proliferation
Target
cell lysis
Cytokine
polyfunctionality
Inflammatory
cytokine
amplitude
Ma
gn
itu
de
CD45RO
CD
27
• In CLL we can identify a subset that contains most-potent CAR T cell precursors.
• Refinement studies under way

Kinetics of Anti-BCMA CAR T-Cells Correlates with Decline in solBCMA
• In vivo
expansion of
CART-BCMA
cells correlates
with tumor
reduction
(measured by
ELISA for
BCMA and
clinical labs)
sCR, stringent complete remissoin;
VGPR, very good partial response; SD,
stable disease; PD, progressive disease

Kinetics of Anti-BCMA CAR T-Cells Correlates with Decline in solBCMA
Post-infusion
ICI phenotype profile of CD8 T cells
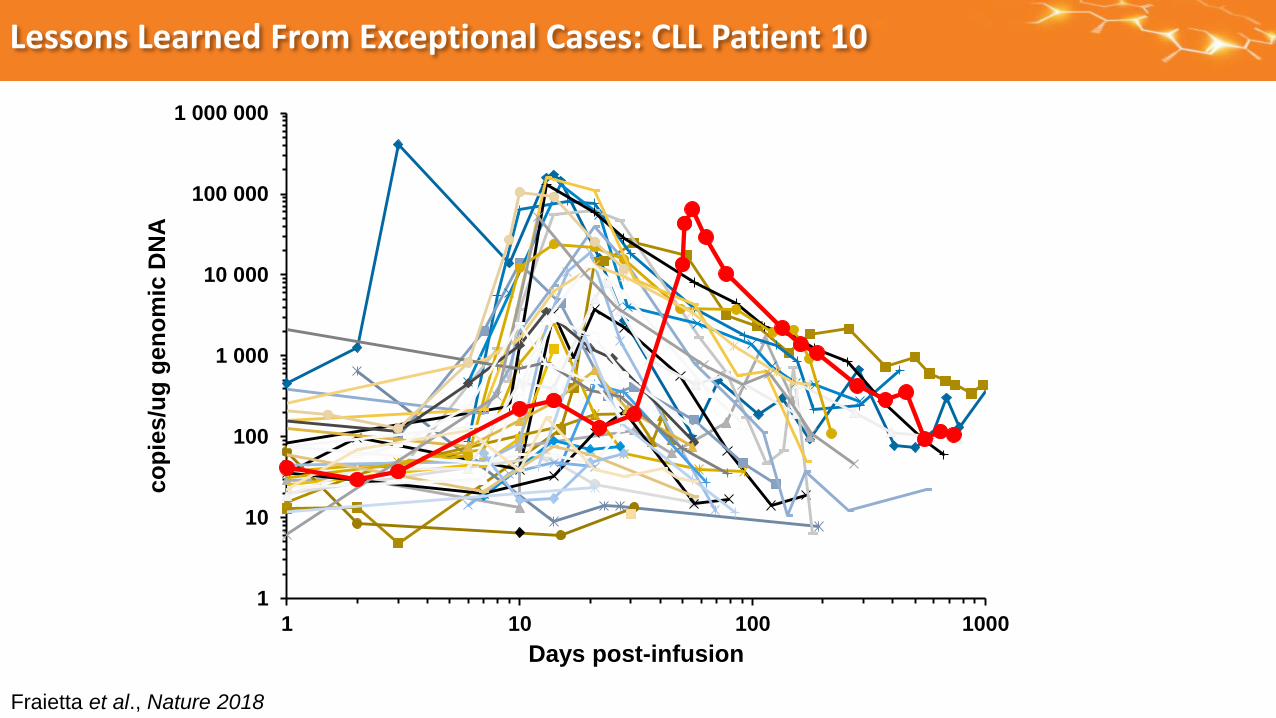
Lessons Learned From Exceptional Cases: CLL Patient 10
1
10
100
1 000
10 000
100 000
1 000 000
1 10 100 1000
co
pie
s/u
g g
en
om
ic D
NA
Days post-infusion
Fraietta et al., Nature 2018
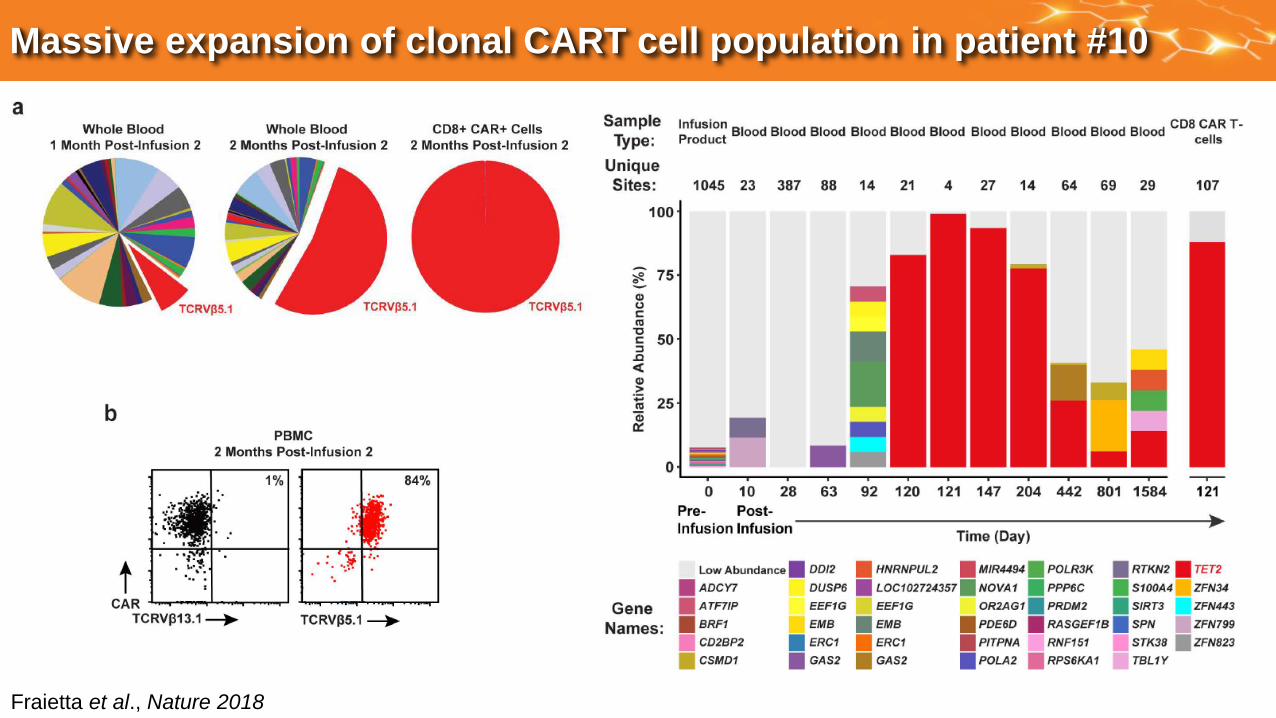
Massive expansion of clonal CART cell population in patient #10
Fraietta et al., Nature 2018

TET2 Deficiency Increases CAR T-Cell Proliferative Capacity
Stim 1. Stim 2. Stim 3.
D0Stim 1
D1D7
Stim 2
D8D12Stim 3
D13
D17
Stimulate CAR T cells with
leukemic targets
- Count- Freeze for
FACS
Collect supernatants
Secretomics• Cytokine secretion (sustained broad spectrum cytokine production)• Metabolites (glucose metabolism, lactic acid production)
Collect supernatants
Collect supernatants
- Count- Freeze for
FACS
- Count- Freeze for
FACS• CAR T cells expressing TET2-targeting or
non-targeting shRNA generated in 9d
culture
• Cells were sorted prior to restimulation
assay
Fraietta et al., Nature 2018

TET2 Deficiency Alters T-Cell Differentiation
Central
Memory
Effector
MemoryEffectorCD8+
CD4+
Fraietta et al., Nature 2018
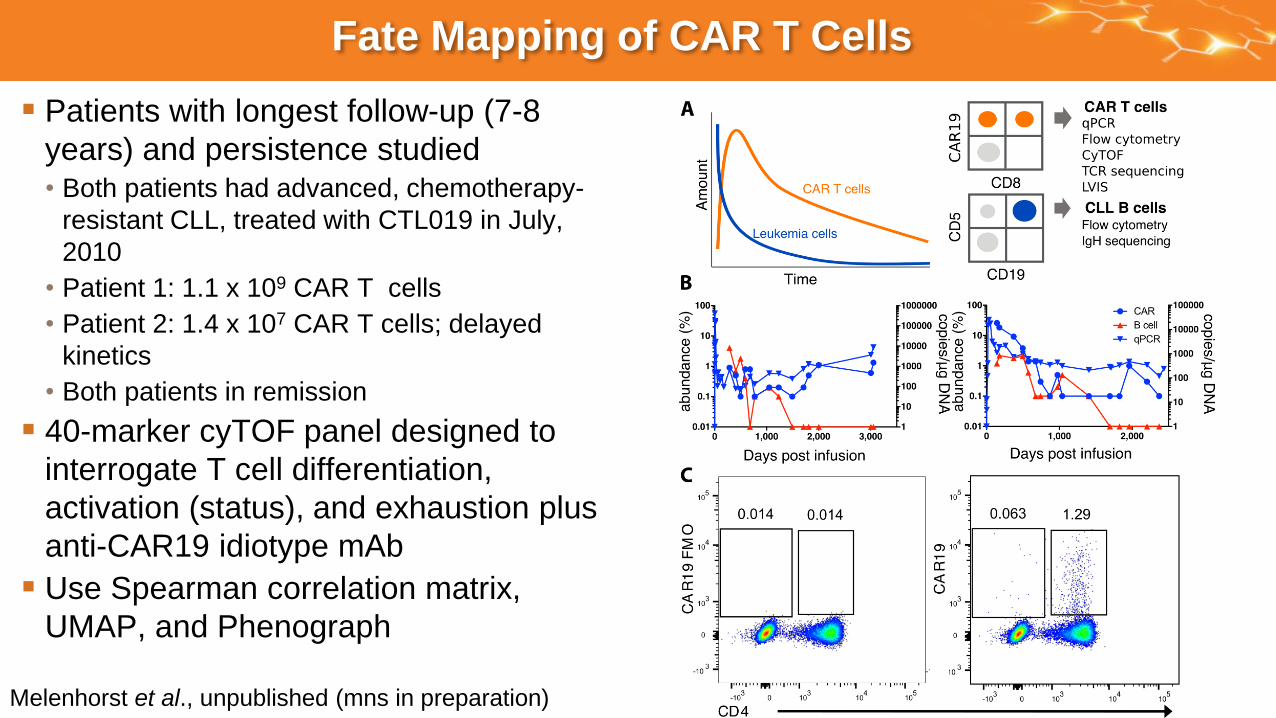
Fate Mapping of CAR T Cells
Patients with longest follow-up (7-8
years) and persistence studied• Both patients had advanced, chemotherapy-
resistant CLL, treated with CTL019 in July,
2010
• Patient 1: 1.1 x 10⁹ CAR T cells
• Patient 2: 1.4 x 10⁷ CAR T cells; delayed
kinetics
• Both patients in remission
40-marker cyTOF panel designed to
interrogate T cell differentiation,
activation (status), and exhaustion plus
anti-CAR19 idiotype mAb
Use Spearman correlation matrix,
UMAP, and Phenograph
Melenhorst et al., unpublished (mns in preparation)
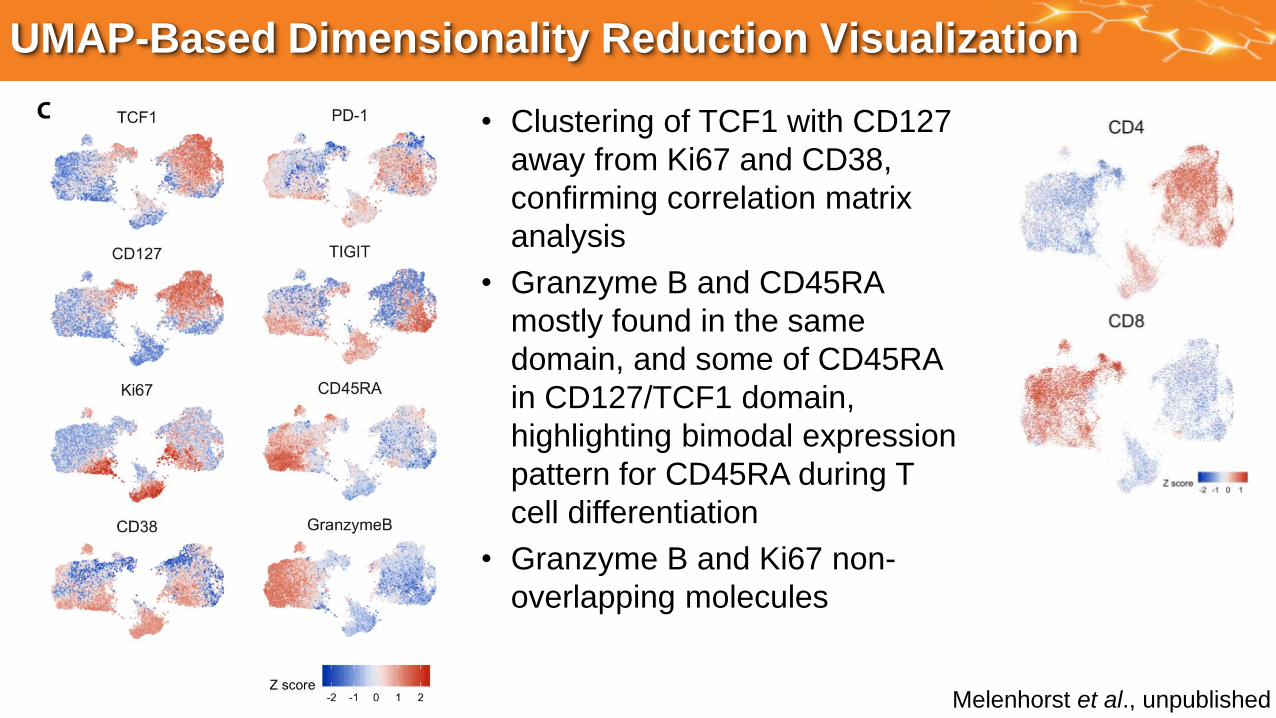
UMAP-Based Dimensionality Reduction Visualization
• Clustering of TCF1 with CD127
away from Ki67 and CD38,
confirming correlation matrix
analysis
• Granzyme B and CD45RA
mostly found in the same
domain, and some of CD45RA
in CD127/TCF1 domain,
highlighting bimodal expression
pattern for CD45RA during T
cell differentiation
• Granzyme B and Ki67 non-
overlapping molecules
Melenhorst et al., unpublished

Identification of Phenotypically Stable Clusters with Phenograph
• 16 phenotypically distinct T
cell clusters
• Distinct clusters dominated
T cell repertoire in both
patients
• CD4+ CAR T cells
gradually dominated CAR
T cell repertoire in both
patients, suggesting a
prominent role for CD4+
CAR T cells in sustained
remissions
• In both patients, clusters 4
and 10 most prominent:
Actively cycling, negatively
regulated CD4+ CAR T
cells
• Low-level persistence of
CD8 CAR T cell clusters 2
and 5
1514131211109
8
7
6
5
4
3
21
0
151413
12
11
109
8
7
6
54
3
2
1
0
1514
13
12
11
10
9
8
7
6
5
4
3
2
1
0
1514131211
10
9
8
76
5
4
3
2
1
0
1514131211
10
9876
5
4
32
1
0
15
14131211109876
5
43
2
1
0
15
14
1312
11109
876
5
43
2
1
0
15
14131211109876
5
4
3
2
1
0
15
14131211
10
9876
5
4
3
2
1
0
1514131211
10
98765
4
321
0
patient 2
patient 1
0 1000 2000
0 500 1000 1500 2000
0.00
0.25
0.50
0.75
1.00
0.00
0.25
0.50
0.75
1.00
days post infusion
pro
po
rtio
n
cluster
0
1
2
3
4
5
6
7
8
9
10
11
12
13
14
15
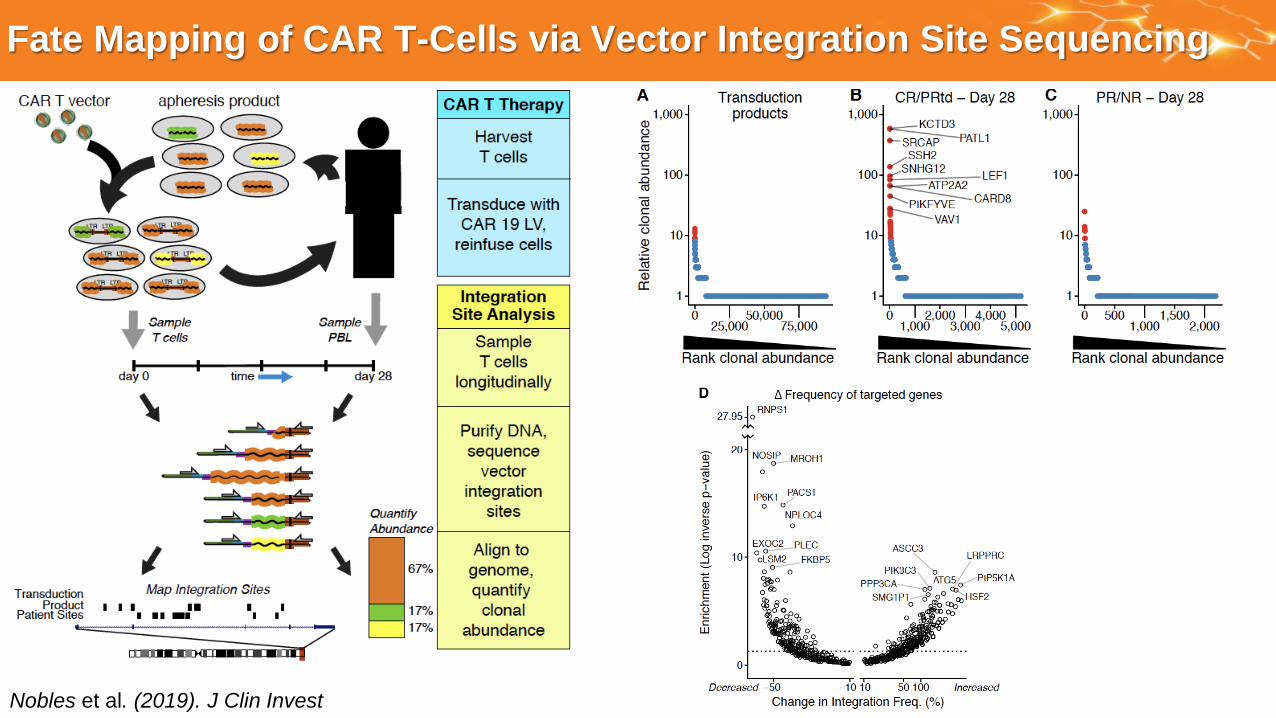
Fate Mapping of CAR T-Cells via Vector Integration Site Sequencing
Nobles et al. (2019). J Clin Invest
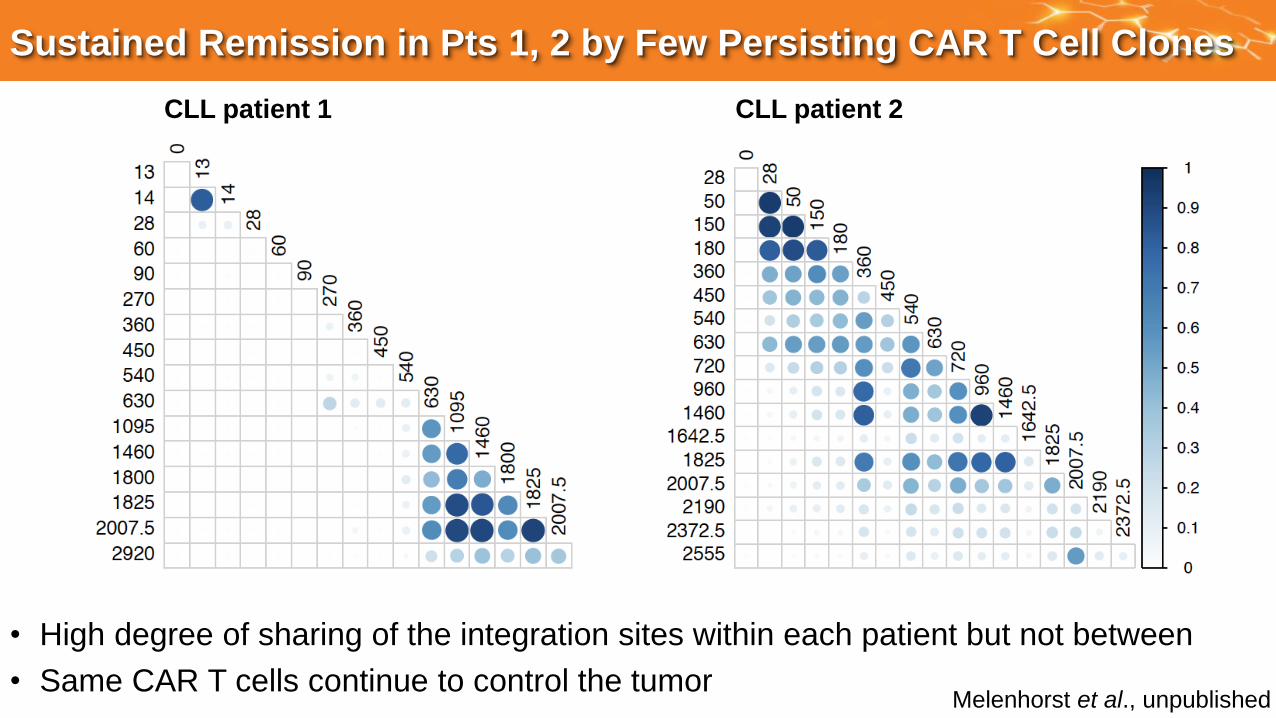
Sustained Remission in Pts 1, 2 by Few Persisting CAR T Cell Clones
CLL patient 1 CLL patient 2
• High degree of sharing of the integration sites within each patient but not between
• Same CAR T cells continue to control the tumor Melenhorst et al., unpublished

Oligoclonal Composition of Memory CAR-T Cells
CLL patient 1 CLL patient 2
• Infusion product in both patients highly polyclonal
• CAR integration site landscape in both patients
demonstrates selective clonal expansion and persistence
• CAR integration site repertoire in both patients appears to come in two separate
waves, coincident with switch from CD8 to CD4 dominance Melenhorst et al., unpublished
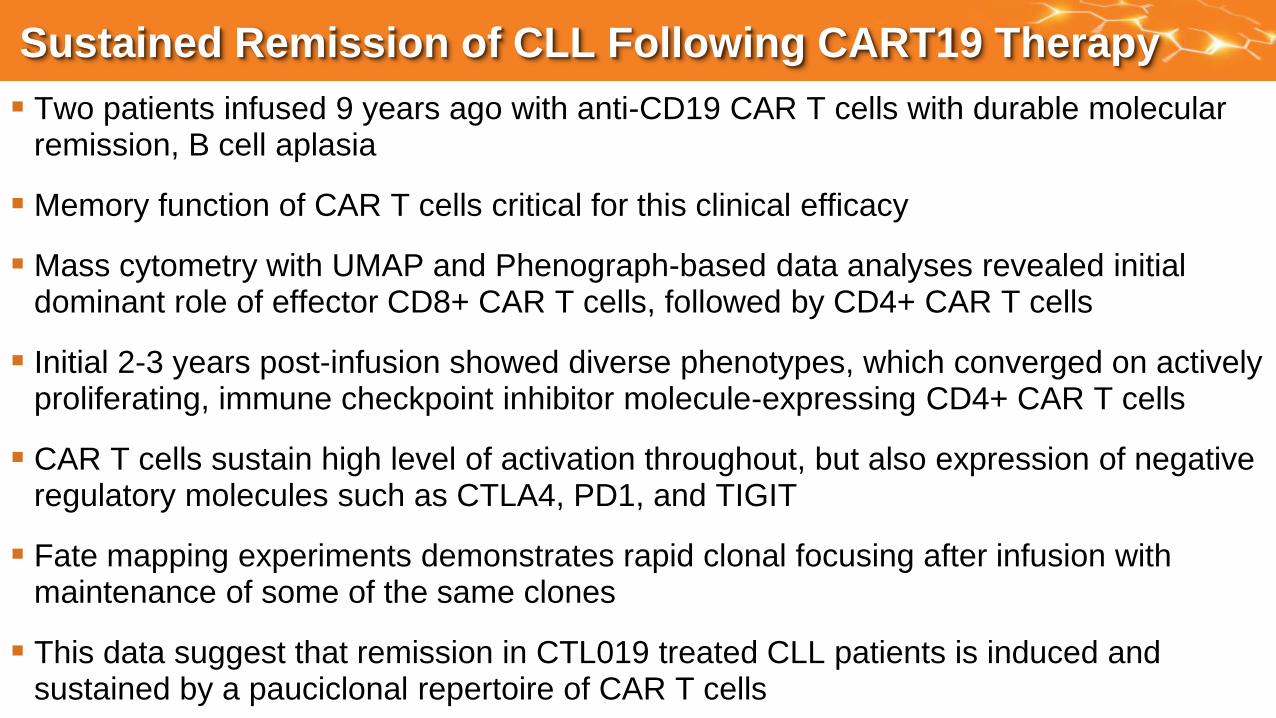
Sustained Remission of CLL Following CART19 Therapy
Two patients infused 9 years ago with anti-CD19 CAR T cells with durable molecular remission, B cell aplasia
Memory function of CAR T cells critical for this clinical efficacy
Mass cytometry with UMAP and Phenograph-based data analyses revealed initial dominant role of effector CD8+ CAR T cells, followed by CD4+ CAR T cells
Initial 2-3 years post-infusion showed diverse phenotypes, which converged on actively proliferating, immune checkpoint inhibitor molecule-expressing CD4+ CAR T cells
CAR T cells sustain high level of activation throughout, but also expression of negative regulatory molecules such as CTLA4, PD1, and TIGIT
Fate mapping experiments demonstrates rapid clonal focusing after infusion with maintenance of some of the same clones
This data suggest that remission in CTL019 treated CLL patients is induced and sustained by a pauciclonal repertoire of CAR T cells
Acknowledgements
UPenn ClinicalDavid PorterNoelle FreyAl GarfallAdam CohenSteve SchusterEd Stadtmauer
TCSLSimon LaceyLifeng TianHarit ParakandiVanessa GonzalezJeff FinklesteinFarzana NazimuddinTatiana MikheevaChelsie BartozekBrett MenchelIrina KulikovskayaMinnal GuptaRachel ReynoldsAngela KimFang ChenNatalka KoterbaMohsin Mahir
CCI & June lab
Carl JuneAnne ChewRegina Young
Biostatistics DepartmentWei-Ting Hwang
PDLEdward Pequignot
Jun XuJanuary McKeeMercy Gohil
CVPFDon SiegelBruce LevineAnne LamontagneAlex MalykhinMatt O’Rourke
Lentiviral vector Integration site analysisRick BushmanChris Nobles
NovartisJen BrogdonHans BitterElena OrlandoIulian Pruteanu
Wherry labJohn WherryAlex HuangCécile AlianoTakuya Ohtani
CHOPSteve GruppDavid Barrett
Shannon MaudeDavid Teachey
TCELYangbing ZhaoXiaojun Liu
Melenhorst labMcKensie CollinsMamie WangStefan LundhEthan JungKimbery ApodacaHongxing SunJie XuRahul Arya
Fraietta labJoe FraiettaWeimin Kong
Camara labPablo Gonzalez-CamaraSteven Woodhouse