Embed Size (px)
Citation preview
The National Science Foundation Center for Energy Smart Electronic Systems (ES2) Research Activities at UTA
Dereje Agonafer April 22, 2015
1
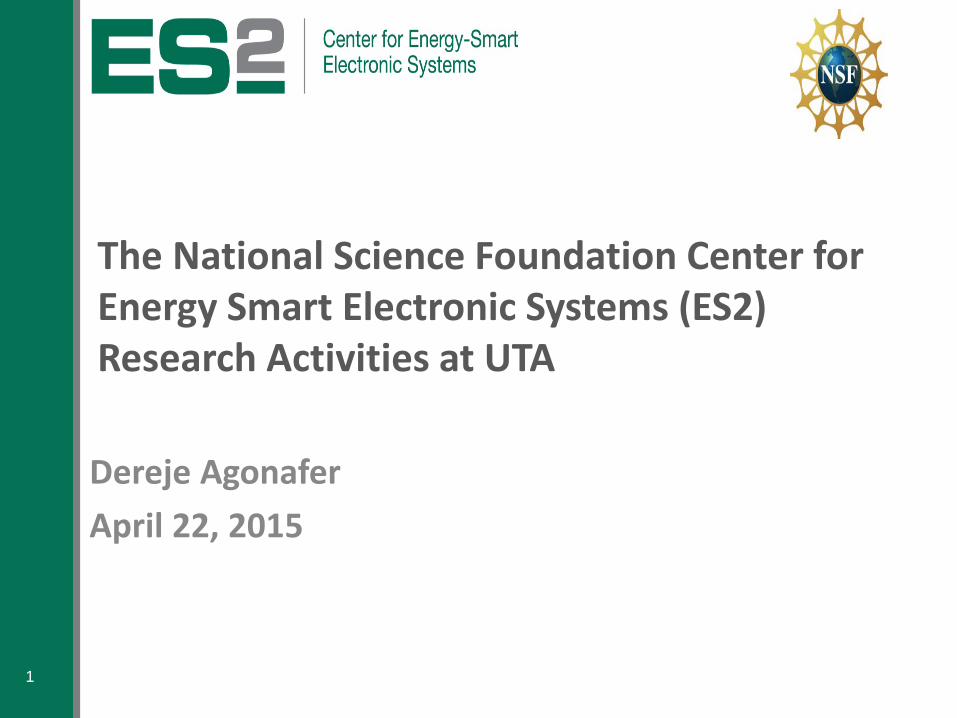
The Center for Energy-Smart Electronic Systems
Collaborator: Bahgat Sammakia (BU)
Mentors
PI: Dereje Agonafer (UTA) UTA Students Betsegaw Gebrehiwot, PhD
Abhishek S Guhe, MSc Aniket R Kalambe, MSc Digvijay Sawant, MSc Dhanraj A Patil, MSc Rajat Singh, MSc Kanan D Pujara, MSc Vishnu Sreeram, MSc Suhas Sathyanarayan, MSc Palak V Patel, MSc BU Student Husam Alissa
David Mendo and Simpson Cumba Comcast Deepak Sivanandan, Mark Hendrix, and Tom Craft CommScope
Veerendra Mulay Facebook Akhil Docca and Mark Seymour Future Facilities Saurabh Shrivastava and Yasin Makwana Panduit Naveen Kannan, James Hoverson, Jim Jagers, and Mike Kaler Mestex
Robert Yurcik Verizon Wireless
Nikhil Palak Abhishek Kanan
Baviskar Patel Guhe Pujara
MSc Student MSc Student MSc Student MSc Student
Betsegaw Suhas Vishnu Digvijay Rajat Dhanraj Aniket
Gebrehiwot Sathyanarayan Sreeram Sawant Singh Patil Kalambe
PhD Student MSc Student MSc Student MSc Student MSc Student MSc Student MSc Student
MAXIMIZING USE OF EFFICIENT AIR-SIDE ECONOMIZATION IN MODULAR, LARGE DATA CENTERS AND DATACOM HOUSING UNITS
5/8/2015 UTA, EMNSPC 3
Anantha Sridhar MSc Student Nagaratnakar Kotari MSc Student
Dakshini Musali MSc Student
Adithya
Pothuri
MSc Student
Strategic Goal/Project Description
• This project is aimed at maximizing use of efficient air-side economization in modular, large data centers and Datacom housing units
• Determine percentage of a year a data center at a given location could use air-side economization with and without evaporative cooling systems.
• Improve control system – Integration of saturation effectiveness curves into the cooling system control algorithm – Control air mixing of cold ambient air with hot data center exhaust air – When to dump sump water: Control total dissolved solids (TDS) concentration in the
sump water
• Minimize water usage of evaporative cooling systems – Study effect of total dissolved solids (TDS) concentration on life of cooling pads – Study life of cooling pads – Selection of cooling pads
• Provide best practices for using the above methods of cooling
5/8/2015 UT-Arlington, EMNSPC 4
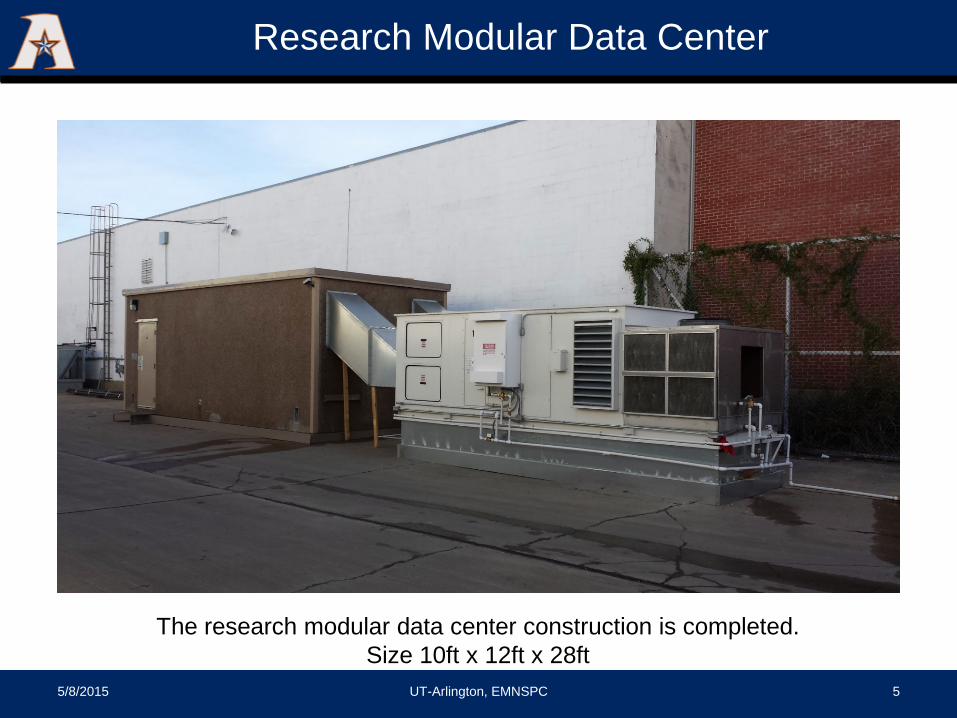
Research Modular Data Center
5/8/2015 UT-Arlington, EMNSPC 5
The research modular data center construction is completed. Size 10ft x 12ft x 28ft
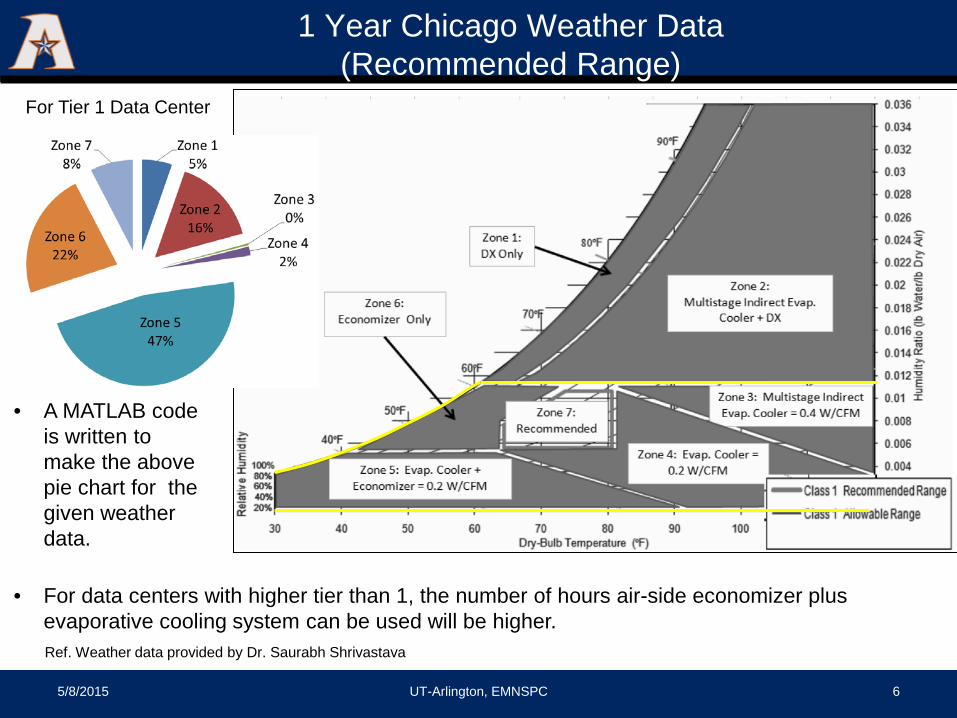
1 Year Chicago Weather Data (Recommended Range)
5/8/2015 UT-Arlington, EMNSPC 6
Ref. Weather data provided by Dr. Saurabh Shrivastava
For Tier 1 Data Center
• For data centers with higher tier than 1, the number of hours air-side economizer plus
evaporative cooling system can be used will be higher.
• A MATLAB code is written to make the above pie chart for the given weather data.
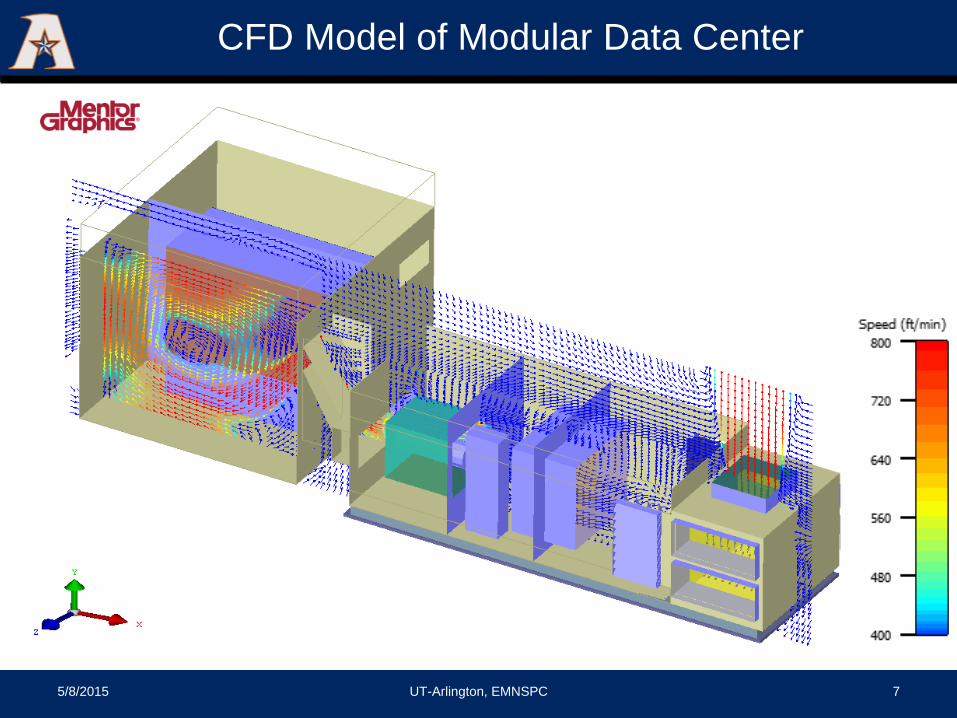
CFD Model of Modular Data Center
5/8/2015 UT-Arlington, EMNSPC 7
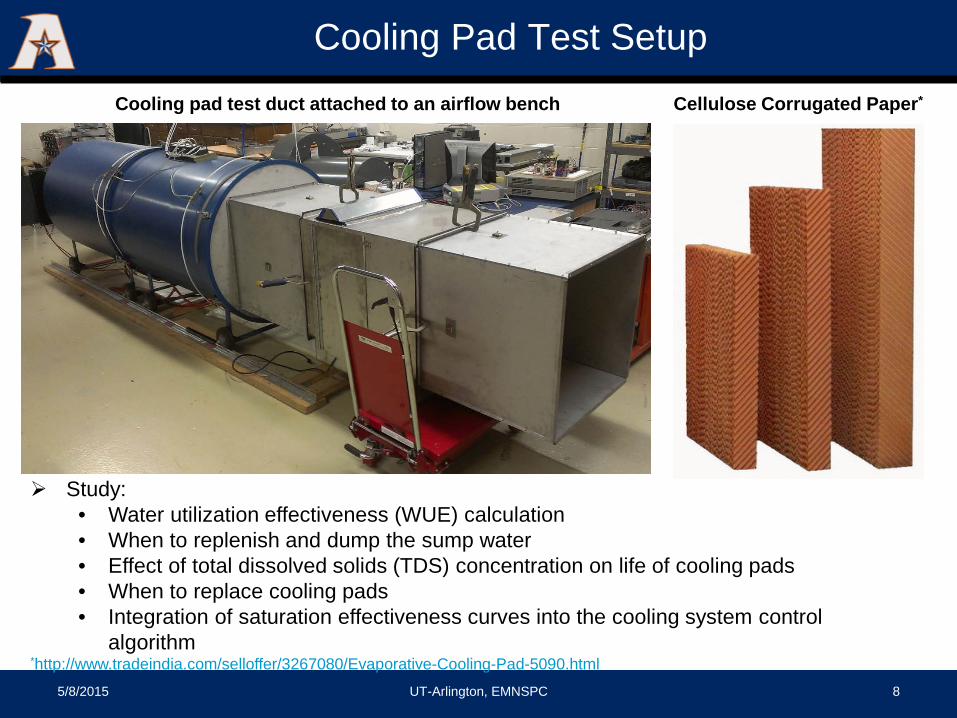
Study: • Water utilization effectiveness (WUE) calculation • When to replenish and dump the sump water • Effect of total dissolved solids (TDS) concentration on life of cooling pads • When to replace cooling pads • Integration of saturation effectiveness curves into the cooling system control
algorithm
Cooling Pad Test Setup
5/8/2015 UT-Arlington, EMNSPC 8
Cooling pad test duct attached to an airflow bench Cellulose Corrugated Paper*
*http://www.tradeindia.com/selloffer/3267080/Evaporative-Cooling-Pad-5090.html
Measuring Particulate and Gaseous Contaminants in Data Centers
5/8/2015 UT-Arlington, EMNSPC 9
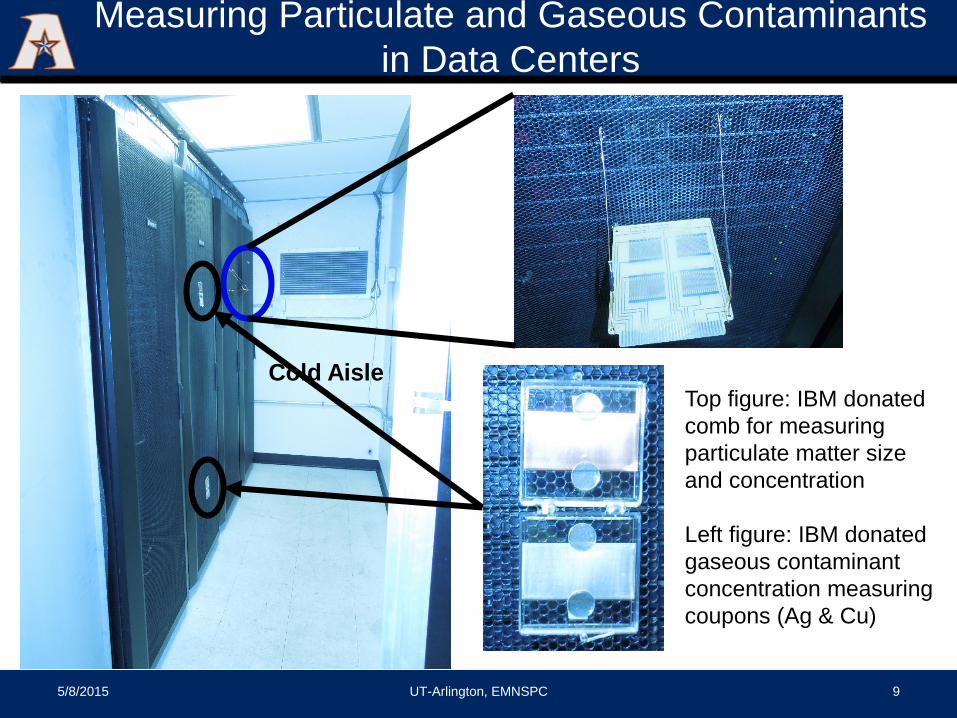
Top figure: IBM donated comb for measuring particulate matter size and concentration Left figure: IBM donated gaseous contaminant concentration measuring coupons (Ag & Cu)
Cold Aisle
Measuring Particulate and Gaseous Contaminants in Data Centers Impacts of
Particulate and Gaseous Contamination on IT Equipment Where Air Side Economizers Are
Implemented

• Team Leads:
– Jimil Shah, PhD Student – Oluwaseun Awe, PhD Student
• Masters Students: – Kanan Pujara – Tejeshkumar Bagul (Graduated in December 2014)
5/8/2015 UT-Arlington, EMNSPC 11
Team Members
Contamination Study Plan
• Phase 1 (Completed): – The origin and concentration of gases – Classification of contaminants on the basis of corrosivity – Narrow down the list of contaminants – Concentrate on tackling the contaminants
• Phase 2 (In progress):
– Dedicated to computational study. – Effects of contaminants on various data center equipment
• Phase 3 (In progress):
– Primary Focus - Validation of CFD models with experiments – Effects of various contaminants under varying temperature and
humidity conditions 5/8/2015 UT-Arlington, EMNSPC 12
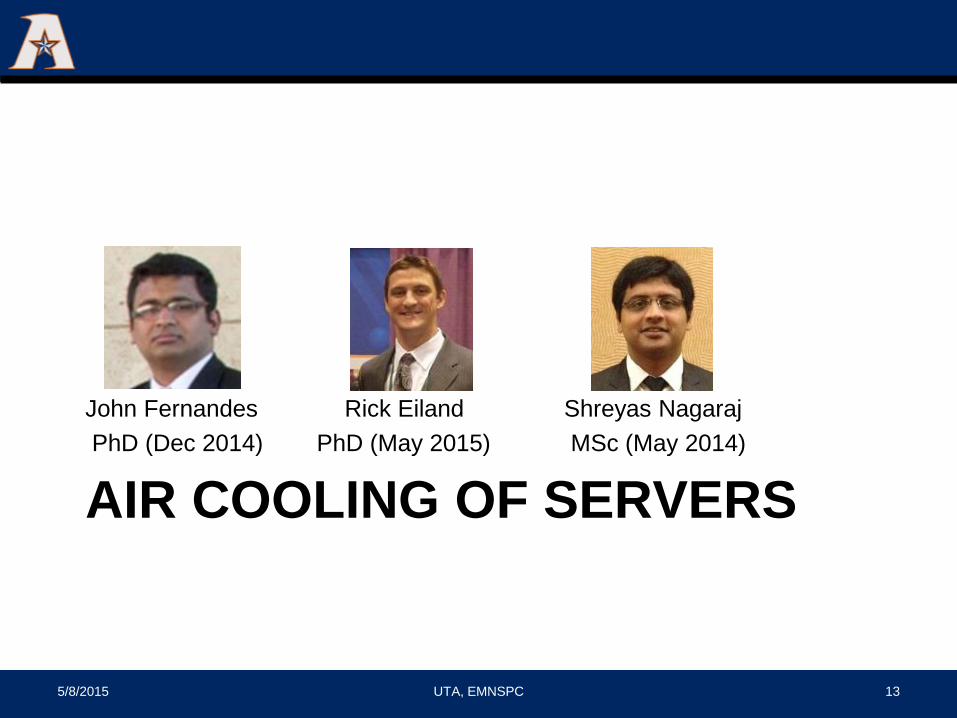
AIR COOLING OF SERVERS
John Fernandes Rick Eiland Shreyas Nagaraj PhD (Dec 2014) PhD (May 2015) MSc (May 2014)
5/8/2015 UTA, EMNSPC 13
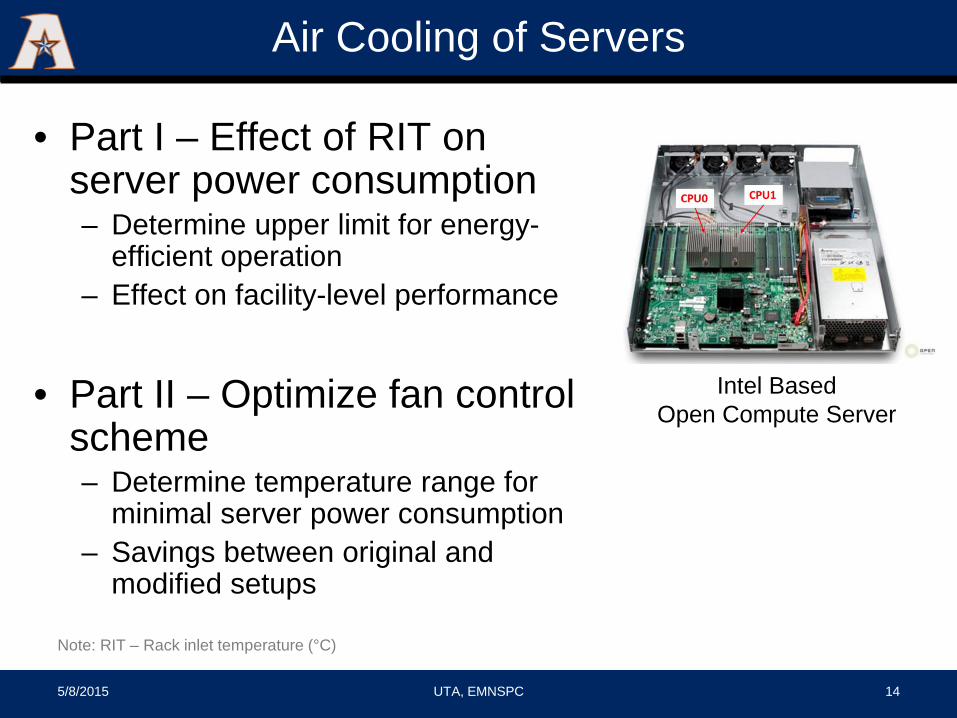
Air Cooling of Servers
• Part I – Effect of RIT on server power consumption – Determine upper limit for energy-
efficient operation – Effect on facility-level performance
• Part II – Optimize fan control
scheme – Determine temperature range for
minimal server power consumption – Savings between original and
modified setups
5/8/2015 UTA, EMNSPC 14
Note: RIT – Rack inlet temperature (°C)
Intel Based Open Compute Server
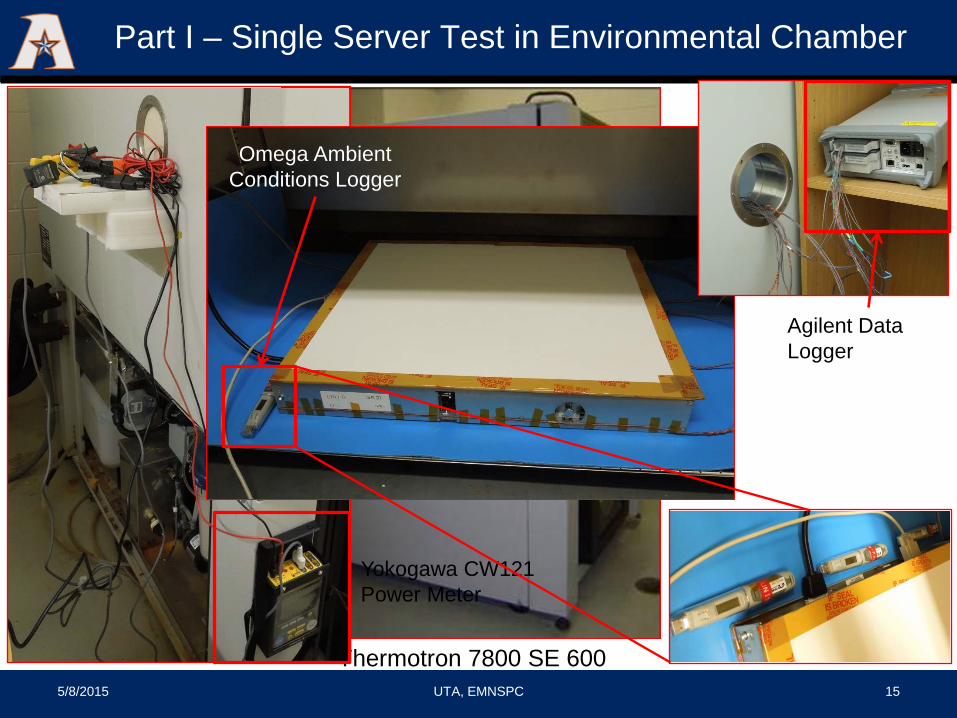
Thermotron 7800 SE 600
Part I – Single Server Test in Environmental Chamber
Agilent Data Logger
Yokogawa CW121 Power Meter
Omega Ambient Conditions Logger
5/8/2015 UTA, EMNSPC 15
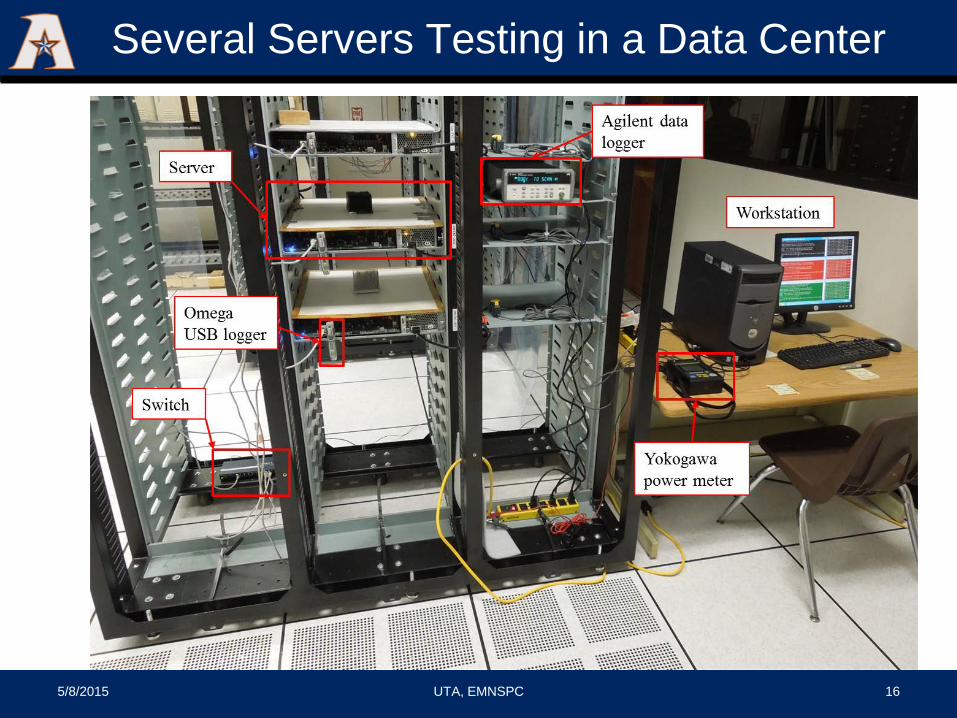
Several Servers Testing in a Data Center
5/8/2015 UTA, EMNSPC 16
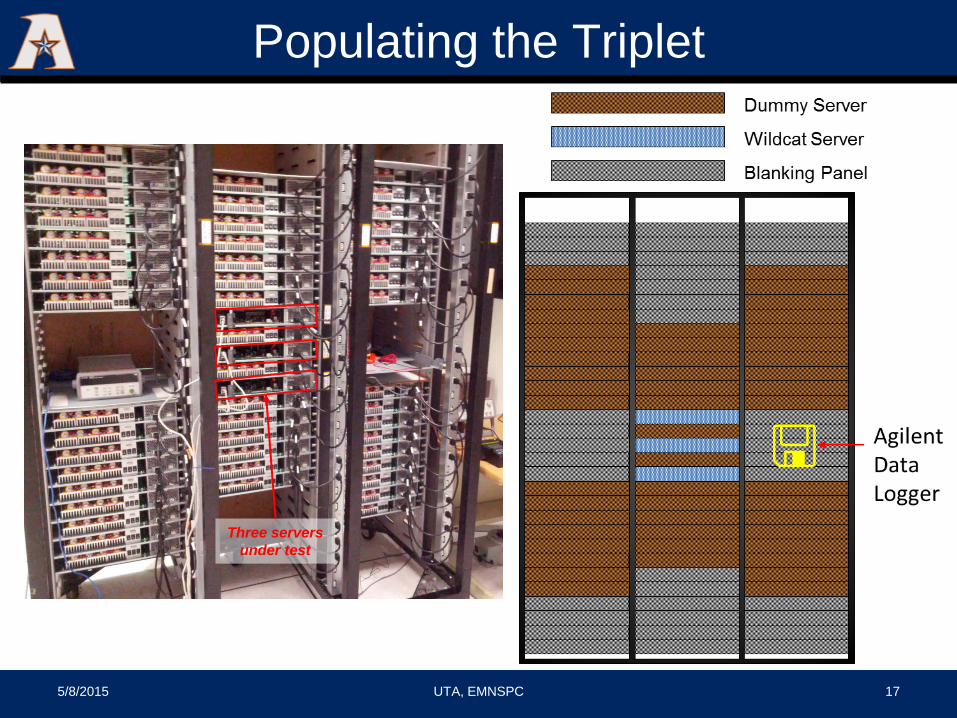
Populating the Triplet
5/8/2015 UTA, EMNSPC 17
Three servers under test
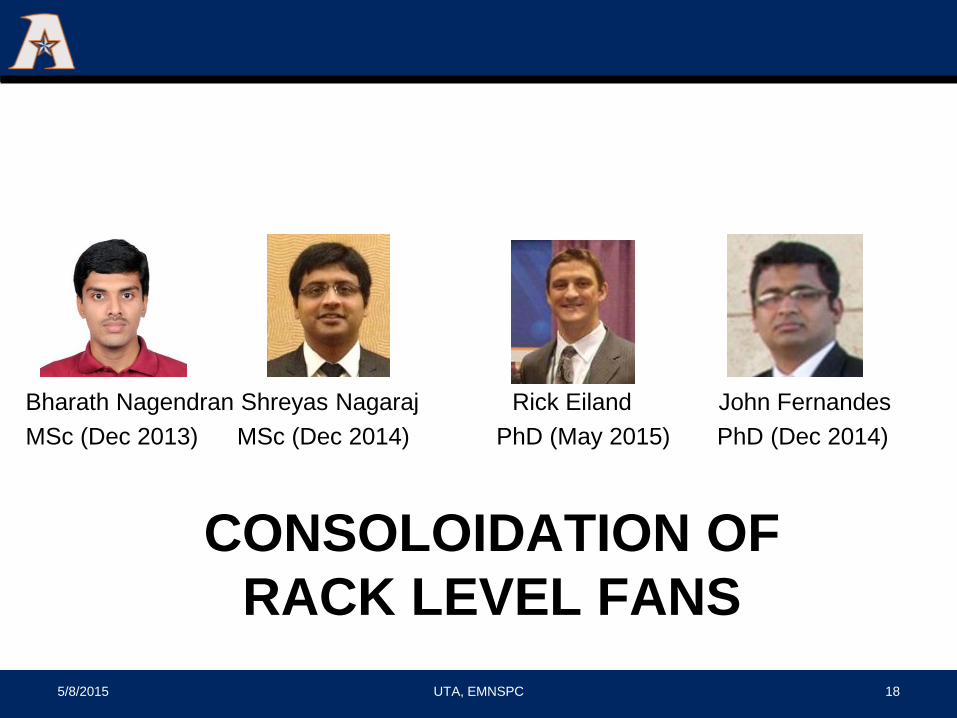
CONSOLOIDATION OF RACK LEVEL FANS
Bharath Nagendran Shreyas Nagaraj Rick Eiland John Fernandes MSc (Dec 2013) MSc (Dec 2014) PhD (May 2015) PhD (Dec 2014)
5/8/2015 UTA, EMNSPC 18
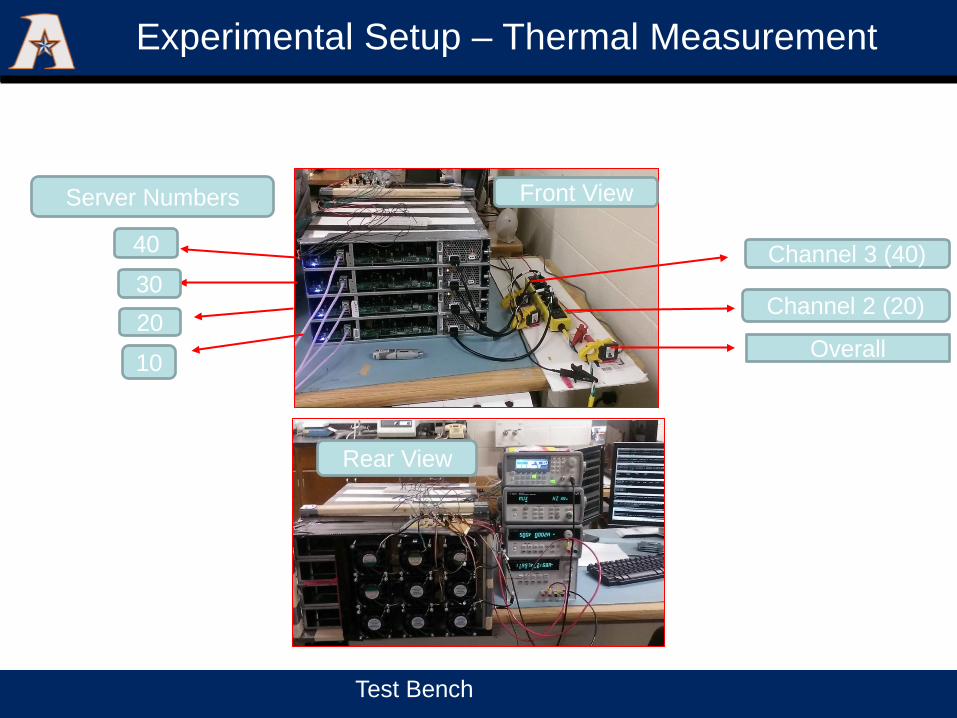
Experimental Setup – Thermal Measurement
Test Bench
10
30 20
40
Overall
Channel 2 (20)
Channel 3 (40)
Server Numbers Front View
Rear View
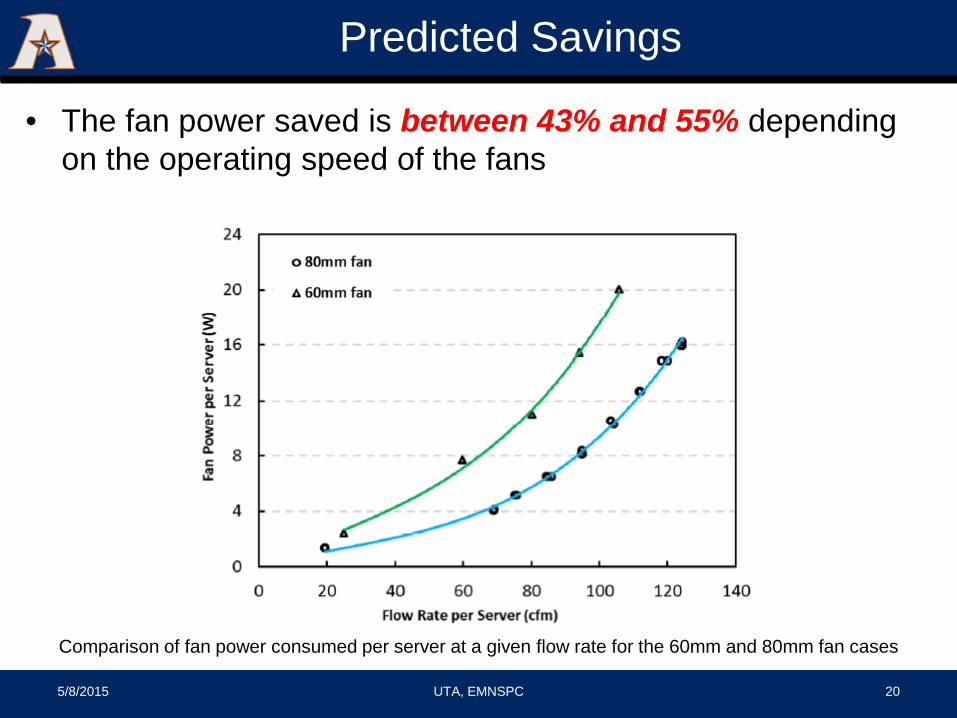
Predicted Savings
• The fan power saved is between 43% and 55% depending on the operating speed of the fans
5/8/2015 UTA, EMNSPC 20
Comparison of fan power consumed per server at a given flow rate for the 60mm and 80mm fan cases
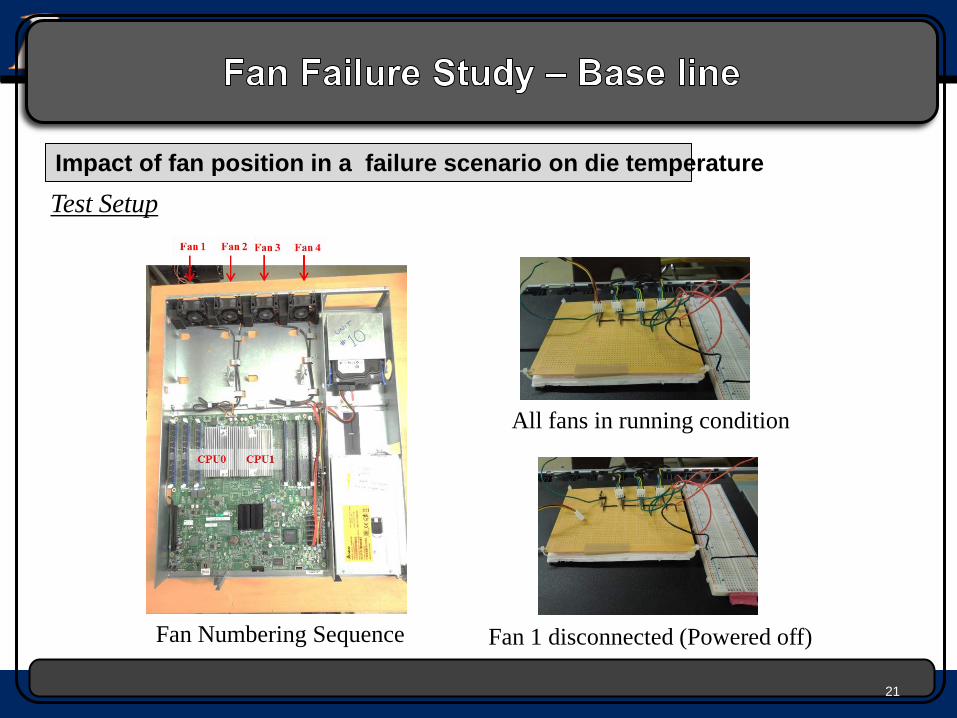
Test Setup
All fans in running condition
Fan 1 disconnected (Powered off) Fan Numbering Sequence
21
Impact of fan position in a failure scenario on die temperature
Graduate Student: Bharath Nagendran
1st November 2013
Improving Cooling Efficiency of Servers by Replacing Smaller Chassis Enclosed Fans
with Larger Rack-Mount Fans
Presented by: Bharath Nagendran
University of Texas at Arlington
Thursday, May 29th, 2014 ITherm, Orlando, FL USA
Co-Authors:
Shreyas Nagaraj, UTA John Fernandes, UTA Richard Eiland, UTA
Dereje Agonafer, UTA Veerendra Mulay, Facebook Inc.
DYNAMIC COLD PLATE
John Fernandes Manasa Sahini Divya Mani Ruturaj Kokate PhD (Dec 2014) PhD (May 2016) MSc (Dec 2014) MSc (May 2015)
5/8/2015 UTA, EMNSPC 23
Overview
• Objective – Energy-efficient liquid cooling of high power modules
• Approach
– Propose concept of ‘dynamic cold plate’ – Design solution for high power MCM – Evaluate performance with extensive CFD analysis – Requirements of experimental testing
• Preview test matrix
March 23, 2015 [email protected] 24
Electronics, MEM
S and Nanoelectronics System
s Packaging C
enter
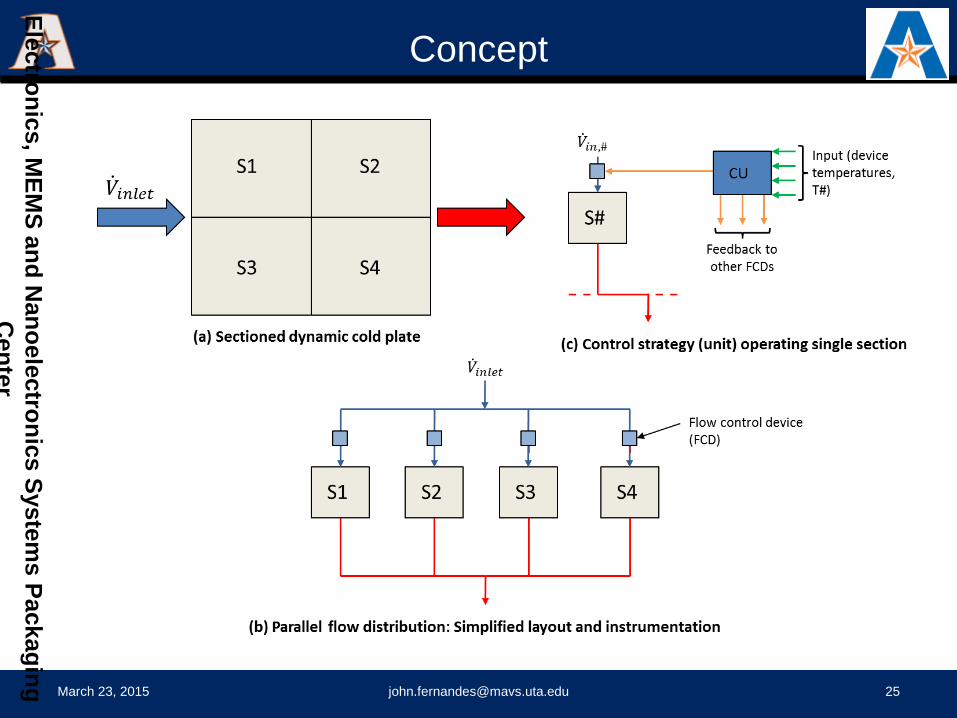
Concept
March 23, 2015 [email protected] 25
Electronics, MEM
S and Nanoelectronics System
s Packaging C
enter
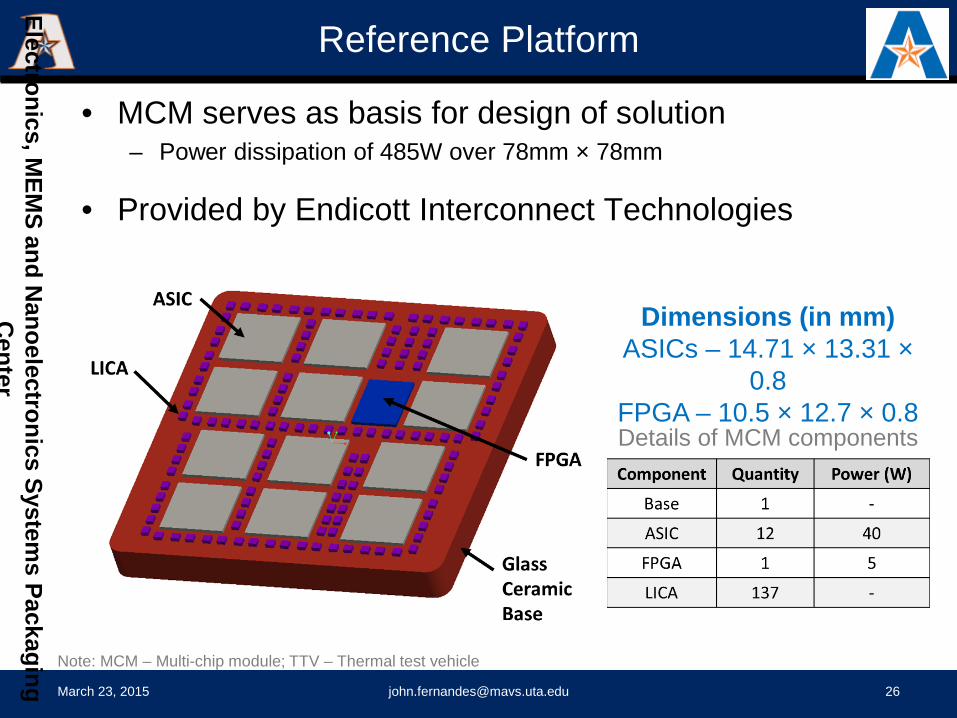
• MCM serves as basis for design of solution – Power dissipation of 485W over 78mm × 78mm
• Provided by Endicott Interconnect Technologies
Reference Platform
March 23, 2015 [email protected] 26
Note: MCM – Multi-chip module; TTV – Thermal test vehicle
Electronics, MEM
S and Nanoelectronics System
s Packaging C
enter
Details of MCM components
Dimensions (in mm) ASICs – 14.71 × 13.31 ×
0.8 FPGA – 10.5 × 12.7 × 0.8
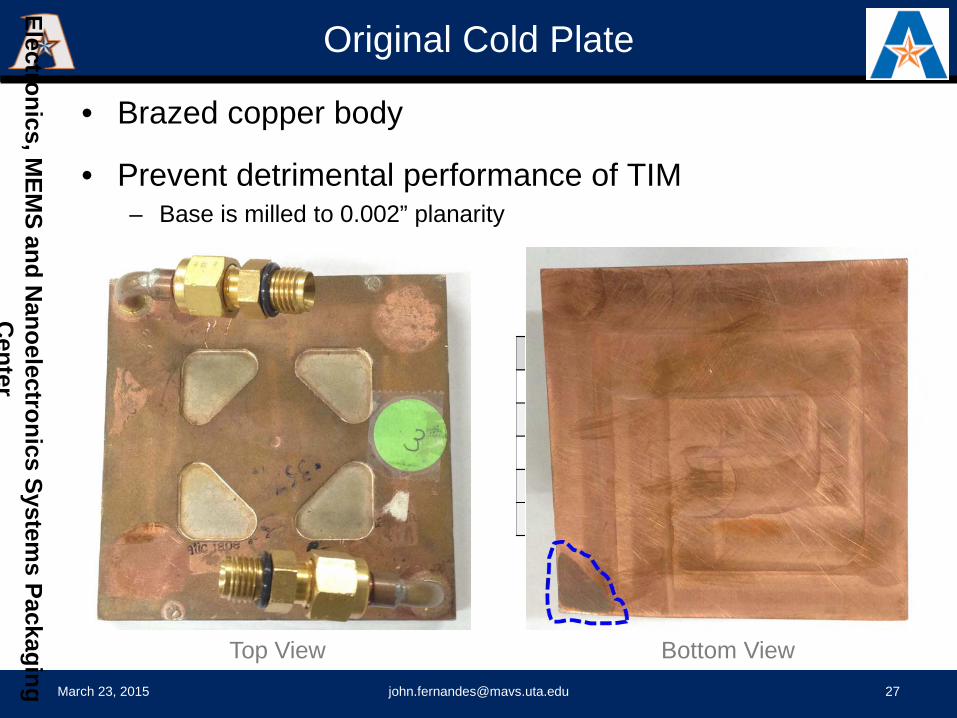
Original Cold Plate
• Brazed copper body
• Prevent detrimental performance of TIM – Base is milled to 0.002” planarity
March 23, 2015 [email protected] 27
Electronics, MEM
S and Nanoelectronics System
s Packaging C
enter
Top View Bottom View
Non-uniformity of bottom surface
• 6SigmaET is employed – Solution becomes grid independent at ~16 million cells
• TIM between devices and cold plate (3.45W/m-K) – Thickness of 50um at an interfacial pressure of 75psi
• Rule of thumb to determine range of flow rates – 2kW to 3kW of heat dissipation per gpm of coolant flow
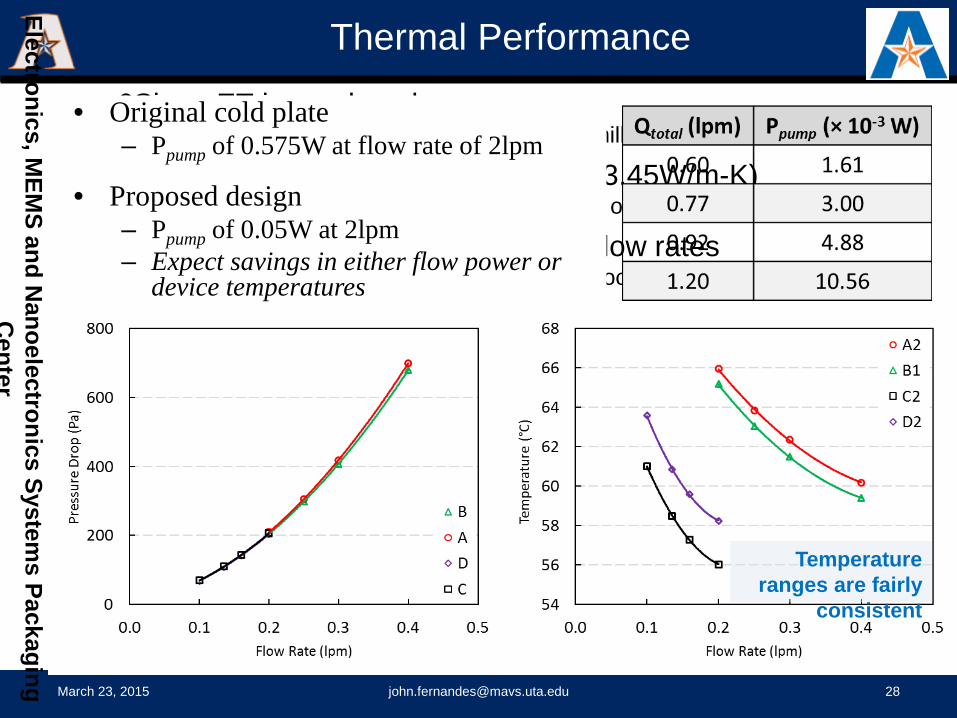
Thermal Performance
March 23, 2015 [email protected] 28
Electronics, MEM
S and Nanoelectronics System
s Packaging C
enter
Temperature ranges are fairly
consistent
• Original cold plate – Ppump of 0.575W at flow rate of 2lpm
• Proposed design – Ppump of 0.05W at 2lpm – Expect savings in either flow power or
device temperatures
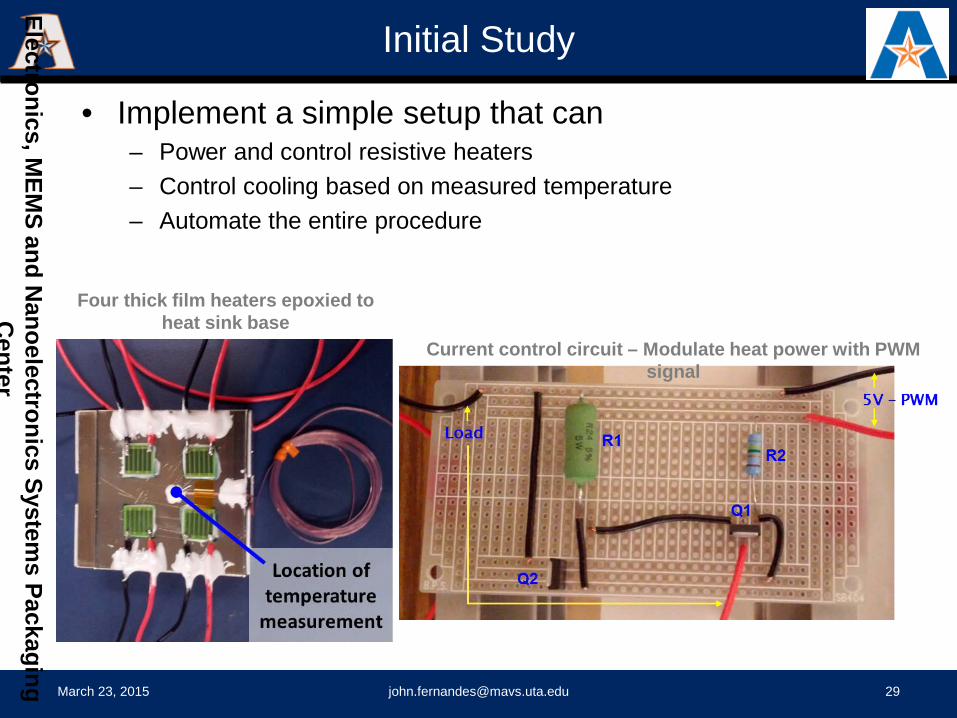
Initial Study
• Implement a simple setup that can – Power and control resistive heaters – Control cooling based on measured temperature – Automate the entire procedure
March 23, 2015 [email protected] 29
Electronics, MEM
S and Nanoelectronics System
s Packaging C
enter
Four thick film heaters epoxied to heat sink base
Current control circuit – Modulate heat power with PWM signal
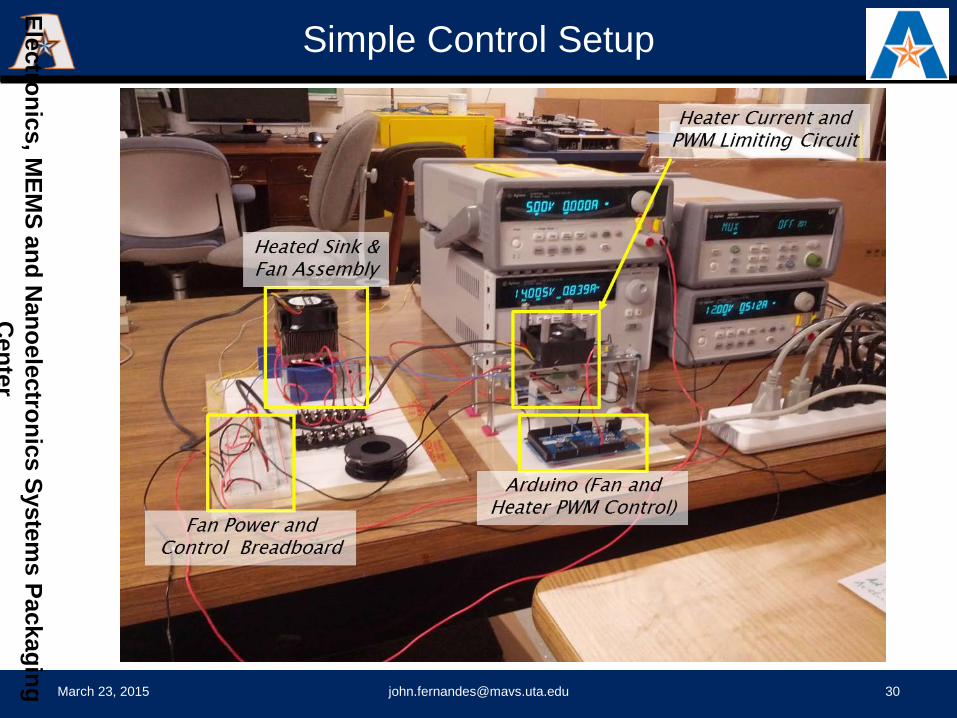
Simple Control Setup
March 23, 2015 [email protected] 30
Electronics, MEM
S and Nanoelectronics System
s Packaging C
enter
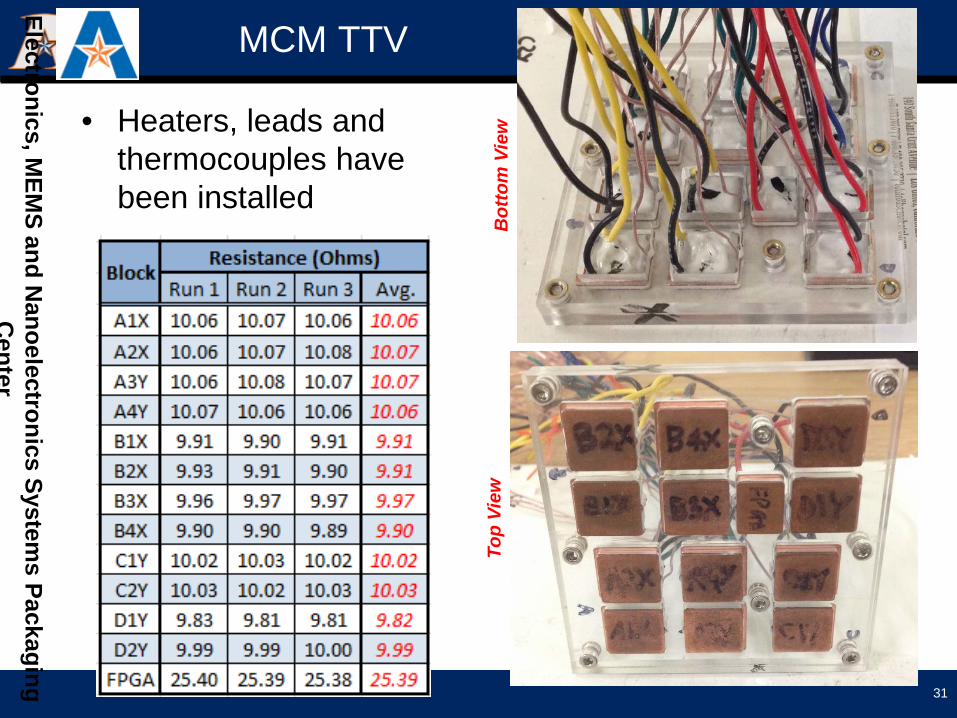
MCM TTV
• Heaters, leads and thermocouples have been installed
31
Electronics, MEM
S and Nanoelectronics System
s Packaging C
enter
Bot
tom
Vie
w
Top
View
Control Circuit
March 23, 2015 [email protected] 32
Electronics, MEM
S and Nanoelectronics System
s Packaging C
enter
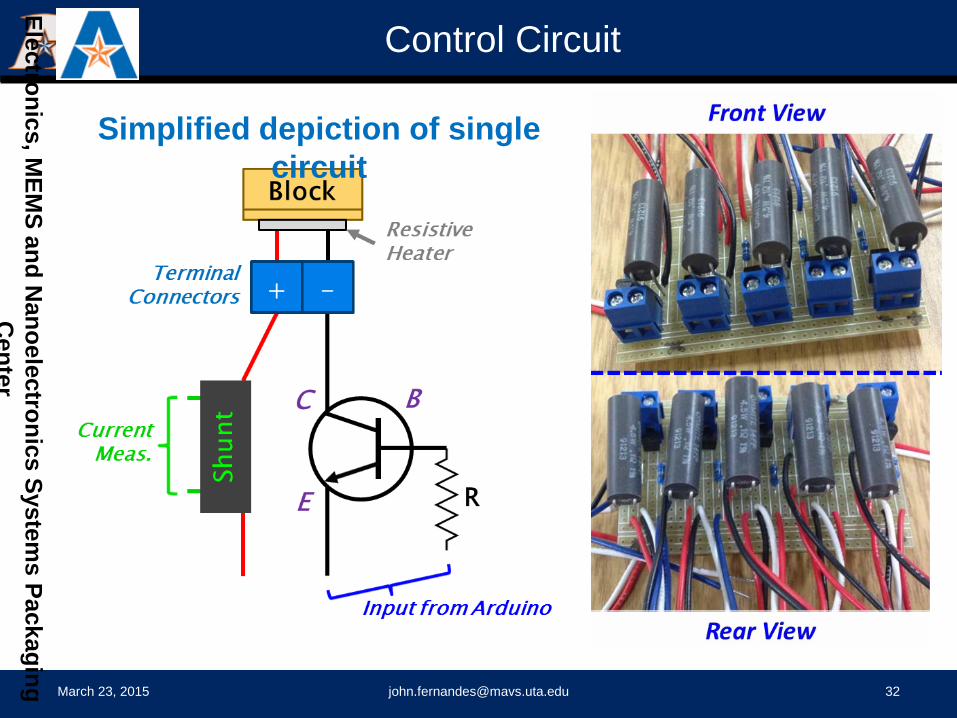
Simplified depiction of single circuit
Conclusions
• Concept of dynamic cold plate was previewed
• Solution was designed for reference MCM platform
• Evaluation of cold plate by CFD analysis – Distribution through parallel fins in a section was made fairly uniform – Expect sizeable savings in either flow power or device temperature
• Preparation for experimental testing – MCM TTV and control circuits – Test setup and outline
• Future work
– Determine available savings through experimental testing of both solutions
March 23, 2015 [email protected] 33
Electronics, MEM
S and Nanoelectronics System
s Packaging C
enter
Evaluating Liquid Cooling at the Rack
34
Presented by: John Fernandes
University of Texas at Arlington
Wednesday, Oct. 29th, 2014 IMAPS – ATW on Thermal Management
Los Gatos, CA
Co-Authors: Manasa Sahini, UTA
Dereje Agonafer, UTA Veerendra Mulay, Facebook Inc.
Jacob Na, Facebook Inc. Pat McGinn, CoolIT Systems Inc.
Michael Soares, CoolIT Systems Inc. Cam Turner, CoolIT Systems Inc.
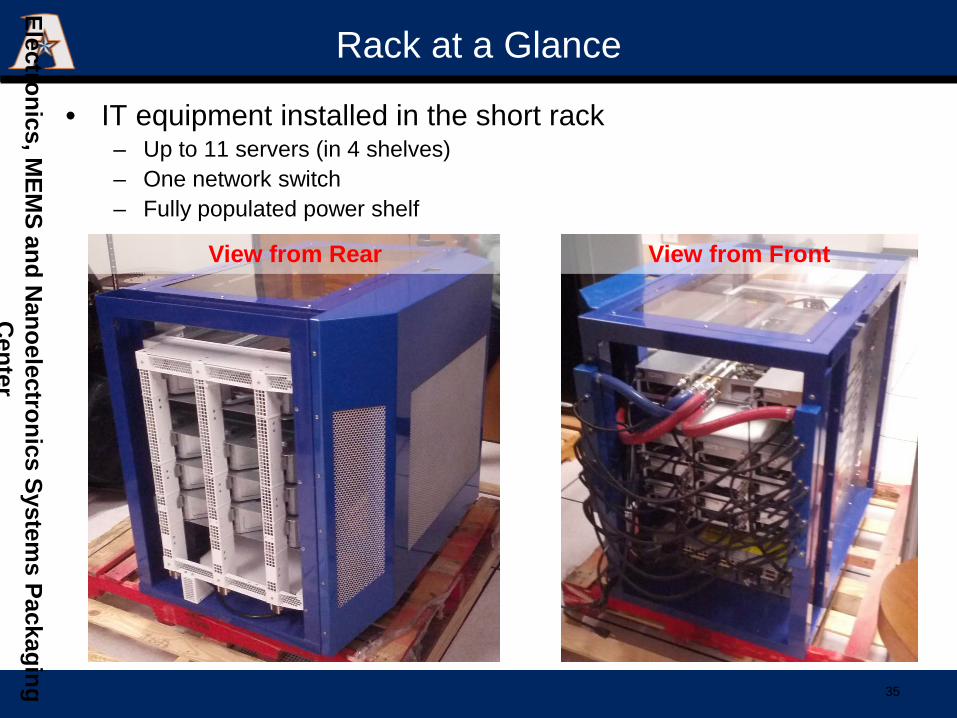
Rack at a Glance
• IT equipment installed in the short rack – Up to 11 servers (in 4 shelves) – One network switch – Fully populated power shelf
35
Electronics, MEM
S and Nanoelectronics System
s Packaging C
enter
View from Rear View from Front
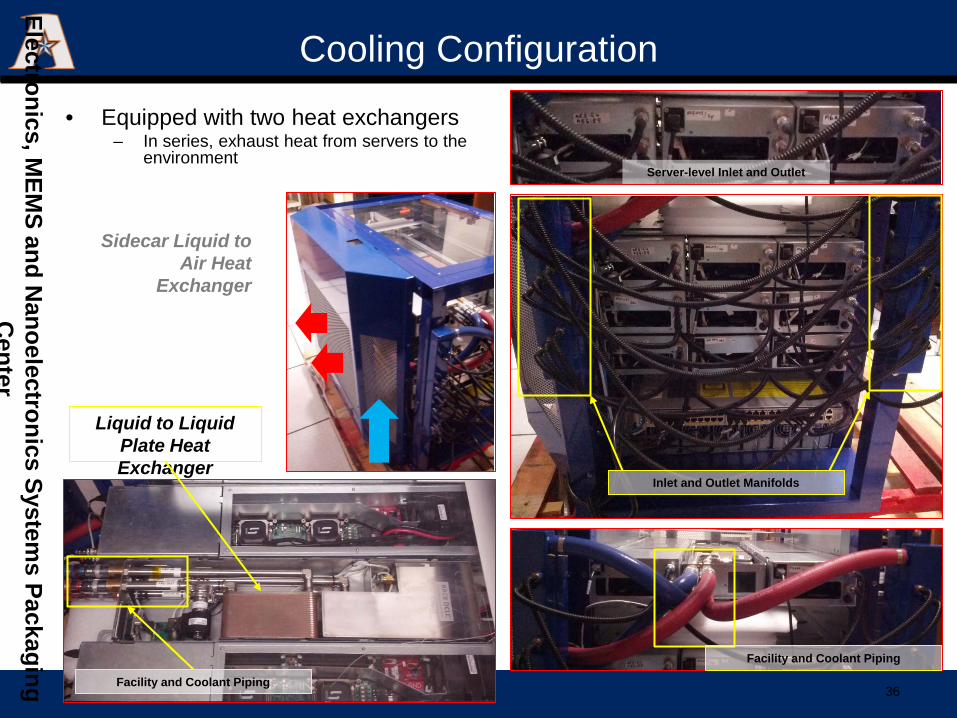
Cooling Configuration
• Equipped with two heat exchangers – In series, exhaust heat from servers to the
environment
36
Electronics, MEM
S and Nanoelectronics System
s Packaging C
enter
Inlet and Outlet Manifolds
Server-level Inlet and Outlet
Facility and Coolant Piping
Liquid to Liquid Plate Heat Exchanger
Facility and Coolant Piping
Sidecar Liquid to Air Heat
Exchanger
PERFORMANCE OF A HIGH DENSITY MINERAL OIL IMMERSION COOLED SERVER SYSTEM Rick Eiland
PhD Student May 2015
5/8/2015 UTA, EMNSPC 37
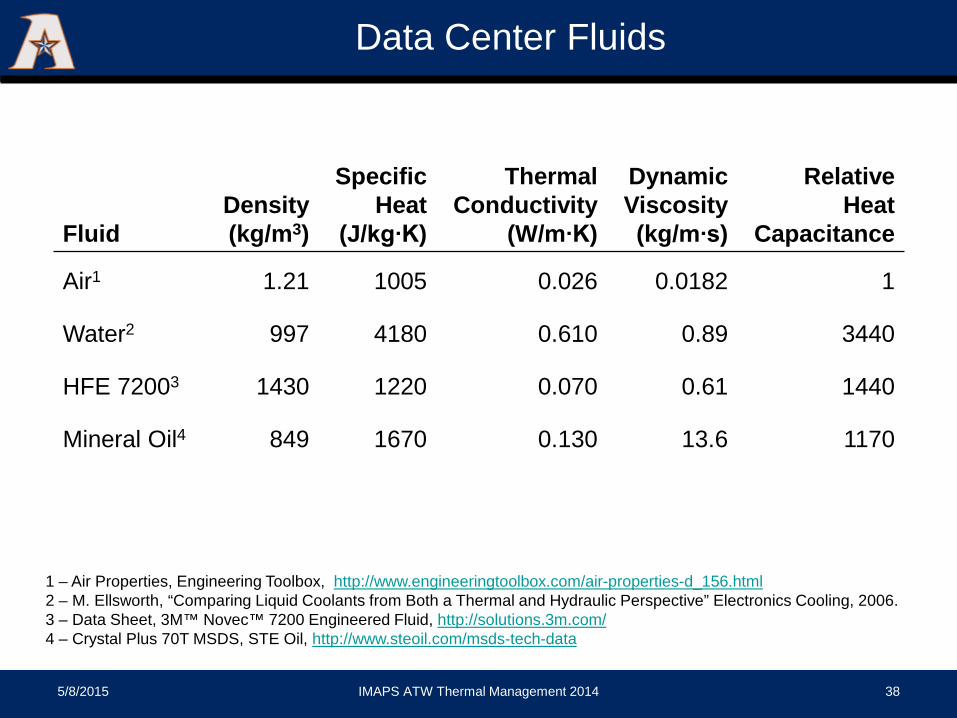
Data Center Fluids
Fluid Density (kg/m3)
Specific Heat
(J/kg∙K)
Thermal Conductivity
(W/m∙K)
Dynamic Viscosity (kg/m∙s)
Relative Heat
Capacitance
Air1 1.21 1005 0.026 0.0182 1
Water2 997 4180 0.610 0.89 3440
HFE 72003 1430 1220 0.070 0.61 1440
Mineral Oil4 849 1670 0.130 13.6 1170
1 – Air Properties, Engineering Toolbox, http://www.engineeringtoolbox.com/air-properties-d_156.html 2 – M. Ellsworth, “Comparing Liquid Coolants from Both a Thermal and Hydraulic Perspective” Electronics Cooling, 2006. 3 – Data Sheet, 3M™ Novec™ 7200 Engineered Fluid, http://solutions.3m.com/ 4 – Crystal Plus 70T MSDS, STE Oil, http://www.steoil.com/msds-tech-data
5/8/2015 IMAPS ATW Thermal Management 2014 38
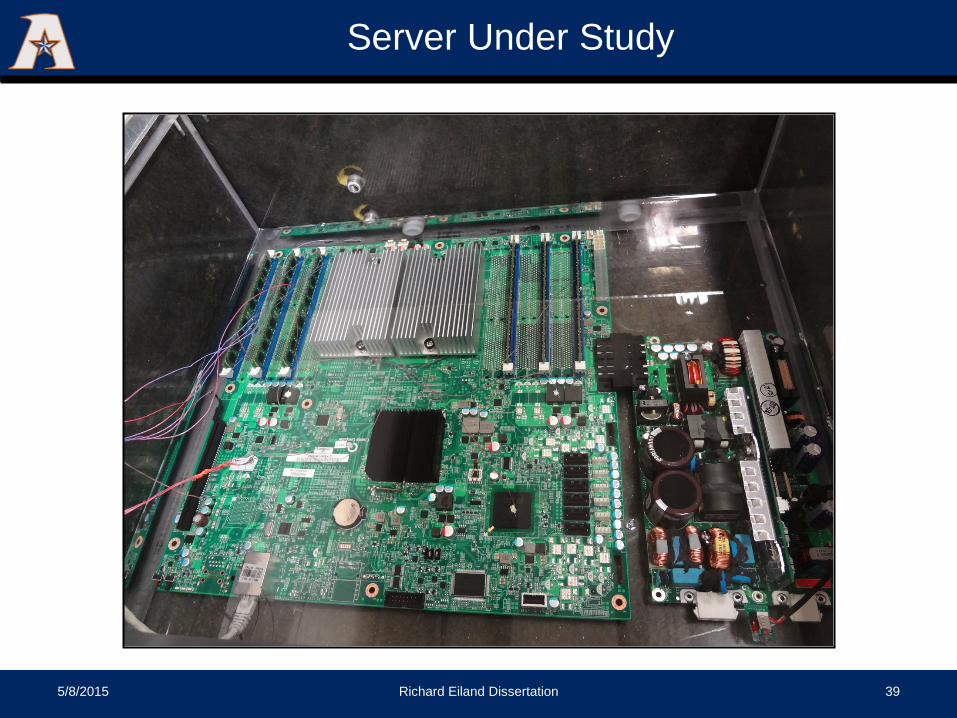
Server Under Study
5/8/2015 Richard Eiland Dissertation 39
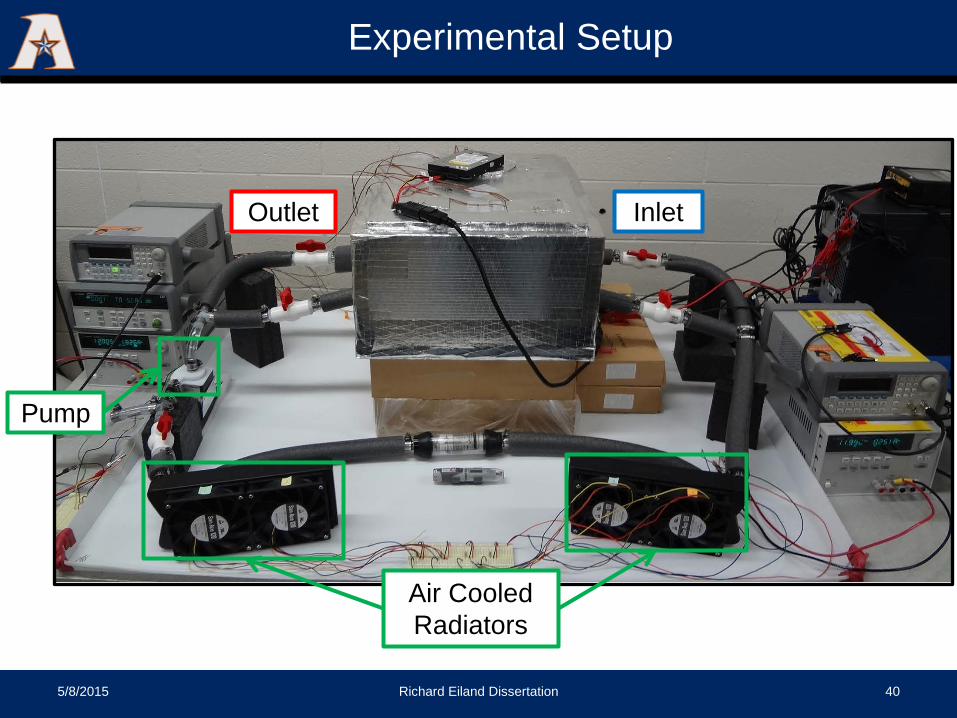
Experimental Setup
5/8/2015 Richard Eiland Dissertation 40
Air Cooled Radiators
Pump
Inlet Outlet
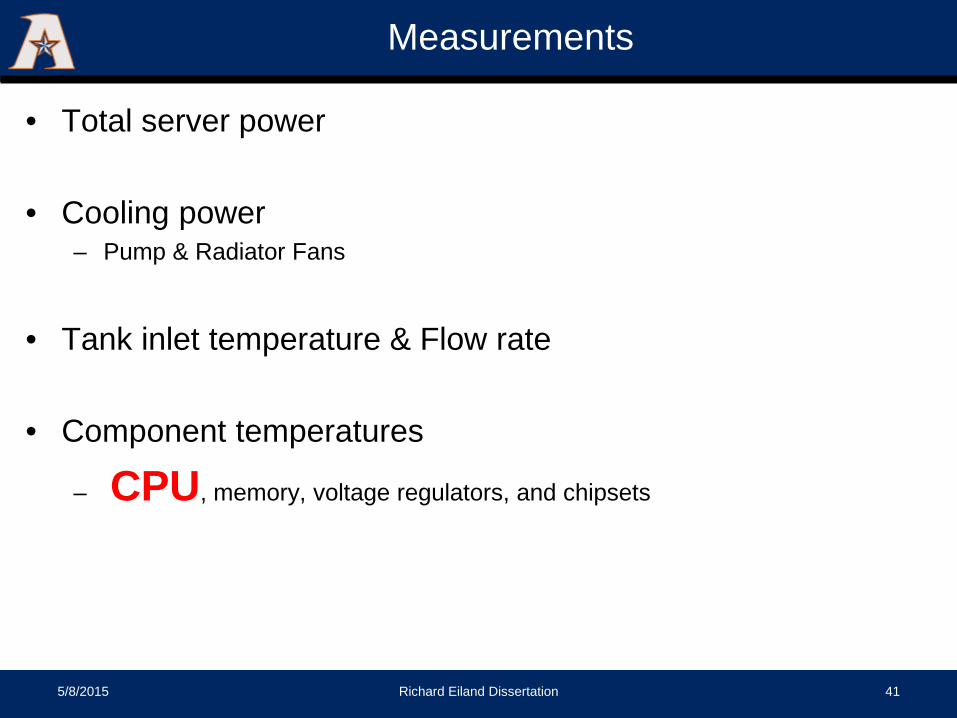
Measurements
• Total server power
• Cooling power – Pump & Radiator Fans
• Tank inlet temperature & Flow rate
• Component temperatures
– CPU, memory, voltage regulators, and chipsets
5/8/2015 Richard Eiland Dissertation 41
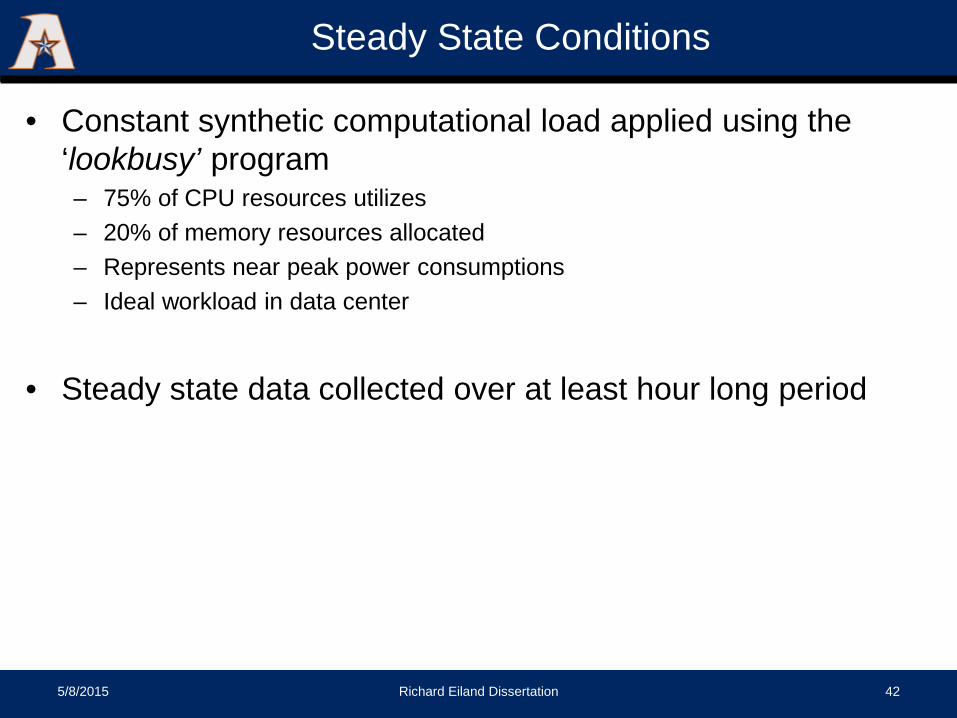
Steady State Conditions
• Constant synthetic computational load applied using the ‘lookbusy’ program – 75% of CPU resources utilizes – 20% of memory resources allocated – Represents near peak power consumptions – Ideal workload in data center
• Steady state data collected over at least hour long period
5/8/2015 Richard Eiland Dissertation 42
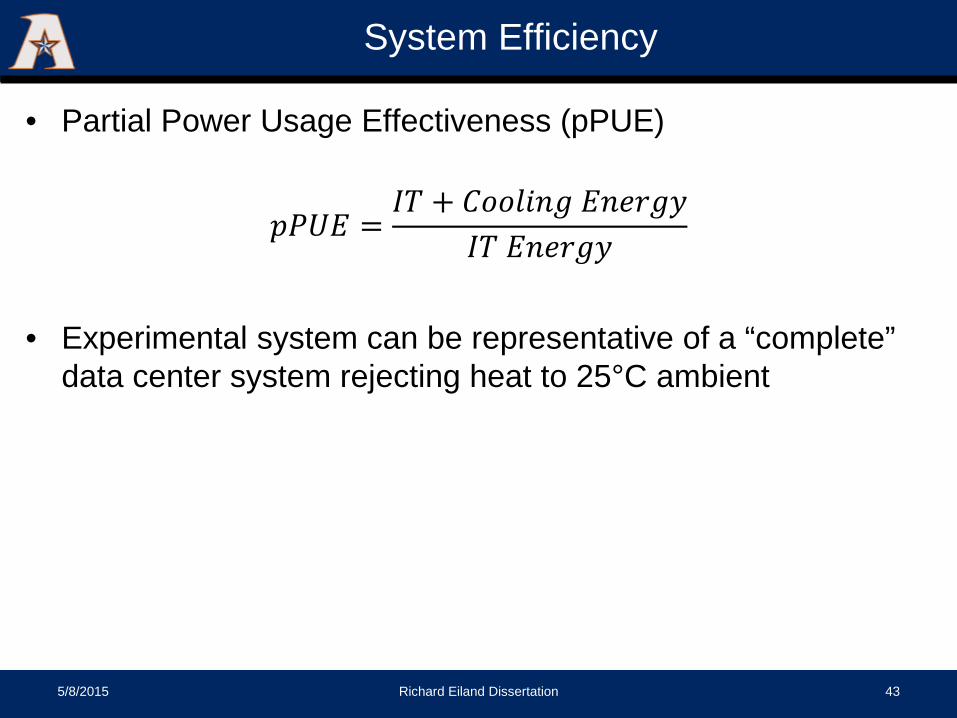
System Efficiency
• Partial Power Usage Effectiveness (pPUE)
𝑝𝑝𝑝𝑝𝑝𝑝𝑝𝑝 =𝐼𝐼𝐼𝐼 + 𝐶𝐶𝐶𝐶𝐶𝐶𝐶𝐶𝐶𝐶𝐶𝐶𝐶𝐶 𝑝𝑝𝐶𝐶𝐸𝐸𝐸𝐸𝐶𝐶𝐸𝐸
𝐼𝐼𝐼𝐼 𝑝𝑝𝐶𝐶𝐸𝐸𝐸𝐸𝐶𝐶𝐸𝐸
• Experimental system can be representative of a “complete”
data center system rejecting heat to 25°C ambient
5/8/2015 Richard Eiland Dissertation 43
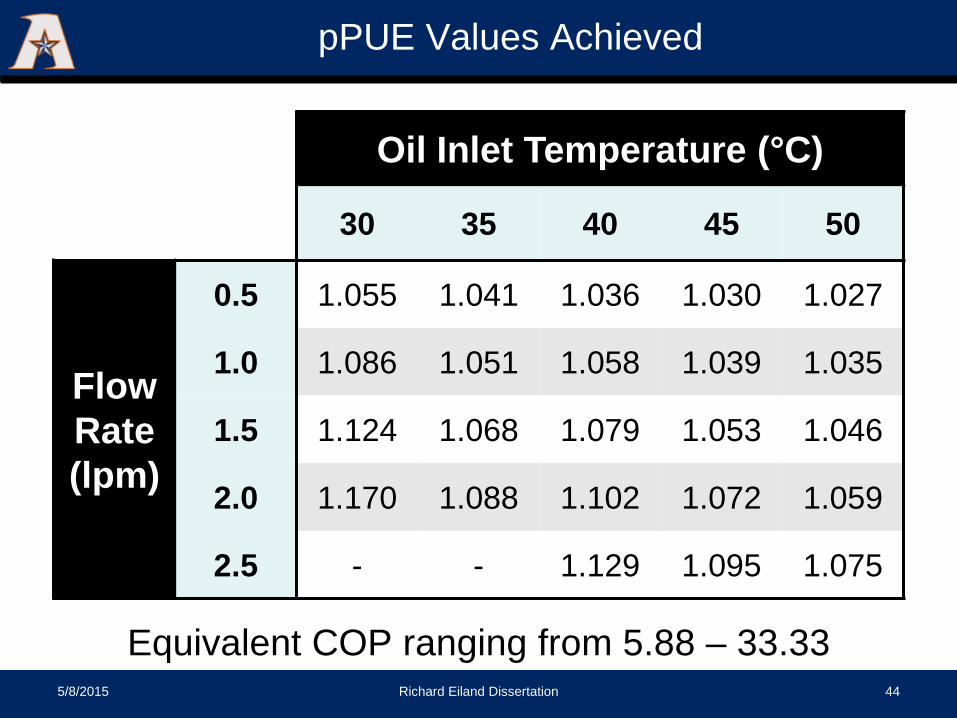
pPUE Values Achieved
Equivalent COP ranging from 5.88 – 33.33 5/8/2015 Richard Eiland Dissertation 44
Oil Inlet Temperature (°C)
30 35 40 45 50
Flow Rate (lpm)
0.5 1.055 1.041 1.036 1.030 1.027
1.0 1.086 1.051 1.058 1.039 1.035
1.5 1.124 1.068 1.079 1.053 1.046
2.0 1.170 1.088 1.102 1.072 1.059
2.5 - - 1.129 1.095 1.075
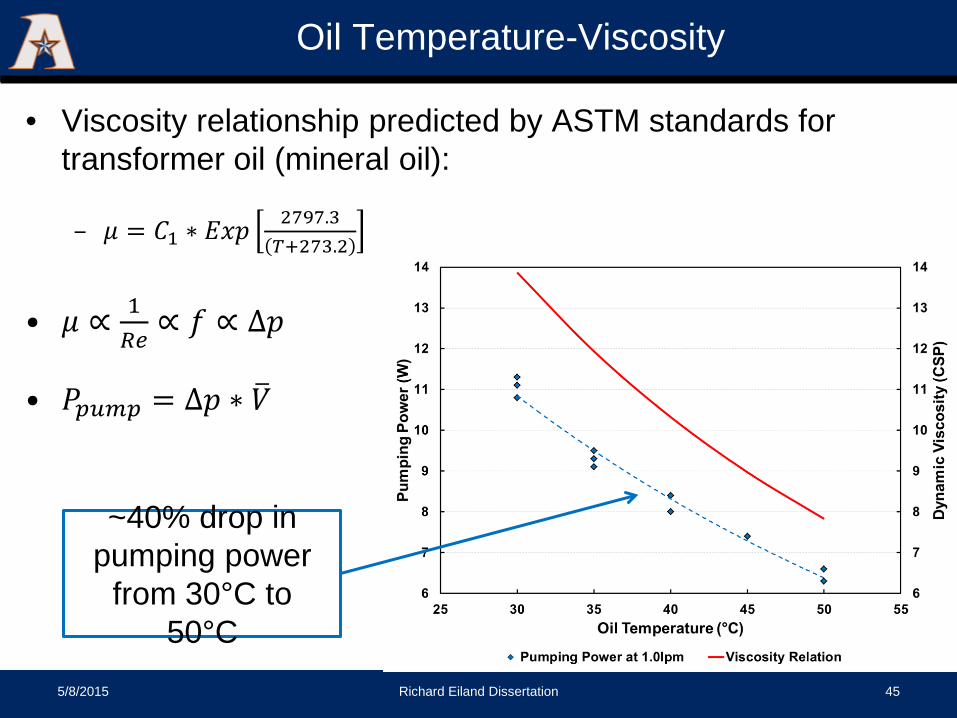
~40% drop in pumping power
from 30°C to 50°C
Oil Temperature-Viscosity
• Viscosity relationship predicted by ASTM standards for transformer oil (mineral oil):
– 𝜇𝜇 = 𝐶𝐶1 ∗ 𝑝𝑝𝐸𝐸𝑝𝑝2797.3𝑇𝑇+273.2
• 𝜇𝜇 ∝ 1𝑅𝑅𝑅𝑅∝ 𝑓𝑓 ∝ ∆𝑝𝑝
• 𝑝𝑝𝑝𝑝𝑝𝑝𝑝𝑝𝑝𝑝 = ∆𝑝𝑝 ∗ 𝑉𝑉�
5/8/2015 Richard Eiland Dissertation 45
Comments – Thermal Performance
• A single Open-Compute server was characterized for its thermal performance in mineral oil
• Suitable oil inlet temperatures up to 45°C may be used for service in oil immersion cooled data centers – Short excursions into 50°C inlet temperature may be acceptable
• pPUE values ranging from 1.027 – 1.170 were achieved
5/8/2015 Richard Eiland Dissertation 46
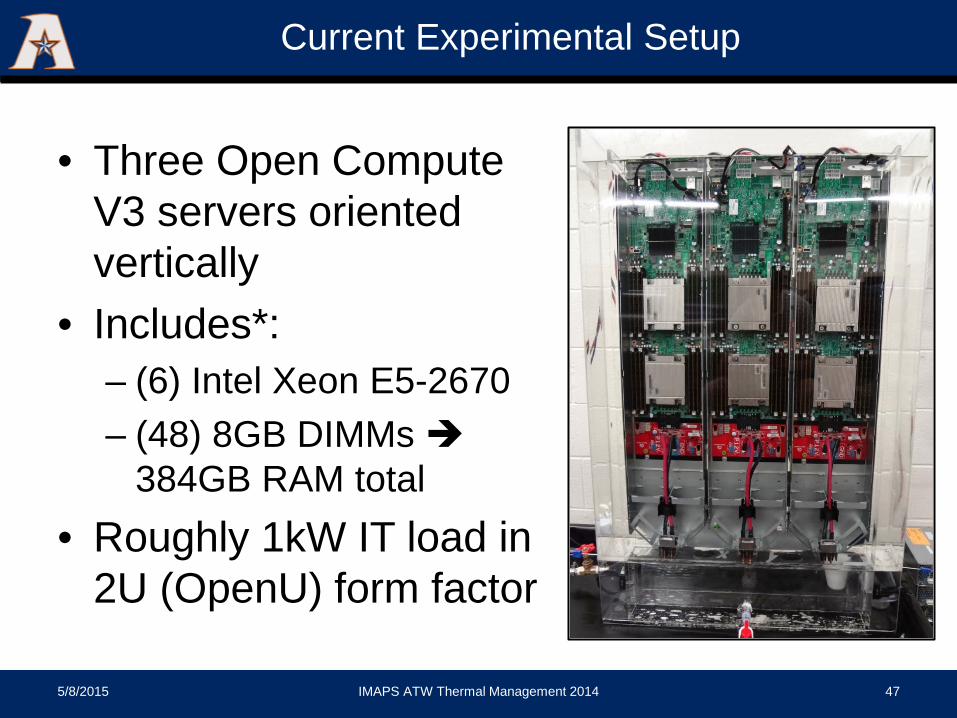
Current Experimental Setup
5/8/2015 IMAPS ATW Thermal Management 2014 47
• Three Open Compute V3 servers oriented vertically
• Includes*: – (6) Intel Xeon E5-2670 – (48) 8GB DIMMs
384GB RAM total • Roughly 1kW IT load in
2U (OpenU) form factor
OIL IMMERSION RELIABILITY
Rick Eiland Gowtham Pedapudi Fahad Mirza PhD Student MSc PhD May 2015 May 2015 Dec 2014
5/8/2015 UTA, EMNSPC 48
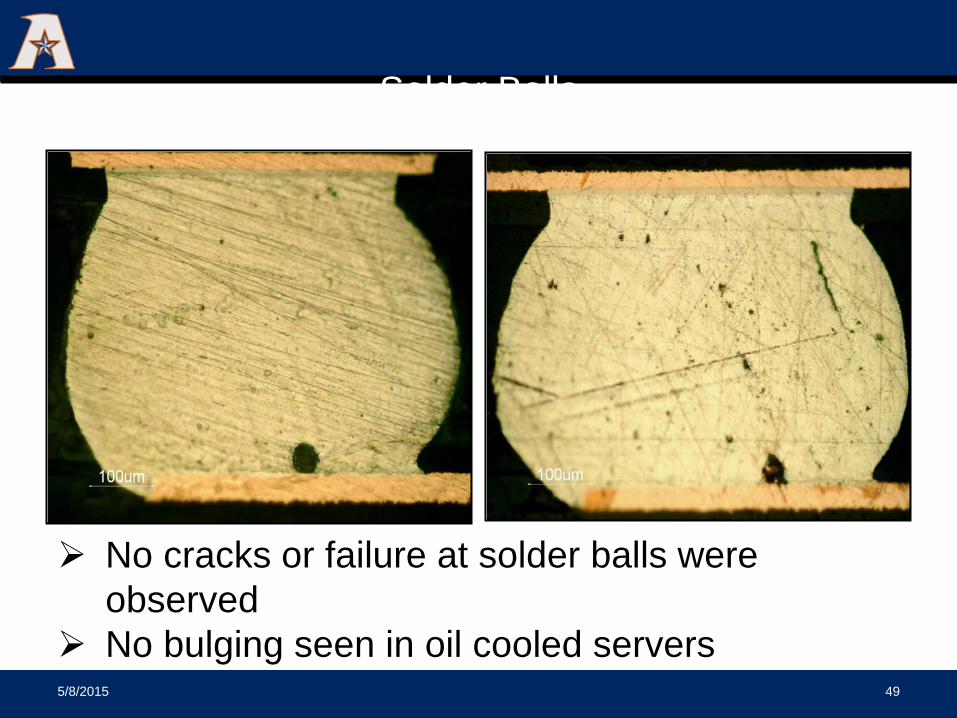
Solder Balls
AIR: No oil exposure OIL: Immersed 8 months
49 5/8/2015
No cracks or failure at solder balls were observed
No bulging seen in oil cooled servers
Evaluating Heat Sink Performance in an Immersion-Cooled Server System
Trevor McWilliams M.S. Mechanical Engineering
Advisor : Dr. Dereje Agonafer
July 24, 2014
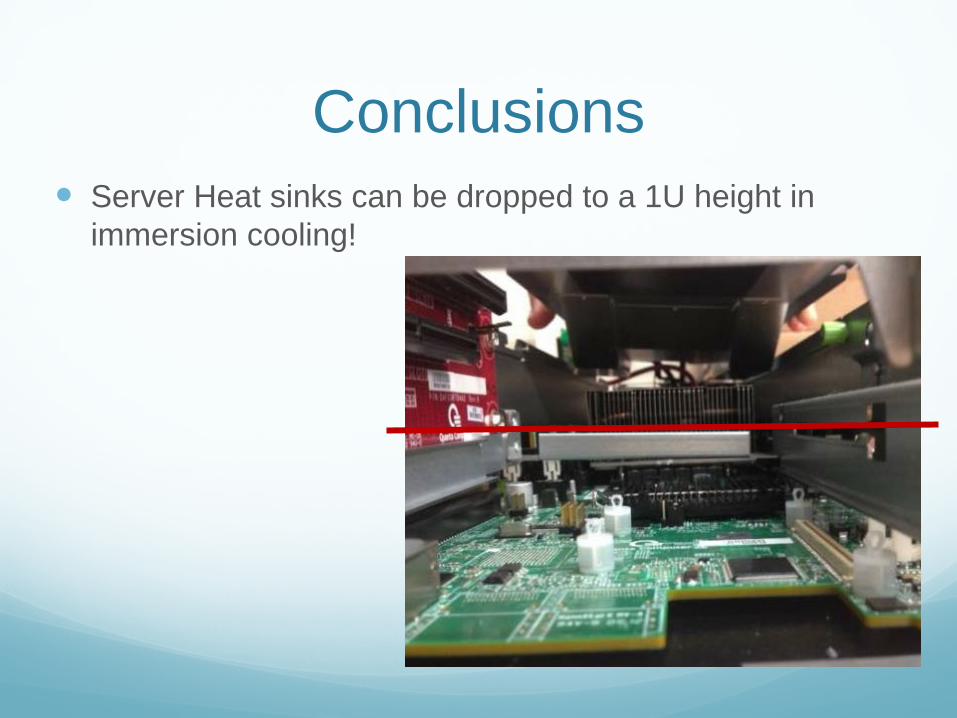
Conclusions Server Heat sinks can be dropped to a 1U height in
immersion cooling!
Performance study of Thermal Interface Material in Generation-3
Intel Server MotherBoard
Gowtham Pedapudi M.S. Mechanical Engineering
Advisor : Dr. Dereje Agonafer
July 28, 2014
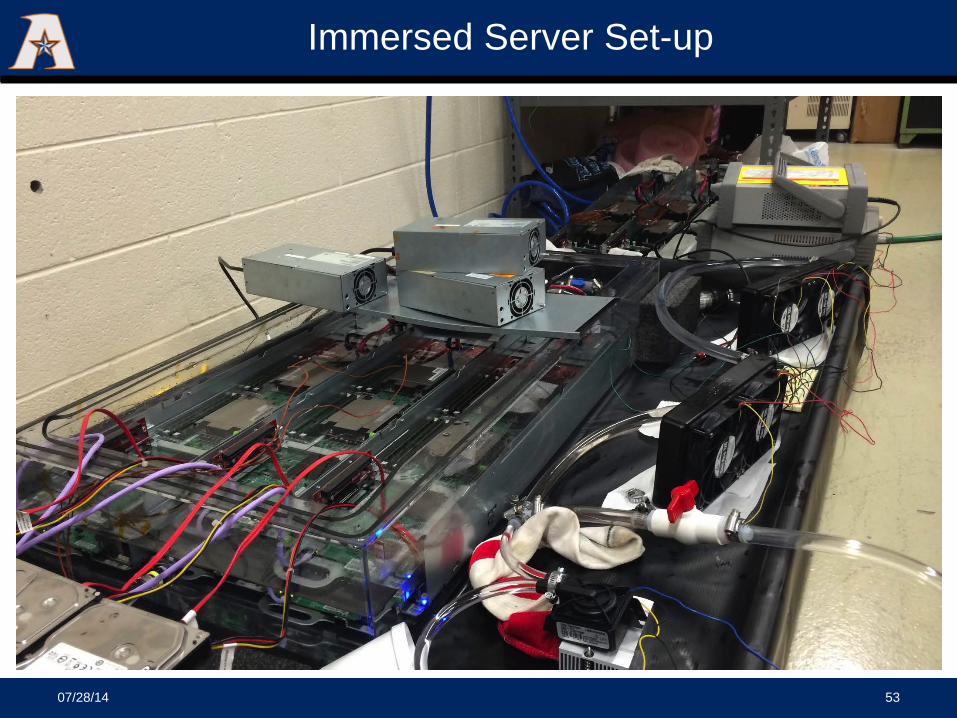
Immersed Server Set-up
07/28/14
53
5/8/2015 UTA, EMNSPC 54