Embed Size (px)
Citation preview
The National Minimum Wage in 2021
Uprating Report April 2021Low Pay Commission
Introduction
IntroductionNew rates of the National Living Wage (NLW) and National Minimum Wage (NMW) come into force on 1 April 2021, based on recommendations made by the Low Pay Commission (LPC) in October 2020. This report looks ahead at what the new rates will mean, and the LPC’s work for 2021 and the path up to 2024.Over the last year, economic conditions in the UK have been extremely turbulent. Covid-19 led to a sharp economic shock, with severe impacts on many sectors and workers. In response, the Government introduced an extensive package of support measures, including the Coronavirus Job Retention Scheme (CJRS). The evidence so far suggests that these measures have helped to minimise job losses, but there remains a high degree of uncertainty as to what will happen in the coming months: the path of the pandemic, the pace of economic recovery, and how businesses will respond as Government support is withdrawn. Our recommendations reflect this uncertain and challenging context, while still making progress towards the target of the NLW reaching two-thirds of median pay by 2024.
The Low Pay CommissionThe LPC is an independent public body that advises the Government each year on the NMW and NLW. The LPC is a social partnership body, made up of nine Commissioners: three from employer backgrounds, three from worker representative backgrounds, and three independent Commissioners, including the Chair. Every year since its first report in 1998, Commissioners have unanimously agreed the LPC’s recommendations to the Government.
2
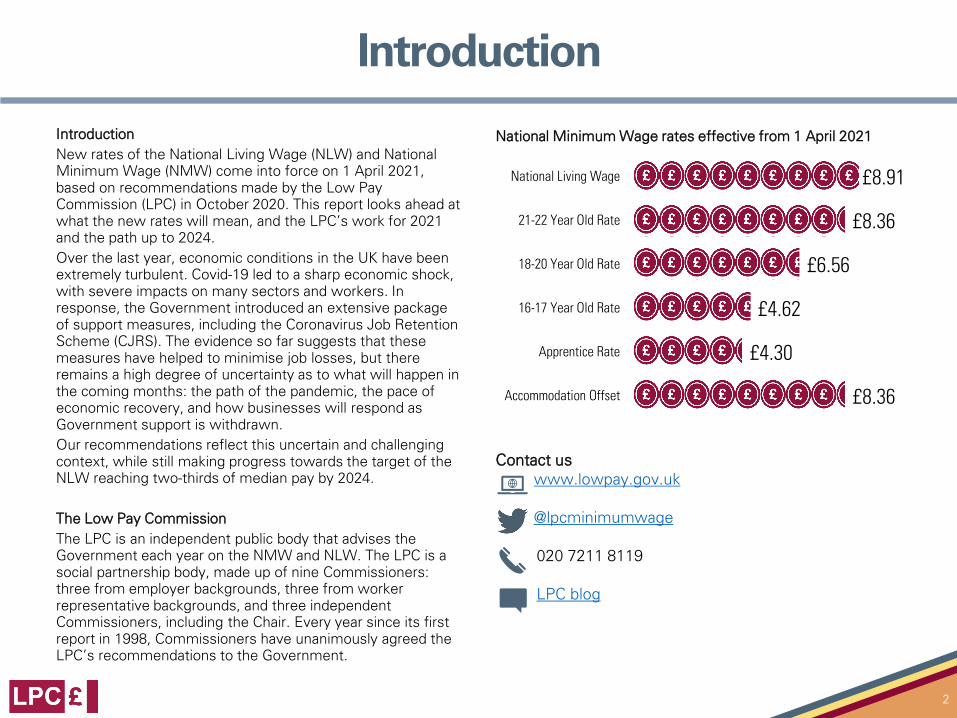
National Minimum Wage rates effective from 1 April 2021
Contact uswww.lowpay.gov.uk
@lpcminimumwage
020 7211 8119
LPC blog
£8.91
£8.36
£6.56
£4.62
£4.30
£8.36
National Living Wage
21-22 Year Old Rate
18-20 Year Old Rate
16-17 Year Old Rate
Apprentice Rate
Accommodation Offset
The National Living Wage
The minimum wage before the National Living WageThe National Minimum Wage (NMW) was introduced in April 1999. The LPC was established with a remit to make recommendations to raise the minimum wage as high as possible each year without causing unemployment. At this time, the main rate applied to workers aged 22 and over and there was a separate rate for those aged 18-21. A 16-17 Year Old Rate was introduced in 2004, and in 2010 the Apprentice Rate was introduced and 21 year olds became eligible for the adult rate of the NMW.
History of the National Living WageThe NLW was originally announced in the July 2015 Budget, as a new statutory minimum wage for workers aged 25 and over, set at £7.20 per hour from April 2016. The Government asked the LPC to recommend increases in the NLW to reach a target of 60 per cent of median earnings by 2020.
Increases towards this target were subject to the condition of sustained economic growth, but there was a tolerance for some job loss. We used the Government’s fiscal rule definition for normal economic conditions – GDP growth of above 1 per cent – as the criterion for sustained economic growth.
Over the 2015-2019 period, employment reached record levels, and there was no evidence of job losses resulting from the NLW. We were therefore able to follow the path to the target, and in our October 2019 recommendations to the Government, we recommended that the NLW increase to £8.72 from April 2020 in order to reach the 60 per cent target.
An ambition of ending low payIn 2020, the Government set a new target for the NLW, to reach two-thirds of median earnings for 2024. In addition, the age threshold should be lowered to 21 by 2024, starting with a reduction to 23 this year. This follows recommendations we made in our review of the NMW youth rates.
In setting our remit, the Government made clear that we should take economic conditions into account and, if the evidence supported it, could recommend that the Government reviewed its target or time-frame. This mechanism was referred to as an ‘emergency brake’.
For the other rates, we were asked to recommend rates as high as possible without damaging the employment prospects of each group.
A challenging labour market contextThe pandemic has had an extraordinary impact on the UK economy and the labour market. The ambition for the NLW to reach two-thirds of median earnings was set before the onset of Covid-19 and the resulting economic shock.
The subsequent uncertainty was a large factor in the rates we recommended for 2021. The pandemic and the policy interventions made in response to it also affected our ability to evaluate the impact of recent increases in the rates. All of these things continue to have a major impact on the outlook for low-paid workers going forwards.
3
Millions of workers benefit from increases to the NLW and NMW rates
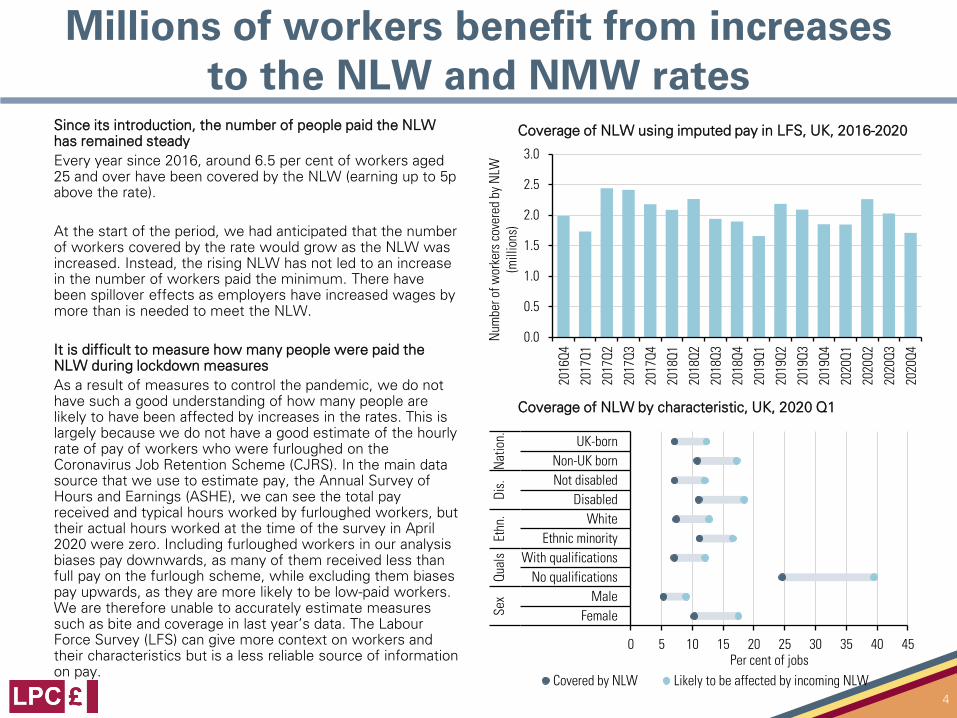
Since its introduction, the number of people paid the NLW has remained steadyEvery year since 2016, around 6.5 per cent of workers aged 25 and over have been covered by the NLW (earning up to 5p above the rate).
At the start of the period, we had anticipated that the number of workers covered by the rate would grow as the NLW was increased. Instead, the rising NLW has not led to an increase in the number of workers paid the minimum. There have been spillover effects as employers have increased wages by more than is needed to meet the NLW.
It is difficult to measure how many people were paid the NLW during lockdown measuresAs a result of measures to control the pandemic, we do not have such a good understanding of how many people are likely to have been affected by increases in the rates. This is largely because we do not have a good estimate of the hourly rate of pay of workers who were furloughed on the Coronavirus Job Retention Scheme (CJRS). In the main data source that we use to estimate pay, the Annual Survey of Hours and Earnings (ASHE), we can see the total pay received and typical hours worked by furloughed workers, but their actual hours worked at the time of the survey in April 2020 were zero. Including furloughed workers in our analysis biases pay downwards, as many of them received less than full pay on the furlough scheme, while excluding them biases pay upwards, as they are more likely to be low-paid workers. We are therefore unable to accurately estimate measures such as bite and coverage in last year’s data. The Labour Force Survey (LFS) can give more context on workers and their characteristics but is a less reliable source of information on pay.
4
Coverage of NLW using imputed pay in LFS, UK, 2016-2020
Coverage of NLW by characteristic, UK, 2020 Q1
0.0
0.5
1.0
1.5
2.0
2.5
3.0
2016
Q4
2017
Q1
2017
Q2
2017
Q3
2017
Q4
2018
Q1
2018
Q2
2018
Q3
2018
Q4
2019
Q1
2019
Q2
2019
Q3
2019
Q4
2020
Q1
2020
Q2
2020
Q3
2020
Q4
Num
ber o
f wor
kers
cov
ered
by
NLW
(m
illio
ns)
0 5 10 15 20 25 30 35 40 45
FemaleMale
No qualificationsWith qualifications
Ethnic minorityWhite
DisabledNot disabledNon-UK born
UK-born
Sex
Qual
sEt
hn.
Dis.
Nat
ion.
Per cent of jobsCovered by NLW Likely to be affected by incoming NLW
Low-paid workers were most likely to be furloughed and lose pay as a result
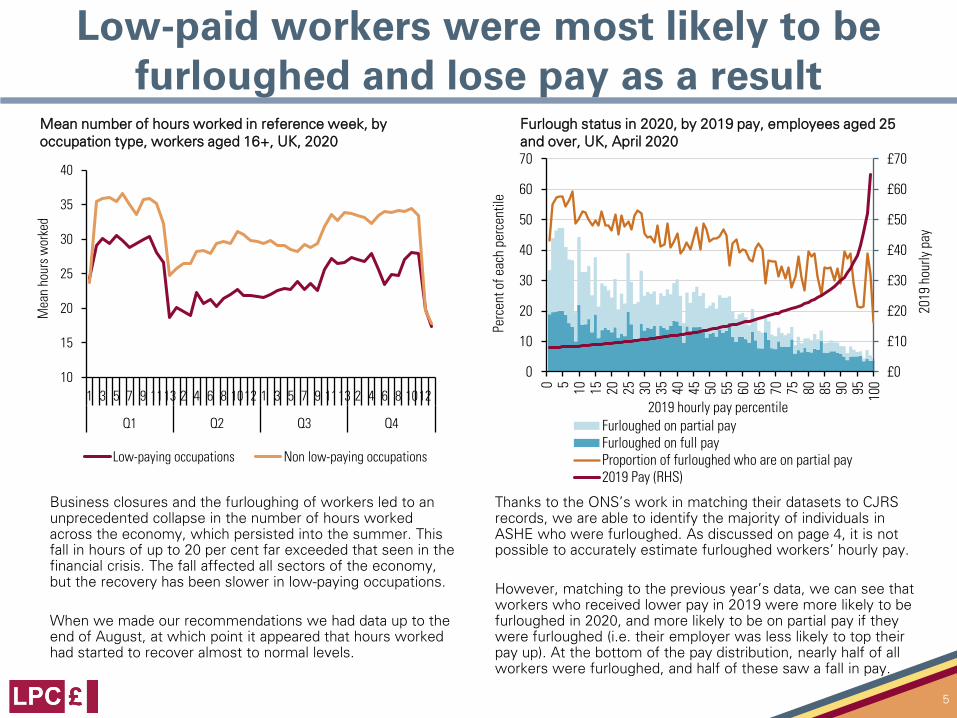
Business closures and the furloughing of workers led to an unprecedented collapse in the number of hours worked across the economy, which persisted into the summer. This fall in hours of up to 20 per cent far exceeded that seen in the financial crisis. The fall affected all sectors of the economy, but the recovery has been slower in low-paying occupations.
When we made our recommendations we had data up to the end of August, at which point it appeared that hours worked had started to recover almost to normal levels.
Thanks to the ONS’s work in matching their datasets to CJRS records, we are able to identify the majority of individuals in ASHE who were furloughed. As discussed on page 4, it is not possible to accurately estimate furloughed workers’ hourly pay.
However, matching to the previous year’s data, we can see that workers who received lower pay in 2019 were more likely to be furloughed in 2020, and more likely to be on partial pay if they were furloughed (i.e. their employer was less likely to top their pay up). At the bottom of the pay distribution, nearly half of all workers were furloughed, and half of these saw a fall in pay.
5
Mean number of hours worked in reference week, by occupation type, workers aged 16+, UK, 2020
Furlough status in 2020, by 2019 pay, employees aged 25 and over, UK, April 2020
£0
£10
£20
£30
£40
£50
£60
£70
0
10
20
30
40
50
60
70
0 5 10 15 20 25 30 35 40 45 50 55 60 65 70 75 80 85 90 95 100
2019
hou
rly p
ay
Perc
ent o
f eac
h pe
rcen
tile
2019 hourly pay percentileFurloughed on partial payFurloughed on full payProportion of furloughed who are on partial pay2019 Pay (RHS)
10
15
20
25
30
35
40
1 3 5 7 9 1113 2 4 6 8 1012 1 3 5 7 9 1113 2 4 6 8 1012
Q1 Q2 Q3 Q4
Mea
n ho
urs
wor
ked
Low-paying occupations Non low-paying occupations
This had implications for the NLW
6
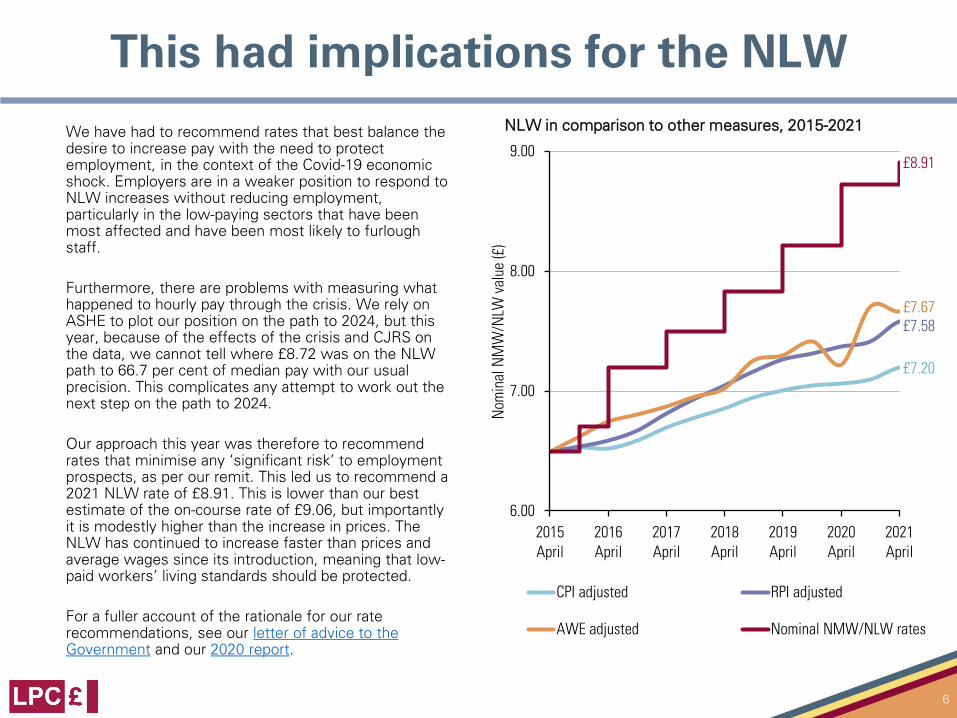
We have had to recommend rates that best balance the desire to increase pay with the need to protect employment, in the context of the Covid-19 economic shock. Employers are in a weaker position to respond to NLW increases without reducing employment, particularly in the low-paying sectors that have been most affected and have been most likely to furlough staff.
Furthermore, there are problems with measuring what happened to hourly pay through the crisis. We rely on ASHE to plot our position on the path to 2024, but this year, because of the effects of the crisis and CJRS on the data, we cannot tell where £8.72 was on the NLW path to 66.7 per cent of median pay with our usual precision. This complicates any attempt to work out the next step on the path to 2024.
Our approach this year was therefore to recommend rates that minimise any ‘significant risk’ to employment prospects, as per our remit. This led us to recommend a 2021 NLW rate of £8.91. This is lower than our best estimate of the on-course rate of £9.06, but importantly it is modestly higher than the increase in prices. The NLW has continued to increase faster than prices and average wages since its introduction, meaning that low-paid workers’ living standards should be protected.
For a fuller account of the rationale for our rate recommendations, see our letter of advice to the Government and our 2020 report.
NLW in comparison to other measures, 2015-2021
£7.20
£7.58£7.67
£8.91
6.00
7.00
8.00
9.00
2015April
2016April
2017April
2018April
2019April
2020April
2021April
Nom
inal
NM
W/N
LW v
alue
(£)
CPI adjusted RPI adjusted
AWE adjusted Nominal NMW/NLW rates
Young people’s greater vulnerability led to lower upratings
7
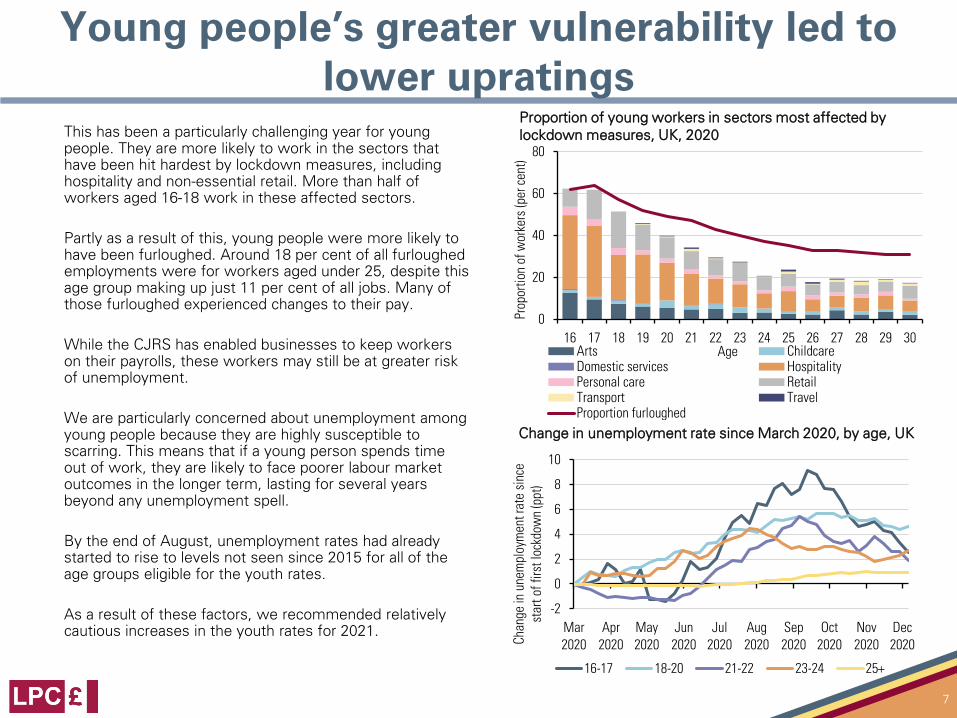
This has been a particularly challenging year for young people. They are more likely to work in the sectors that have been hit hardest by lockdown measures, including hospitality and non-essential retail. More than half of workers aged 16-18 work in these affected sectors.
Partly as a result of this, young people were more likely to have been furloughed. Around 18 per cent of all furloughed employments were for workers aged under 25, despite this age group making up just 11 per cent of all jobs. Many of those furloughed experienced changes to their pay.
While the CJRS has enabled businesses to keep workers on their payrolls, these workers may still be at greater risk of unemployment.
We are particularly concerned about unemployment among young people because they are highly susceptible to scarring. This means that if a young person spends time out of work, they are likely to face poorer labour market outcomes in the longer term, lasting for several years beyond any unemployment spell.
By the end of August, unemployment rates had already started to rise to levels not seen since 2015 for all of the age groups eligible for the youth rates.
As a result of these factors, we recommended relatively cautious increases in the youth rates for 2021.
0
20
40
60
80
16 17 18 19 20 21 22 23 24 25 26 27 28 29 30
Prop
ortio
n of
wor
kers
(per
cen
t)
AgeArts ChildcareDomestic services HospitalityPersonal care RetailTransport TravelProportion furloughed
Proportion of young workers in sectors most affected by lockdown measures, UK, 2020
Change in unemployment rate since March 2020, by age, UK
-2
0
2
4
6
8
10
Mar2020
Apr2020
May2020
Jun2020
Jul2020
Aug2020
Sep2020
Oct2020
Nov2020
Dec2020Ch
ange
in u
nem
ploy
men
t rat
e si
nce
star
t of f
irst l
ockd
own
(ppt
)
16-17 18-20 21-22 23-24 25+
But the evidence supported lowering the age threshold for the NLW
8
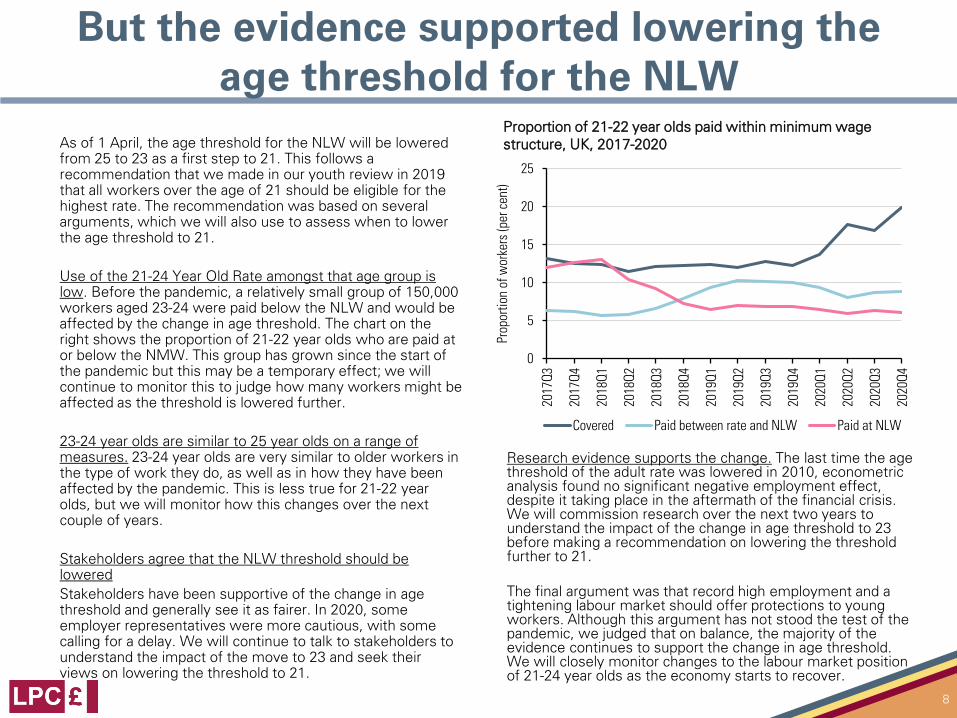
Proportion of 21-22 year olds paid within minimum wage structure, UK, 2017-2020As of 1 April, the age threshold for the NLW will be lowered
from 25 to 23 as a first step to 21. This follows a recommendation that we made in our youth review in 2019 that all workers over the age of 21 should be eligible for the highest rate. The recommendation was based on several arguments, which we will also use to assess when to lower the age threshold to 21.
Use of the 21-24 Year Old Rate amongst that age group is low. Before the pandemic, a relatively small group of 150,000 workers aged 23-24 were paid below the NLW and would be affected by the change in age threshold. The chart on the right shows the proportion of 21-22 year olds who are paid at or below the NMW. This group has grown since the start of the pandemic but this may be a temporary effect; we will continue to monitor this to judge how many workers might be affected as the threshold is lowered further.
23-24 year olds are similar to 25 year olds on a range of measures. 23-24 year olds are very similar to older workers in the type of work they do, as well as in how they have been affected by the pandemic. This is less true for 21-22 year olds, but we will monitor how this changes over the next couple of years.
Stakeholders agree that the NLW threshold should be loweredStakeholders have been supportive of the change in age threshold and generally see it as fairer. In 2020, some employer representatives were more cautious, with some calling for a delay. We will continue to talk to stakeholders to understand the impact of the move to 23 and seek their views on lowering the threshold to 21.
Research evidence supports the change. The last time the age threshold of the adult rate was lowered in 2010, econometric analysis found no significant negative employment effect, despite it taking place in the aftermath of the financial crisis. We will commission research over the next two years to understand the impact of the change in age threshold to 23 before making a recommendation on lowering the threshold further to 21.
The final argument was that record high employment and a tightening labour market should offer protections to young workers. Although this argument has not stood the test of the pandemic, we judged that on balance, the majority of the evidence continues to support the change in age threshold. We will closely monitor changes to the labour market position of 21-24 year olds as the economy starts to recover.
0
5
10
15
20
25
2017
Q3
2017
Q4
2018
Q1
2018
Q2
2018
Q3
2018
Q4
2019
Q1
2019
Q2
2019
Q3
2019
Q4
2020
Q1
2020
Q2
2020
Q3
2020
Q4
Prop
ortio
n of
wor
kers
(per
cen
t)
Covered Paid between rate and NLW Paid at NLW
There remains a high degree of uncertainty in the labour market…
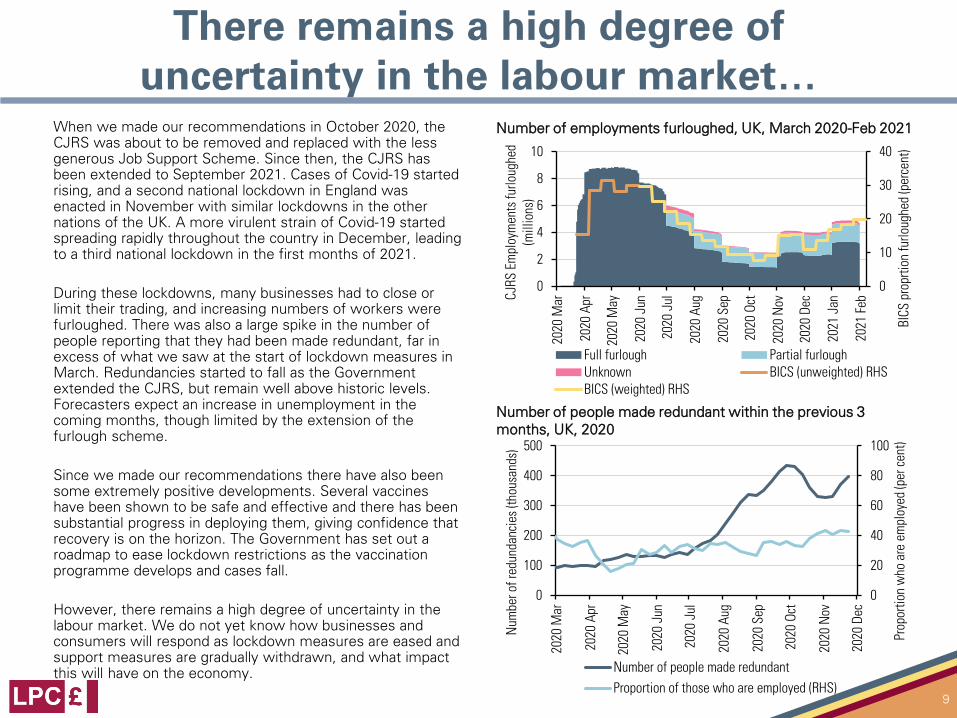
When we made our recommendations in October 2020, the CJRS was about to be removed and replaced with the less generous Job Support Scheme. Since then, the CJRS has been extended to September 2021. Cases of Covid-19 started rising, and a second national lockdown in England was enacted in November with similar lockdowns in the other nations of the UK. A more virulent strain of Covid-19 started spreading rapidly throughout the country in December, leading to a third national lockdown in the first months of 2021.
During these lockdowns, many businesses had to close or limit their trading, and increasing numbers of workers were furloughed. There was also a large spike in the number of people reporting that they had been made redundant, far in excess of what we saw at the start of lockdown measures in March. Redundancies started to fall as the Government extended the CJRS, but remain well above historic levels. Forecasters expect an increase in unemployment in the coming months, though limited by the extension of the furlough scheme.
Since we made our recommendations there have also been some extremely positive developments. Several vaccines have been shown to be safe and effective and there has been substantial progress in deploying them, giving confidence that recovery is on the horizon. The Government has set out a roadmap to ease lockdown restrictions as the vaccination programme develops and cases fall.
However, there remains a high degree of uncertainty in the labour market. We do not yet know how businesses and consumers will respond as lockdown measures are eased and support measures are gradually withdrawn, and what impact this will have on the economy.
9
Number of people made redundant within the previous 3 months, UK, 2020
Number of employments furloughed, UK, March 2020-Feb 2021
0
10
20
30
40
0
2
4
6
8
10
2020
Mar
2020
Apr
2020
May
2020
Jun
2020
Jul
2020
Aug
2020
Sep
2020
Oct
2020
Nov
2020
Dec
2021
Jan
2021
Feb
BICS
pro
prtio
n fu
rloug
hed
(per
cent
)
CJRS
Em
ploy
men
ts fu
rloug
hed
(mill
ions
)
Full furlough Partial furloughUnknown BICS (unweighted) RHSBICS (weighted) RHS
0
20
40
60
80
100
0
100
200
300
400
500
2020
Mar
2020
Apr
2020
May
2020
Jun
2020
Jul
2020
Aug
2020
Sep
2020
Oct
2020
Nov
2020
Dec
Prop
ortio
n w
ho a
re e
mpl
oyed
(per
cen
t)
Num
ber o
f red
unda
ncie
s (th
ousa
nds)
Number of people made redundant
Proportion of those who are employed (RHS)
…and there is large variation in the health of businesses between sectors
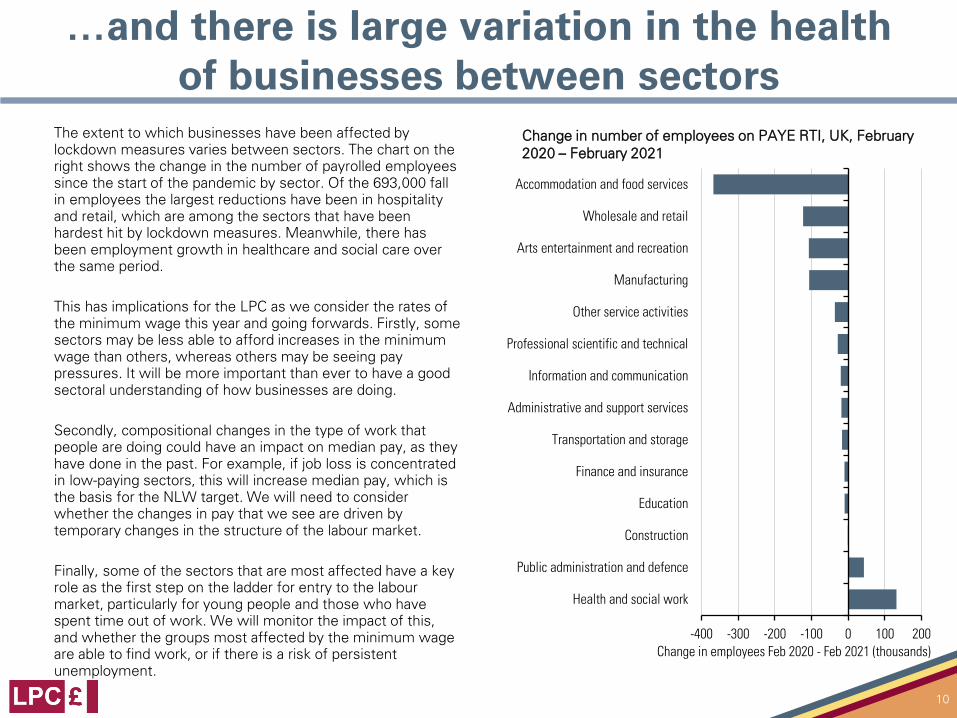
The extent to which businesses have been affected by lockdown measures varies between sectors. The chart on the right shows the change in the number of payrolled employees since the start of the pandemic by sector. Of the 693,000 fall in employees the largest reductions have been in hospitality and retail, which are among the sectors that have been hardest hit by lockdown measures. Meanwhile, there has been employment growth in healthcare and social care over the same period.
This has implications for the LPC as we consider the rates of the minimum wage this year and going forwards. Firstly, some sectors may be less able to afford increases in the minimum wage than others, whereas others may be seeing pay pressures. It will be more important than ever to have a good sectoral understanding of how businesses are doing.
Secondly, compositional changes in the type of work that people are doing could have an impact on median pay, as they have done in the past. For example, if job loss is concentrated in low-paying sectors, this will increase median pay, which is the basis for the NLW target. We will need to consider whether the changes in pay that we see are driven by temporary changes in the structure of the labour market.
Finally, some of the sectors that are most affected have a key role as the first step on the ladder for entry to the labour market, particularly for young people and those who have spent time out of work. We will monitor the impact of this, and whether the groups most affected by the minimum wage are able to find work, or if there is a risk of persistent unemployment.
10
Change in number of employees on PAYE RTI, UK, February 2020 – February 2021
-400 -300 -200 -100 0 100 200
Health and social work
Public administration and defence
Construction
Education
Finance and insurance
Transportation and storage
Administrative and support services
Information and communication
Professional scientific and technical
Other service activities
Manufacturing
Arts entertainment and recreation
Wholesale and retail
Accommodation and food services
Change in employees Feb 2020 - Feb 2021 (thousands)
The government’s remit to the LPC in 2021
The National Living WageOn 3 March, the Government published the LPC’s remit for 2020, which you can find here. This asks us to monitor and evaluate the National Living Wage and recommend the rate which should apply from April 2022 in order to reach two-thirds of median earnings by 2024, taking economic conditions into account. In line with recommendations we made to the Government, the NLW will apply to workers aged 21 and over by 2024.
An ‘emergency brake’Our remit asks us to closely monitor changes in the labour market and if appropriate, advise the Government to review the 2024 target or timeframe. This emergency brake means that the LPC has the ability to recommend reconsidering the target if the evidence suggests it would be damaging for the employment prospects of the lowest-paid workers.
This is particularly important in the context of the Covid-19 pandemic, which clearly presents a challenging set of circumstances for workers and employers. The rates that we recommended for 2021 were necessarily lower than we might have hoped for a year ago; we will need further evidence to see if we can catch up within the timeframe.
Other National Minimum Wage ratesWe have also been asked to monitor and evaluate the levels of each of the National Minimum Wage rates and make recommendations to maximise the rates without damaging employment prospects.
Understanding low-paid workersThe Government has asked us to gather evidence on groups of low paid workers with protected characteristics. Groups more likely to be affected by changes to the minimum wage rates include BAME, younger, older, disabled and women workers.
Additionally, we have been asked to gather evidence on the differing impact of increases to the minimum wage rates across the United Kingdom, to improve understanding of the role of low-paid work around the country and support the Government’s levelling up agenda.
Live-in domestic workersThis year, we have also been asked to gather evidence on the application of the ‘live-in domestic worker exemption’ to minimum wage entitlement. We will seek to understand how this exemption is used and its impact on the labour market.
11
The path of the NLW to 2024
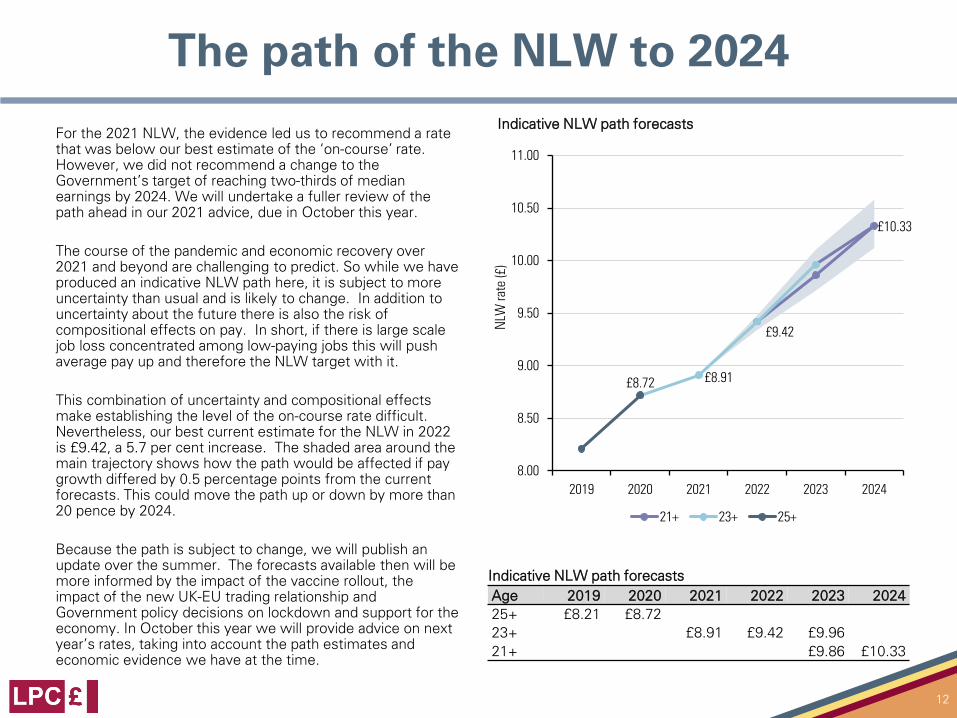
For the 2021 NLW, the evidence led us to recommend a rate that was below our best estimate of the ‘on-course’ rate. However, we did not recommend a change to the Government’s target of reaching two-thirds of median earnings by 2024. We will undertake a fuller review of the path ahead in our 2021 advice, due in October this year.
The course of the pandemic and economic recovery over 2021 and beyond are challenging to predict. So while we have produced an indicative NLW path here, it is subject to more uncertainty than usual and is likely to change. In addition to uncertainty about the future there is also the risk of compositional effects on pay. In short, if there is large scale job loss concentrated among low-paying jobs this will push average pay up and therefore the NLW target with it.
This combination of uncertainty and compositional effects make establishing the level of the on-course rate difficult. Nevertheless, our best current estimate for the NLW in 2022 is £9.42, a 5.7 per cent increase. The shaded area around the main trajectory shows how the path would be affected if pay growth differed by 0.5 percentage points from the current forecasts. This could move the path up or down by more than 20 pence by 2024.
Because the path is subject to change, we will publish an update over the summer. The forecasts available then will be more informed by the impact of the vaccine rollout, the impact of the new UK-EU trading relationship and Government policy decisions on lockdown and support for the economy. In October this year we will provide advice on next year’s rates, taking into account the path estimates and economic evidence we have at the time.
12
Age 2019 2020 2021 2022 2023 202425+ £8.21 £8.7223+ £8.91 £9.42 £9.9621+ £9.86 £10.33
Indicative NLW path forecasts
Indicative NLW path forecasts
£10.33
£8.91
£9.42
£8.72
8.00
8.50
9.00
9.50
10.00
10.50
11.00
2019 2020 2021 2022 2023 2024N
LW ra
te (£
)21+ 23+ 25+
Our evidence base
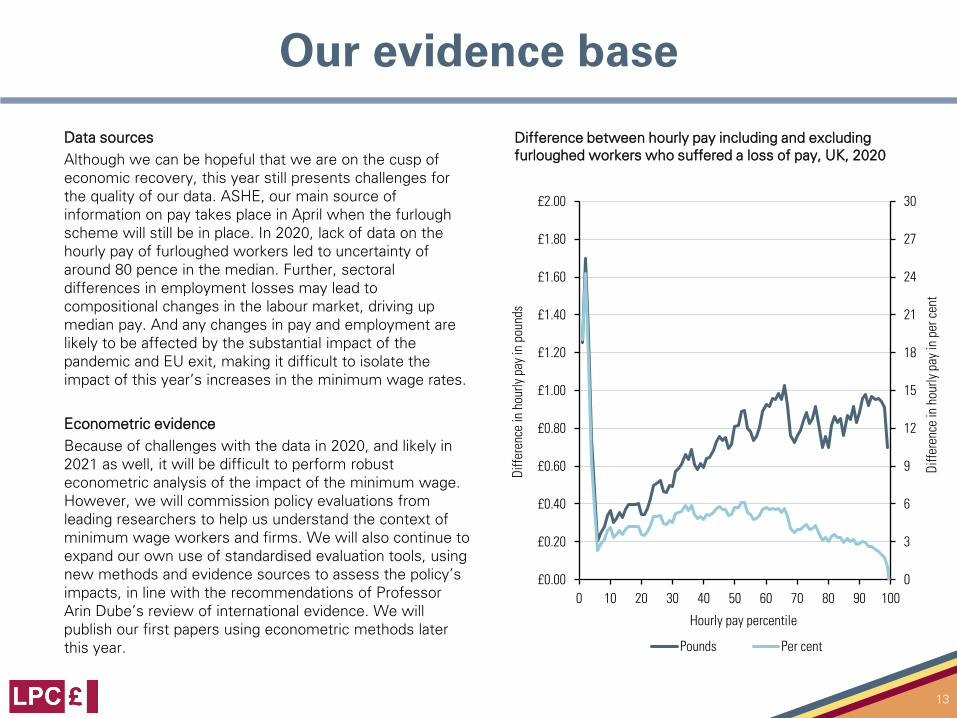
Data sourcesAlthough we can be hopeful that we are on the cusp of economic recovery, this year still presents challenges for the quality of our data. ASHE, our main source of information on pay takes place in April when the furlough scheme will still be in place. In 2020, lack of data on the hourly pay of furloughed workers led to uncertainty of around 80 pence in the median. Further, sectoral differences in employment losses may lead to compositional changes in the labour market, driving up median pay. And any changes in pay and employment are likely to be affected by the substantial impact of the pandemic and EU exit, making it difficult to isolate the impact of this year’s increases in the minimum wage rates.
Econometric evidenceBecause of challenges with the data in 2020, and likely in 2021 as well, it will be difficult to perform robust econometric analysis of the impact of the minimum wage. However, we will commission policy evaluations from leading researchers to help us understand the context of minimum wage workers and firms. We will also continue to expand our own use of standardised evaluation tools, using new methods and evidence sources to assess the policy’s impacts, in line with the recommendations of Professor Arin Dube’s review of international evidence. We will publish our first papers using econometric methods later this year.
13
0
3
6
9
12
15
18
21
24
27
30
£0.00
£0.20
£0.40
£0.60
£0.80
£1.00
£1.20
£1.40
£1.60
£1.80
£2.00
0 10 20 30 40 50 60 70 80 90 100
Diffe
renc
e in
hou
rly p
ay in
per
cen
t
Diffe
renc
e in
hou
rly p
ay in
pou
nds
Hourly pay percentile
Pounds Per cent
Difference between hourly pay including and excluding furloughed workers who suffered a loss of pay, UK, 2020
We need evidence from workers and firms
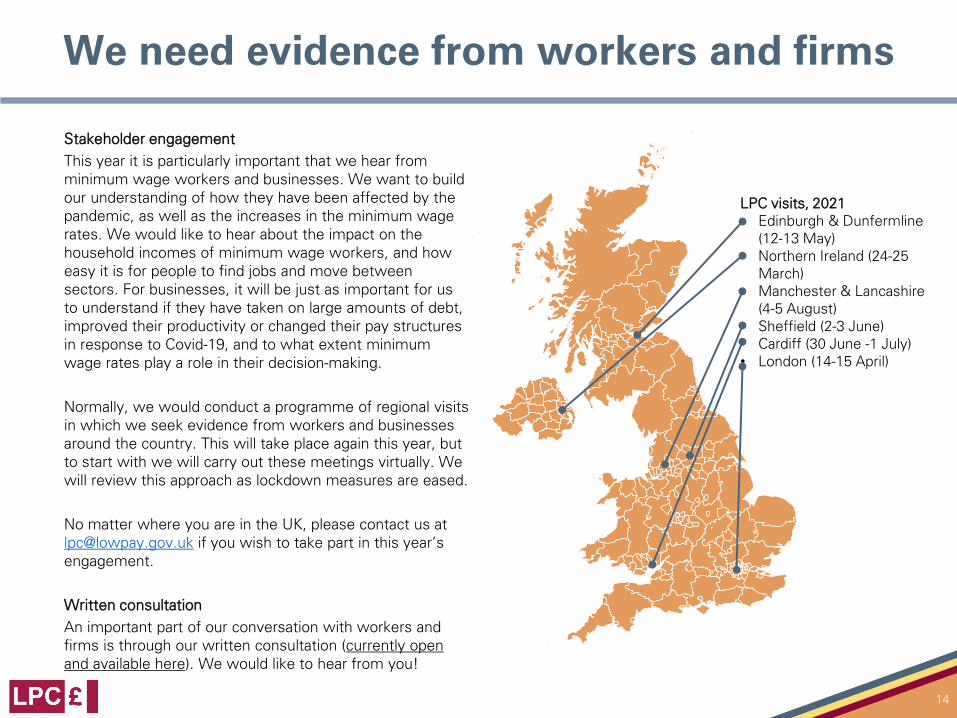
Stakeholder engagementThis year it is particularly important that we hear from minimum wage workers and businesses. We want to build our understanding of how they have been affected by the pandemic, as well as the increases in the minimum wage rates. We would like to hear about the impact on the household incomes of minimum wage workers, and how easy it is for people to find jobs and move between sectors. For businesses, it will be just as important for us to understand if they have taken on large amounts of debt, improved their productivity or changed their pay structures in response to Covid-19, and to what extent minimum wage rates play a role in their decision-making.
Normally, we would conduct a programme of regional visits in which we seek evidence from workers and businesses around the country. This will take place again this year, but to start with we will carry out these meetings virtually. We will review this approach as lockdown measures are eased.
No matter where you are in the UK, please contact us at [email protected] if you wish to take part in this year’s engagement.
Written consultationAn important part of our conversation with workers and firms is through our written consultation (currently open and available here). We would like to hear from you!
14
LPC visits, 2021• Edinburgh & Dunfermline
(12-13 May)• Northern Ireland (24-25
March)• Manchester & Lancashire
(4-5 August)• Sheffield (2-3 June)• Cardiff (30 June -1 July)• London (14-15 April)
Forthcoming LPC publications
Future LPC publications and consultations• We will publish a report on non-compliance and
enforcement next month.• We will publish a report on our internal econometric
analysis.• Our consultation on the 2022 NLW and NMW rates is
currently open and can be found on our website.• Our programme of regional visits around the country will
take place via virtual meetings while Covid-19 restrictions are in place.
• We will publish an updated path for the NLW in the summer.
• In the autumn we will make our recommendations to the Government on the 2022 minimum wage rates.
The data for the charts in this report are published on our website.Page 4: LPC estimates using LFS, income weights, quarterly, not seasonally adjusted, UK, 2016-2020; LPC estimates using LFS, income weights, based on real value of NLW in 2020 terms using CPI, UK, 2020 Q1Page 5: LPC estimates using LFS, population weights, weekly data, UK, 2020 Q1 –Q4; LPC estimates using ASHE 2019 and ASHE 2020, population weightsPage 6: LPC estimates using CPI, RPI, AWE and OBR forecasts for the UK economy, March 2021Page 7: LPC estimates using LFS Q1, population weights and HMRC statistics on use of CJRS, August 2020; LPC estimates using LFS microdata, based on week of interview, population weights, quarterly rolling average, UKPage 8: LPC estimates using LFS, income weights, quarterly, not seasonally adjusted, UK, 2017-2020Page 9: HMRC CJRS statistics and estimates on use of furlough scheme from BICS; LPC analysis of LFS redundancies, population weights, weekly data, not seasonally adjusted, UK, 2020Page 10: HMRC – Pay As You Earn Real Time InformationPage 12: LPC estimates using ASHE 2019, population weights, UK; AWE total pay (KAB9), seasonally adjusted, GB; and wage growth forecasts from HM Treasury Forecasts for the UK economy (March 2021), Bank of England Monetary Policy Report (February 2021) and OBR Economic & Fiscal Outlook (March 2021)Page 13: LPC estimates using ASHE, population weights, including and excluding furloughed workers with a loss of pay, UK, 2020
© Crown copyright 2021
This publication is licensed under the terms of the Open Government Licence v3.0 except where otherwise stated. To view this licence, visit nationalarchives.gov.uk/doc/open-government-licence/version/3 or write to the Information Policy Team, The National Archives, Kew, London TW9 4DU, or email: [email protected].
Where we have identified any third-party copyright information you will need to obtain permission from the copyright holders concerned.
Any enquiries regarding this publication should be sent to us at: [email protected]
15
Contact uswww.lowpay.gov.uk
@lpcminimumwage
020 7211 8119
LPC blog