Embed Size (px)
Citation preview
National Centre for Education and Training on Addiction (NCETA), Flinders University
The National
Methamphetamine Symposium Making Research Work in Practice
Methamphetamine Use in Australia: What the data tells us about patterns of use
Ann Roche
12 May 2015 | Arts Centre, Melbourne
Methamphetamine Use in Australia:
What the data tells us about patterns of use
methamphetamine
Ann Roche
Director National Centre for Education and Training on Addiction (NCETA)
www.nceta.flinders.edu.au
The National Methamphetamine Symposium:
Making Research Work in Practice
12 May 2015
Acknowledgments
NCETA Conference Organising Team:
Allan Trifonoff, Stacey Appleton
NCETA Conference Program:
Ann Roche, Nicole Lee, Robert Ali
NCETA Logistics Team:
Dr Alice McEntee, Dr Ken Pidd, Jane Fischer,
Victoria Kostadinov
Australian Government Department of Health
Increasing concern in Australia
about methamphetamine use,
often framed as ‘ice’ use
Strong media interest ‘An Epidemic of Negative Headlines’
Pressure on health and
community services to respond
appropriately
Family impact and social
disruption
Current Context
What’s the current situation?
This presentation provides an overview of the current data to inform our understanding of patterns, problems and potential responses.
Data will provide only part of the insight and understanding required. Best available data is limited.
The community, families and users, and service providers need to complement the available data with first hand knowledge and experience.
Key Questions and Considerations
What is Methamphetamine?
What is ‘Ice’?
What has changed?
What is the concern?
Who is most likely to experience problems?
What are the best evidence-based intervention options?
Methamphetamine belongs to the ‘stimulant’ class of drugs, which also includes
amphetamine, ecstasy, and cocaine.
They stimulate the brain and central nervous system; can result in a range of
physiological and psychological changes including:
a) increased alertness/euphoria/energy/enhanced mood …..
b) anxiety/panic/agitation/hallucinations…aggression/violence.
3 main forms of methamphetamine:
• powder (speed)
• base
• crystal (ice)
Of particular concern is the crystalline
form of methamphetamine,
known as ‘ice’.
Ice (also known as crystal meth, meth,
crystal, shabu, batu, d-meth, glass, or
shard):
• most potent form of methamphetamine,
• usually smoked or injected.
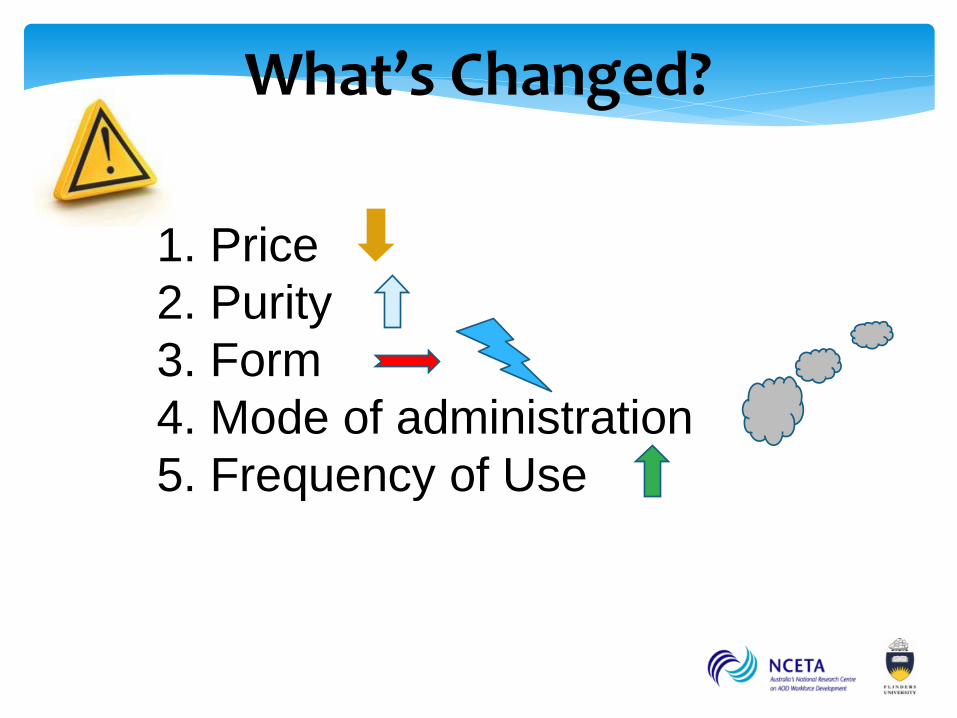
What’s Changed?
1. Price
2. Purity
3. Form
4. Mode of administration
5. Frequency of Use
Scott et al., 2014
Reported:
• Increase in purity
• Decline in purity-adjusted price
per gram
• Extreme purity variation
Patterns of use and Manifestation of Problems
Multiple sources….anecdote, media, observation, service providers, law
enforcement…
1. National Drug Strategy Household Survey (NDSHS)
2. National Minimum Data Set ( AOD Treatment Specialists)
3. Hospital Morbidity Data
4. Other (IDRS, EDRS, ED, specific targeted studies)
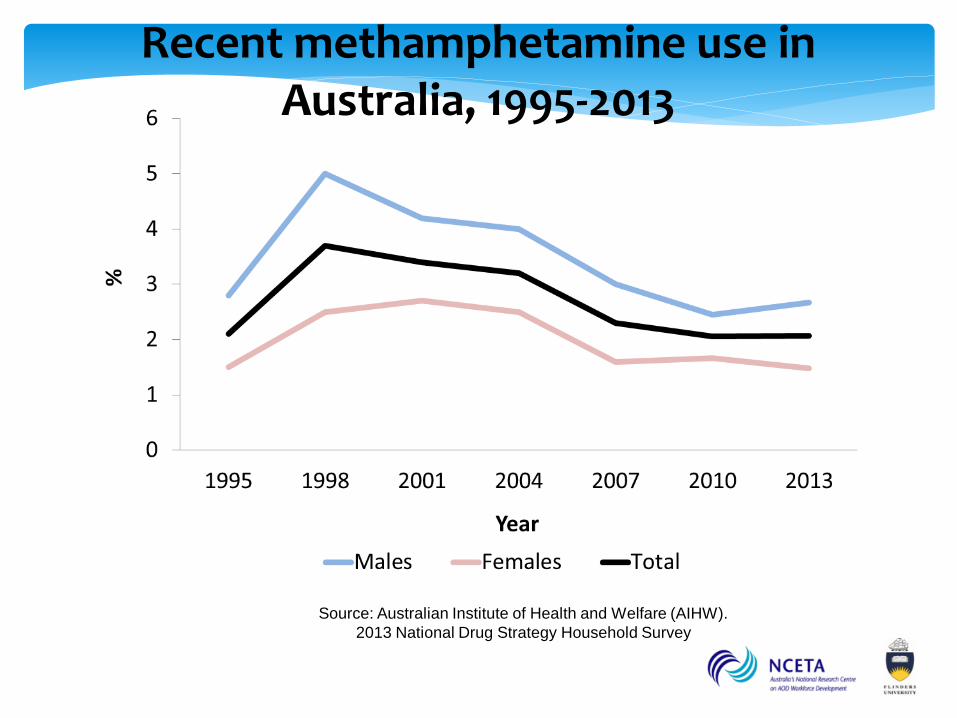
Recent methamphetamine use in Australia, 1995-2013
Source: Australian Institute of Health and Welfare (AIHW).
2013 National Drug Strategy Household Survey
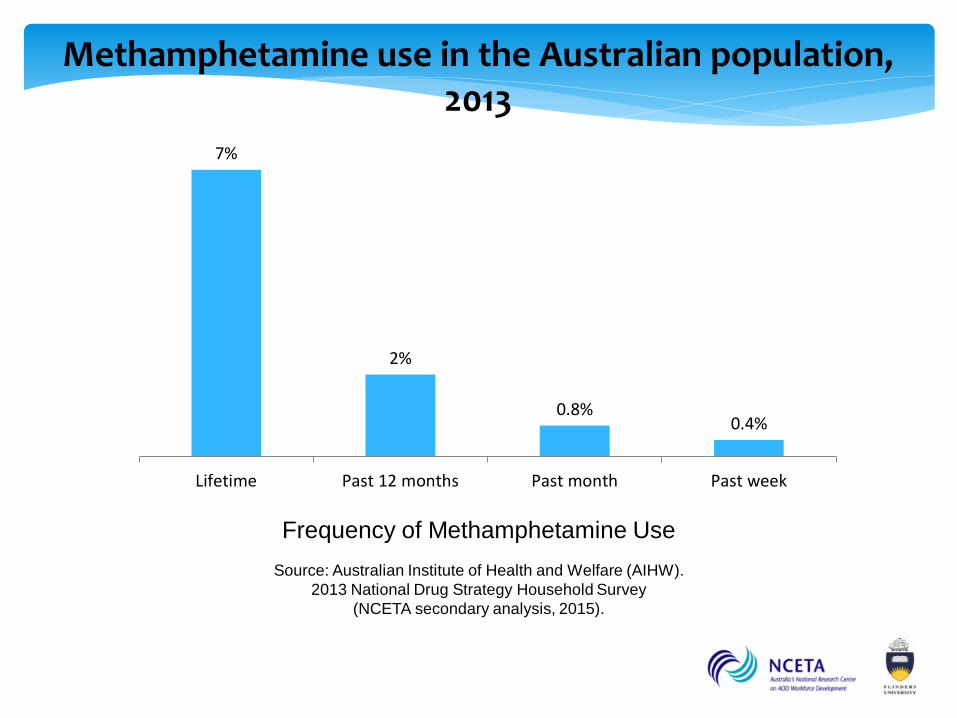
Methamphetamine use in the Australian population, 2013
Source: Australian Institute of Health and Welfare (AIHW).
2013 National Drug Strategy Household Survey
(NCETA secondary analysis, 2015).
Frequency of Methamphetamine Use
7%
2%
0.8% 0.4%
Lifetime Past 12 months Past month Past week
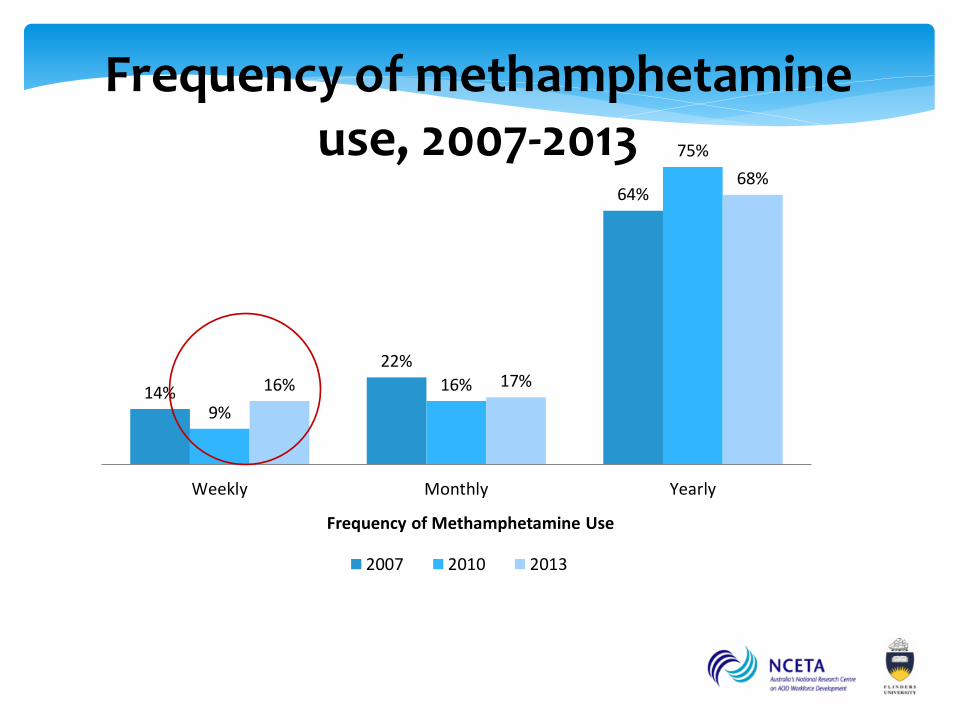
Frequency of methamphetamine use, 2007-2013
14%
22%
64%
9%
16%
75%
16% 17%
68%
Weekly Monthly Yearly
Frequency of Methamphetamine Use
2007 2010 2013
Source: Australian Institute of Health and Welfare (AIHW).
2013 National Drug Strategy Household Survey1
(NCETA secondary analysis, 2015).
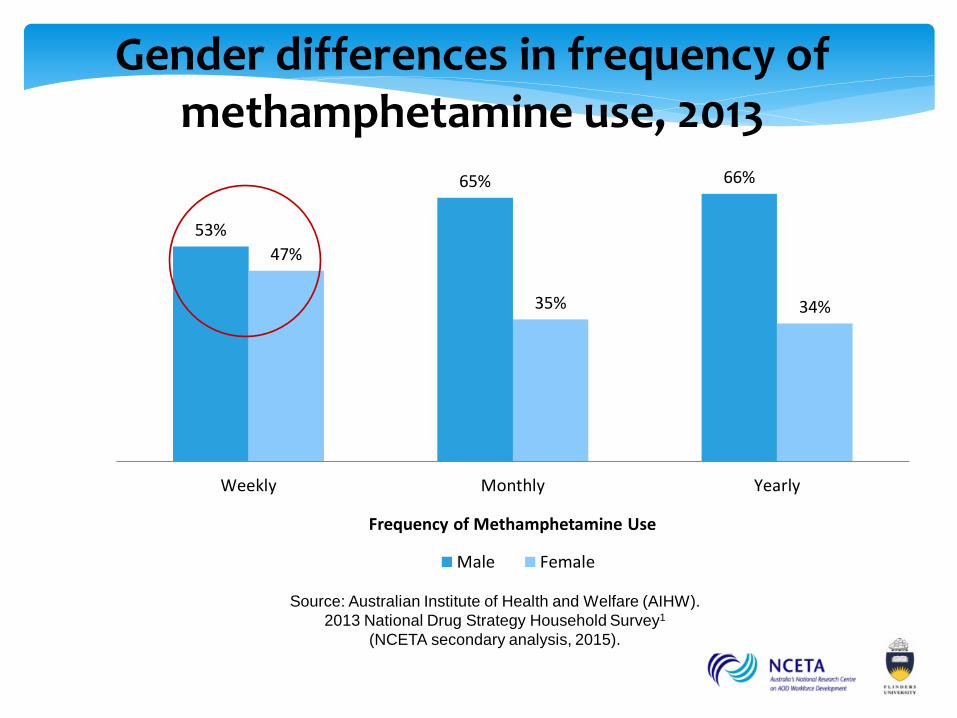
Gender differences in frequency of
methamphetamine use, 2013
53%
65% 66%
47%
35% 34%
Weekly Monthly Yearly
Frequency of Methamphetamine Use
Male Female
Source: Australian Institute of Health and Welfare (AIHW).
2007, 2010, 2013 National Drug Strategy Household Survey
(NCETA secondary analysis, 2015).
* Estimate may be unreliable due to small sample size
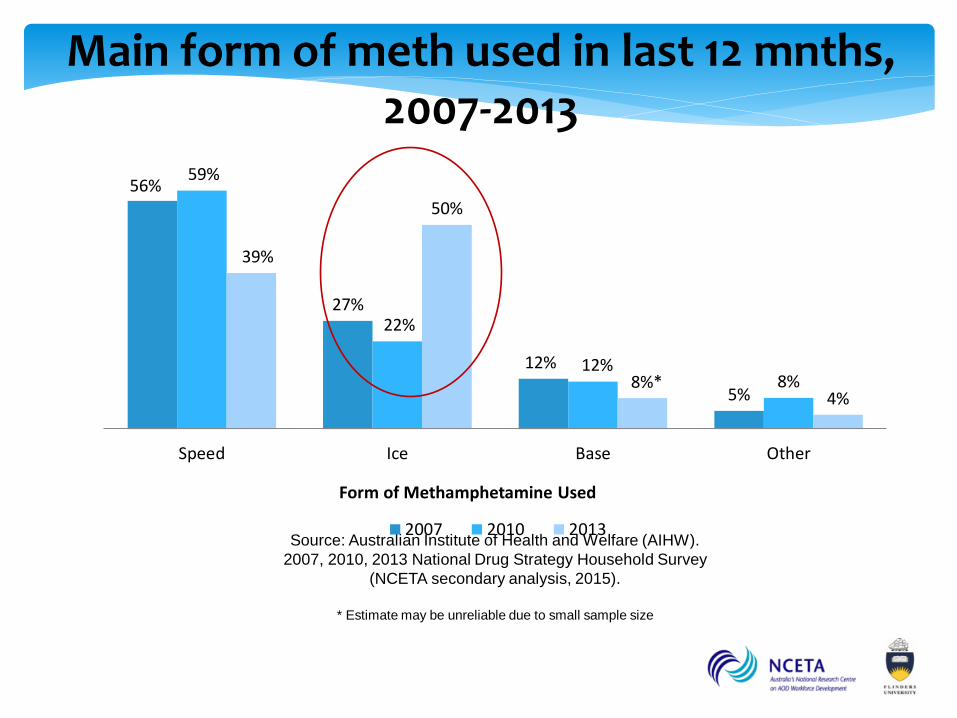
Main form of meth used in last 12 mnths,
2007-2013
56%
27%
12%
5%
59%
22%
12% 8%
39%
50%
8%* 4%
Speed Ice Base Other
Form of Methamphetamine Used
2007 2010 2013
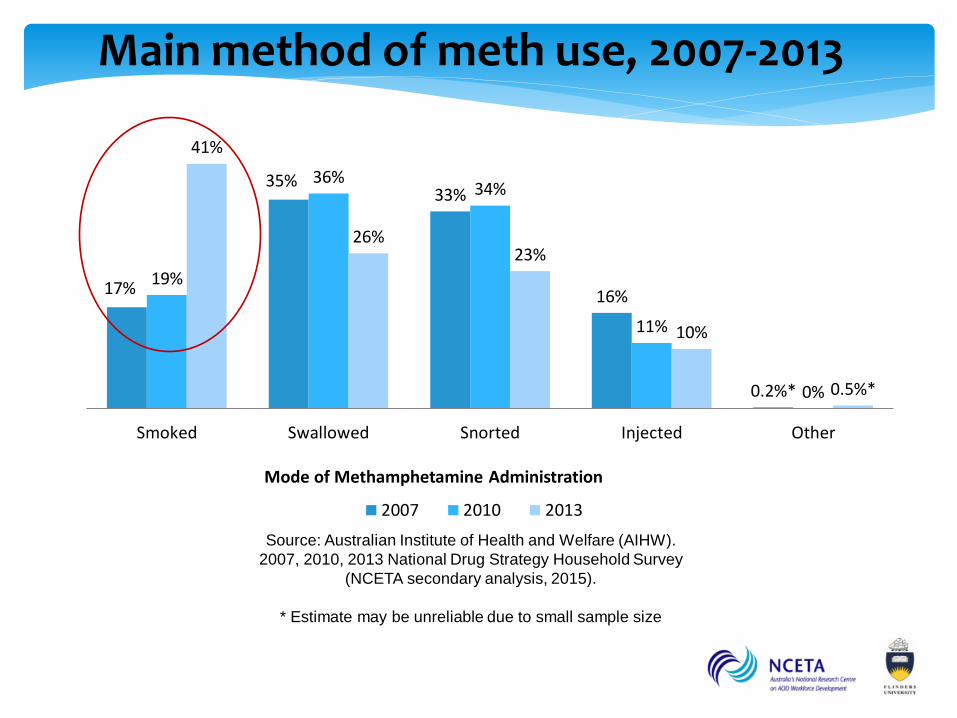
Main method of meth use, 2007-2013
Source: Australian Institute of Health and Welfare (AIHW).
2007, 2010, 2013 National Drug Strategy Household Survey
(NCETA secondary analysis, 2015).
* Estimate may be unreliable due to small sample size
17%
35% 33%
16%
0.2%*
19%
36% 34%
11%
0%
41%
26% 23%
10%
0.5%*
Smoked Swallowed Snorted Injected Other
Mode of Methamphetamine Administration
2007 2010 2013
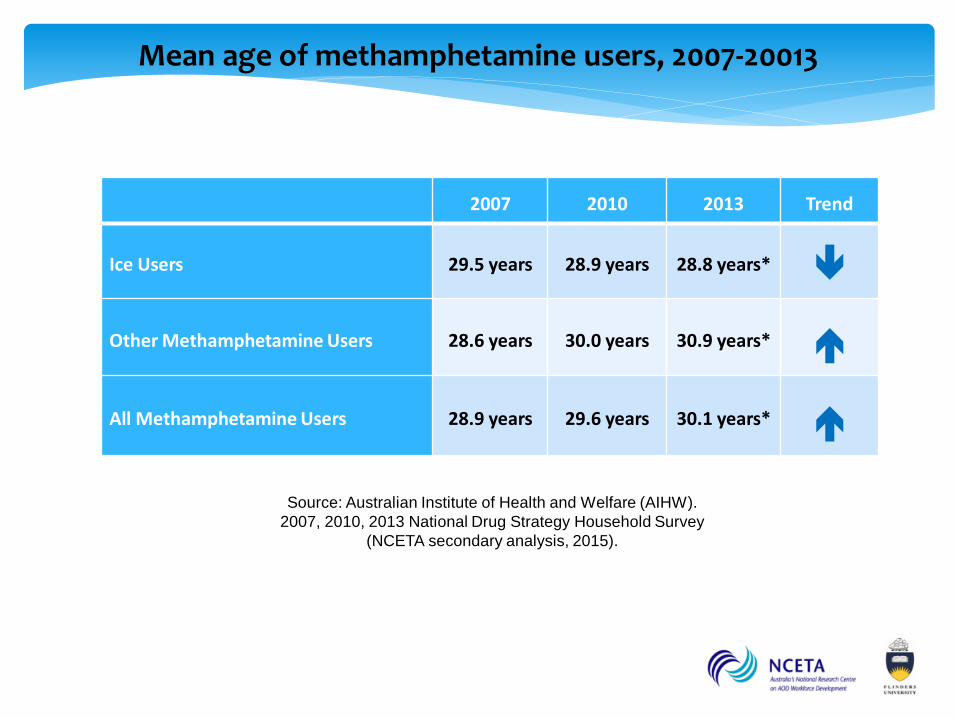
Mean age of methamphetamine users, 2007-20013
Source: Australian Institute of Health and Welfare (AIHW).
2007, 2010, 2013 National Drug Strategy Household Survey
(NCETA secondary analysis, 2015).
2007 2010 2013 Trend
Ice Users 29.5 years 28.9 years 28.8 years*
Other Methamphetamine Users 28.6 years 30.0 years 30.9 years*
All Methamphetamine Users 28.9 years 29.6 years 30.1 years*
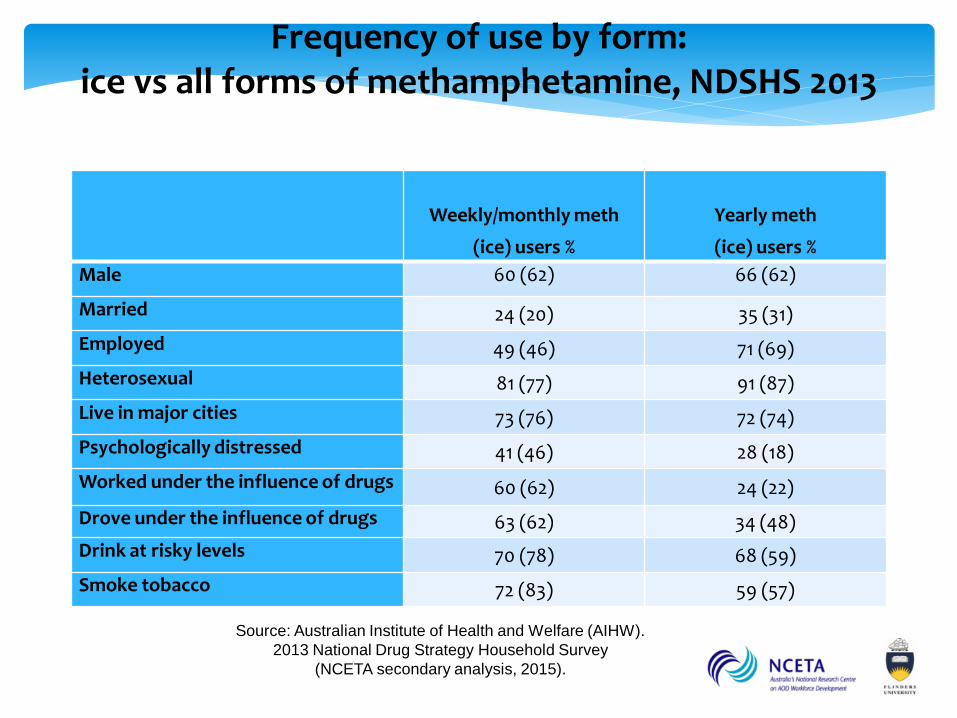
Frequency of use by form: ice vs all forms of methamphetamine, NDSHS 2013
Weekly/monthly meth
(ice) users %
Yearly meth
(ice) users %
Male 60 (62) 66 (62)
Married 24 (20) 35 (31)
Employed 49 (46) 71 (69)
Heterosexual 81 (77) 91 (87)
Live in major cities 73 (76) 72 (74)
Psychologically distressed 41 (46) 28 (18)
Worked under the influence of drugs 60 (62) 24 (22)
Drove under the influence of drugs 63 (62) 34 (48)
Drink at risky levels 70 (78) 68 (59)
Smoke tobacco 72 (83) 59 (57)
Source: Australian Institute of Health and Welfare (AIHW).
2013 National Drug Strategy Household Survey
(NCETA secondary analysis, 2015).
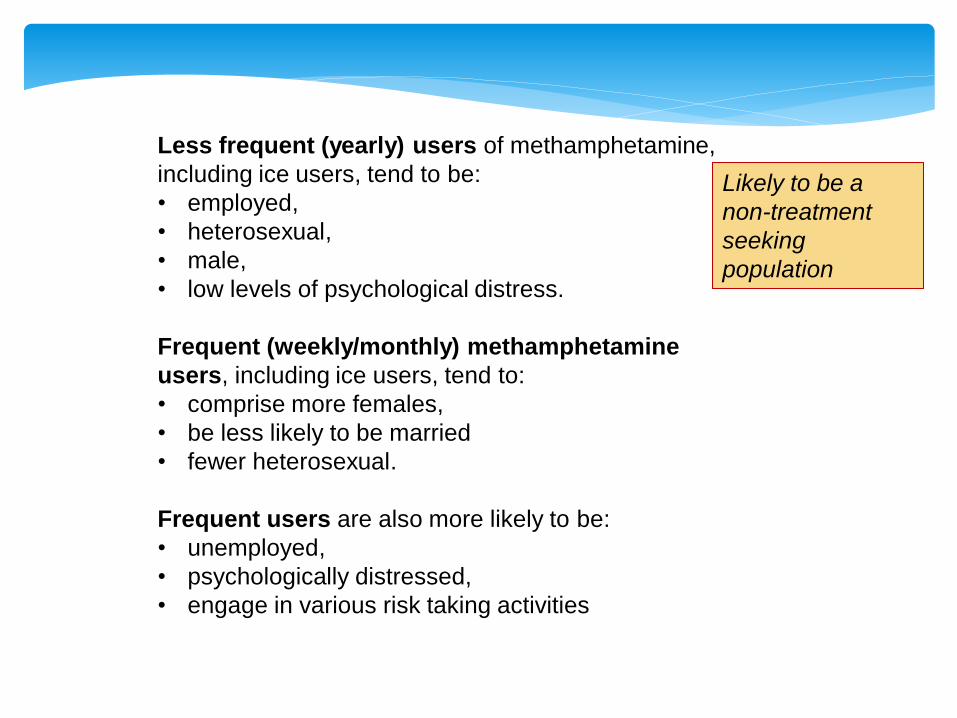
Less frequent (yearly) users of methamphetamine,
including ice users, tend to be:
• employed,
• heterosexual,
• male,
• low levels of psychological distress.
Frequent (weekly/monthly) methamphetamine
users, including ice users, tend to:
• comprise more females,
• be less likely to be married
• fewer heterosexual.
Frequent users are also more likely to be:
• unemployed,
• psychologically distressed,
• engage in various risk taking activities
Likely to be a
non-treatment
seeking
population
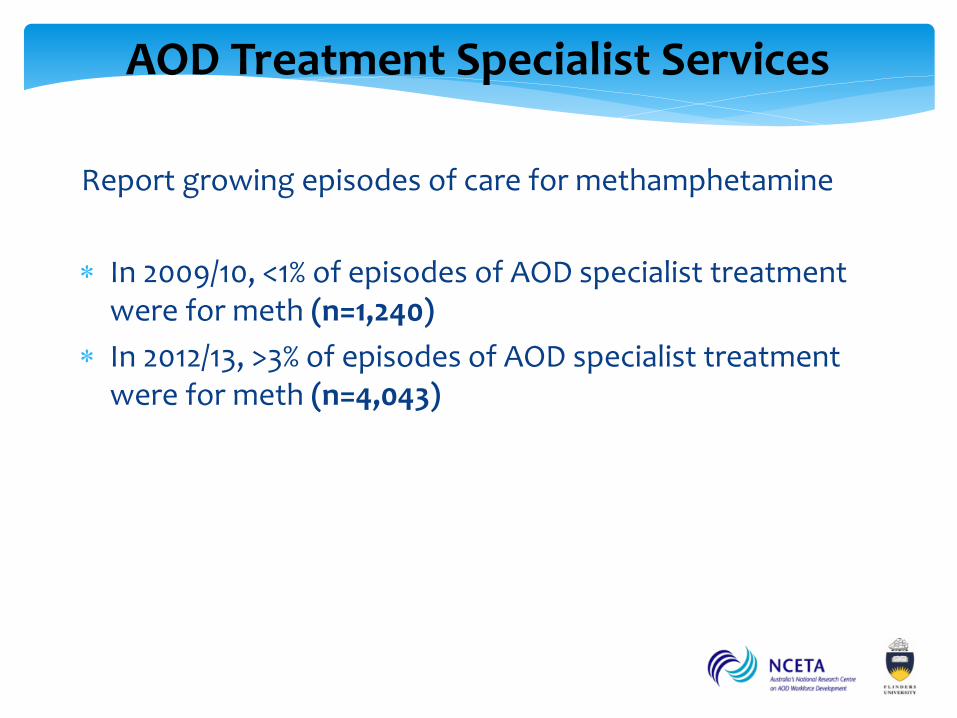
AOD Treatment Specialist Services
Report growing episodes of care for methamphetamine
In 2009/10, <1% of episodes of AOD specialist treatment were for meth (n=1,240)
In 2012/13, >3% of episodes of AOD specialist treatment were for meth (n=4,043)
Stimulants as a proportion of all hospital separation for
illicits substances, Increased from:
15% 2009/01
27% 2012/13
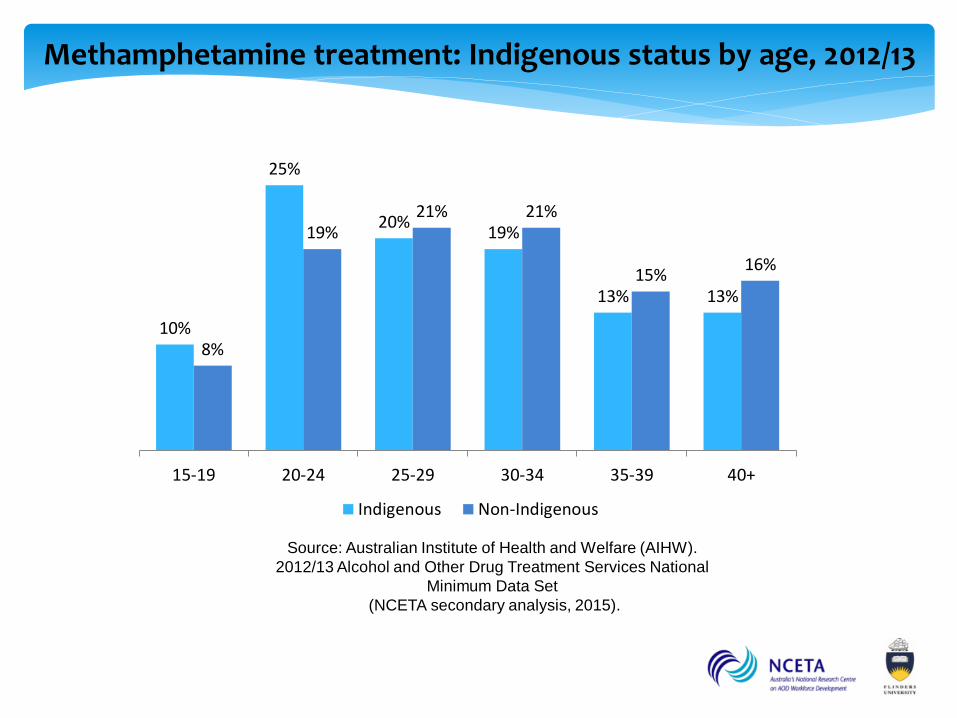
Methamphetamine treatment: Indigenous status by age, 2012/13
10%
25%
20% 19%
13% 13%
8%
19% 21% 21%
15% 16%
15-19 20-24 25-29 30-34 35-39 40+
Indigenous Non-Indigenous
Source: Australian Institute of Health and Welfare (AIHW).
2012/13 Alcohol and Other Drug Treatment Services National
Minimum Data Set
(NCETA secondary analysis, 2015).

Hospital separations: methamphetamine vs
other stimulants, 2008/09-2012/13
Source: Australian Institute of Health and Welfare (AIHW).
2008-2013 National Hospital Morbidity Database
(NCETA secondary analysis, 2015).
19% 18%
30% 29% 35%
81% 82%
70% 71% 65%
2008/09 2009/10 2010/11 2011/12 2012/13
Methamphetamines Other stimulants
Source: Australian Institute of Health and Welfare (AIHW).
2008-2013 National Hospital Morbidity Database
(NCETA secondary analysis, 2015).
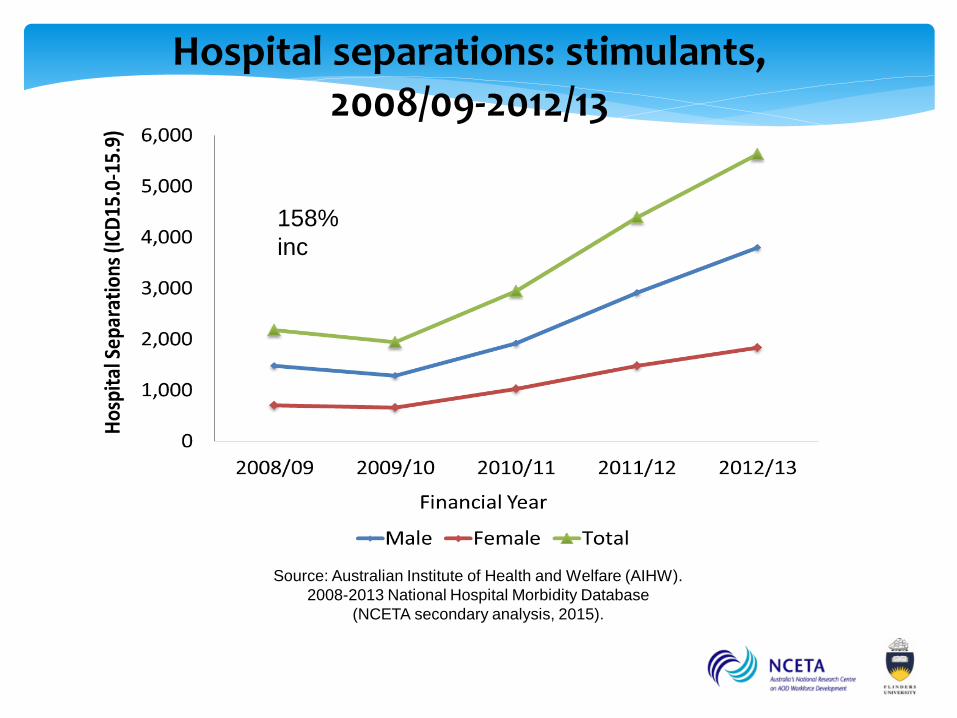
Hospital separations: stimulants,
2008/09-2012/13
158%
inc
Source: Australian Institute of Health and Welfare (AIHW).
2008-2013 National Hospital Morbidity Database
(NCETA secondary analysis, 2015).
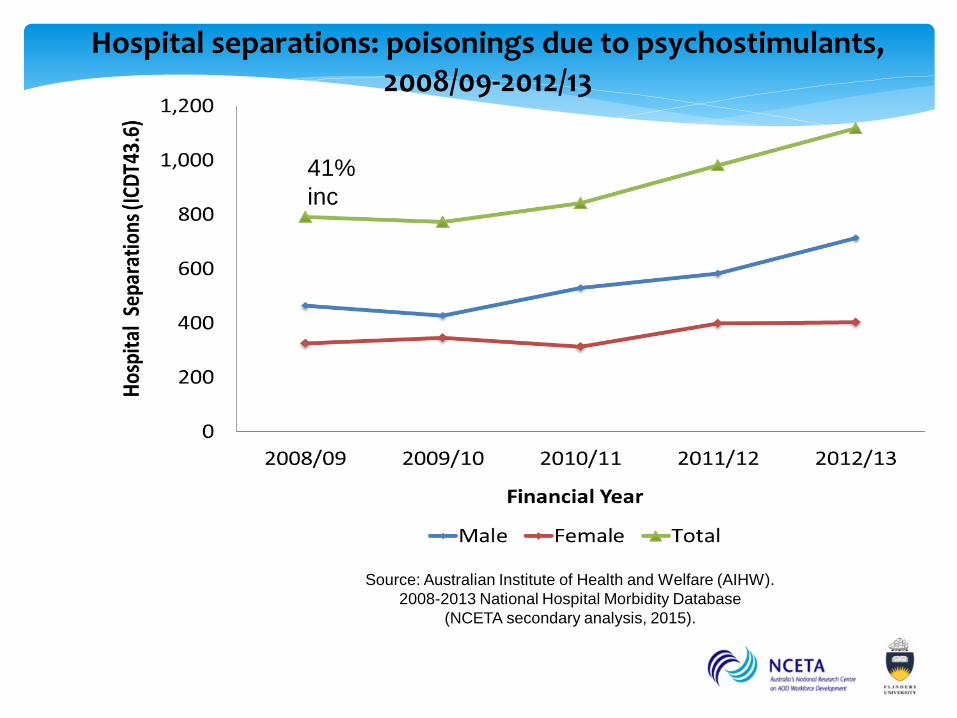
Hospital separations: poisonings due to psychostimulants, 2008/09-2012/13
41%
inc
Source: Australian Institute of Health and Welfare (AIHW).
2008-2013 National Hospital Morbidity Database
(NCETA secondary analysis, 2015).
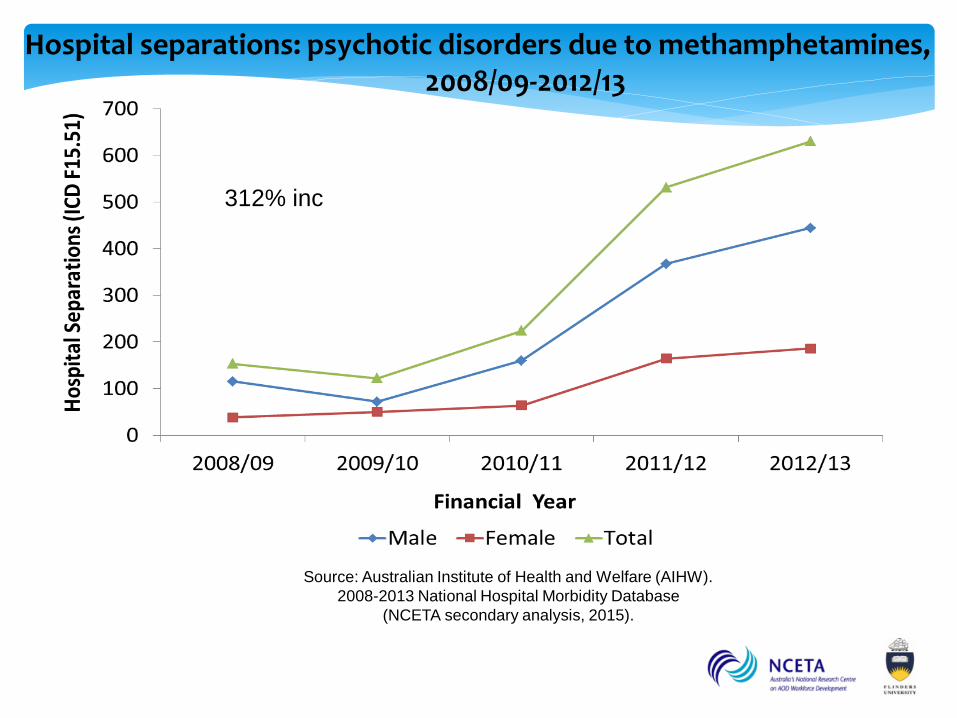
Hospital separations: psychotic disorders due to methamphetamines, 2008/09-2012/13
312% inc
Source: Australian Institute of Health and Welfare (AIHW).
2008-2013 National Hospital Morbidity Database
(NCETA secondary analysis, 2015).
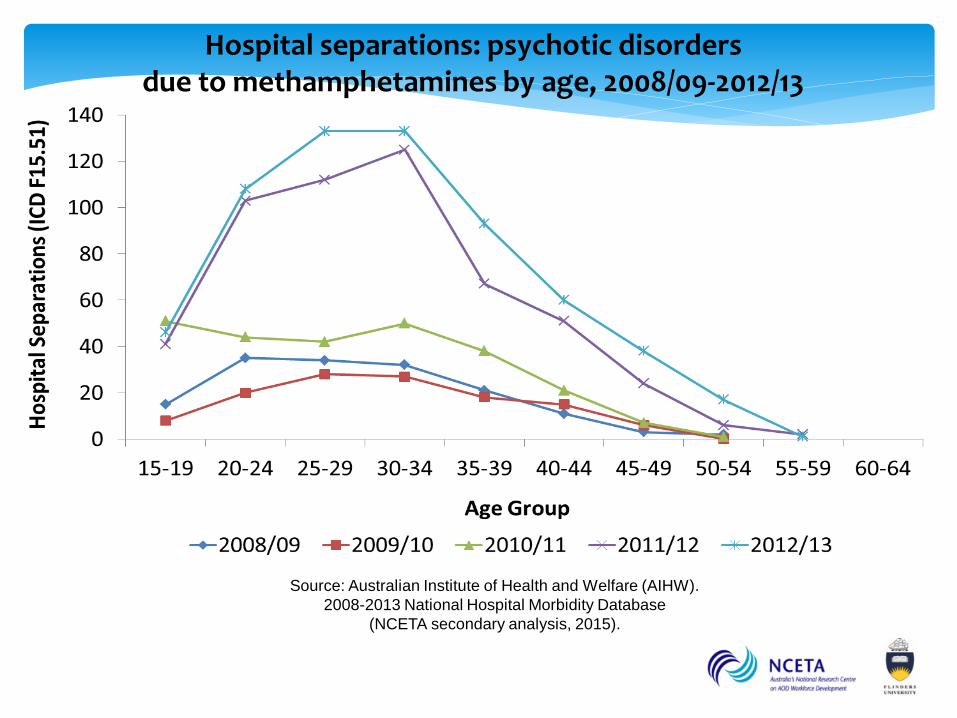
Hospital separations: psychotic disorders due to methamphetamines by age, 2008/09-2012/13
Important not to see either the causes or the responses to meth/ice issues in isolation
Comprehensive/holistic responses needed
Consideration given to concurrent patterns of use:
Alcohol:
- high levels of stimulant use associated with risky drinking and night time economy …
’Wide-awake drunkenness’ (Pennay et al 2014)
Cannabis:
Potential displacement effect, shifting from cannabis to meth to avoid drug detection.
Other Considerations
Implications
Clear changes, not in same direction
Greater demand on treatment services
Recognition of impost on services and workers
People with complex needs
Not just a simple drug issue
Targeted interventions needed
Problems experienced by people with
complex needs and concerns. Tip of the
iceberg only.