Embed Size (px)
Citation preview
EXPLANATION
NLCD 2006 class legend
Open water
Perennial ice/snow
Developed, open space
Developed, low intensity
Developed, medium intensity
Developed, high intensity
Barren land
Deciduous forest
Evergreen forest
Mixed forest
Shrub/scrub
Grassland/herbaceous
Hay/pasture
Cultivated crops
Woody wetlands
Herbaceous wetlands
0 200 400 800 MILES
0 250 500 1,000 1,500 KILOMETERS
U.S. Department of the InteriorU.S. Geological Survey
Fact Sheet 2012–3020February 2012
The National Land Cover Database
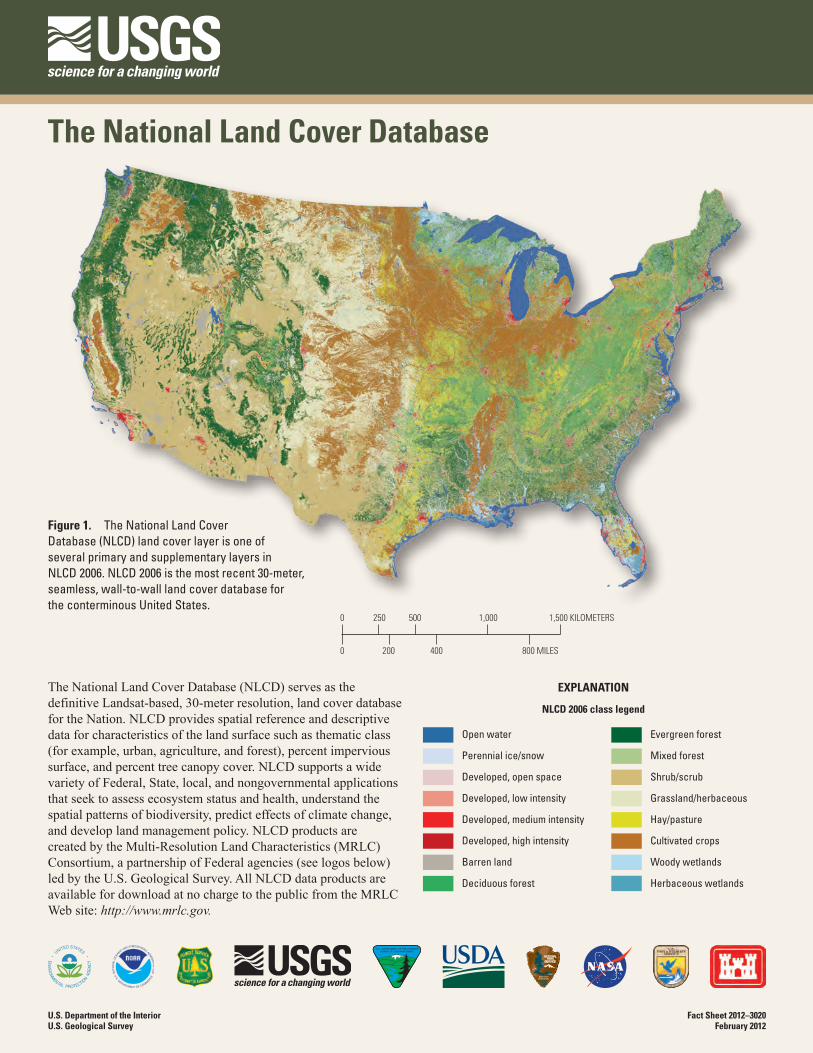
Figure 1. The National Land Cover Database (NLCD) land cover layer is one of several primary and supplementary layers in NLCD 2006. NLCD 2006 is the most recent 30-meter, seamless, wall-to-wall land cover database for the conterminous United States.
The National Land Cover Database (NLCD) serves as the definitive Landsat-based, 30-meter resolution, land cover database for the Nation. NLCD provides spatial reference and descriptive data for characteristics of the land surface such as thematic class (for example, urban, agriculture, and forest), percent impervious surface, and percent tree canopy cover. NLCD supports a wide variety of Federal, State, local, and nongovernmental applications that seek to assess ecosystem status and health, understand the spatial patterns of biodiversity, predict effects of climate change, and develop land management policy. NLCD products are created by the Multi-Resolution Land Characteristics (MRLC) Consortium, a partnership of Federal agencies (see logos below) led by the U.S. Geological Survey. All NLCD data products are available for download at no charge to the public from the MRLC Web site: http://www.mrlc.gov.
NLCD ProductsBefore the NLCD 2006 release, NLCD consisted of three major data releases based on a 10-year production cycle: a circa 1992 conterminous U.S. land cover dataset (NLCD 1992), a circa 2001 land cover database for the United States and Puerto Rico (NLCD 2001), and a 1992/2001 Land Cover Change Retrofit (LCCR) product. The release of NLCD 2006 represents the first database produced with a 5-year repeat cycle and with additional products specifically designed for land cover monitoring. The addition of change monitoring products in NLCD 2006 provides
a national capability to assess land cover change across the conterminous United States from 2001 to 2006. All NLCD 2006 land cover products are directly comparable to NLCD 2001 (ver. 2.0) products to enable a wide spectrum of land cover change analysis by users. The next version of NLCD, entitled NLCD 2011, is currently (2012) in production. NLCD 2011 will update NLCD products to a nominal year of 2011 in all 50 States and Puerto Rico, and will continue to provide a national assessment of land cover change back to either 2001 or 2006. NLCD 2011 is scheduled for public release in December 2013.
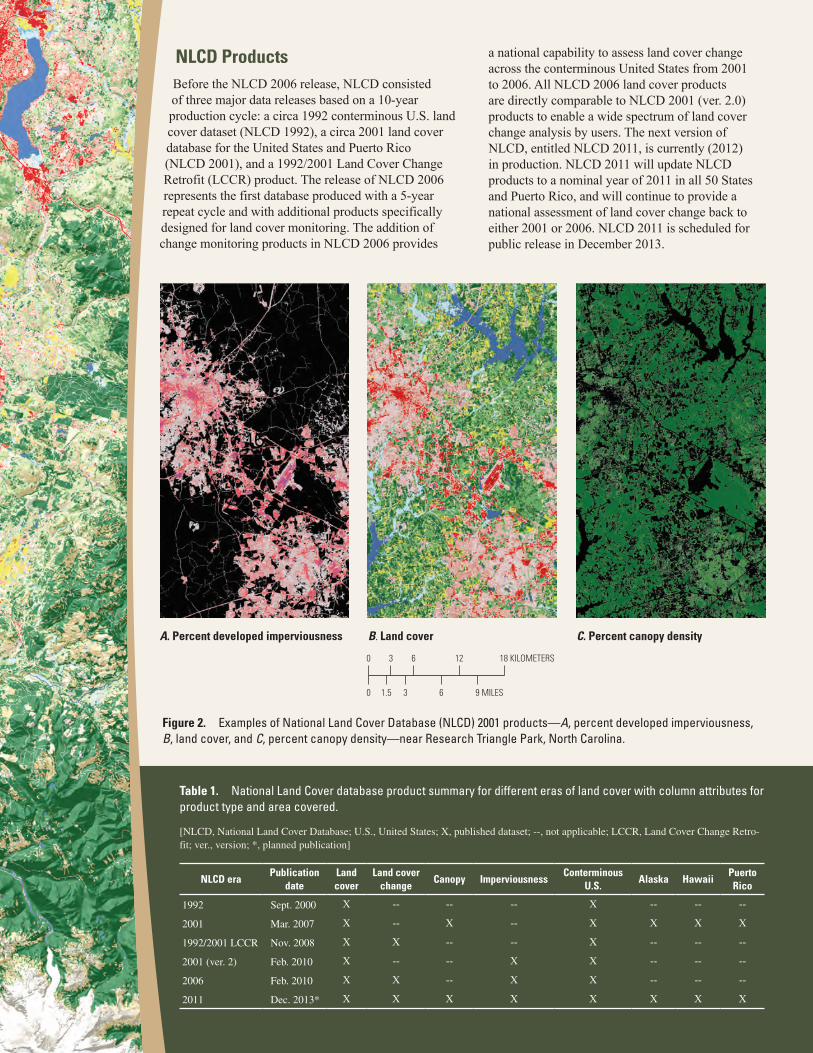
A. Percent developed imperviousness B. Land cover C. Percent canopy density
0 1.5 3 6 9 MILES
0 3 6 12 18 KILOMETERS
Figure 2. Examples of National Land Cover Database (NLCD) 2001 products—A, percent developed imperviousness, B, land cover, and C, percent canopy density—near Research Triangle Park, North Carolina.
Table 1. National Land Cover database product summary for different eras of land cover with column attributes for product type and area covered.
[NLCD, National Land Cover Database; U.S., United States; X, published dataset; --, not applicable; LCCR, Land Cover Change Retro-fit; ver., version; *, planned publication]
NLCD eraPublication
dateLand cover
Land cover change
Canopy ImperviousnessConterminous
U.S.Alaska Hawaii
Puerto Rico
1992 Sept. 2000 X -- -- -- X -- -- --
2001 Mar. 2007 X -- X -- X X X X
1992/2001 LCCR Nov. 2008 X X -- -- X -- -- --
2001 (ver. 2) Feb. 2010 X -- -- X X -- -- --
2006 Feb. 2010 X X -- X X -- -- --
2011 Dec. 2013* X X X X X X X X
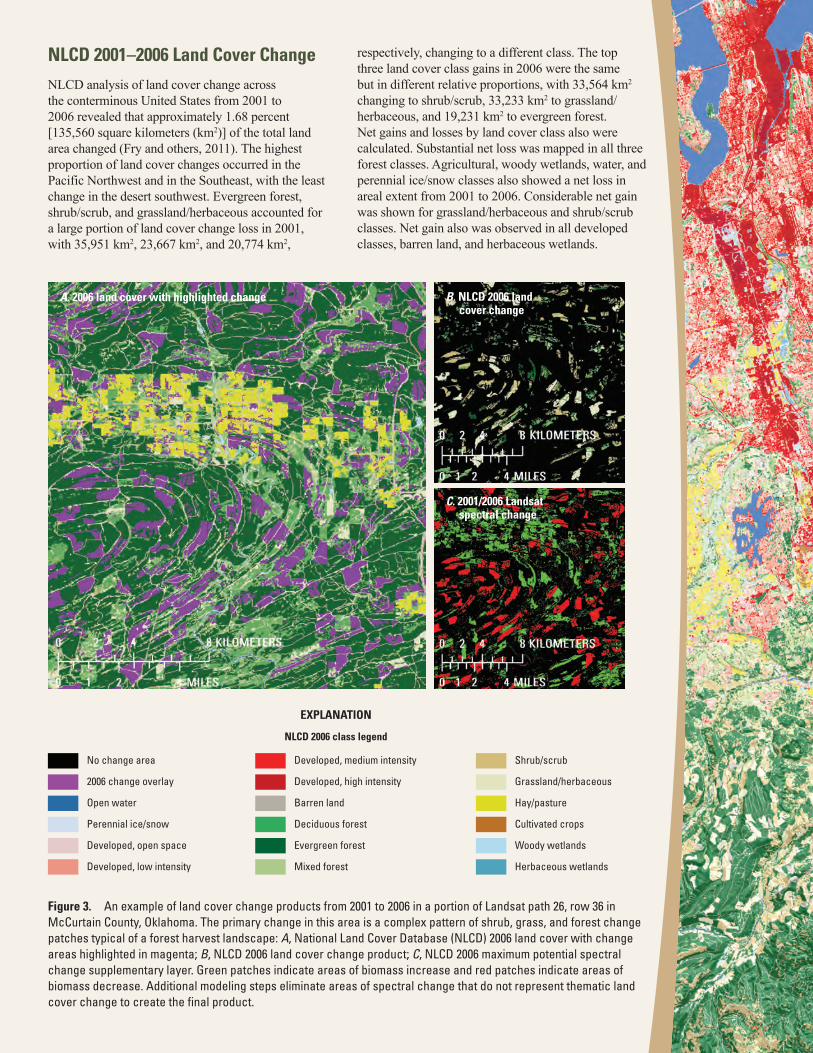
NLCD 2001–2006 Land Cover ChangeNLCD analysis of land cover change across the conterminous United States from 2001 to 2006 revealed that approximately 1.68 percent [135,560 square kilometers (km2)] of the total land area changed (Fry and others, 2011). The highest proportion of land cover changes occurred in the Pacific Northwest and in the Southeast, with the least change in the desert southwest. Evergreen forest, shrub/scrub, and grassland/herbaceous accounted for a large portion of land cover change loss in 2001, with 35,951 km2, 23,667 km2, and 20,774 km2,
respectively, changing to a different class. The top three land cover class gains in 2006 were the same but in different relative proportions, with 33,564 km2 changing to shrub/scrub, 33,233 km2 to grassland/herbaceous, and 19,231 km2 to evergreen forest. Net gains and losses by land cover class also were calculated. Substantial net loss was mapped in all three forest classes. Agricultural, woody wetlands, water, and perennial ice/snow classes also showed a net loss in areal extent from 2001 to 2006. Considerable net gain was shown for grassland/herbaceous and shrub/scrub classes. Net gain also was observed in all developed classes, barren land, and herbaceous wetlands.
A. 2006 land cover with highlighted change B. NLCD 2006 land cover change
C. 2001/2006 Landsat spectral change
EXPLANATION
NLCD 2006 class legend
No change area
2006 change overlay
Open water
Perennial ice/snow
Developed, open space
Developed, low intensity
Developed, medium intensity
Developed, high intensity
Barren land
Deciduous forest
Evergreen forest
Mixed forest
Shrub/scrub
Grassland/herbaceous
Hay/pasture
Cultivated crops
Woody wetlands
Herbaceous wetlands
Figure 3. An example of land cover change products from 2001 to 2006 in a portion of Landsat path 26, row 36 in McCurtain County, Oklahoma. The primary change in this area is a complex pattern of shrub, grass, and forest change patches typical of a forest harvest landscape: A, National Land Cover Database (NLCD) 2006 land cover with change areas highlighted in magenta; B, NLCD 2006 land cover change product; C, NLCD 2006 maximum potential spectral change supplementary layer. Green patches indicate areas of biomass increase and red patches indicate areas of biomass decrease. Additional modeling steps eliminate areas of spectral change that do not represent thematic land cover change to create the final product.
Land Cover Accuracy AssessmentLarge complex national databases such as NLCD are most accurate when used to support regional and national analysis rather than local applications. NLCD strives to conduct formal accuracy assessments to provide users feedback on product accuracy. Users need to know that product accuracy can vary by regional geography and specific class type. Rigorous thematic land cover product accuracy assessments have been completed for NLCD 1992 and 2001 (Stehman and others, 2003; Wickham and others, 2004; Wickham and others, 2010), with a similar assessment in progress (2012) for NLCD 2006. Results of land cover product accuracy assessments have indicated that NLCD 1992 has an overall Anderson Level I (Anderson and others, 1976) class accuracy of 80.4 percent and an Anderson Level II class accuracy of 55.7 percent (Stehman and others, 2003; Wickham and others, 2004). For the conterminous United States, NLCD 2001 has an improved Anderson Level I class accuracy of 85.3 percent and an Anderson Level II class accuracy of 78.7 percent (Wickham and others, 2010). For the NLCD 2001 Alaska land cover classification, the overall thematic accuracy was 83.9 percent at Anderson Level I and 76.2 percent at Anderson Level II (Selkowitz and Stehman, 2011).
Land Cover ApplicationsNLCD supports thousands of applications in the private, public, and academic sectors, and offers the only national database portraying land cover change spatially as a comprehensive “wall-to-wall” 30-meter cell database. The broad spectrum of programmatic and user support for NLCD stems from this complete national spatial coverage. NLCD is used for a vast array of topical applications such as the assessment of ecosystem status and health, understanding spatial patterns of biodiversity, understanding climate change, and developing land management policy. It is a critical data layer in national assessments of biological carbon sequestration, water-quality monitoring, wildfire monitoring and modeling, and biodiversity conservation efforts.
NLCD data can be accessed through the Internet in two different ways. Large regional and national files can be downloaded from the MRLC Web site (http://www.mrlc.gov), or user specified areas can be viewed and downloaded using The National Map Viewer tools (http://www.nationalmap.gov). Additional MRLC and NLCD programmatic information is available on the MRLC Web site.
Future DirectionsNLCD strives to be the future primary land change monitoring “wall-to-wall” database for the United States, capable of delivering critical data for understanding the locations, magnitudes, and effects of land cover change. NLCD products will likely remain on a 5-year product cycle (initial planning for NLCD 2016 is already underway), with future product cycles determined by new requirements, remote sensing data availability, technological improvements, and funding. Ongoing NLCD research will continue to assess and characterize land change monitoring patterns, explore the addition of new products and analyses into NLCD (such as percent shrub and
percent bare ground), and provide new delivery, visualization, and analysis tools to improve product understanding and user access.
Selected ReferencesAnderson, J.R., Hardy, E.E., Roach, J.T., and Witmer, R.E., 1976, A
land use and land cover classification system for use with remote sensor data: U.S. Geological Survey Professional Paper 964, 28 p.
Fry, J., Coan, M., Homer, C., Meyer, D., and Wickham, J., 2009, Completion of the National Land Cover Database (NLCD) 1992–2001 land cover change retrofit product: U.S. Geological Survey Open-File Report 2008–1379, 18 p.
Fry, J., Xian, G., Jin, S., Dewitz, J., Homer, C., Yang, L., Barnes, C., Herold, N., and Wickham, J., 2011, Completion of the 2006 National Land Cover Database for the conterminous United States: Photogrammetric Engineering and Remote Sensing, v. 77, no. 9, p. 858–864.
Homer, C.G., Dewitz, J., Fry, J., Coan, M., Hossain, N., Larson, C., Herold, N., McKerrow, A., VanDriel, J.N., and Wickham, J., 2007, Completion of the 2001 National Land Cover Database for the conterminous United States: Photogrammetric Engineering and Remote Sensing, v. 73, no. 4, p. 337–341.
Selkowitz, D.J., and Stehman, S.V., 2011, Thematic accuracy of the National Land Cover Database (NLCD) 2001 land cover for Alaska: Remote Sensing of Environment, v. 115, no. 6, p. 1401–1407.
Stehman, S.V., Wickham, J.D., Smith, J.H., and Yang, L., 2003, Thematic accuracy of the 1992 National Land-Cover Data (NLCD) for the eastern United States—Statistical methodology and regional results: Remote Sensing of Environment, v. 86, no. 4, p. 500–516.
Vogelmann, J.E., Howard, S.M., Yang, L., Larson, C.R., Wylie, B.K., and VanDriel, N.J., 2001, Completion of the 1990’s National Land Cover Data Set for the conterminous United States from Landsat Thematic Mapper data and ancillary data sources: Photogrammetric Engineering and Remote Sensing, v. 67, no. 6, p. 650–662.
Wickham, J.D., Stehman, S.V., Smith, J.H., and Yang, L., 2004, Thematic accuracy of MRLC-NLCD land cover for the western United States: Remote Sensing of Environment, v. 91, no. 3–4, p. 452–468.
Wickham, J.D., Stehman, S.V., Fry, J.A., Smith, J.H., and Homer, C.G., 2010, Thematic accuracy of the NLCD 2001 land cover for the conterminous United States: Remote Sensing of Environment, v. 114, no. 6, p. 1286–1296.
Xian, G., Homer, C., Dewitz, J., Fry, J., Hossain, N., and Wickham, J., 2011, The change of impervious surface area between 2001 and 2006 in the conterminous United States: Photogrammetric Engineering and Remote Sensing, v. 77, no. 8, p. 758–762.
General information about the Multi-Resolution Land Characteristics Consortium and the National Land Cover Database is available online at http://www.mrlc.gov/.
For more specific NLCD project information
Collin HomerU.S. Geological SurveyEarth Resources Observation and Science (EROS) CenterSioux Falls, SD [email protected]
Joyce FryU.S. Geological SurveyEarth Resources Observation and Science (EROS) CenterSioux Falls, SD [email protected]