Embed Size (px)
Citation preview

ED 357 249
AUTHORTITLE
INSTITUTION
SPONS AGENCYPUB DATECONTRACTNOTE
PUB TYPE
EDRS PRICEDESCRIPTORS
IDENTIFIERS
ABSTRACT
DOCUMENT RESUME
CE 063 663
Kemple, James J.; And OthersThe National JTPA Study: Site Characteristics andParticipation Patterns.Manpower Demonstration Research Corp., New York,N.Y.
Department of Labor, Washington, D.C.Mar 9399-6-3356-77-061-01324p.; For a related report, see CE 063 688; for itsexecutive summary, see ED 346 307.Reports Research/Technical (143)
MFO1 /PC13 Plus Postage.Adult Basic Education; *Disadvantaged; *EmploymentPrograms; Evaluation Methods; *Federal Programs;Followup Studies; *J &; Training; Outcomes ofEducation; Postseconuary Education; *ProgramEffectiveness; *Program Evaluation; ResearchMethodology*Job Training Partnership Act 1982
One part of a study of the difference that servicesunder Title IIA of the National Job Training Partnership Act (JTPA)make in the employment, earnings, and welfare receipt of adults andout-of-school youths served by the program focused on the following:recruiting sites, monitoring the implementation of the researchdesign, and describing and analyzing the characteristics of the localprograms in the study and participation in JTPA services. A review ofthe 16 sites selected led to several basic findings: (1) the 16sites, as a group, resemble the national average for all JTPAprograms; (2) these sites successfully implemented a complex researchdesign, randomly assigning more than 20,000 applicants to treatmentand control groups and using one of three service strategies for eachperson randomly assigned; (3) the service strategies recommended(classroom training, on-the-job training, job search assistance, andsubsidized employment) were implemented in most cases and will beevaluated in the 18-month impact report; (4) there were differencesin the types of services in which the four target groups--adult men,adult women, male out-of-school youths, and female out-of-schoolyouths--enrolled; (5) there were further differences among keysubgroups (males were more likely to enroll in on-the-job trainingand job search assistance whereas females had higher rates ofenrollment in classroom training; Black and Hispanic adults were morelikely than Whites to enroll in classroom training and job searchhelp and less likely to enroll in on-the-job training; White youthswere more likel: than Blacks to enroll in on-the job training); and(6) site administrative practices (private industry council role,performance-based contracts), success in exceeding performancestandards, service emphasis, and patterns of enrollment for treatmentgroup members varied considerably from site to site. (The reportincludes a list of 20 references; 66 tables; and appendixes thatinclude profiles of the sites studied, supplementary tables, and datasources for the report.) (KC)

A
7
The NatiotialJTPA Study:Site Characteristics
Participationerns
a
James J. KempleFred DoolittleJohn W. Wallace
\larch 1993
NianpoNcr DemonstrationResearch t orporation
"PERMISSION TO REPRODUCE ''HISMATERIAL HAS BEEN GRANTEL
TO THE EDUCATIONAL RESOURCESINFORMATION CENTER (ERIC)."
Y
NOV 'VIII r

BOARD OF DIRECTORS
RICHARD P. NATHAN, ChairmanProvost, Rockefeller CollegeState University of New YorkDirector, Rockefeller Institute
of Government
BERNARD E. ANDERSON, Vice ChairmanPresidentThe Anderson Group
PAUL H. O'NFIT T., TreasurerChairman and CEOAlcoa
ELI GINZBERG, Chairman EmeritusDirectorThe Eisenhower Center for the
Conservation of Human ResourcesColumbia University
ANTONIA HERNANDEZPresident and General CounselMexican American Legal Defense and
Educational Fund
ALAN KISTLERPresidentHuman Resources Development InstituteAFL-CIO
RUDOLPH G. PENNERDirector of Economic StudiesPolicy Economics GroupKPMG Peat Marwick
ISABEL V. SAWHILLSenior FellowThe Urban Institute
ROBERT SOLOWinstitute ProfessorMassachusetts institute of Technology
GILBERT STEINERS,:lior Fellow
-snkings Institution
MITCHELL SVIRIDOFFProfessor Emeritus and Senior F.:.1lowCommunity Development Research CenterNew School for Social Research
WILLIAM S. WOODSIDEChairman, Sky Chefs, Inc.Former Chairman and CEO,
Primerica Corporation
JUDITH M. GUERONPresidentManpower Demonstration Research Corporation
3
MDRC

THE NATIONAL ]TPA STUDY:SITE CHARACTERISTICS
AND PARTICIPATION PATTERNS
James J. KempleFred Doolittle
John W. Wallace
Manpower DemonstrationResearch Corporation
March 1993
1
c E-
J

The National JTPA Study is funded by the U.S. Department of labor. This report wasprepared for the department under Contract No. 99-6-3356-77-06141.
Publication and dissemination of this report are supported by ourPublic Policy Outreach funders:
The Ford FoundationThe Ambrose Monell FoundationAlcoa Foundation
The findings and conclusions in this report do not necessarily represent the official positionsor policies of the funders.
Usury or Conran Catalogiag-ba-Publicatias Data
Kemple, James J.The National JTPA Study: Site Chars leristics and Participation Patterns/James J. Kemple, Fred
Doolittle, John W. Wallace.p. cm.
Includes bibbographical references.1. Occupational training Government policy United States.2. United States Job Training Partnership Act. L Doolittle, Fred C. U. Wallace, John W. III.
Manpower Demonstration Research Corporation. IV. Tale.HD5715.2K45 1;92331.25'92'0973 tic20 92-45=
CIP
Copyright C 1993 by the Manpower Demonstration Research Corporation

THE NATIONAL JTPA STI/RX
This report is part of the National JTPA Study, funded by the U.S. Department of Labor
(DOL) under Contract Numbers 99-6-3356-77-061-01 and 99-6-0803-77-068-01. Because of the
complexity of the project, DOL chose to divide it into two parts, issue a Request for Proposals
for each, and award separate competitively bid contracts. For the rust part of the study, labeled
Part A, DOL chose the Manpower Demonstration Research Corporation (MDRC), with Abt
Associates Inc. as a subcontractor, to recruit sites, implement the study in the field, and describe
the nature and cost of the services offered by the participating local programs. For Part B, DOL
selected Abt As&.nciates Inc., with ICF, MDRC, New York University, and National Opinion
Research Center (NORC) as subcontractors, to develop the research design, collect baseline and
follow-up data on the members of the research sample, and conduct experimental and
nonexperimental. research on program impacts.
The lead analysts on the study are as follows:
PRINCIPAL INVESTIGATORS
Howard S. Bloom, New York UniversityJudith M. Gueron, MDRC
Larry L Orr, Abt Associates Inc.
PART A
Fred Doolittle, MDRC, Part A Project DirectorJames J. Kemple, MDRC
Linda Traeger, MDRCJohn W. Wallace, MDRC
PART B
Larry L Orr, Abt Associates Inc., Part B Project Director
Experimental Impact Analysis
Stephen H. Bell, Abt Associates Inc.Howard S. Bloom, New York University
George Cave, MDRC
Nonexperimental Analysis
Burt Barnow, ICFJames J. Heckman, University of Chicago
iii
6

This is the second report under the Part A contract. Other reports from the National
JTPA Study are:
Howard S. Bloom, Larry L Orr, George Cave, Stephen H. Bell, and Fred Doolittle.1993. The National JTPA Study: Title II -A Impacts on Earnings and Employment at18 Months. Bethesda, Md.: Abt Associates Inc.
Howard S. Bloom, Larry L Orr, Fred Doolittle, Joseph Hotz, and Burt Barnow.1990. Design of the National JTPA Study. New York and Bethesda, Md.: MDRC andAbt Associates Inc.
Fred Doolittle and Linda Traeger. 1990. Implementing the National JTPA Study.New York: MDRC.
Howard S. Bloom. 1991. The National JTPA Study: Baseline Characteristics of theExperimental Sample. Bethesda, Md.: Abt Associates Inc.
Fred Doolittle, with Steve Bell, Howard Bloom, George Cave, James Kemple, LarryOrr, Linda Traeger, and John Wallace. Forthcoming, 1993. A Summary of the Designand Implementation of the National JTPA Study.

ACKNOWLEDGMENTS
This report rests on the work of many people over the six years since the National JTPA
Study began. Our most immediate debt is to our colleagues at MDRC and the other
organizations involved in the study.
At MDRC, Michael Bangser was the original manager of Part A of the study, and Judith
Gueron and Robert Ivry were the senior reviewers of the report and provided guidance
throughout the project. Others also reviewed drafts including George Cave, Milton Little, and
Linda Traeger. The report relies on the analysis of data from many sources, an effort that
involved people from several MDRC departments. Within the. research department, Bridget
Dixon, Rachel Woolley, James Sparrow, Robert Winthrop, and Michel Broudo played a central
role in collecting and processing data for the report. In the operations department, James Healy,
Hilary Kopp, Emma Pemberton, and Linda Traeger provided background on sites. In
information services, Darlene Hasselbring and Karen Paget were involved in many aspects of the
project from its outset, while Lynn Deg lin, Joel Gordon, Debbie Romm, Pam Green, Quadii
McMillan, and Meir Strauss played a central role in monitoring random-assignment procedures
and processing administrative records received from participating sites. Suzanne Wagner, Sylvia
Newman, and Judith Greissman edited this report. Word processing was done by Patt
Pontevolpe, Claudette Edwards, Stephanie Cowell, and Pam Miles.
Our colleagues from other organizations working on this study also provided valued counsel,
especially Larry Orr, Steve Bell, and Michelle Wood of Abt Associates Inc.; Hrward Bloom of
New York University; Burt Barrow of ICF; and James Heckman of the University of Chicago.
Staff at the U.S. Department of Labor provided strong and continuing support for our
work. We especially wish to thank Ray Uhalde, John Heinberg, David Lah, Karen Green, and
Dan Ryan for their assistance. The members of the Technical Advisory Panel for the National
JTPA Study also provided guidance at crucial points in the project.
Our final note of thanks goes to the individuals whose efforts made the entire study, not
just this report, possible. The directors and staff at the 16 participating JTPA service delivery
areas in many ways had the most complex and demanding role of all. They were pioneers in a
pathbreaking project, and the entire employment and training system owes them much for their
efforts. We wish to close by thanking by name each agency director and study coordinator, and

by implication the many people working with them in these SDAs and at their service providers.
The list includes all those who held the designated positions during the course of the study:
EagButte, Mont.
Cedar Rapids, Iowa
Coosa Valley, Ga.
Corpus Christi, Tex.
Decatur, DI.
Fort Wayne, Ind.
Heartland, Fla.
Jackson, Miss.
Jersey Qty, NJ.
Larimer County, Cob.
Marion, Ohio
Northwest Minnesota
Oakland, Calif.
Omaha, Neb.
Providence, R.I.
Springfield, Mo.
SDA/PIC DIRECTOR(S)
Sue Mohr
Robert Ballantyne
C. D. Ramp leyJames H. Layton
Irma CaballeroDeborah Seeger
John Roark
Steve Corona
Clifton Thomas, Jr.Jack Lyons
Beneta BurtArchester Hampton
Jerry Del PianoWilliam Colon
Neil Gluckman
Samantha CarrollPatrick PowellJill Navarrette
Gail Butenhoff
Susan CaldwellGay Plair-Cobb
Fernando Lecuona IIIOla M. Anderson
Ronald Peri HoRobert PalumboWilliam D. Fomicola
Chet Dixon
vi
9
STUDY COORDINATOR(S)
John IlgenfritzCandi Watts
Bonnie Pisarik
Gwen DellingerAngeline Bedwell
Billie O'Dowdy
Jacque Matson
Betty Loll Nault
Alice Cobb
Archester Hampton
Judith MartinKeith Davis
Joni Friedman
Steven Pyles
Ken Barborak
Edna DavisRalph ZackheimPaulette Cathey
Karen Benson
Bob LonardoEd Canner
Mary Schaeffer
The Authors

PREFACE
Policymakers have long sought credible estimatez of the difference federally fundedemployment and training programs make in the employment, earnings, and welfare receipt of those
they serve. This has proven to be an elusive goal, with problems of research methodology plaguingmany past efforts to estimate program effects.
In 1986, the U.S. Department of Labor, following the recommendations of an advisory panel,
adopted an unusual approach: a study of the impacts of programs funded under the Job TrainingPartnership Act (JTPA), using random assignment, the classical experimental method. The National
JTPA Study is now producing findings on the services provided by a diverse group of 16 local service
delivery areas (SDAs) and the impacts these local JTPA programs have on the employment and
earnings of these they serve. The findings are being issued at an important time, just as amendmentsto JTPA are about to be implemented and interest grows in training and building the quality of theworkforce.
This report addresses three topics. First, it explains how the research design that wasdeveloped to study program impacts was implemented in the participating SDAs information vitalto interpreting the results from the study.
Second, it describes the types of services, such as on-the-job and classroom training, thatindividuals in the study received from JTPA-funded local programs. Service receipt is important
because it could be a major influence on program impacts. However, the report goes further,exploring in some detail how service receipt varied among different subgroups within the overallresearch sample youths and adult men and women. In doing so, it illuminates a topic ofconsiderable public debate in recent years: how JTPA services are allocated among various groups
that are eligible for the program.
Finally, the report explores whether differences among study SDAs in the services theyprovide and their treatment of different groups are associated with particular characteristics of theSDAs. It discusses several hypotheses about how labor market conditions, the role of the private
sector in administration, the sites' success in meeting JTPA performance standards, and other factors
affected the services provided to applicants.
Initial findings are presented in this and the 18-month impact report that has been produced
from the study. Further volumes will provide longer-term estimates of program impacts, based on
30 months of follow-up, and an analysis of the benefits and costs produced by the local JTPAprograms. Collectively, the reports in the National JTPA Study should provide the type of solidinformation on program effectiveness that has been missing from much of the debate on federallyfunded employment and training programs.
Judith M. GueronPresident
vii
1 ()

CONTENTS
PAGE
THE NATIONAL JTPA STUDY iiiACKNOWLEDGMENTSPREFACE viiTABLES AND FIGURES xiABBREVIATIONS xviiiEXECUTIVE SUMMARY xix
CHAPTER
1 INTRODUCTION 1
I. An Overview of the Title II-A JTPA System 3II. An Overview of the National JTPA Study 7III. The Structure of the Study and
the Content of Its Reports 11IV. The Purpose and Organization of This Report 12
2 THE STUDY SITES AND THE SAMPLE 15
I. The 16 Study Sites 17IL The Sample for This Report 37
3 BALANCING RESEARCH GOALS AND THEREALITY OF JTPA PROGRAMS 45
I. The Goals of the National JTPA Study 45II. Client Flow and Study Procedures 46
4 KEY POLICY QUESTIONS AND THE RESULTING STUDY DESIGN 60
I. Choosing the Random-Assignment Design 60II. Providing Alternative Program
Impact Estimates 64III. Defining Understandable and
Operationally Relevant Service Strategies 67
5 SERVICES RECEIVED BY ADULT ENROLLEES 78
I. Service Receipt in theFive Service Categories 30
II. The Length of Enrollment for Adults 96
ix

SERVICES RECEIVED BY OUT-OF-SCHOOL YOUTH ENROI FFq
PAGE
103
L Service Receipt in theFive Service Categories 104
H. The Length of Enrollmentfor Out-of-School Youths 120
7 VARIATIONS ACROSS THE SERVICE DELIVERY AREAS 126
L An Overview of the Findings 130
IL Variation in Service Strategy Recommendations,Population Served, and Services Received 132
IIL The Relationship Between SDA Characteristicsand Service Emphasis and Population Served 144
APPENDICES
Appendix A. Profiles of the Service Delivery Areas in theNational JTPA Study 165
Appendix B. Supplemental Tables toChapters 4, 5, and 6 191
Appendix C. Data Sources for This Report 239
REFERENCES 243
SELECTED MDRC PUBLICATIONS 245
x1

TABLES AND FIGURES
TABLE .PAGE
1 Sites in the National JTPA Study uv
2 Enrollment Rates for Treatment Group Members,Sy Target Group and Service Strategy
3 Key Services for Enrollees,by Target Group and Service Strategy xxxi
4 Service Receipt Rates for Adult and Out-of-SchoolYouth Enrollees, by Selected Baseline Characteristics miv
2.1 Key Facts About the National JTPA Study Sites 18
2.2 Local population and Economic Characteristics, by Site 21
2.3 Organizational Structure of the SDAs Participatingin the National JTPA Study, by Site 24
2.4 Major Types of Service Providers Used by SitesParticipating in the National JTPA Study,by Selected Program Services 25
2.5 Roles of SDAs and Service Providers at Selected Pointsin the Client Flow, by Site 28
2.6 Level of Use of Performance-Based Contracts AmongSites in the National JTPA Study, for Adults and Youths 30
2.7 Selected Characteristics of JTPA Title II-A Terminees,by Site 31
2.8 Selected Characteristics of JTPA Title II-A TermineesThat Are Obstacles to Employment, by Site 32
2.9 Selected Characteristics of the JTPA Title II-A Programsat the National JTPA Study Sites 34
7.1 1 JTPA Program Outcomes for Adults, by Site 35
2.1: HPA Program Outcomes for Youths, by Site 36
2.12 Percentage Distributions of Selected BaselineCharacteristics of Treatment Group Members,by Target Group
xi
3

TABLEPAGE
2.13 Percentage Distributions of Employment BarrierSubgroups for Treatment Group Members, by Target Group 41
2.14 Percentage Distibutions of Employment BarrierSubgroups for Treatment Group Members,by Selected Baseline Characteristics surd Target Group 42
3.1 Program Services Available in the Three Service Strategies 53
3.2 Percentage Distribution of Post-Random AssignmentActivity in JTPA of Treatment Group MembersWho Did N,lt Enroll 58
4.1 Percentage Distributions of Service StrategyRecommendations and Recommended Program Services,by Target Group 68
4.2 Enrollment Rates for Treatment Group Members,by Service Strategy and Target Group 70
4.3 Key Services for Treatment Group Membersand Enrollees, by Target Group and Service Strategy 71
4.4 Service Receipt Rates for Treatment Group Membersand Enrollees, by Service Strategy 73
4.5 Percentage Distributions of Post-Random AssignmentActivity in JTPA of Treatment Group MembersWho Did Not Enroll, by Service Strategy 76
5.1 Service Receipt Rates for Adult Enrollees,by Selected Baseline Characteristics 81
5.2 Service Receipt Rates for Adult Enrollees,by Employment Barrier Subgroup and Target Group 89
5.3 Service Receipt Rates for Adult Enrollees,by Employment Barrier Subgroup and Ethnicity 92
5.4 Median Length of Enrollment for Adults, by SelectedBaseline Characteristics and Service Receipt 97
6.1 Service Receipt Rates for Out-of-School YouthEnrollees, by Selected Baseline Characteristics 106
6.2 Service Receipt Rates for Out-of-School YouthEnrollees, by Employment Barrier Subgroupand Target Group 113
Al
1 4

TABLE PAGE
6.3 Service Receipt Rates for Out-of-School YouthEnrollees, by Employment Barrier Subgroupand Ethnicity 116
6.4 Median Length of Enrollment for Out-of-School Youths,by Selected Baseline Characteristics and Service Receipt 121
'7.1 Percentage Distributions of Service StrategyRecommendations for Adult and Youth Treatment Group Members,by Site, in Order of Highest to Lowest PercentageRecommended for OJT/JSA 133
7.2 Percentage of Adult Treatment Group Membersin Employment Barrier Subgroups and Their EnrollmentRates, by Site, in Order of Highest to Lowest EnrollmentRate Difference 136
7.3 Percentage of Youth Treatment Group Membersin Employment Barrier Subgroups and Their EnrollmentRates, by Site, in Order of Highest to Lowest EnrollmentRate Difference 138
7.4 Service Receipt Rates for Adult and Youth Enrollees, by Site,in Order of Highest to Lowest Percentage Receiving OJT 142
73 Percentage Distributions of Service StrategyRecommendations for Adult and Youth Treatment Group Members,by Site Achievement of the JTPA Performance Standardfor Entered Employment 148
7.6 Percentage Distributions of Service StrategyRecommendations for Youth Treatment Group Members,by Site Achievement of the JTPA Performance Standardfor Youth Positive Terminations 149
7.7 Percentage Distributions of Service StrategyRecommendations for Adult and Youth TreatmentGroup Members, by SDA Organizational Structure 152
7.8 Percentage of Adult and Youth Treatment Group Membersin Employment Barrier Subgroups and Their EnrollmentRates, by Site Achievement of the JTPA PerformanceStandards for Entered Employment and Youth PositiveTerminations 154
7.9 Percentage of Adult and Youth Treatment Group Membersin Employment Barrier Subgroups and Their Enrollment Rates,by SDA Organizational Structure 157

TABLE PAGE
7.10 Percentage of Adult and Youth Treatment Group Membersin Employment Barrie: Subgroups and Their Enrollment Rates,by Site Level of Use of Performance-Based Contracts 160
B.1 Percentage Distributions of Service StrategyRecommendations for Adult Male Treatment Group Members,by Selected Baseline Characteristics 192
B.2 Percentage Distributions of Service StrategyRecommendations for Adult Female Treatment Group Members,by Selected Baseline Characteristics 194
B3 Percentage Distributions of Service StrategyRecommendations for Male Youth Treatment Group Members,by Selected Baseline Characteristics 196
B.4 Percentage Distributions of Service StrategyRecommendations for Female Youth Treatment Group Members,by Selected Baseline Characteristics 198
B.5 Enrollment Rates for Adult Male Treatment GroupMembers, by Selected Baseline Characteristics andService Strategy 200
B.6 Enrollment Rates for Adult Female Treatment GroupMembers, by Selected Baseline Characteristics andService Strategy 202
B.7 Enrollment Rates for Male Youth Treatment GroupMembers, by Selected Baseline Characteristics andService Strategy 204
B.8 Enrollment Rates for Female Youth Treatment GroupMembers, by Selected Baseline Characteristics andService Strategy 206
B.9 Service Receipt Rates for Adult Enrollees, by Numberand Type of Services Received and by Target Group 208
B.10 Service Receipt Rates for Out-of-School Youth Enrollees,by Number and Type of Services Received and by Target Group 209
B.11 Service Receipt Rates for Adult Male Enrollees,by Selected Baseline Characteristics 210
B.12 Service Receipt Rates for Adult Female Enrollees,by Selected Baseline Characteristics 212
xiv
16

r
TABLE PAGE
B.13 Service Receipt Rates for Male Youth Enrollees,by Selected raseline Characteristics 214
B.14 Service Receipt Rates for Female Youth Enrollees,by Selected Baseline Characteristics 216
B.15 Service Receipt Rates for Adult Male Enrollees,by Employment Barrier Subgroup and Ethnicity 218
B.16 Service Receipt Rates for Adult Female Enrollees,by Employment Barrier Subgroup and Ethnicity 220
B.17 Service Receipt Rates for Male Youth Enrollees,by Employment Barrier Subgroup and Ethnicity 222
B.18 Service Receipt Rates for Female Youth Enrollees,by Employment Barrier Subgroup and Ethnicity 224
B.19 Median Length of Enrollment for Male Adults, bySelected Baseline Characteristics and Service Receipt 226
B.20 Median Length of Enrollment for Female Adults, bySelected Baseline Characteristics and Service Receipt 229
B.21 Median Length of Enrollment for Male Youths, bySelected Baseline Characteristics and Service Receipt 232
B.22 Median Length of Enrollment for Female Youths, bySelected Baseline Characteristics and Service Receipt 235
B.23 Enrollment Rates for Control Group Members, by ServiceStrategy and Target Group 238
xv
17

FIGURE PAGE
1 Random Assignment Model for the National JTPA Study viii
2.1 Location of the National JTPA Study Sites 19
3.1 Flow cf Sample Members in the National JTPA Study Sites 47
4.1 Potential Design for Random Assignment to aService Strategy or to ths Control Group(Not Used in the National JTPA Study) 61
4.2 Final Design for Random Assignment FollowingAssessment and Recommendation of a Service Strategy'(Used in the National JTPA Study) 63
7.1 Factors Affecting the Implementation of JTPA Programs 127
xvi
I S

ABBREVIATIONS
ABE adult basic educationAFDC Aid to Families with Dependent ChildrenBE basic educationBIF Background Information FormCETA Comprehensive Employment and Training Act (1973)CT classroom trainingCT-OS classroom training in occupational skillsDOL U.S. Department of LaborESL English as a second languageGED General Educational Development ceriffication (high school equivalency)JASR JTPA Annual Status ReportJSA job search assistanceMS Job Training Longitudinal SurveyJTPA Job Training Partnership Act (1982)JTQS Job Training Quarterly SurveyMDRC Manpower Demonstration Research CorporationMIS management information systemNOItC National Opinion Research CenterOJT on-the-job trainingOMB Office of Management and BudgetPIC private industry councilRFP Request for ProposalsSDA service delivery areaWIN Work Incentive Program

FXECUTIVE SUMMARY
The Job Training Partnership Act of 1982 (JTPA) funds the major federal program
providing job training and other employment-related services for economically disadvantaged
individuals. The act established more than 600 local service delivery areas (SDAs), which play
a central role in designing and delivering services under Title II-A, the main title of the JTPA
legislation. As part of the move toward greater accountability in the funding of social
programs, JTPA calls for a system of state-administered performance standards for local
programs, and for monitoring of program operations, with the goal of determining the
program's success in increasing the employment and earnings and reducing the welfare receipt
of the people it serves.
The National JTPA Study is the Department of Labor's (DOL's) major effort to assess
the impacts and cost-effectiveness for adults and out-of-school youths of programs funded under
Title 11-A in a diverse sample of 16 SDAs across the country. Following the recommendations
of a technical advisory panci established to assist in studying JTPA's impacts, DOL chose to
conduct a field experiment in which JTPA applicants whom local staff judged eligible and
appropriate for the program were randomly assigned to a treatment (or program) group, which
was given access to JTPA-funded services, or a control group, which was not. DOL chose this
approach, despite the challenges it would present, because of the inability of past non-random-
assignment impact studies to provide credible estimates of program impacts. This is the first
random-assignment impact study of local programs in .an ongoing, national system of
employment and training services that serves primarily volunteers.
The National JTPA Study has two major parts, which were awarded as separate,
competitively bid contracts. Under one contract, the Manpower Der onstration Research
Corporation (MDRC) - with Abt Associates Inc. as a subcontractor recruited sites,
monitored the implementation of the research design, and described and analyzed the
characteristics of the local programs in the study and participation in JTPA services, a task
completed in this report. Under a second contract, Abt Associates Inc. with ICF, MDRC,
New York University, and National Opinion Research Center (NORC) as subcontractors
collects baseline and follow-up information on those randomly assigned and conducts the impact
and benefit-cost analysis, while also using the framework of an experiment to search for better
xix
21)

alternative methods for estimating program impacts. The first impact report analyzes the
interim impact findings based on 18 months of post-random-assignment follow-up,1 and a later
report will present 30-month impact findings.
A Preview of the Findings
Several basic findings emerge from this report. The first three relate to the overall study
and sample and the last two concern differences among groups within the overall sample or
among study sites. First, on many counts, the 16 study sites, as a group, resemble the national
average for all JTPA programs; they include much of the diversity of the national system
flespite the fact that they were not selected randomly from all SDAs. Second, these sites
successfully implemented a complex research design, randomly assigning more than 20,000
applicants to treatment and control groups. As part of this design, local site staff designated
one of three service strategies for each person randomly assigned. Third, although not all
treatment group members enrolled in the services recommended for them, these service strategy
recommendations proved to have clear links to the types of services in which members of the
treatment group actually enrolled. Thus, treatment group members recommended for the
classroom training service strategy received services with a strong classroom focus, while most
of those who were recommended for the on-the-job-training/job search assistance (OTT/JSA)
service strategy, and who enrolled in JTPA, were active in services designed to find them an
OJT (subsidized) position or regular employment. (All of those in the OJT/JSA group had
been recommended for OJT in case that were to prove necessary as a bridge to regular
employment.) The third strategy by design, a mixture of services emphasized specific
services for adults and youths, as discussed later in this summary. Because these initial
recommendations translated into distinct emphases in program services, the separate impact
estimates for the individuals recommended for these three strategies (presented in the 18-
month impact report) have an operational meaning for local programs.
Fourth, there were differences in the types of services in which the four target groups
in the study (adult men, adult women, male out-of-school youths, and female out-of-school
1See Howard S. Bloom, Larry L Ott, George Cave, Stephen H. Bell, and Fred Doolittle, TheNational ITPA Study: Title II -A Impacts on Earnings and Employment at 18 Months (Bethesda, Md.:Abt Associat1/41 Inc., 1993).
U

youths) enrolled and further differences among other key subgroups. In general, both male
adults and male youths were more likely to enroll in OJT and job search assistance than their
female counterparts, who had higher rates of enrollment in classroom training in occupational
skills (CT-OS). Among adults, blacks and Hispanics were more likely than whites to enroll in
CT-OS and less likely to enroll in OJT; among youths, the only consistent difference was that
whites were more likely than blacks and Hispanics to enroll in OJT. Some of these differences
are related to the extent that each group tends to have barriers to employment such as low
educational attainment, limited work experience, or welfare receipt. Finally, there is
considerable variation in site administrative practices (e.g., the role of the private industry
council and the use of performance-based contracts), success in exceeding performance
standards, service emphasis, and patterns of enrollment for treatment group members. For
example, sites varied greatly in their emphasis on OTT versus CT-OS and their propensity to
enroll especially disadvantaged applicants. The analysis provides suggestive evidence of the
relationships between these differences and administrative practices or local conditions.
An Overview of the National JTPA Study
The central goal of the study is to understand, in a diverse sample of sites, the difference
that services funded under Title II-A of JTPA make in the employrt,mt, earnings, and welfare
receipt of adults and out-of-school youths served by the program: i.e., the program's impacts.
This information will tell policymakers and program operators how well program participants
fare in the labor market over and above what they would have don; on their own, without
access to the program. Evaluation experts and policymakers have increasingly come to the
conclusion that the most reliable studies of program impacts use random assignment a
process like a drawing or lottery, in which eligible applicants for a program are randomly
assigned to a group to be served (the "treatment" or "program" group) or to a group not given
access to the program (the "control" group). Becausc the two groups are created randomly,
there is no systematic difference between them prior to random assignment, and the labor
market experiences of the control group provide a benchmark against which to compare the
experiences of the treatment group.
In the National JTPA Study, DOL wanted to estimate overall impacts for the Title II-
A JTPA program for adults and out-of-school youths in participating sites and specific impacts
xxi

for other subgroups to the extent that sample sizes allow. In addition; DOL also initially called
for separate impact estimates for individuals recommended for key services such as CT-OS,
Off, and job search. As the study was implemented, three distinct service strategies emerged,
for which separate impact estimates are calculated: (1) training to build skills through
classroom-based services (labeled "classroom training"); (2) subsidized Off (for which all in the
group were recommended) and/or job search assistance to find regular employment (labeled
"OJT/JSA"); and (3) a residual category (labeled "other services"), which could involve various
combinations of other education and employment-related services. This third strategy allowed
the study to include the full range of program services. Finally, DOL wished the study to be
conducted in a manner that would change normal operations as little as possible.
Together, these goals created tensions in the research design. Impact estimates of the
entire JTPA program in participating sites would call for random assignment early in the intake
process to assure that the control group would receive little or no JTPA assistance. However,
the desire to produce impact estimates for specific service strategies and to allow normal staff
decisions on service recommendations would call for random assignment after local staff
assessed the skills, interests, and service needs of applicants, though before actual services
began. And defining service strategies that are clearly distinguished from each other (e.g.,
classroom-based services versus employment-based services) proved a challenge because of the
diversity of local services that could be used singly or in combination.
The resulting research design is shown in Figure 1, which superimposes the special
research procedures on the normal steps by which clients apply for and enroll in JTPA. Local
sites and service providers recruited applicants from among the eligible population in their
community (Step #1 in Figure 1). JTPA funding is typically sufficient to serve about 10
percent or fewer of those eligible, and in the study sites as is the case nationally a
substantial proportion of those who initially inquired about JTPA services never reached the
stage of enrollment in the program. Individuals who pursued the opportunity for JTPA services
completed an application form to establish eligibility (Step #2), participated in an assessment
of their service needs (Step #3), and (in one of the special steps added for the study)
completed an Informed Consent Form and a Background Information Form to provide
information on their pre-random-assignment characteristics (Step #4). Local staff then
recommended specific JTPA services for the applicants (or indicated that JTPA was not
xcdi
?

ST
EP
411 *2 *3
FIG
UR
E 1
RA
ND
OM
AS
SIG
NM
EN
T M
OD
EL
FO
R T
HE
NA
TIO
NA
L JT
PA
ST
UD
Y
(R
ecru
itmen
t
7. IE
ligib
ility
Det
erm
inat
ion
..\. }
1
(A
sses
smen
t)
1114
info
rmed
Con
sent
For
m a
nd13
IF C
ompl
etio
n
I*5
( S
ervi
ceS
trat
egy
Rec
omm
enda
tion
*8 *7
Cla
ssro
om T
rain
ing
Ser
vice
Str
ateg
y
Ran
dom
Ass
ignm
ent
Tre
atm
ent G
roup
2 4
Con
trol
Gro
up(N
ot E
ligib
le fo
rJT
PA
Ser
vice
s)
Oth
er S
ervi
ces
Ser
vice
Str
ateg
y
Tre
atm
ent G
roup
Con
trol
Gro
up(N
ot E
ligib
le fo
rJT
PA
Ser
vice
s)

appropriate) and designated a service strategy for each appropriate client (Step #5), which thestaff were to follow in working to arrange services if the person were randomly assigned to the
treatment group. Within each service strategy, clients were then randomly assigned (Step #6)to a treatment group, whose members were given access to the JTPA-funded services, or toa control group, whose members could not participate in JTPA-funded services for 18 monthsbut who were given a list of other services in the community. Staff then worked withtreatment group members to arrange the recommended services (Step #7) and enroll in JTPAthose for whom they were successful.
Under this design, the overall impact of JTPA services in the participating sites isestimated by combining all three treatment groups and comparing their experiences with those
of a combined control group. The impacts of each of the service strategies for those referred
to these services are estimated by comparing the treatment group within the service strategy with
its control group. However, since different types of clients are recommended for the threeservice strategies, it is not possible to directly compare experimentally the impacts of the service
strategies; since both the services and the initial characteristics of the clients would vary across
the strategies, it is difficult to isolate the difference that the choice of service strategy made.
Findings on the Sites in the Study
On many counts, the 16 study sites as a group are similar to the nationalaverage for all SDAs.
Although the 16 sites listed in Table 1 were not chosen randomly from all SDAs in the
country, their economic and labor market conditions, poverty rates, client characteristics, andperformance as measured by DOL standards are similar to the national average for all SDAsduring the late 1980s, when random assignment was under way. For example, the averages for
the study sites and for all SDAs nationally were virtually the same for poverty rates (about 10
percent), unemployment during the period of random assignment (6.6 percent), and per capitaannual earnings of workers in the SDA ($18,100). Of the people served by the study sites andall SDAs nationally, about 60 percent were white, slightly more than 25 percent were black,
and 10 percent were Hispanic. The average percentage of those served in the study sites who
had one of a variety of obstacles to employment e.g., low educational attainment, receipt of
xxiv
2 6

Aid to Families with Dependent Children (AFDC), or limited work experience was similar
to the average percentage of those with these barriers in all SDAs.
TABLE 1
SITES IN THE NATIONAL JTPA STUDY
Butte, Mont. Jersey City, NJ.
Cedar Rapids, Iowa Latimer County, Cob.
Coosa Valley, Ga. Marion, Ohio
Corpus Christi, Tex. Northwest Minnesota
Decatur, Ill. Oakland, Calif.
Fort Wayne, Ind. Omaha, Neb.
Heartland, Fla. Providence, R.I.
Jackson, Miss. Springfield, Mo.
Summary measures of program operation also show strong similarities. Average lengths
of JTPA enrollment for the study sites and all sites nationally were within a week of each
other, though average program costs per adult served in the study sites were 6 percent above
those for all sites. Importantly, on key JTPA performance measures, the study sites exceeded
their standard by about the same (or a slightly smaller) percentage all SDAs nationally. For
Wimple, study sites exceeded their adult job placement standard by an average of 6 percentage
points in program year 1988 (the year when the bulk of the sample was enrolled) compared
with 7 percentage points for all sites nationally. Thus, the sites as a group are neither at the
high nor low end of the performance "scale."
Behind these averages, however, there is great variation in the sites' local conditions,
clients, program design, administrative practices, and performance, as is the case nationally.
The sites include some with low unemployment and strong economic growth and some in
declining areas; sites in large metropolitan areas and sites that are enti-ely rural; and ethnic
mixtures that range from virtually all black and/or Hispanic to almost entirely white. During
the late 1980s, the average length of JTPA enrollment in the study sites ranged from less than
two months to nearly eight months for adults, and slightly more than one month to nearly eight
months for youths. On performance standards, there was equally wide variation: some sites
greatly exceeded their standards, while others failed to meet them. Again, this suggests that
while the study sites are not representative in the statistical sense, they do include much of the
xxv

1
diversity of the national JTPA system. The major exception is that they do not include any
of the nation's largest cities.
Findings on the Implementation of Random Assignment,
The 16 sites successfully implemented a complex research design, with morethan 20,000 individuals randomly assigned over a 23-month period.
Normally, successful implementation of a research design does not qualify as a majorfinding. The National JTPA Study, however, is among the most complex undertaken in theemployment and training field, and successful implementation of study procedures by sites was
not a certainty. The 16 sites randomly assigned 20,601 individuals between November 1987 and
September 1989. The sample analyzed in this report and the 18-month impact report includes
17,031 individuals randomly assigned before July 1989.
Virtually none of the control group participated in the JTPA program in the study sites.
Site staff were able to put in place an administrative system that allowed them throughout the
follow-up period to identify applicants randomly assigned to the control group and to avoid
enrolling them in the JTPA-funded services under study. Only 3 percent of the control group
was enrolled in JTPA-funded services at any point during the 18 months following random
assignment, the period during which they were excluded from such services in the study sites.
Thus, the intended difference in access to JTPA services between the treatment and control
groups emerged. This level of site compliance with study procedures is especially impressive
given the many organizations that can be involved in client recruiting, applications, assessment,
and service delivery in local JTPA programs.
Sites did have to expand their recruitment of applicants to permit creationof a control group, but eligibility determination, assessment, and servicedelivery were not, in general, affected by the study.
Creation of a control group, coupled with a declining unemployment rate over the course
of random assignment, led to increasingly severe recruitment problems in many sites. Site staff
reported that these two factors led them to recruit and serve less job-ready clients than they
had during the recession of the early and mid 1980s, when many individuals with extensive
work experience and job-related skills applied for JTPA services.
xxvi

lit-Never, in the subsequent steps of client flow through the JTPA program (i.e., eligibility
determination, assessment, and service delivery), the study did not lead to substantial changes
in local operations, other than the need to increase the number of applicants who proceeded
to the stage of random assignment. Local staff determined eligibility and appropriateness for
JTPA following normal procedures and recommended appropriate services. These service
recommendations were used to designate one of three broadly defined service strategies for
each individual.
This finding that the study itself did not lead to significant changes in the later stages of
program intake does not mean that local administrative practices remained unchanged.
Nationally, in the late 198os, JTPA was becoming increasingly concerned about the need to
serve less job-ready clients, provide more intensive services, improve recruitment practices, and
introduce greater accountability in contracting procedures. Not surprisingly, in light of this
evolution of the system, several of the study SDAs on their own initiative made major reforms
in their procedures during the study. Because the goal of the research was to study JTPA
programs that would operate as normally as possible, there was no attempt to *freeze" program
operations into the forms they had when sites entered the project.
Findings on J I PA Enrollment for the Treatment Group
The tensions among the research goals discussed earlier led to a research design in which
random assignment occurred when local staff recommended applicants for various possible
services rather than at the point when major services were about to begin. As discussed
earlier, this choice was made to allow staff to assess clients as they normally would and to
identify the control group before referrals to services began. Following random assignment,
local staff worked with members of the treatment group to arrange the desired services, but
they were not successful in all cases. Some treatment group members lost interest in the
program, found a job on their own, or moved, while for others staff could not find a service
provider or employer.
Sixty-four percent of the treatment group sample enrolled in JTPA during the18-month follow-up period. There were consistent differences in enrollmentrates across the service strategies, with classroom training having the highestenrollment rate and OJT/JSA the lowest. Differences in target groupenrollment rates within service strategies were relatively small.

Table 2 presents JTPA enrollment rates by service strategy and target group, with the
service strategies showing much greater variation than the target groups. For the service
strategies, enrollment ranged from a low of 57 percent for OJT/JSA to a high of 72 percent
for classroom training. Within service strategies, there was little variation by target group,
though male youths had the highest enrollment rate in all three strategies. Enrollment rates
for the key target groups varied from 61 percent for adult men to 67 percent for male out-
of-school youths.
TABLE 2
ENROLLMENT RATES FOR TREATMENT GROUP MEMBERS,BY TARGET GROUP AND SERVICE STRATEGY
Target Group
AllStrategies
(%)
ClassroomTraining
(%)OJT/ISA
(%)
OtherServices
( %)
All Target Groups 63.8 72.4 565 623
Adult Men 60.8 71.2 56.6 58.9
Adult Women 64.6 72.8 55.4 62.4
Male Youths 66.8 74.8 58.5 67.7
Female Youths 653 715 575 63.1
SOURCE MDRC calculations from Background Information Form responses and program enrollment data from
the 16 SDAs.
The differences in enrollment rates can be at least partly explained by differences in the
difficulty of arranging the services in each strategy. While arranging classroom training is not
necessarily easy, developing OJT positions often is more difficult. In most SDAs, especially
those in which there is a large city, there are several agencies whose mission is to provide
classroom training, increasing the chances that a match can be made between a client's needs
and interests and the courses offered. However, to develop an OJT position, JTPA staff enlist
the cooperation of private or nonprofit employers whose main goal is to produce a good or
service and not to provide: training for the economically disadvantaged. Staff must rely on a
combination of finaacial incentives and assurances of a low administrative and supervisory
burden to recruit employers and typically contact many firms before a position can be found.
xaviii
3 0

At the same time, the client may be actively seeking a job through other means and may find
employment without ever being placed in a JTPA-funded OJT. Hence, the lower JTPA
enrollment rate in the OJT/JSA service strategy is not surprising.
About half of the treatment group members who were never enrolled in JTPAprobably received some type of post-random-assignment service from theProgram.
Many local programs in the study did not enroll applicants in JTPA until they were active
in services intended to increase their employability. In the JTPA system, and especially the
performance standards, there were incentives to delay enrolling applicants. JTPA performance
standards in place during the period of random assignment emphasized (1) achieving a high
proportion of "success stories" for enrollees, where success is defined as placement in a job that
pays well or achievement of a "positive termination" for youths, and (2) keeping costs per
success story low. Since only enrollees counted in the sample for which periormance was
measured, and many local programs believed that they had discretion in defining when
enrollment xcurred, it was common for SDAs to delay enrolling clients in JTPA. For
example, clients seeking OJT would not be enrolled in JTPA until staff were able to arrange
an OJT position with an employer and the client showed up for the first day of work. Unlesz
these efforts to arrange a service were successful, the client might not be enrolled in JTPA.
Following random assignment, local staff lost contact with some members of the treatment
group or found that they were no longer interested in the program. In other cases, staff were
in contact with applicants, but did not arrange any type of referral to a possible service
provider. However, a special study using a small sample of nonenrolled treatment group
members showed that about half of the 36 percent of treatment group members who were
never enrolled in JTPA did receive some services from the program. In most cases, this was
a referrai to a possible OJT position or participation in a job club, so this nonenrolled
"participation" in JTPA was most common in the OJT/JSA service strategy. Overall, about 80
percent of the treatment group (the 64 percent who were enrolled and an additional 18
percent who were not) had some involvement with local JTPA staff after random assignment.
Therefore, the proportion of the treatment group for whom local JTPA staff tried to arrange
services is greater than the JTPA enrollment rate because of site practices adopted in response
to performance standards.
3i

Findings on the Link Between Recommended Service Strategiesand Enrollment in Particular Services
One central goal of the study is to calculate impact estimates for individuals
recommended for three service strategies. For this effort to be successful, the services received
by individuals referred to these three strategies have to be clearly distinguishable in emphasis
and refIr r;t important service approaches commonly used in JTPA. One of the uncertainties
about the research design of the study was whether individuals recommended fr each of the
service strategies would actually be enrolled in these services.
This section explains what these service strategies mean by describing the services
received by individuals in the three groups. These findings are summarized in Table 3, which
presents the two key services in which JTPA enrollees were active and the proportion of the
relevant sample enrolled in them, for each target group/service strategy combination.
Most treatment group members recommended for the classroom training .
service strategy were enrolled in classroom-based services CF-OS or basiceducation.
All treatment group members in this service strategy were recommended for CF -OS,
though other services such as basic education or job search assistance may also have been
recommended. As mentioned above, SDA staff did not usually encounter major problems
arranging classroom-based services for JTPA applicants. This is reflected in the fact that 72
percent of the treatment group members recommended for the classroom training service
strategy were enrolled in JTPA (Table 2), and at least 80 percent of these enrollees in each
target group were active in either CT-OS, basic education, or both (Table 3). Eighty-six
percent of adult men, 89 percent of adult women, 80 percent of male youths, and 86 percent
of female youths were active in either CT-OS or basic education.
JTPA enrollees in the OJT/JSA service strategy were split equally between on-the-job training services and job search assistance. This reflects the fact thattreatment group members recommended for the OJT/JSA service strategy wereoriented ttrosrd immediate employment, either through subsidized training onthe job or an unsubsidized position.
Individuals recommended for this service strategy were usually interested in immediate
employment because of their financial needs or lack of interest in classroom-based services.
However, local staff felt that they may have needed training to improve their skills in order to

TABLE 3
KEY SERVICES FOR ENROLLEES,BY TARGET GROUP AND SERVICE STRATEGY
Target GroupClassroomTraining OJT/JSA
OtherServices
Adult Men 86% enrolled in 87% enrolled in 89% enrolled inCT-OS or BE OJT or JSA JSA or misc. services
Adult Women 89% enrolled in 88% enrolled in 82% enrolled inCT-OS or BE OJT or JSA JSA or misc. services
Male Youths 80% enrolled in 85 % enrolled in 83% enrolled inCT-OS or BE OJT or JSA BE or misc. services
Female Youths 86% enrolled in 85% enrolled in 80% enrolled inCT-OS or BE OJT or JSA BE or misc. services
SOURCE: MDRC calculations from Background Information Form responses and from programenrollment and participation data from the 16 SDAs.
3 3

find long-term employment and, therefore, recommended Off as an option for all in thisgroup. Fifty-seven percent of treatment group members recommended for the OJT/JSA service
strategy enrolled in JTPA, and at least 85 percent of these enrollees in each target groupreceived employment-based services that included on, job search assistance, or both.
The observed split between OJT and job search occurred because, for OJT, staff had tofind an employer interested in hiring a new worker. In some cases, staff would have to
arrange subsidized Off to persuade the employer to hire an applicant, while in other casesthey would not. The mixture of enrollment in OTT and job search assistance among thetreatment group in the OJT/JSA service strategy refleAs the result of staff's efforts to findemployment for these clients.
The diverse needs of the clients recommended for the other services strategyare reflected in the wide range of JTPA services that they received. Foradults, the key services were job search assistance and miscellaneous services(usually preemployment skills); for youths, the most common services werebask educztion and miscellaneous services.
The creation of the other services strategy enabled SDA staff to accommodate clientswith a wide range of needs, including some of the most job-ready clients, who wererecommended for job search assistance only, as well as some of the least job-ready clients, who
were recommended for basic education as a first service, with subsequent steps uncertain. It
also included adult clients who were recommended for a variety of preemployment skills
programs or for combined on and classroom training and youths who were recommended for
special Title II-A-funded programs designed specifically for school dropouts.
For adults, both men and women, the two key services within this strategy were
miscellaneous services (ranging from further assessment and preemployment skills preparation
to work experience and special introductions to the world of work) and job search assistance.
Among adults who enrolled in JTPA, 89 percent of the men and 82 percent of the womenreceived one or both of these services. For youths, basic education and miscellaneous services
were the key services, with 83 percent of male youths and 80 percent of female enrollees
receiving one or both of these services.
The median length of JTPA enrollment for treatment group members whowere enrolled in the program was 3.3 months; enrollees in the classroomtraining strategy had the longest enrollments (5.0 months) and those inOJT/JSA had the shortest enrollments (2.0 months).

For all enrollees in all service strategies, the median enrollment (i.e., the length of time
at which half of enrollees had left the program) was 3.3 months. The classroom training
service strategy had the longest median enrollment overall and for each target group, while
OJT/JSA had the shortest enrollment. There was considerable variation across the target
groups in length of enrollment, with adult women and female youths having the longest
enrollment, and adult men having the shortest enrollment. This variation reflects the
differences, discussed earlier, in the types of services they received.
Findings on .1TPA Service Receipt for Adults
This section now turns to a discussion of the receipts of specific types of JTPA-funded
services by the target groups in the study. Fmdings on JTPA service receipt are important for
two reasons: they provide a needed context for interpreting the program impacts for each
target group presented in the 18-month impact report, and they contribute to the ongoing
discussion of service receipt differences across groups within JTPA by highlighting some
possible reasons for them.
The top panel of Table 4 presents JTPA service receipt rates for the adult target groups
and key subgroups. The first row lists the service receipt rates for adult enrollees in each of
five mutually exclusive service categories. The remainder of each panel lists selected subgroups
of enrollees and the percentage of each subgroup who received each category of services.
Nearly 60 percent of the enrolled adults received some service designed toprovide occupational training through either CFOS or OJT.
Table 4 shows that 38 percent of the adults received Cr-OS and an additional 21 percent
received OJT. Nineteen percent of the adults received job search assistance only, and the
remainder received either basic education without training or other non-training services.
Adult enrollees with more employment barriers (i.e., those who were highschool dropouts, had limited work experience, and were receiving cash publicassistance) were more likely to receive basic education without training andless likely to receive OJT or job search assistance as their only service thanwere those without these employment barriers.
The three employment barriers listed above were associated with service receipt in
different ways. Adults with limited work experience (who were therefore less attractive to
5
1

TABLE 4
SERVICE RECEIPT RATESFOR ADULT AND OUT-OF-SCHOOL YOUTH ENROLLEES,
BY SELECTED BASELINE CHARACTERISTICS
Characteristic Sample CT-OS OTT
Non-Training
EducationJSAOnly
Misc.Non-Training
Servicesand Subgroup Siie (%) (%) (%) (%) (%)
All Adult Enrollees 5,169 38.0 20.8 7.9 19.2 14.0
SexMale 2,286 26.3 24.3 7.2 25.0 17.2Female 2,883 47.2 18.1 8.4 14.7 11.6
EthnicityWhite, non-Hispanic 2,941 30.6 25.9 9.1 20.0 14.5Black, non-Hispanic 1,432 50.5 15.6 2.7 19.7 11.5Hispanic 589 38.7 11.0 15.8 16.3 18.2Other 207 55.1 13.0 3.9 14.0 14.0
Barriers to EmploymentNone 1,828 35.6 24.1 2.6 23.5 14.21 1,952 37.5 21.6 6.7 20.5 13.72 1,092 42.4 16.8 13.6 13.2 14.03 263 40.3 10.3 28.5 6.1 14.8
All Out-of-SchoolYouth Enrollees 2,147 36.4 15.5 18.6 10.9 18.6
SexMale 959 28.1 18.0 17.9 13.2 22.7Female 1,188 43.1 13.4 19.2 9.0 15.3
EthnicityWhite, non-Hispanic 1,138 29.9 21.4 16.0 13.1 19.7Black, non-Hispanic 588 33.0 7.0 31.8 9.4 18.9Hispanic 375 60 3 10.9 6.9 7.2 14.1Other 46 41.3 15.2 10.9 6.5 26.1
Barriers to EmploymentNone 499 39.7 27.1 3.0 15.4 14.81 798 37.8 16.4 13.5 12.9 19.32 638 33.5 9.1 30.4 6.7 20.23 207 31.4 3.4 39.6 5.3 20.3
SOURCE: MDRC calculations from Background Information Form responses and from programenrollment and participation data from the 16 SDAs.
xxxiv

employers) and adults receiving cash public assistance (who therefore had an income source
during JTPA participation) were more likely to receive classroom-based services such as CF-
OS and basic education without training than adults without these barriers. They were also
less likely to receive employment-based services such as OJT and job search assistance as a sole
service. Adult high school dropouts were less likely to receive CT-OS (possibly because many
training providers require a diploma or GED) and more likely to receive basic education
without training than high school graduates or GED recipients.
Women tended to receive classroom-based services, while men tended toreceive employment-based services. The employment barriers analyzed in thisstudy account largely for the gender differences in OJT receipt but very littlefor the differences in CT-OS receipt. There are several possible explanationsfor this remaining difference.
Overall, 56 percent of the adult women compared with 34 percent of the men
received either CT-OS or basic education without training. By contrast, 49 percent of the
adult men compared with 33 percent of the women received Off or job search assistance
only.
When adult men and women with similar employment barriers are compared (an analysis
that is not shown in this table), most of the difference in receipt of Off disappears.
Apparently the gender differences in the receipt of these services which are intended to
place people in OJT are largely related to job-readiness. However, the gender differences
in receipt of CT-OS are not associated with differences in the employment barriers analyzed
in this report. Other possible explanations include differences in client preferences, client
characteristics or employment barriers, or local assessment and service referral practices.
Black and Hispanic adult enrollees were more likely to receive CT-OS andless likely to receive OJT than white enrollees. The employment barriersanalyzed in this study accounted for some of the ethnic differences in servicereceipt, and there are several possible explanations for the remainingdifferences.
Fifty-one percent of the black adult enrollees and 39 percent of the Hispanic adult
enrollees received CT-OS compared with 31 percent of the white adult enrollees. By contrast,
26 percent of the white enrollees received OJT compared with 16 percent of the black
enrollees and 11 percent of the Hispanic enrollees. When individuals with similar employment
barriers are compared, differences in service diminish, although less than was the case for
LEW
7

gender differences. Unlike the case for gender differences in service receipt, employment
barriers do not account for a larger portion of service receipt difference in OjT and job search
than in classroom training. As was the case for the gender analysis above, there are several
possible reasons for these remaining ethnic differences. There may be differences in client
preferences or other characteristics and barriers not analyzed here; employer hiring practices
may make OJT and job search more difficult to provide for minorities; or local assessment and
service referral practices, which may have been adopted in response to the reality of the labor
market, may be different for whites and minorities.
The median length of JTPA enrollment for adults in the five service categoriesranged from almost five months to only one month.
Overall, the median length of enrollment for adult enrollees was 3.2 months. For those
who received CT-OS, the median length of enrollment was longest at 4.8 months, and for those
who received job search assistance only, it was shortest at one month. The median length of
enrollment for adults who received OJT was 2.5 months.
Findings on JTPA Service Receipt for Out-of-School Youths
The bottom panel of Table 4 presents the service receipt findings for the out-of-school
youth target groups and key subgroups.
Just over half of the out-of-school youth enrollees received some form ofoccupational training either in the classroom or on the job and asubstantial percentage received basic education without training.
Table 4 shows that 36 percent of the out-of-school youth enrollees received CT-OS and
an additional 16 percent received OJT; i.e., youths were somewhat less likely than adults to
receive these services. Nineteen percent of the out-of-school youths received basic education
and 19 percent received miscellaneous services without training; i.e., youths were more likely
than adults to receive these services. The remaining 11 percent received job search assistance
only, making youths less likely than adults to receive job search assistance as their only service.
Youths with two or three employment barriers were more likely than thosewith fewer barriers to receive basic education without "mining; they wereless likely to receive CT-OS, OJT, or job search assistance as a sole service.

Thirty percent of the youths with two of the employment barriers analyzed (limited work
experience, no high school diploma or GED, and/or cash public assistance receipt) and 40
percent of youths with all three barriers received basic education without training compared
with 3 percent of those with no employment barriers and 14 percent of those with one barrier.
(These groups are shown in the lower panel of Table 4.) Forty-three perzent of the youths
with no employment barriers received the employment-based services of OJT or job search
assistance only compared with 16 percent of those with two barriers and 9 percent of those
with three barriers. The differences in CT-OS receipt rates were much smaller, but still
significant.
Female youths were more likely to receive Cr-OS and less likely to receiveOn or job search assistance only than male youths. The employmentbarriers analyzed in this study accounted for some of the differences inservice receipt among male and female youths, with several explanationspossible for the remaining differences.
Forty-three percent of the female youths received CT-OS compared with 28 percent of
the male youths. Thirty-one percent of the male youths received OJT or job search assistance
only compared with 22 percent of the female youths. Employment barriers accounted largely
for the male/female differences in OJT and job search assistance only receipt rates, but only
partly for the differences in CT-OS receipt rates. The same factors listed earlier for adults
could also explain the remaining differences here.
White youths were more likely than black youths to receive OJT or job searchassistance only and less likely to receive CF-OS or basic education. Theemployment barriers analyzed in this study accounted for some of thedifferences in service receipt between white and black youths, with severalexplanations possible for the remaining differences.
Thirty-five percent of the white youths received on or job search assistance only
compared with 16 percent of the black youths. By contrast, 65 percent of the black youths
received CT-OS or basic education without training compared with 46 percent of the white
youths. As was the case with adults, when youths with similar employment barriers are
compared, some differences in service continue to appear, though employment barriers account
for somewhat more of the service differences in employment-based services (OJT and job
search assistance only). The possible explanations for service differences mentioned earlier for
adults could also explain the remaining differences here.
=wit

The median length of enrollment for youths in the five service categoriesranged from over five months to less than one month.
Overall, the median length of enrollment for out-of-school youths was 3.6 months, slightly
longer than the median length of enrollment for adults. The median length of enrollment was
5.3 months for youths who received CT-OS, 3.1 months for those who received OJT, and .8
months for those who received job search assistance only.
yindines on Differences AmonLthe Study Sites
This section shifts from a focus on JTPA enrollment and services for the entire sample
and for target groups to a discussion of differences among the 16 study sites. It begins by
describing the variation among the sites and then discusses efforts to determine whether there
are links between sites' patterns of enrollment and services and their administrative practices.
The 16 SDAs in the study varied widely in their service emphases.
While diversity is expected, its magnitude is surprising. For example, the proportion of
adult treatment group members recommended for the OJT/JSA service strategy ranged from
7 percent to 79 percent, and the proportion of adult enrollees who actually received OJT
ranged from 4 percent to 54 percent. Similarly, one SDA recommended the classroom training
service strategy for just 6 percent of its adult treatment group members, while another
recommended it for 77 percent of them. The variation in classroom training service receipt was
nearly as great. Large variations in recommended services and service receipt were also found
for youths: for example, the rate at which youths were recommended for the OIT/JSA service
strategy ranged from 1 percent to 71 percent, and the service receipt rate for OJT ranged from
0 percent to 66 percent.
This wide variation may be due, at least in part, to local economic and other conditions,
the availability of service providers, and the characteristics of the eligible population and of
those recommended for services. It probably also reflects the decisions that SDAs made
regarding recruitment, screening, and other administrative intake processes; the service providers
they selected; and their response to JTPA's performance standards. This variation in services
recommended and received provides an important context for interpreting findings presented
in the 18-month impact report.
=win

Sites differed in the proportion of the research sample who had two or moreof the employment barriers analyzed (lack of a high school diploma or GM,limited work experience, and/or cash public assistance receipt) and a ose whohad none of these barriers.
For example, among adults, the proportion of the sample with two or more barriers
ranged from 12 percent to 47 percent across the 16 sites, and among youth, this proportion
ranged from 21 percent to 52 percent. It was not possible to determine whether this variation
resulted from characteristics of the pool of eligible individuals in the different SDAs or labor
market conditions both factors over which SDAs have no control or from the SDAs'
levels of recruitment activities or selection/screening processes or from choices made by
applicants. Therefore, the analysis is not able to attribute site differences in the overall
research sample to differences in site practices.
Cross-site comparisons of enrollment rates for groups within the research sample
defined by their number of barriers to employment may be somewhat useful as an indication
of targeting. Once people art' part of the research sample (i.e., they have applied and the
SDA has found them eligitle and appropriate for JTPA), SDA administrative practices may
well be a key factor affecting the proportion of the treatment group that enrolls in JTPA.
Most sites in the study did not appear to establish clear enrollment targetingconcerning the key employment barriers examined in the study.
Keeping in mind the caveats noted above, it appears that only one SDA consistently
focused on the more disadvantaged, in the sense that the SDA enrolled a much larger
proportion of treatment group members who had two or three of the employment barriers
analyzed than treatment group members who had none of them. A few SDAs did just the
opposite, focusing on the more job-ready, meaning that they enrolled a higher percentage of
those in the sample with none of the employment barriers analyzed. A few sites exhibited one
pattern for adults and the opposite pattern for youths. However, most sites enrolled
approximately equal proportions of both job-readiness groups.
The final part of this summary examines whether there are links between site practices
and enrollment patterns and service emphasis. This is a much less rigorous type of analysis,
more in the nature cf developing hypotheses for future research. This tentative stance is
appropriate because of the small number of SDAs included in the study, and the limited
loodx
4

available information about SDAs' recruitment, screening, and assessment practices as well as
the role of choices made by applicants. Furthermore, because the 16 SDAs differed in many
ways, the analysis is only able to identify associations between characteristics of SDAs and
enrollment patterns, rather than real causal relationships. Nevertheless, because of the strong
policy interest in the influence of many local administrative decisions on ITPA recruiting and
services, this analysis did explore several hypotheses about why SDAs might be more or less
likely to focus on the more disadvantaged.
Based on limited evidence from the 16 study SDAs, there are indications thatSDAs that did particularly well on key performance standards focused onmore disadvantaged youths and enrolled more job-ready adults. The differentstructures of adult and youth performance standards at the time the researchsample was recruited for and enrolled in JTPA may explain this unusualfinding.
Among the 16 sites, SDAs that substantially exceeded their performance standards were
more likely to focus enrollment on adults with none of the employment bathers analyzed then
were SDAs that marginally exceeded their standards. Further, they also focused on the
OJT/JSA service strategy. However, the opposite was the case for youths: SDAs that
substantially exceeded their youth performance standards tended to focus enrollment on the
more disadvantaged youths and to recommend a higher percentage of youths to the "other
services" strategy.
One possible explanation for these different findings for adults and youths may be that
performance standards for youths included "positive termination" outcomes such as completion
of schooling or attainment of employment competencies. In contrast, for adults the
performance standards in effect when the research sample was recruited to JTPA dealt
exclusively with measures related to job placement. This difference could have permitted, or
encouraged, SDAs to enroll a more disadvantaged youth population for some of whom job
placement at termination from JTPA was not seen to be an appropriate goal without
jeopardizing their ability to meet performance standards.
Again, it should be noted that this discussion must remain tentative because the 16 SDAs
varied on many grounds, not just their performance measures; other factors could be causing
the observed association between performance and enrollment practices.
Analyses failed to find clear associations between SDA practices andenrollment targeting in a number of Ater areas.
xl

The limited data from the 16 SDAs did not support several other hypotheses to account
for differences in enrollment patterns and services emphasis. (The caveats noted above also
apply to these findings.) For example, some argue that SDAs relying to a high degree on fixed
unit price, performance-based contracts will serve more employable, less disadvantaged groups.
Among the 16 study sites, these SDAs did not appear to focus more on enrolling the more
job-ready than did SDAs that primarily used cost-reimbursement contracts. Similarly, SDAs
that were operated by PICs were just as likely to focus on enrollment of the more job-ready
as were SDAs operated by government.
xli
43

CHAPTER 1
INTRODUCTION
For nearly a decade, the Job Training Partnership Act of 1982 (JTPA) has stood as thenation's largest and most visible commitment to providing employment and job trainingopportunities for economically disadvantaged individuals. JTPA established a nationwide networkof more than 600 largely federally funded, state-supervised, but locally operated partnershipsbetween the public and private sectors to arrange for services intended to increase theemployability of eligible adults and youths. Each year since its formal start-up in 1983, Title H-A (the main title of the legislation) has received close to $2 billion and enrolled about 1 millionindividuals which represents less than 10 percent of the JTPA-eligible population.
JTPA was established at a time when the concept of social program accountability gained
a prominent place on the national public policy agenda. Building on its expectation that JTPAwould be "an investment in human capital and not an expense," Congress established explicit goals
for the new employment and training system: increases in employment and earnings andreductions in welfare dependency. For the first time, legislation called for a national system of
outcomes-based performance standards, complete with rewards and penalties, to lead to theachievement of these goals. The legislation also required the U.S. Department of Labor (DOL),the federal agency that oversees JTPA, to conduct an evaluation to determine whether the goalswere met.
In 1986, DOL initiated the National JTPA Study, a major effort to evaluate rigorously, in
a limited number of the local service delivery areas (SDAs)1 across the country, the impact thatJTPA had on participants' employment, earnings, and welfare receipt. Following therecommendation of a technical advisory committee, DOL adopted and oversaw the successfulimplementation of a social experiment using a classical random-assignment design. Between 1987
and 1989, more than 20,000 individuals in 16 local areas across the country were randomlyassigned to a "treatment" group eligible to receive JTPA services or to a "control" group that was
not eligible for JTPA-funded services but remained eligible for all non-JTPA-funded services in
the community. The evaluation was designed to compare credibly and reliably how well the
11n JTPA parlance, 'service delivery area refers to both the geographical area being served and theJTPA administrative unit serving it.
1
44

treatment group fared compared with the control group in meeting the program's goals thereby
showing the difference, or Impact,* that JTPA services made over and above what would have
happened to these individuals without the program. The study sought not only an estimate of
JTPA's overall effectiveness in the participating SDAs, but also the impacts that JTPA's two major
services on-the-job training (OJT) and classroom training in occupational skills (CT-OS) had
on adult men, adult women, and out-of-school youths, as well as other important subgroups.2 The
study was a major and ambitious undertaking, one of the early examples of applying experimental
techniques to evaluate an existing, ongoing delivery system.
The research design for the resulting National JTPA Study has four main, interrelated parts.
The first three focus on the 16 SDAs that participated in the evaluation: a study of their
program implementation and operations, a study of the program impacts they achieved, and a
study of benefits compared with e :sts. This report presents the findings for the first of these
studies; a companion volume (Bloom et al., 1993) presents *le interim, 18-month impact findings.
Thirty-month impact findings and the benefit-cost analysis will be published in the future. The
fourth part of the research design involves an attempt to develop new nonexperimental methods
to estimate program impacts.
This report is intended to serve the National JTPA Study in three specific ways. First, it
provides the programmatic context for understanding and interpreting the 18-month impact find-
ings, as well as the future impact and benefit-cost findings. In meeting this purpose, it focuses
primarily on analyzing, for approximately 17,000 sample members "pooled* across -the 16 SDAs,
the major types of services that individuals were recommended for, the characteristics of these
individuals, the services if any they actually received, and the duration of the servic.es.3
Second, it examines the characteristics of the individual participating SDAs in order, insofar as
possible, to present the variation across the SDAs in services and clientele, local environments,
and organizational, management, programmatic, and administrative decisions. The final purpose
demands both more speculation and greater caution: to test a number of widely held hypotheses
about the possible relationships between SDAs' conditions and decisions, on the one hand, and
the types of clients they enrolled and the services they provided, on the other.
The results of the National JTPA Study are being published at a particularly important
2The only major Title B-A group not included in the study is in-school youths.
3*Services* in this report refers to employment, training, and other services directly related to
employment it does not correspond to the JTPA cog category called 'services,' which refers primarily to
transportation, child care, and other support services that assist people to attend the program.
2
45

juncture in the ongoing development of national employment and training policy. It is a time of
increasing concern about the nation's ability to meet competitive economic challenges worldwide.
The reported lack of appropriate basic literacy and jobs skills needed for a continually changing
and demanding job market has led to increased attention on JTPA to learn its strengths and
weaknesses, to build on its successes where possible, and to make improvements in other areas.
For this reason, the findings in this report, supporting those in the 18-month and future impact
reports, should be particularly useful in providing evidence about JTPA's effectiveness and in
pointing to future directions. This introductory chapter provides a brief overview of the JTPA
delivery system under study, a summary of the National JTPA Study, and an outline of the
remaining parts of this report.
I. An Overview of the Title II-A ITPA System4
With strong bipartisan congressional support, JTPA was signed into law in October 1982.
Title I established the state-supervised, locally operated system for delivery of the employment and
training services to economically disadvantaged youths and adults at and funded under
Title II -A. With funding at $1.8 billion, Title II-A immediately became by far the nation's largest
federally funded employment and training progrant.5
The key provisions of JTPA were shaped in response to two main factors. First, a
consensus emerged in the early 1980s that government employment and training programs needed
to be more directly linked with the needs and expertise of the business community in order to
meet the emerging economic challenges facing the nation. Second, there was a widespread view
that the predecessor to JTPA, the Comprehensive Employment and Training Act (CETA),
required major changes in the services that were authorized and in the responsibilities for
oversight. This view was coupled with inconclusive and sometimes contradictory findings from
nonexperimental impact studies published during the debate on JTPA in the early 1980s.6 The
4This overview describes the JTPA system as it existed during the period in which sites were selected,random assignment occurred, and services were provided to the treatment group. Amendments to JTPA,effective July 1993, will make several changes to the program, including creation of a separate youth title.
sThe Title 11-A funding level has generally been sustained in nominal dollars, with only minor increasesand cuts over the years. The Title II-A system is almost entirely federally funded, with the exception of amatch requirement for the 8 percent state-level set-aside. For details, see Appendix A in Doolittle andTraeger, 1990.
Experimental impact studies entail random assignment of eligible individuals to a program group(referred to in this report as a 'treatment group') or to a control group. The experiences of the controlgroup then serve as the benchmark against which to compare the experiences of the treatment group.
(continued...)3

findings generally suggested that CETA training programs had very small, nonexistent, or negative
impacts on the employment and earnings of men and modest impacts on women.?
These factors led to a significant shift in programmatic and administrative structures and
relationships, and, overall, a substantial reduction of total federal resources earmarked for
employment and training programs. In contrast to CETA, JTPA made substantial structural
changes in four main areas: it assigned states a new administrative function, provided for a more
substantial private sector role, focused resources on training activities while placing strict limits on
other services and functions (including prohibiting public service employment and the payment of
regular stipends to trainees), and established a system of outcomes-based performance standards
intended to promote achievement of JTPA's job placement and welfare cost reduction goals.
These four changes are the essential underpinning for the JTPA delivery system discussed in this
report and evaluated in the National JTPA Study.
A. The Role of Federal. State, and Local Governments
Under CETA, states were not substantively involved in the administrative oversight of
training programs. Nearly all funding went directly from the federal government to local
governments; DOL, through its 10 regional offices, supervised the system. However, JTPA gave
states a substantial administrative role as the recipients of all Title II-A training funds thereby
eliminating the direct federal-to-local link. But states' control of funds was strictly circumscribed:
they had to allocate a sizable proportion 78 percent of the funds to local SDAs, using a
federal formula. The remaining 22 percent of the Title II-A funds were divided among a number
of categorical set-asides over which states could exert some control. It is the use of the 78
percent funds that is the subject of the National JTPA Study.8 Further, the law explicitly stated
that SDAs had sole authority over the use of the 78 percent funds (who to serve and what
services to provide) as long as the uses were consistent with the act. Indeed, the states' authority
'(...continued)Nonexperimental impact studies of CETA typically established a 'matched comparison group" (thought tobe similar to the treatment group) rather than a control group created through random assignment.
?See, e.g., Bassi, 1983; Bloom and McLaughlin, 1982; Westat, 1981. For a summary, see Barnow, 1987.8The set-asides were 3 percent for older Americans, 6 permnt for incentives and technical assistance
to local SDAs, 8 percent for the state education agency, and 5 percent for administration. The statute gavelocal SDAs some level of control over the 8 percent set-aside.
In some study sites, services funded by portions of the 8 percent, 3 percent, and 6 percent set-asides at the state level were included in the National JTPA Study if the SDAs received and administeredthese funds. But the vast majority of services studied were funded through the 78 percent Title II-Acategory.
4

to review and approve local plans was also sharply limited by the act, giving governors little
discretion beyond the criteria specified in the federal statute. This is the major reason that the
National JTPA Study focuses entirely on local SDA-level services and programs.
B. The Role of the Private and Public Sectors
Building on a small program operated from 1979 to 1982 under Title VII of CETA, the
JTPA delivery system was envisioned as consisting of a partnership established in all local areas
across the country between government and business. Specifically, these partnerships were to
be set up in "service delivery areas" (SDAs) that, generally, met a population threshold of at least
200,000. In each area, local elected officials appointed members of newly created private industry
councils (PICs), which were required to have a majority of members representing the private
sector and to be chaired by a private sector representative. PICs were authorized to provide
policy guidance, approve local plans, and monitor the program.
However, beyond these requirements and authorizations, the specific nature of the local
government/business partnerships was designed to be determined through negotiations at the local
level. Indeed, as long as the government officials and PICs agreed in writing to the local plan
and the program administrative structure, the terms of the local partnership, such as the
administrative and management roles that the government or PIC would assume, were,
importantly, left to local discretion. Specifically, negotiations would determine which entity the
government, the PIC, or some combination of the two would serve as the grant recipient and
administrator. It was widely understood that this would likely result in differences in the relative
strength of the PIC or elected officials in the various forms of partnerships across the country.
C. Allowed Use of Funds
The third major area of change concerned the legal ways in which JTPA funds could be
used and the balance in the use of funds among costs associated with training, support services,
administration, and services to youths. As noted above, public service employment, CETA's most
prevalent activity, was prohibited. A strict, 15 percent limit was placed on administrative costs,
and the combination of administrative and support services costs (such as child care,
transportation, and counseling) could not exceed 30 percent. Support services could include
"needs-based payments" to participants, but not regular, hourly minimum-wage stipends that had
been paid under CETA to provide people enrolled in training with a level of income support.
Adult work experience was limited to six months, and half of the wages for youth and adult work
5

1
experience had to count as support services, A minimum of 70 percent of the funds had to be
spent on training and, although there was no separate year-round youth program, 40 percent of
the total funds had to be expended on youths. Further, two groups were specifically earmarked
to receive services at a level proportionate to their incidence in the eligible population: high
school dropouts and those welfare recipients who were required to participate in the Work
Incentive (WIN) and successor programs.
One of the most important features related to the use of funds was the authorization to
use fixed unit price, performance-based contracts, in which full payment could not be made to a
contractor until a participant was placed in a job. Costs for such contracts could be charged
entirely to training. In sharp contrast to the more typical cost-reimbursement form of contracting,
fixed unit price, performance-based contracts enabled SDAs to retain more of the limited
administrative funds for central oversight and management rather than allocate them to
contractors. But, as discussed in Chapter 2, this form of contracting was reported to give
contractors an incentive to enroll participants who were judged more likely to succeed in training
and employment.
D. Performance Standards and Reporting Requirements
Building on a pilot effort to develop CETA performance standards, which DOL began in
1979, early in the development of JTPA agreement was reached that it should be an outcomes-
driven system with clearly stated goals and performance measures directly related to those goals.
This thrust was viewed as the public sector counterpart to the private sector's emphasis on
"bottom-line" profits, consistent with the theme of JTPA as an "investment." DOL was given
broad authority to develop national standards; to provide a fair mechanism to permit states to vary
local SDA standards to take into account different economic conditions, demographics, and
services provided; and to establish consistent national reporting systems for performance
measurement and general accountability. Six percent of the Title II-A funds were set aside, at
the state level, for states to provide either performance incentive awards to SDAs exceeding their
standards or technical assistance to underperformers.10 States were also required to reorganize
SDAs that failed to meet standards for two consecutive years.
In implementing the performance standards requirements, DOL selected four outcomes-
91'here are some exceptions permitted, but few SDAs have taken advantage of them.10The funds could also be used to provide services to the especially hard-to-serve.
6
4 9

based standards for adult enrollees and three for youth enrollees,11 and provided states with a
regression-based methodology to adjust local SDA standards, which most states adopted. (This
is the meaning of the term "adjusted performance standard" used later in this report) DOL
further established reporting criteria and definitions, but did not provide a precise definition of
the point at which "enrollment" or "termination" was to occur, which was then left largely to the
discretion of individual SDAs.12
Together, these four major elements in JTPA the new state role, the new role for the
private sector, the limits on uses of funds (e.g., elimination of allowances to program participants
and authority to use fixed unit price, performance-based contracting), and the emphasis on
performance standards along with an overall reduction in funds for the federal employment and
training system provided the basic framework for the nation's new employment and training
system, a portion of which is the subject of the National JTPA Study.
II. An Overview of the National in% Study
A. Background
Attempts to design evaluations capable of measuring accurately and reliably the difference
that social programs make, over and above what would have occurred without the program, have
increasingly drawn the attention of federal, state, and local policymakers, as well as program
administrators and operators. The rapid growth in demands for accountability and the need for
programs to show credible evidence of their value particularly their impacts and cost-
effectiveness that has accompanied increased competition for limited government resources have
also pushed government agencies and professional evaluators to adopt research methods that yield
reliable assessments of program impacts and cost-effectiveness.
In the judgment of many experts, an ideal impact evaluation for employment programs such
as JTPA would consist of a comparison between the employment and earnings of those who were
assigned to receive the program's services the "treatment" or "experimental" group and an
11The four adult measures were: (1) entered employment rate, (2) entered employment rate for welfarerecipients ("welfare entered employment rate"), (3) average wage at placement, and (4) cost per enteredemployment. The three youth measures were: (1) entered employment rate, (2) positive termination rate,and (3) cost per positive termination.
12The absence of consistent definitions for these two terms and therefore a consistent identificationof when an individual "counts" for the purposes of performance standards had significant implications forthe National JTPA Study, which are discussed in Chapter 3 of this report.
7

identical group of people who were not able to receive the services, i.e., a control group. The
comparison would reveal the difference (or impact) that the program made over what would
have occurred in the absence of the program and, in doing so, the results for which the
program could legitimately claim full credit.
This was, in fact, the advice of two national panels of experts convened in the early and
mid 1980s,3 which found that the impact evaluations conducted of JTPA's predecessors were
with rare exceptions unable to meet the essential test of accuracy and credibility. The primary
reaan was the overwhelming difficulty posed in selecting individuals to form comparison groups14
and the lack of confidence that the comparison and treatment groups were as equivalent as
possible in all respects, particularly regarding unmeasured characteristics such as motivation. One
of these panels convened by the National Academy of Sciences concluded that the only
alternative for the development of knowledge about program impacts was the use of random
assignment to establish the two groups: "Our review of the research . . . shows dramatically that
control groups created by random assignment yield research findings about employment and
training programs that are far less biased than results based on any other method" (Betsey, 19S e,
p. 18). This is because random assignment, if done properly, assures that there will be ,f1
systematic differences in the two groups and therefore permits credible estimates of the effects
of the program. Reaching the same conclusion, DOL's JTLS Research Advisory Panel explicitly
recommended that the evaluation of JTPA utilize random-assignment experiments accompanied
by further explor%tion of the potential of nonexperimental methods to provide reliable estimates
of program impacts.
As a result, in early 1986 DOL issued a Request for Proposals (RFP) to conduct an
evaluation of programs operated by the local SDAs set up under Title I and funded under Title
II-A of JTPA. As described in the first implementation report (Doolittle and Traeger, 1990), the
initial research design pro, 3sed by DOL and the final research design implemented by the two
contractors that DOL selected were fairly consistent except in one critical respect the method
of selecting the sites to be included in the study. In summary, the initial plan envisioned a
13The first, the Committee on Youth Employment Programs, was convened in 1983, at the request ofDOL, by the National Research Council of the National Academy of Sciences to assess knowledge aboutyouth employment and training programs. See Betsey, 1985. The second, the Job Training LongitudinalSurvey (JTLS) Research Advisory Panel, was convened by DOL to provide advice on the plan to evaluateJTPA. See JTLS Research Advisory Panel, 1985.
14Our review of research that used such constructed comparison groups revealed ... basic problemsthat repeatedly jeopardized the validity of the inferences to be drawn" See Betsey, 1985, p. 17.
8
r

random selection of up to 20 SDAs for the study; under such a plan, it could have been argued
that the impact findings for the 20 SDAs were generalizable to the JTPA system of more than
600 SDAs. However, by an early point in the site recruitment process, a sizable prom-don of
the randomly selected SDAs had declined, for a number of reasons, to participate, and this
approach was discontinued. (See Doolittle and Traeger, 1990.) Further site recruitment led to
the selection of 16 diverse SDAs that were interested in and able to participate in the study.
Hence, the findings from the various components of the National JTPA Study are explicitly not
generalizable to the JTPA system. However, comparisons in this and the Doolittle and Traeger
(1990) report generally show that the 16 SDAs reflect the overall diversity of the 600-plus SDAs
in the people they served and the services they provided, and are similar to the larger JTPA
system across several key dimensions, such as unemployment and poverty rates. (See Doolittle
and Traeger, 1990.) Importantly, these 16 SDAs, although volunteers, ranged from those that
substantially exceeded their performance standards to those that failed to meet them much like
the larger JTPA system. In short, although these SDAs are not statistically representative of the
JTPA system, there is no evidence that they include only the highest or the lowest performing
local programs; rather, across a number of key dimensions, they appear to reflect the considerable
diversity in the system.
B. Components of the National JTPA Study
As noted earlier, the National JTPA Study consists of four major components. The first,
a study of the implementation and operations of the programs in the 16 participating SDAs, is
the subject of this report. The second a study of program impacts is closely linked to the
third, an analysis of program benefits compared to costs. The final component is an attempt to
develop nonexperimental methods to estimate program impacts.
. The impact and benefit-cost studies are based upon an experimental design, using random
assignment to treatment and control groups, called for by DOL in the RFP for the evaluation.
DOL identified three major objectives for the impact study, which are discussed in more detail
in Chapters 3 and 4. First, the random-assignment process should interfere as little as possible
with the normal operations of the SDAs. Second, the evaluation should produce impact estimates
for JTPA services overall and for four major target groups adult men, adult women, male out-
of-school youths, and female out-of-school youths in addition to a variety of subgroups (e.g.,
9
r 2

as defined by prior work experience, welfare receipt, and ethnicity).15
Third, as part of the impact study, DOL further sought, for each of the four major target
groups, separate impact estimates for JTPA's two major services on-the-job training (OJT) and
classroom training in occupational skills (CT-OS) on those who were recommended by local staff
to receive the service. Hence, the goal here was to measure the degree to which each was
effective as a service. (In the research findings presented here, OJT was merged into an OJT/job
search assistance [EA] service strategy because JSA often became the service for those for whom
OJTs were not arranged.) To accomplish this without changing significantly or disrupting the
SDAs' existing operations, a process by which SDA staff designated a *recommended service
strategy* for applicants was successfully built into the SDAs' normal intake and assessment
activities. This process consisted of their identifying a *poor of individuals whom they had
assessed as appropriate for one of the three recommended service strategies;16 these individuals
were then randomly assigned to the treatment or control group.17
The first of these recommended service strategies aimed at immediate employment, either
subsidized or unsubsidized; the *anchor" services for this strategy were therefore on and, since
it was so often used in combination with OJT, job search assistance. This strategy is therefore
referred to as the OJTIISA service strategy in this report. In contrast, the second strategy was for
people for whom the SDA recommended the development and acquisition of occupational skills
before job-seeking activities, and was therefore "anchored* in Cr-OS.18 It is referred to as the
classroom training (CT) service strategy in this report. Funny, a third strategy referred to in this
report as the other services service strategy was recommended for individuals for whom neither
of JTPA's two main service strategies was considered appropriate, e.g., for basic education
15°Ethnicity° in this report includes "race." Original plans called for designating minority and non-minority youths as separate target groups and treating male and female youths as a subgroup. Followingthe recommendation of the Technical Advisory Panel for Part B, the impact analysts shifted to treating male
and female youths as target groups, and whites, blacks, and Hispanics as subgroups. The Part A analysis
followed this shift in terminology.16In a number of SDAs, creating a large enough pool to allow for the estaishment of a control group
required increased recruitment efforts. See Doolittle and Traeger, 1990.17Chapters 3 and 4 discuss this in detail.18Even though services other than the 'anchor' services were permitted in each of these two strategies
e.g., basic education could be provided as part of either strategy it was intended that clients wouldreceive, at some point, the strategy's °anchor'. service(s). However, in order to make possible independentimpact estimates of the effects of the OJTIJSA and classroom training strategies, neither of these two main
strategies was designed to permit the other e.g., OJT could not be a recommended activity for the people
in classroom training strategy, and vice versa. It was also recognized that not all clients recommended fora strategy would actually receive it. See Chapter 3 for a detailed description of these service strategies.
10
. 3

unlinked to the OJT/JSA or classroom training service strategy.
SDAs reported that the process of assigning individuals to these treatment strategies went
smoothly and generally caused minimal disruption to their normal operations, and the evidence
presented in this report shows that, by and large, the majority of individuals received the "anchor"
service(s) for the strategy to which they were assigned. Hence, while the research design for the
impact and benefit-cost components had some limitations, it enabled random assignment to be
implemented in an ongoing, mature program with a minimal level of disruption to normal
operations; and it enables the researchers to answer DOL's key questions about JTPA's
accomplishments in the study sites: the impacts for target groups and key subgroups, overall and
by activity.19
M. The Structure of the Study and the Content of Its Reports
DOL divided the original RFP into two parts. The Part A contractor was to be responsible
for site selection, implementation and monitoring of random assignment and sample intake
procedures (to ensure the integrity of the experimental design), and documenting, to a limited
degree, the local environment, delivery structure, and nature of services provided by the sites.
MDRC, with Abt Associates Inc. as a subcontractor, was awarded Part A. The Part B contractor
was to be responsible for the impact studies, the benefit-cost analyses, and the nonexperimentai
study, as well as most of the data collection and survey work. Abt Associates Inc., with ICF,
MDRC, New York University, and National Opinion Research Center (NORC) as subcontractors,
won Part B.
A number of reports will have been generated by the National JTPA Study. First was a
research design report (Bloom et al., 1990). It was followed by an implementation report
(Doolittle and Traeger, 1990), which documented site selection, the nature and reasons for
changes in the research design as more was learned about site operations, and start-up of the
study at the 16 SDAs. This was the first of two Part A reports addressing the first component
of the National JTPA Study the analysis of program implementation and operations. The
"It is important to note that the research was not designed to answer whether OJT/JSA or classroomtraining would be a more effective strategy for the same people. This is because, to address thisexperimentally, individuals would have to have been randomly assigned to OJT/JSA or to classroom training.Rather, in part to meet the objective of causing minimal interruption in JTPA and measuring the programas it existed, individuals were first assessed as appropriate for a strategy and then randomly assigned. Seefurther details in Chapters 3 and 4.
11
r 4I

present report is the second and final one on this component of the study. A further report
(Bloom, 1991) analyzed the characteristics of the research sample at the point of random
assignment, and the services for which sample members had been recommended. That report was
based on data from the Background Irf:Imation Form (IMF), which was completed on all sample
members just prior to random assignment, and compared characteristics of the sample with data
collected as part of the Job Training Quarterly Survey (JTQS).
A separate report (Bloom et al., 1993) presents the 18-month impact findings, based
primarily on information reported by respondents to a survey. The next impact report, covering
30-month impact and benefit-cost findings, will draw on both survey data and a variety of
administrative records (e.g., wage records from the Unemployment Insurance system, welfare
payment records from state or local welfare agencies) and cost data provided by the participating
SDAs. The final report will present the findings from the nonexperimental study.
IV. The Purpose and Organization of This Report
As described above, this is the second of two reports that are part of the first component
of the National JTPA Study the study of program implementation and operations. The main
data sources for this report are three: the baseline data collected on the members of the 18-
month study sample just prior to random assignment; the JTPA participant enrollment,
participation, and termination information routinely collected on enrollees by the participating
SDAs; summary data on SDAs from the JTPA Annual Status Report (JASR); and a limited
amount of field research the DOL called for in the original RFP (see below). A special survey,
described in Chapter 3, was also conducted.
This report has three major purposes. First, in its broadest sense, the report provides the
operational context for interpreting the 18-month impact findings (Bloom et al., 1993) as well as
those to be published in the final impact report. 'Context" in this framework includes quantitative
information about the types of services for which JTPA applicants were recommended, their
enrollment rates, and the types of services they received; information about the external factors
affecting the participating SDAs, such as labor market conditions and the characteristics of the
JTPA- eligible population; and qualitative information about the SDAs' areas of administrative,
management, and organizational discretion and constraint.
In the evaluation RFP, DOL specified that limited resources be devoted to collecting
qualitative data on the participating SDAs and the services they funded. Field research was
12
¶500

undertaken only as part of random-assignment-monitoring visits. Qualitative data were not
systematically collected on the nature of the services provided, and only basic information about
the *external factors'. was collected on the participating SDAs, such as unemployment data, wage
level, and population data.
The second major purpose of the report is to describe the flow of JTPA applicants from
the point of application to JTPA to the point of enrollment (or nonenrollrnent). This is
important to understand because it describes the process by which individuals were moved through
the SDAs' intake procedures that would lead, ultimately, to their receiving or not receiving
services. From both a research and programmatic perspective, this complicated process has critical
relevance to recognizing the need to have the two sets of impact estimates that are found in the
18-month impact report one for those recommended for services, and one for those officially
enrolled in JTPA by the participating SDAs. Hence, explaining this process and its relevance to
understanding the impact reports is, again, a major, second purpose of this report.
The third purpose of the report is to explore the relationships between the types of services
SDAs provided, the types of participants they served, and a variety of other factors. Some of
these factors, such as the unemployment rate, were beyond the SDAs' control; others, such as the
role of the government entity or the PIC, permitted some level of SDA discretion within statutory
parameters. Given the limited number of SDAs in the study, however, such analyses must be
viewed as quite speculative and exploratory.
To meet these three purposes, the remainder of this report is divided into six chapters:
Chapter 2 provides the background information on the study sites and thesample for this and the 18-month impact report. It describes the externalenvironment in which the participating SDAs operated, such as labor marketconditions, and the characteristics of the program participants the SDAsserved during the years the study sample was selected. It also presents thekey management, organizational, and administrative decisions that SDAs madein areas over which they had some degree of discretion.
Chapter 3 describes the flow of potential JTPA participants through thestages of the program, from application to enrollment. Together with Chapter4, it provides the essential context for understanding the subsequent chaptersand the 18-month impact report.
Chapter 4 discusses the key policy questions in the impact research andexplains the research design choices made to address them.
Chapters 5 and 6 present the quantitative participation findings on,respectively, adults and out-of-school youths who were officially enrolled in
13
5 t;

JTPA during the 18-month follow-up period for this report. Each chapterstarts by analyzing the JTPA services received and then presents differencesby gender, ethnicity, and other subgroups. These chapters also presentfindings on how long enrollees stayed in the program.
Chapter 7 offers an exploratory examination to determine if the kinds ofservices SDAs provided or the types of individuals they enrolled are relatedto their local conditions and/or their decisions about organization,management, and administration.
14

CHAPTER 2
THE STUDY SITES AND THE SAMPLE
This chapter provides background on the 16 local JTPA programs and the sample of
individuals studied in this report. It discusses the local population and economic conditions of
service delivery areas (SDAs) in the study, describes key aspects of their administrative
structure, summarizes the characteristics of all program participants they served under Title H-
A of JTPA over the three years in which the study sample was selected, and discusses the
degree to which they succeeded in meeting performance standards. The chapter concludes by
reviewing the characteristics of the sample analyzed in this report and in the 18-month impact
report (Bloom et al., 1993). When appropriate data are available, the chapter compares the
study sites with all SDAs in the national JTPA system.
The basic conclusion is that the sites and the individuals whose experiences are examined
in this report resemble in many ways the JTPA program and its participants nationally and
include much of its diversity. The 16 sites include several with very strong economies during
the late 1980, others experiencing modest growth, and still others recovering slowly from job
losses in the recession of the early 1980s. Following national JTPA guidelines, the study sites
made different decisions on key aspects of local administrative discretion, including the role of
the private industry councils (PICs), their choice of service providers, and the way they
structured contracts for services. Furthermore, their performance, measured in terms of key
Department of Labor (DOL) standards and based on the experience of those leaving the
program during the study years, showed similar diversity, with both strong and weaker
performers included in the study. The members of the study sample are themselves a diverse
group with many similarities to those served nationally. Their diversity allows analysis of
program implementation and impacts based on demographic characteristics, welfare receipt, and
employment history.1
Before presenting these findings on the sites and individuals in the study, it is useful to
1Se,e Bloom, 1991, for a detailed discussion of the characteristics of the sample and a comparisonwith characteristics of people served nationally by JTPA.
15
rLI

provide some background on the selection of sites analyzed in this report. The sites in the
study were recruited to participate in late 1986 and 1987. An earlier report on this project
discussed the many issues that arose during site selection and how the original goal of randomly
selecting study sites from all local JTPA programs shifted to recruiting a diverse group of sites
interested in and able to participate in the study.2 The 16 study sites began random assignment
between November 1987 and October 1988, and all sites completed this phase of the project
by the end of September 1989.
The definition of the sty ple analyzed in this report and the 18-month impact report
(Bloom et al., 1993) needs explanation. In the 16 study sites, a total of 20,601 individuals were
randomly assigned to either the treatment group, which was given access to JTPA services, or
a control group, which was not.3 Follow-up surveys were then administered. Choices made
to conserve project resources devoted to the survey led the research team to use a somewhat
smaller sample for this report and the 18-month impact report (which relies on the first follow-
up survey). To compress the time during which survey staff conducted the follow-up interviews,
individuals were contacted at slightly different times relative to when they were randomly
assigned!' Some individuals were surveyed as early as 13 months after the date they were
randomly assigned, while others were surveyed as late as 22 months following random
assignment.5
The methods available for analyzing variable-length follow-up are quite complicated.6
Therefore, to simplify the analysis of program implementation and impacts, the research team
selected a sample of individuals for whom survey contact was scheduled at least 18 months after
their date of random assignment.7 This sample, called the "18-month study sample" in this
Doolittle and Traeger, 1990.3In Bloom et al., 1993, these 20,601 individuals are referred to as the "experimental sample.'4Random assignment began in the first sites in November 1987 and ended in the last site 23
months later. If all persons had been contacted on the 18-month anniversary of their randomassignment, these contacts would have been spread over a 23-month period.
5Most of the sample was interviewed between 15 and 20 months following random assignment.6Problems of analysis occur because the sample changes as the length of follow-up increases. For
this survey, as noted above, follow-up varied in length from 13 to 22 months. Thus, some of theindividuals analyzed in data collected 13 months after random assignment would not be in the sampleas follow-up lengthened. Even with complicated statistical modeling, it would be difficult to determineif changes in impacts over time occurred because of time trends in program impacts or differences inthe composition of the sample.
7Eighty-four percent of these people actually completed the first follow-up survey.
16

rernrt and the 18-month impact report, consists of 17,026 individuals assigned to either the
treatment group or the control group before July 1989. Much of the analysis in this report
concerns the experiences of the 11,474 individuals in this sample who were assigned to the
treatment group and who, by definition, had access to JTPA services; these individuals make
up the "18-month treatment group sample." The final impact report, based on longer follow-
up, will rely on both a second follow-up survey and administrative records. It will analyze the
experiences of a larger sample.
With this as background, this chapter now describes the characteristics of the study sites
and compares them with what is known about JTPA nationally. It then provides a brief
overview of the characteristics of the sample analyzed in this report.
I. The 16 Study Sites
The sites in the study were recruited from among SDAs in the 48 contiguous states with
at least 500 persons leaving programs funded under Title II-A programs ("terminees" in the
language of program reporting) in program year 1984.8 Table 2.1 lists the formal SDA name,
a more descriptive, abbreviated site name used in this report, and each site's census region.
It also lists the largest city within each site and the size of the 18-month study sample. Figure
2.1 shows the approximate location of each site. This section reviews three features of these
local sites that show considerable variation: the characteristics of the local population and
economy, the administrative structure of the SDAs, and the characteristics of terminees served
by the program during the period of random assignment.
A. Characteristics of the Local Population and Economy
The 16 study sites are spread throughout the nation, with two in the Northeast, four in
the South, seven in the Midwest, and three in the West. Oakland and Jersey City are located
in large metropolitan areas with substantial black, Hispanic, and other minority residents, but
sProgram year 1984 (July 1984 through June 1985) was the latest year for which t1ata were availableat the time site selection for the study began. People can leave the program v positive (e.g.,employment) or negative (e.g., failure to meet program requirements) outcomes.
17

TABLE 2.1
KEY FACTS ABOUT THE NATIONAL JTPA STUDY SITES
Site Name SDA Name
CensusRegion Largest City
18-MonthStudy
Sample Size
Butte, Mont. Concentrated Employment West Butte 477
Program, Mont.Cedar Rapids, Iowa East Central Iowa Midwest Cedar Rapids 346
Coosa Valley, Ga. Coosa Valley, Ga. South Rome 1,806
Corpus Christi, Tex. Corpus Christi/Nueces South Corpus Christi 1,498
County, Tex.Decatur, Ill. Macon/De Witt Midwest Decatur 471
Counties, Ill.Fort Wayne, Ind. Northeast Indiana Midwest Fort Wayne 2,559
Heartland, Fla. Heartland, Fla. South Lakeland 597
Jackson, Miss. Capital Area, Miss. South Jackson 1,375
Jersey City, N.J. Corporation for Employ-meet and Training, Inc.
Northeast Jersey City 1,170
Larimer County, Colo. Larimer County, Colo. West Fort Collins 668
Marion, Ohio Crawford/Hancock/Marion/ Midwest Marion 1,083
Wyandot Counties, OhioNorthwest Minnesota Northwest Minnesota Midwest Thief River 498
(Crookston and Thief Falls
River Falls)Oakland, Calif. Oakland, Calif. West Oakland 1,048
Omaha, Neb. Job Training of Midwest Omaha 956
Greater OmahaProvidence, R.1. Providence/Cranston, R.I. Northeast Providence 1,277
Springfield, Mo. Job Council of the Midwest Springfield 1,202
Ozarks, Mo.
All Sites 17,031
18

FIGURE 2.1
LOCATION OF THE NATIONAL JTPA STUDY SITES
1. Butte, Mont.
2. Cedar Rapids, Iowa
3. Coosa Valley, Ga.
4. Corpus Christi, Tex.
5. Decatur, W.
6. Fort Wayne, Ind.
7. Heartland, Fla.
8. Jackson, Miss.
SITE NAME
19
9. Jersey City, N.J.
10. Larimer County, Colo.
11. Marion, Ohio
12. Northwest Minnesota
13. Oakland, Calif.
14. Omaha, Neb.
15. Providence, R.I.
16. Springfield, Mo.

no large central cities are included among the sites, Among the sample are predominantly
rural or small-town sites and mixed urban-suburban-rural sites. The largest cities within each
of the 16 study SDAs range in population from Oakland (372,000 in 1990) and Omaha
(336,000) to Thief River Falls (under 10,000).
Table 2.2 provides more evidence of this variety. Three SDAs made up solely of cities
stand out in population density (shown in the left column of the table): Jersey City, Oakland,
and Providence. Butte, Larimer County, Northwest Minnesota, and to a lesser degree
Cedar Rapids and Springfield fall at the other extreme and are largely rural in character. Fort
Wayne's relatively low population density is an average over eight counties that are
predominately rural in character. The average for the -ample is above that for the nation as
a whole, partly because rural SDAs with a small number of participants were not recruited to
participate in the study.'°
The poverty rate, presented in the second column of Table 2.2, shows similar variety.
Sites located in large, heavily minority metropolitan areas (Jersey City, Oakland) have the
highest poverty rates, but other urban sites with minority populations such as Corpus Christi
(Hispanic) and Jackson (black) also have higher-than-average rates. Four other sites (Coosa
Valley, Georgia; Heartland, Florida; Northwest Minnesota; and Springfield, Missouri) also have
poverty rates slightly above the sample and national average.
Economic characteristics at the time of random assignment summarized in the remaining
columns of Table 2.2 reflect differences in regional economic conditions and the local economic
base. As is the case nationally, the average unemployment rate among the sites masks great
differences. Corpus Christi's residents experienced persistently high unemployment during the
late 1980s, as the oil industry suffered an extended slump. At the other extreme, Providence's
low unemployment rate resulted from New England's high technology boom of the same
period, while the low rates in Cedar Rapids, Fort Wayne, and Omaha reflect the economic
resurgence experienced by some middle-sized metropolitan areas in the Midwest. Decatur's
high unemployment, however, illustrates that this recovery did not occur everywhere; in this
tinge central cities often have many ageucies handling recruiting and program intake, which wouldhave made implementation of random-assignment procedures very difficult. For example, the City ofLos Angeles program involved more than 50 service providers at the time of site selection for the study.
1°The averages for the sample and for the nation are unweighted. Thus, all sites, regardless of thenumber of individuals served, are treated equally in calculating both averages.
20
F'3
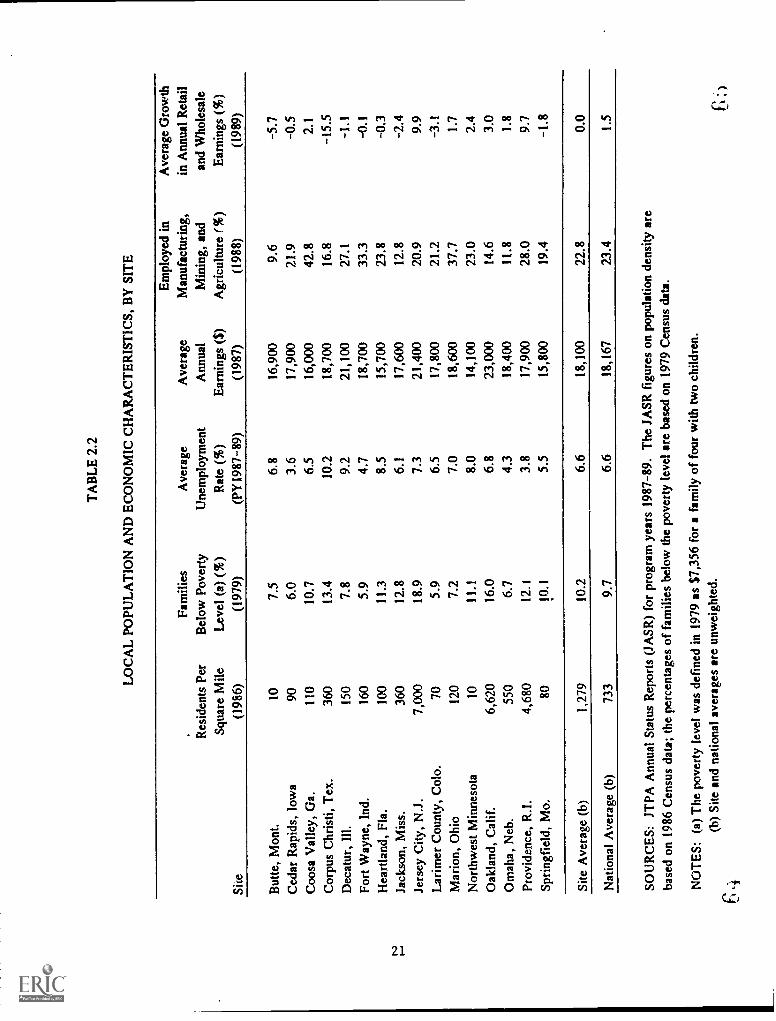
TA
BL
E 2
.2
LO
CA
L P
OPU
LA
TIO
N A
ND
EC
ON
OM
IC C
HA
RA
CT
ER
IST
ICS,
BY
SIT
E
Res
iden
ts P
er
Squa
re M
ile
Fam
ilies
Bel
ow P
over
ty
Lev
el (
a) (
%)
Ave
rage
Une
mpl
oym
ent
Rat
e (%
)
Ave
rage
Ann
ual
Ear
ning
s (S
)
Em
ploy
ed in
Man
ufac
turi
ng,
Min
ing,
and
Agr
icul
ture
(%
)
Ave
rage
Gro
wth
in A
nnua
l Ret
ail
and
Who
lesa
le
Ear
ning
s (%
)Si
te(1
986)
(197
9)(P
Y 1
987-
89)
(198
7)(1
988)
(198
9)
But
te, M
ont.
107.
56.
816
,900
9.6
-5.7
Ced
ar R
apid
s, I
owa
906.
03.
617
,900
21.9
-0.5
Coo
sa V
alle
y, G
a.11
010
.76.
516
,000
42.8
2.1
Cor
pus
Chr
isti,
Tex
.36
013
.410
.218
,700
16.8
-15.
5
Dec
atur
, Ill.
150
7.8
9.2
21,1
0027
.1-1
.1
Fort
Way
ne, I
nd.
160
5.9
4.7
18,7
0033
.3-0
.1
i.) 1-.
Hea
rtla
nd, F
la.
Jack
son,
Mis
s.10
0
360
11.3
12.8
8.5
6.1
15,7
0017
,600
23.8
12.8
-0.3
-2.4
Jers
ey C
ity, N
.J.
7,00
018
.97.
321
,400
20.9
9.9
Lar
imer
Cou
nty,
Col
o.70
5.9
6.5
17,8
0021
.2-3
.1
Mar
ion,
Ohi
o12
07.
27.
018
,600
37.7
1.7
Nor
thw
est M
inne
sota
1011
.18.
014
,100
23.0
2.4
Oak
land
, Cal
if.
6,62
016
.06.
823
,000
14.6
3.0
Om
aha,
Neb
.55
06.
74.
318
,400
11.8
1.8
Prov
iden
ce, R
.I.
4,68
012
.13.
817
,900
28.0
9.7
Spri
ngfi
eld,
Mo.
8010
.15.
515
,800
19.4
-1.8
Site
Ave
rage
(b)
1,27
910
.26.
618
,100
22.8
0.0
Nat
iona
l Ave
rage
(b)
733
9.7
6.6
18,1
6723
.41.
5
SOU
RC
ES:
JT
PA A
nnua
l Sta
tus
Rep
orts
(JA
SR)
for
prog
ram
yea
rs 1
987-
89. T
he J
ASR
fig
ures
on
popu
latio
n de
nsity
are
base
d on
198
6 C
ensu
s da
ta; t
he p
erce
ntag
es o
f fa
mili
es b
elow
the
pove
rty
leve
l are
bas
ed o
n 19
79 C
ensu
s da
ta.
NO
TE
S: (
a) T
he p
over
ty le
vel w
as d
efin
ed in
197
9 as
$7,
356
for
a fa
mily
of
four
with
two
child
ren.
(b)
Site
and
nat
iona
l ave
rage
s ar
e un
wei
ghte
d.; )

manufacturing and food processing center, the recovery of the mid and late 1980s was very
weak. The variation in SDAs' average earnings reflects higher average earnings in urban areas
than in rural areas (e.g., Oakland versus Northwest Minnesota) and the importance of high-
wage industries in some sites (e.g., petroleum in Corpus Christi ar' heavy manufacturing in
Decatur).11 Differences in the local economic base are further illustrated in column 5 of Table
2.2, which presents the percentage of employees in the manufacturing, mining, and agriculture
industries. The final column, on growth in retail and wholesale earnings, captures the effects
of economic conditions in each SDA. Corpus Christi's economic downturn is starkly visible
(minus 15.5 percent), as is the northeastern economic boom of the late 1980s (Jersey City with
9.9 percent and Providence with 9.7 percent). On all these measures, the sample average is
similar to the national average.
B. The Administrative Structure of the SDAs
The passage of JTPA in October 1982 established a new federal/state/local service delivery
system to provide employment and training services to the economically disadvantaged. It also
gave new areas of discretion within certain requirements to local SDAs in managing and
administering the provision of services. Chapter 1 outlined the key changes in the nation's
employment and training system brought about by the passage of JTPA; this section identifies
three areas of discretion in which the responses of the 16 study SDAs varied substantially.
1. The local ITPA service delivery system. The federal statute assigned responsibility
for the delivery of services funded under Title II-A of JTPA to local level SDAs. Congress
envisioned a "partnership" between government and business specifically, between the elected
officials of the local government and representatives of the private sector and created a
forum for this in the newly created PICs. But much was left to negotiations at the local level.
Specifically, negotiations would determine which entity the government, the PIC, or
some combination of both would play the following roles:
the grant recipient, which received and was held legally responsible for theJTPA funds allocated to the SDA by the state, and
Average earnings are calculated by dividing the total payroll reported to federal and stateunemployment insurance programs by employers in the SDA by the number of employees in the SDA.
22

the administrative entity, which administered the program, includingdeveloping the plan, selecting contractors, recruiting clients, and arrangingservices.
If local negotiations determined that the PIC would play either or both of these roles, then the
PIC would have to formally incorporate (in order to receive public funds) and hire staff to
conduct the business of the PIC. Even in situations in which PICs did not perform either of
these functions, they often established their own identity separate from the government by
incorporating and/or hiring their own staff.
The choices that the government and PICs made in the 16 SDAs in the JTPA study are
shown in Table 2.3.12 In six SDAs (labeled "Government-Operated"), the local government (or
consortium of contiguous governments) acted as both grant recipient and administrative entity
and the PIC chose not to incorporate or to have separate PIC staff. In another three SDAs
(labeled "PIC-Operated"), the PIC was an incorporated body with its own staff and served as
administrative entity and grant recipient. In the remaining seven, the government and PIC
shared responsibilities and/or had various staffing arrangements.
2. The selection and role of service providers. The federal statute also assigns to
the SDA the responsibility for selecting and defining the roles of JTPA service providers,
which can range from public agencies and community-based and other nonprofit organizations
to private for-profit companies.13 As Table 2.4 shows, during the period of random
assignment, service providers for employment, training, and education services varied across the
16 study SDAs. Perhaps surprisingly, the arrangement of OJTs i.e., the placement of clients
in OJT slots in subsidized training in either the private or public sector involved private for-
profit agencies in only 2 SDAs. More commonly, OJT was run directly by SDA staff in 11
SDAs, with the state employment or job service a traditional provider of OJT also playing
a role in 2 of these SDAs. Table 2.4 also shows that public education institutions
vocational - technical schools, community colleges, or universities were providers of classroom
training in 14 sites; and that proprietary schools were providers in 8 of the 16 SDAs. Further,
job search assistance was provided by a range of agencies, but most typically by either the SDA
12The SDAs are grouped by their status at the start of the study. The notes to the table indicatelater changes.
13Through its state coordination and special services plan, the state can influence this decision.
23
C.7
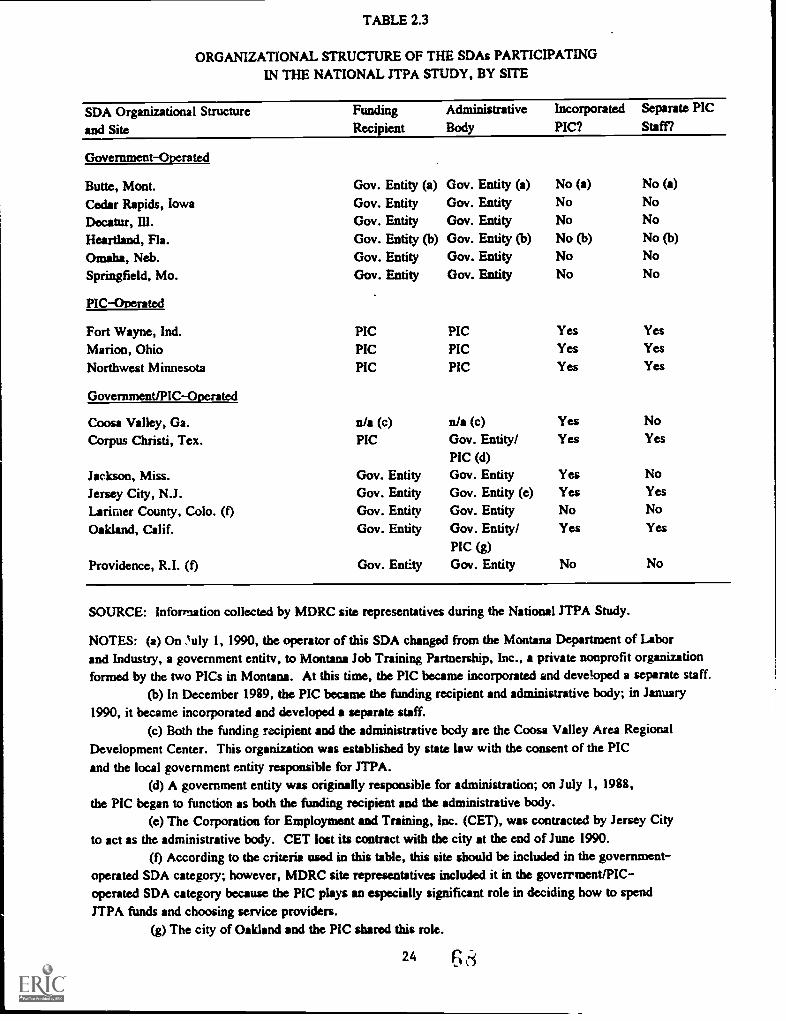
TABLE 2.3
ORGANIZATIONAL STRUCTURE OF THE SDAs PARTICIPATINGIN THE NATIONAL JTPA STUDY, BY SITE
SDA Organizational Structure Funding Administrative Incorporated Separate PIC
and Site Recipient Body PIC? Staff?
Government-Operated
Butte, Mont. Gov. Entity (a) Gov. Entity (a) No (a) No (a)
Cedar Rapids, Iowa Gov. Entity Gov. Entity No No
Decatur, Ill. Gov. Entity Gov. Entity No No
Heartland, Fla. Gov. Entity (b) Gov. Entity (b) No (b) No (b)
Omaha, Neb. Gov. Entity Gov. Entity No No
Springfield, Mo. Gov. Entity Gov. Entity No No
PIC-Operated
Fort Wayne, Ind. PIC PIC Yes Yes
Marion, Ohio PIC PIC Yes Yes
Northwest Minnesota PIC PIC Yes Yes
Government/P1C-Operated
Coosa Valley, Ga. n/a (c) n/a (c) Yes No
Corpus Christi, Tex. PIC Gov. Entity/ Yes Yes
PIC (d)Jackson, Miss. Gov. Entity Gov. Entity Yes No
Jersey City, N.J. Gov. Entity Gov. Entity (e) Yes Yes
Larirner County, Colo. (f) Gov. Entity Gov. Entity No No
Oakland, Calif. Gov. Entity Gov. Entity/ Yes Yes
PIC (g)Providence, R.I. (f) Gov. Entity Gov. Entity No No
SOURCE: Information collected by MDRC site representatives during the National JTPA Study.
NOTES: (a) On 'uly 1, 1990, the operator of this SDA changed from the Montana Department of Laborand Industry, a government entity, to Montana Job Training Partnership, Inc., a private nonprofit organizationformed by the two PICs in Montana. At this time, the PIC became incorporated and developed a separate staff.
(b) In December 1989, the PIC became the funding recipient and administrative body; in January1990, it became incorporated and developed a separate staff.
(c) Both the funding recipient and the administrative body are the Coosa Valley Area RegionalDevelopment Center. This organization was established by state law with the consent of the PICand the local government entity responsible for JTPA.
(d) A government entity was originally responsible for administration; on July 1, 1988,the PIC began to function as both the funding recipient and the administrative body.
(e) The Corporation for Employment and Training, Inc. (CET), was contracted by Jersey Cityto act as the administrative body. CET lost its contract with the city at the end of June 1990.
(f) According to the criteria used in this table, this site should be included in the government-operated SDA category; however, MDRC site representatives included it in the goverrment/PIC-operated SDA category because the PIC plays an especially significant role in deciding how to spendJTPA funds and choosing service providers.
(g) The city of Oakland and the PIC shared this role.
24 6 ,,.,
1
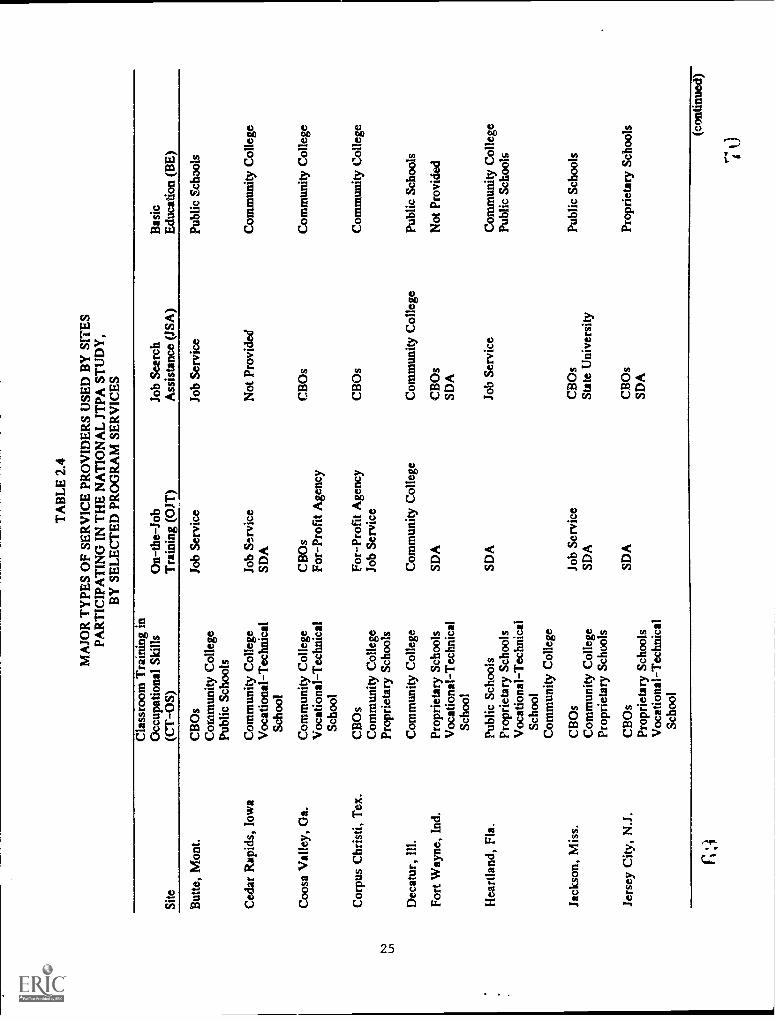
TA
BL
E 2
.4
MA
JOR
TY
PES
OF
SER
VIC
E P
RO
VID
ER
S U
SED
BY
SIT
ES
PAR
TIC
IPA
TIN
G I
N T
HE
NA
TIO
NA
L J
TPA
ST
UD
Y,
BY
SE
LE
CT
ED
PR
OG
RA
M S
ER
VIC
ES
Cla
ssro
om T
rain
ing
inO
ccup
atio
nal S
kills
On-
the-
Job
Job
Sear
chB
asic
Site
(CT
-OS)
Tra
inin
g (O
JT)
Ass
ista
nce
(JSA
)E
duca
tion
(BE
)
But
te, M
ont.
CB
Os
Job
Serv
ice
Job
Serv
ice
Publ
ic S
choo
lsC
omm
unity
Col
lege
Publ
ic S
choo
ls
Ced
ar R
apid
s, I
owa
Com
mun
ity C
olle
geJo
b Se
rvic
eV
ocat
iona
l-T
echn
ical
SDA
Scho
ol
Coo
sa V
alle
y, G
a.C
omm
unity
Col
lege
CB
Os
Voc
atio
nal-
Tec
hnic
alFo
r-Pr
ofit
Age
ncy
Scho
ol
Cor
pus
Chr
isti,
Tex
.C
BO
sFo
r-Pr
ofit
Com
mun
ity C
olle
geJo
b Se
rvic
ets
.)Pr
opri
etar
y Sc
hool
s
Dec
atur
, Ill.
Com
mun
ity C
olle
geC
omm
unity
Col
lege
Fort
Way
ne, I
nd.
Prop
riet
ary
Scho
ols
SDA
Voc
atio
nal-
Tec
hnic
alSc
hool
Hea
rtla
nd, F
la.
Jack
son,
Mis
s.
Jers
ey C
ity, N
.J.
Not
Pro
vide
dC
omm
unity
Col
lege
CB
Os
Com
mun
ity C
olle
ge
CB
Os
Com
mun
ity C
olle
ge
Com
mun
ity C
olle
gePu
blic
Sch
ools
CB
Os
Not
Pro
vide
dSD
A
Publ
ic S
choo
lsSD
AJo
b Se
rvic
eC
omm
unity
Col
lege
Prop
riet
ary
Scho
ols
Publ
ic S
choo
lsV
ocat
iona
l-T
echn
ical
Scho
olC
omm
unity
Col
lege
CB
Os
Job
Serv
ice
CB
Os
Publ
ic S
choo
lsC
omm
unity
Col
lege
SDA
Stat
e U
nive
rsity
Prop
riet
ary
Scho
ols
CB
Os
SDA
CB
Os
Prop
riet
ary
Scho
ols
Prop
riet
ary
Scho
ols
SDA
Voc
atio
nal-
Tec
hnic
alSc
hool
(con
tinue
d)
7 t)
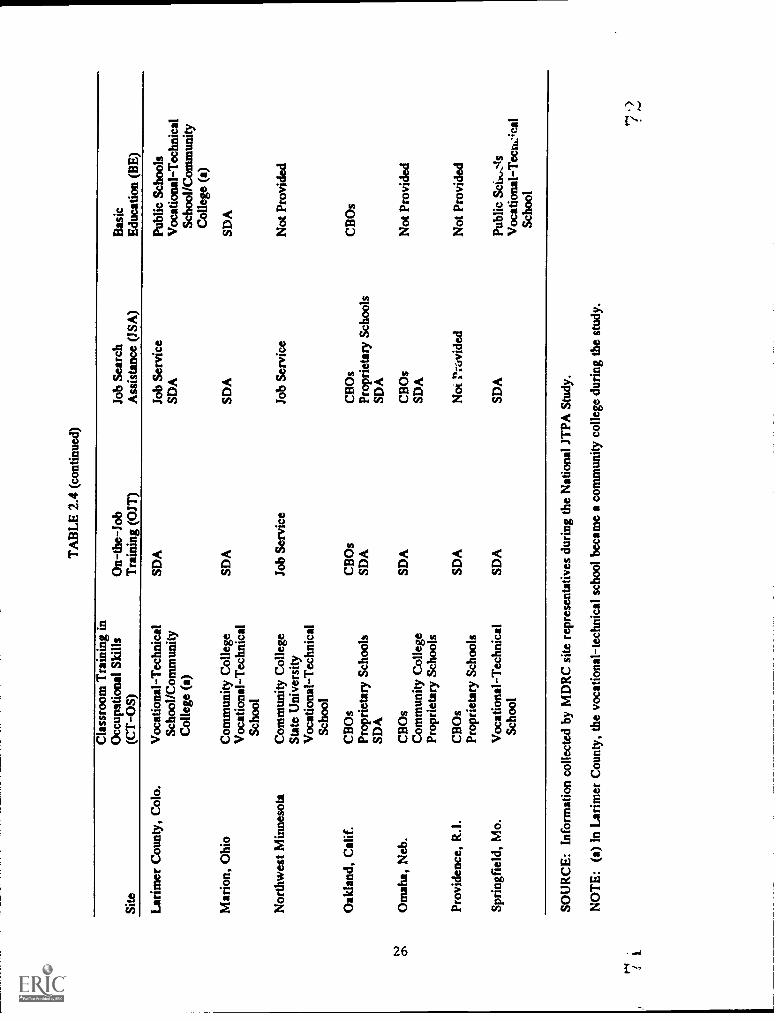
TA
BL
E 2
.4 (
cont
inue
d)
Cla
ssro
om T
rain
ing
inO
ccup
atio
nal S
kills
On-
the-
Job
Job
Sear
chB
asic
Site
(CT
-OS)
Tra
inin
g (O
JT)
Ass
ista
nce
(JSA
)E
duca
tion
(BE
)
Lar
imer
Cou
nty,
Col
o.V
ocat
iona
l-T
echn
ical
SDA
Job
Serv
ice
Publ
ic S
choo
lsSc
hool
/Com
mun
itySD
AV
ocat
iona
l-T
echn
ical
Col
lege
(a)
Scho
ol/C
omm
unity
Col
lege
(a)
Mar
ion,
Ohi
o
Nor
thw
est M
inne
sota
Com
mun
ity C
olle
geV
ocat
iona
l-T
echn
ical
Scho
ol
SDA
Com
mun
ity C
olle
geJo
b Se
rvic
eSt
ate
Uni
vers
ityV
ocat
iona
l-T
echn
ical
Scho
ol
SDA
SDA
Job
Serv
ice
Not
Pro
vide
d
Oak
land
, Cal
if.
CB
Os
CB
Os
CB
Os
CB
Os
Prop
riet
ary
Scho
ols
SDA
Prop
riet
ary
Scho
ols
SDA
SDA
t..) a.
Om
aha,
Neb
.C
BO
sSD
AC
BO
sN
ot P
rovi
ded
Com
mun
ity C
olle
geSD
APr
opri
etar
y Sc
hool
s
Prov
iden
ce, R
.I.
CB
Os
SDA
Not
Pro
vide
dN
ot P
rovi
ded
Prop
riet
ary
Scho
ols
Spri
ngfi
eld,
Mo.
Voc
atio
nal-
Tec
hnic
alSD
ASD
APu
blic
Sci
l,:ls
Scho
olV
ocat
iona
l-T
ecku
.:;ca
lSc
hool
SOU
RC
E: I
nfor
mat
ion
colle
cted
by
MD
RC
site
rep
rese
ntat
ives
dur
ing
the
Nat
iona
l JT
PA S
tudy
.
NO
TE
: (a)
In
Lar
imer
Cou
nty,
the
voca
tiona
l-te
chni
cal s
choo
l bec
ame
a co
mm
unity
col
lege
dur
ing
the
stud
y.
.f1
7 .)

or the job service, or both. Basic education, when it was offered, was provided by public
education in 9 of 12 cases. But it was not offered in 4 SDAs, at least not as an identifiable
stand-alone activity.
The provision of recruitment and assessment was largely an SDA staff function, rather
than being contracted out to other organizations (see Table 2.5). SDAs were responsible for
most or all recruitment activities in 10 of the 16 SDAs, while service providers were
responsible for most or all recruitment in 4, and in 2 SDAs the function was shared equally.
Most or all of the client screening and assessment were done by SDA staff in 9 sites, and by
service provider staff in 4. In the remaining 3, both organizations played a role.
3. Types of contracts. SDAs had a choice of structuring their legal relationship with
contractors in one of two quite different ways:
cost-reimbursement contracts, in which the contractor was paid for servicesrendered regardless of the outcome for the enrollees, or
fixed unit price, performance-based contracts, in which full payment was,by law, contingent on enrollees' achieving specific outcomes such as jobplacement in a training-related job at a certain wage rate for a specifiedperiod of time.
SDAs' choice of performance-based contracts has provoked considerable controversy. They can
create incentives for the contractor to screen applicants carefully before accepting them,
because of the risk of financial loss. (This risk was alleged to discourage service providers
from accepting hard-to-serve clients.) There was, however, a major financial incentive for
SDAs to adopt fixed unit price contracts: all costs of these contracts could be charged to the
"training" cost category and none to administration, which had a ceiling of 15 percent of all
local expenditures and was the source of funding for local planning, management, and other
administrative tasks. In addition, SDAs that emphasized importance of surpassing their
performance standards could "pass through" the obligation to meet or exceed them by
structuring their performance-based service provider contracts to link payment to success in
achieving or exceeding these benchmarks. With cost-reimbursement contracts, in contrast, the
contractor's costs had to be charged to their proper cost category; some of the funds expended
under these contracts were typically charged to "administration." During the 1980s,
performance-based contracts became a common and controversial feature of JTPA, with
27

TABLE 2.5
ROLES OF SDAs AND SERVICE PROVIDERS AT SELECTED POINTSIN THE CLIENT FLOW, BY SITE
Who Is Responsiblefor Recruitment?
Who Is Responsiblefor Intake?
Who Is Responsiblefor Screening and
Assessment?Service Service Service
Site SDA Provider SDA Provider SDA Provider
Butte, Mont. (a) None All None All None AllCedar Rapids, Iowa Most Some Most Some Most SomeCoosa Valley, Ga. (b) Some Most None All None AllCorpus Christi, Tex. Most Some Most Some Some SomeDecatur, Ill. All None All None All NoneFort Wayne, Ind. AU None All None All NoneHeartland, Fla. Some Most All None Most SomeJackson, Miss. Some Some Some Some Some SomeJersey City, N.J. Most Some Most Some Some SomeLarimer County, Colo. All None All None Most SomeMarion, Ohio All None All None Most SomeNorthwest Minnesota (c) Some Some None All None AllOakland, Calif. Some Most Some Most Some MostOmaha, Neb. Most Some Most Some Most SomeProvidence, R.I. Most Some Most Some Most SomeSpringfield, Mo. Most Some Most Some Most Some
SOURCE: Information collected by MDRC site representatives during the National JTPA Study.
NOTES: (a) In Montana, the state contracted with the Montana Job Service Division, a serviceprovider, to operate the JTPA program.
(b) In Coosa Valley, staff of Berry College, a service provider, are solely responsiblefor intake, screening, and initial assessment. Other service providers can perform furtherassessment.
(c) Northwest Minnesota's primary service provider, the Minnesota Job Service, is solelyresponsible for intake and assessment under a contract with the PIC.
28

disputes over their use and allegations that some service providers received "excess revenue"
or profits, leading to revisions of contracting rules by DOL, investigations of alleged abuses by
DOL's Office of Inspector General, and legislative proposals for reforms.14
As Table 26 shows, the SDAs varied considerably in the percentage of training costs
spent through performance-based contracts. Seven SDAs did not use performance-based
contracts at all, and an eighth used them only slightly. At the other extreme, three SDAs
(Coosa Valley, Jackson, and Northwest Minnesota) used performance-based contracts for more
than 50 percent of both adult and youth training expenditures.
C. Characteristics of Program Terminees
Tables 2.7 and 2.8 provide information on the characteristics of individuals leaving
programs funded under Title II-A of JTPA ("program terminem"), by study site, during
program years 1987 through 1989, which included the period of random assignment.15 On all
these measures, the average for the study sites was similar to that for all SDAs.16 The large
differences in the ethnic distribution of terminees across the sites, shown in Table 2.7, primarily
reflect differences in the local population. In general, SDAs from metropolitan areas have a
much higher proportion of black and Hispanic (and in some cases Asian) terminees than is the
case in rural areas. Corpus Christi (79 percent), Jackson (86 percent), Jersey City (95
percent), and Oakland (93 percent) have the highest percentages of nonwhite and Hispanic
terminees.
Table 2.8 shows the proportion of terminees for each of seven obstacles to employment;
14For DOL's response in the late 1980s, see Federal Register, 1989. For an example of theInspector General's criticisms, see U.S. Department of Labor, Inspector General, 1991.
15Terminees served between program years 1987 and 1989 will be a larger group than the 18-month treatment group sample analyzed in this report for several reasons. First, random assignmentwas not done for the entire three years in any site; random assignment began in the earliest site inNovember 1987 and ended in the last site in September 1989. Second, the study excludes in-schoolyouths and the summary statistics on people served include them. Finally, there were some limited site-specific exclusions from random assignment when local programs faced severe recruitment difficultiesin meeting enrollment targets for particular groups or program intake was decentralized to organizations
serving few people.14Again, these are unweighted averages using SDA data from the JTPA Annual Status Report for
both the study sites and the national program. This method of calculating averages was chosen because
the SDA, rather than the individual, is the focus of the analysis in this chapter and fbr case ofpresentation. An earlier report on the baseline characteristics of the entire study sample (Bloom, 1991)examined similar issues using individual data and also found that the study sample closely resembles
national program terminees.
29

TABLE 2.6
LEVEL OF USE OF PERFORMANCE-BASED CONTRACTSAMONG SITES IN THE NATIONAL JTPA STUDY,
FOR ADULTS AND YOUTHS
Level of Useand Site
Percentage of AdultTraining Expenditures
Resulting from Performance-Based Contracts (a)
Level of Useand Site
Percentage of YouthTraining Expenditures
Resulting from Performance-Based Contracts (a)
High Use (b) Hiab Use (b)
Coosa Valley, Ga. 83 Jackson, Miss. 80Northwest Minnesota 61 Coosa Valley, Ga. 80Jackson, Miss. 60 Northwest Minnesota 68
Oakland, Calif. 65Moderate Use (c) Corpus Christi, Tex. 51
Corpus Christi, Tex. 46 Moderate Use (c)Omaha, Neb. 38Oakland, Calif. 37 Omaha, Neb. 28Providence, R.I. 25 Heartland, Fla. 21Heartland, Fla. 22 Providence, R.I. 18
Little or No Use (d) Little or No Use (di
Butte, Mont. 2 Butte, Mont. 0Cedar Rapids, Iowa 0 Cedar Rapids, Iowa 0Decatur, III. 0 Decatur, Ill. 0Fort Via Ind. 0 Fort Wayne, Ind. 0Jersey City, N.J. 0 Jersey City, N.J. 0Larimer County, Colo. 0 Larimer County, Colo. 0Marion, Ohio 0 Marion, Ohio 0Springfield, Mo. 0 Springfield, Mo. 0
SOURCE: MDRC calculations from program year 1988 fiscal records collected by Abt Associates Inc.from the 16 SDAs.
NOTES: Under a JTPA performance-based contract, service providers can receive partial paymentsonly when they attain performance benchmarks. Also, full payment under these contracts iscontingent upon three conditions: completion of training, placement in a training-relatedjob, and receipt of a specified wage. All payments made under these contracts can becharged to training expenditures.
(a) In some SDAs, the total for training expenditures includes some JTPA "8 percent" educationfunds, which are spent in the SDA but are not under the direct control of SDA staff. This may affect thepercentages listed, but does not change the composition of the level of use categories.
(b) A site had "high use" of performance-based contracts if payments under this type ofcontract accounted for over 50 percent of total Title II-A training expenditures.
(c) A site had "moderate use of performance-based contracts if payments under this type ofcontract accounted for 15 to 49 percent of total Title II-A training expenditures.
(d) A site had "little or no use of performance-based contracts if priments under this typeof contract accounted for under 15 percent of total Title II-A training expenditures.
30
76

TA
BL
E 2
.7
SEL
EC
TE
D C
HA
RA
CT
ER
IST
ICS
OF
JTPA
TIT
LE
II-
A T
ER
MIN
EE
S, B
Y S
ITE
Age
Eth
nici
tyW
hite
,N
on-H
ispa
nic
Bla
ck,
Non
-His
pani
cH
ispa
nic
Oth
erM
ale
14-2
130
and
Ove
rSi
te(%
)(%
)(%
)(%
)(%
)(%
)(%
)
But
te, M
ont.
4039
3589
.80.
23.
46.
6C
edar
Rap
ids,
Iow
a52
5028
86.5
8.6
1.1
3.8
Coo
sa V
alle
y, G
a.37
4329
79.7
19.7
0.2
0.4
Cor
pus
Chr
isti,
Tex
.46
4530
20.6
7.6
71.1
0.7
Dec
atur
, III
.52
4434
60.2
39.0
0.4
0.4
Fort
Way
ne, I
nd.
5246
3074
.222
.22.
90.
7H
eart
land
, Fla
.44
4229
57.3
37.3
5.0
0.4
(.1 -.
Jack
son,
Mis
s.Je
rsey
City
, N.J
.
47 4058 55
20 2214
.25.
485
.467
.60.
121
.30.
35.
7L
arim
er C
ount
y, C
olo.
3720
5477
.91.
717
.33.
1
Mar
ion,
Ohi
o54
4137
94.8
3.1
1.5
0.6
Nor
thw
est M
inne
sota
4947
3194
.60.
13.
02.
3
Oak
land
, Cal
if.
4544
377.
467
.96.
118
.6
Om
aha,
Neb
.36
3732
41.9
51.0
4.4
2.7
Prov
iden
ce, R
.I.
5445
3134
.437
.921
.36.
4
Spiin
gfie
ld, M
o.48
3932
95.2
2.9
0.6
1.3
Site
Ave
rage
4644
3258
.428
.310
.03.
3
Nat
iona
l Ave
rage
4644
3160
.525
.69.
64.
3
SOU
RC
ES:
JT
PA A
nnua
l Sta
tus
Rep
orts
(JA
SR)
for
prog
ram
yea
rs
NO
TE
: Dat
a ar
e av
erag
es f
or a
ll JT
PA T
itle
II-A
term
inee
s du
ring
pro
gram
yea
rs 1
987-
89, i
nclu
ding
in-s
choo
l you
ths.

1
TA
BL
E 2
.8
SEL
EC
TE
D C
HA
RA
CT
ER
IST
ICS
OF
JTPA
TIT
LE
II-
A T
ER
MIN
EE
ST
HA
T A
RE
OB
STA
CL
ES
TO
EM
PLO
YM
EN
T, B
Y S
ITE
Dro
pped
Out
of S
choo
l
Une
mpl
oyed
for
15
Wee
ks o
r M
ire
Dur
ing
Past
26
Wee
ksL
ong-
term
AFD
C R
ecip
ient
(a)
Lim
ited
Eng
lish
Prof
icie
ncy
Han
dica
pped
(b)
Rea
ds B
elow
7th-
Gra
deL
evel
Eve
rA
rres
ted
Site
(%)
(%)
(%)
(%)
(%)
(%)
(%)
But
te, M
ont.
1564
10
195
10C
edar
Rap
ids,
Iow
a18
7411
223
116
Coo
sa V
alle
y, G
a.42
84
014
312
Cor
pus
Chr
isti,
Tex
.41
498
14
338
Dec
atur
, Ill.
1139
160
1026
10Fo
rt W
ayne
, Ind
.25
332
015
177
Hea
rtla
nd, F
la.
307
61
1317
13Ja
ckso
n, M
iss.
2542
210
1121
3Je
rsey
City
, N.J
.27
437
34
43
La N
Lar
imer
Cou
nty,
Col
o.M
ario
n, O
hio
21 2557 73
3 91 0
14 2312 23
5 7N
orth
wes
t Min
neso
ta12
4113
017
104
Oak
land
, Cal
if.
1725
2517
1125
5O
mah
a, N
eb.
1849
160
109
4Pr
ovid
ence
, R.I
.37
457
124
297
Spri
ngfi
eld,
Mo.
2834
31
37
4
Site
Ave
rage
2543
103
1218
6
Nat
iona
l Ave
rage
2540
93
1421
8
SOU
RC
ES:
JT
PA A
nnua
l Sta
tus
Rep
orts
(JA
SR)
for
prog
ram
yea
rs 1
987-
89.
NO
TE
S: D
ata
are
aver
ages
for
all
JTPA
Titl
e II
-A te
rmin
ees
duri
ng p
rogr
am y
ears
198
7-89
, exc
ept d
ata
on lo
ng-t
erm
AFD
C r
ecei
pt a
nd r
eadi
ngle
vel,
whi
ch a
re a
vera
ges
for
term
inee
s du
ring
pro
gram
yea
rs 1
988
and
1989
onl
y.1'
(a)
A lo
ng-t
erm
AFD
C r
ecip
ient
is d
efin
ed in
JA
SR (
PYI9
88)
as a
per
son
who
rec
eive
d (o
r w
hose
fam
ily r
ecei
ved)
AFD
Cpa
ymen
tsfo
r an
y 24
or
mor
e of
the
30 m
onth
s pr
ior
to J
TPA
elig
ibili
ty d
eter
min
atio
n.(b
) JA
SR (
PY19
88)
defi
nes
"han
dica
pped
" as
a p
hysi
cal o
r m
enta
l dis
abili
ty th
at c
onst
itute
s or
res
ults
in a
sub
stan
tial b
arri
erto
em
ploy
men
t for
an
indi
vidu
al.

in general, tIty average for the study sites was similar to that for the nation. Six of these seven
obstacles affected, on average, 25 percent or fewer of both study site and national program
terminees, the exception being "unemployed for 15 weeks or more during the past 26 weeks."
Sites varied widely in the proportion of terminees for each measure. For example, Coosa
Valley, Corpus Christi, and Providence had terminees with the greatest educational problems,
based on their high percentages of school dropouts and low-level readers; Butte and Cedar
Rapids had terminees with the longest spells of unemployment and the most chance of having
a physical handicap.
D. Program Scale, Duration of Service, and Cost
Site Title II-A programs varied greatly in scale and average duration of enrollment, as
shown in Table 2.9. The study site average for number of terminees is below the national
average because the study sites do not include any very large SDAs,17 but on the other
measures the averages for the study sites and the nation are similar. 13 in duration
of service among the study sites are seen in the wide range of average number of weeks
enrolled: for adults, this ranged from 7.67 in Jackson to 34 in Corpus Christi; for youths, the
range was from 533 in Omaha to 33 in Corpus Christi. Program costs per adult terminee
reflect both the length of enrollment and the higher service costs (based on higher rent and
salaries) in large metropolitan areas such as Jersey City and Oakland.
E. Site Performance Standards
JTPA performance standards, as discussed in Chapter 1, assess program success in
achieving a variety of program goals. Thus, it is important to ascertain whether the study sites
are top performers under this system or include SDAs with the diversity of performance seen
nationally. Tables 2.10 and 2.11 show that the study sites do include such diversity and as a
group performed about the same as the national average.
These tables show data for program year 1988, the year with the largest proportion of
the 18-month study sample. For each of the three post-program outcomes listed, the tables
show (1) the actual performance of the SDA, (2) the performance that was "predicted" by the
17As dm' cussed earlier in this chapter, no SDAs with very few terminees were included among thestudy sites, but this exclusion affected the average number of terminees in the study sites less than thelack of very large SDAs.
33

TABLE 2.9
SELECTED CHARACTERISTICS OF THE JTPA TITLE II-A PROGRAMSAT THE NATIONAL JTPA STUDY STIES
Site
Average Numberof Terminees(PY 1987-89)
Average Number of Months EnrolledFederal Program
Cost Per AdultTerminee ($)(PY1987-89)
Adults(PY1987-89)
Youths(PY1987-89)
Butte, Mont. 576 4.85 4.46 2,665Cedar Rapids, Iowa 658 7.24 5.39 2,212Coosa Valley, Ga. 1,063 2.70 3.54 2,481Corpus Christi, Tex. 1,049 7.85 7.62 2,570Decatur, Ill. 525 6.77 5.77 3,039Fort Wayne, Ind. 1,195 3.70 7.16 1,561Heartland, Fla. 1,793 3.54 5.54 1,782Jackson, Miss. 1,227 1.77 3.46 1,897Jersey City, N.J. 853 3.62 3.23 3,637Larimer County, Colo. 354 7.39 6.00 1,937Marion, Ohio 714 6.24 6.08 2,199Northwest Minnesota 430 6.62 6.54 2,371Oakland, Calif. 1,396 3.77 3.93 2,539Omaha, Neb. 1,111 2.46 2.85 2,404Providence, R.I. 503 1.62 1.23 2,841Springfield, Mo. 938 4.00 3.93 1,898
Site Average 899 4.63 4.80 2,377
National Average 1,177 4.57 4.97 2,241
SOURCES: JTPA Annual Status Reports (JASR) for program years 1987-89.
NOTE: Data are averages for all JTPA Title II-A terminees during program years 1987-89.
34
S

TABLE 2.10
JTPA PROGRAM OUTCOMES FOR ADULTS, BY SITE
Adult Entered Employment RateActual Predicted (a)
Site (%) (%) Difference
Butte, Mont. 74.0 67.1 6.9
Cedar Rapids, Iowa 76.9 73.1 3.8
Coosa Valley, Ga. 83.5 68.2 15.3
Corpus Christi, Tex. 72.0 67.1 4.9
Decatur, RI. 79.4 65.1 14.3
Fort Wayne, Ind. 84.0 72.4 11.6
Heartland, Fla. 74.5 68.7 5.8
Jackson, Miss. 67.6 69.2 -1.6Jersey City, N.J. 86.5 64.2 22.3
Latimer County, Colo. 68.0 69.5 -1.5
Marion, Ohio 55.5 59.4 -3.9
Northwest Minnesota 73.5 69.1 4.4
Oakland, Calif. 67.4 66.1 1.3
Omaha, Neb. 65.0 65.7 -0.7
Providence, R.I. 74.3 70.2 4.1
Springfield, Mo. 89.0 76.4 12.6
Site Average 74.5 68.2 6.2
National Average 74.2 67.3 6.9
SOURCE: JTPA Annual Status Report (JASR) for program year 1988.
NOTES: There may be slight discrepancies in the reported differences of the averagesbecause of rounding, and there may be small adjustments to the 'rates that weremade by states and not reported in JASR.
(a) The predicted entered employment rate based on the JTPA performance
standard reported in JASR (PY1988).
35

TA
BL
E 2
.11
JTPA
PR
OG
RA
M O
UT
CO
ME
S FO
R Y
OU
TH
S, B
Y S
ITE
You
th P
ositi
ve T
erm
inat
ion
Rat
e (a
)Y
outh
Ent
ered
Em
ploy
men
t Rat
e
Site
Act
ual
(%)
Pred
icte
d (b
).(
%)
Dif
fere
nce
Act
ual
(%)
Pred
icte
d (c
)
(%)
Dif
fere
nce
But
te, M
ont.
8676
1056
4511
Ced
ar R
apid
s, I
owa
6678
-12
6050
10
Coo
sa V
alle
y, G
a. (
d)n/
an/
an/
a48
417
Cor
pus
Chr
isti,
Tex
.78
726
4848
0D
ecat
ur, I
ll.74
740
2510
15
Fort
Way
ne, I
nd.
7775
250
3812
Hea
rtla
nd, F
la.
7774
349
3514
Jack
son,
Mis
s.76
724
3444
-10
Jers
ey C
ity, N
.J. (
d)85
805
n/a
n/a
n/a
Lar
imer
Cou
nty,
Col
o. (
d)72
74-2
n/a
n/a
n/a
Mar
ion,
Ohi
o74
75-1
4438
6L
a o.N
orth
wes
t Min
neso
ta76
78-2
3844
-6O
akla
nd, C
alif
.73
78-5
5045
5
Om
aha,
Neb
. (d)
8173
8n/
an/
an/
aPr
ovid
ence
, R.I
.75
78-3
5446
8
Spri
ngfi
eld,
Mo.
9476
1870
5614
Site
Ave
rage
7875
248
427
Nat
iona
l Ave
rage
8175
550
419
SOU
RC
E: J
TPA
Ann
ual S
tatu
s R
epor
t (JA
SR)
for
prog
ram
yea
r 19
88.
NO
TE
S: T
here
may
be
slig
ht d
iscr
epan
cies
in th
e re
port
ed d
iffe
renc
es o
f th
e av
erag
es b
ecau
se o
f ro
undi
ng.
(a)
A p
ositi
ve te
rmin
atio
n is
def
ined
by
JTPA
as
ente
ring
em
ploy
men
t; at
tain
ing
reco
gniz
ed e
mpl
oym
ent c
ompe
tenc
ies
esta
b-lis
hed
by th
e PI
C; e
lem
enta
ry, s
econ
dary
, or
post
-sec
onda
ry s
choo
l com
plet
ion;
enr
ollm
ent i
n ot
her
trai
ning
pro
gram
s or
app
rent
ice-
ship
s, o
r en
listm
ent i
n th
e ar
med
for
ces;
ret
urni
ng to
sch
ool f
ull-
time;
or,
for
14-
to 1
5-ye
ar-o
lds
only
, com
plet
ing
prog
ram
obj
ectiv
es.
(b)
The
pre
dict
ed p
ositi
ve te
rmin
atio
n ra
te is
bas
ed o
n th
e JT
PA p
erfo
rman
ce s
tand
ard
repo
rted
in J
ASR
(PY
1988
).(c
) T
he p
redi
cted
ent
ered
em
ploy
men
t rat
e is
bas
ed o
n th
e JT
PA p
erfo
rman
ce s
tand
ard
repo
rted
in J
ASR
(PY
1988
).(d
) In
PY
I98
8, s
tate
s co
uld
choo
se to
use
8 o
f th
e 12
JT
PA p
erfo
rman
ce s
tand
ards
. If
a st
ate
did
not u
se a
par
ticul
arst
anda
rd, i
t may
not
hav
e re
port
ed r
elev
ant d
ata
for
JASR
, whi
ch c
ould
acc
ount
for
the
mis
sing
dat
a fo
r th
is s
ite.
DOL regression model used by most states to adjust the national performance standards to
reflect the characteristics of local terminees and labor market conditions, and (3) the difference
between actual and predicted performance. Youth positive terminations include job placement
at termination, achievement of "employment competencies," school completion, enlistment in
the armed forces, and enrollment in other non-Title II-A training programs. On all three
measures, the study sites include those that perform much better than their adjusted standard
(those with large positive numbers in the difference column), some close to this standard, and
some that fail to meet it (those with negative numbers).
II. The Sample for This Report
This section provides some basic background on the characteristics of the individuals in
the research sample for this report. The report's main focus is on the 11,474 members of the
18-month treatment group sample (defined earlier in this chapter), since the primary goal of
the analysis is to describe and analyze the nature of JTPA services provided in the study
sites.18
Table 2.12 shows that 28 percent of the treatment group were under age 22 at random
assignment, 32 percent were 22-29, 31 percent were 30-44, and 9 percent were 45 or older.
Fifty-five percent are white, 30 percent black, and 12 percent Hispanic. Thirty-six percent
were high school dropouts and had not passed the GED (General Educational Development,
or high school equivalency) examination. Fifty percent had worked fewer than 13 weeks in the
12 months before random assignment. Twenty-eight percent were receiving some type of cash
public assistance at application, and 12 percent had received Aid to Families with Dependent
Children (AFDC) for two years or more.
Behind these figures for the entire treatment group, there are differences among the
target groups analyzed in this report. As expected, males both youths and adults had a
lower rate of cash assistance receipt at random assignment and the most recent work
experience. Among adult women, the rate of receipt of cash assistance at random assignment
(41 percent) was especially high, and 53 percent of this target group were single parents. Not
surprisingly, adults were more educated than youths; 68 percent of adult men and 72 percent
18This analysis excludes the 5,557 control group members in the 18-mot.e.b! study sample.
37
t

TABLE 2.12
PERCENTAGE DISTRIBUTIONS OF SELECTED BASELINECHARACTERISTICS OF TREATMENT GROUP MEMBERS,
BY TARGET GROUP
Characteristicand Subgroup
All Target AdultGroups Men
(%) (%)
Adult MaleWomen Youths
(%) (%)
FemaleYouths
(%)
Age16-19 17.2 0.0 0.0 62.1 59.420-21 11.2 0.0 0.0 37.9 40.622-29 31.8 44.6 44.2 0.0 0.030-44 30.9 43.3 43.0 0.0 0.045 and over 8.9 12.1 12.7 0.0 0.0
EthnicityWhite, non-Hispanic 54.5 57.0 54.5 53.7 50.1Black, non-Hispanic 30.3 28.8 30.8 29.5 32.5Hispanic 11.9 9.7 11.4 14.7 15.8Other 3.3 4.5 3.3 2.1 1.7
SexFemale 54.8 0.0 100.0 0.0 100.0Male 45.2 100.0 0.0 100.0 0.0
EducationHigh school diploma or GED 63.5 68.8 71.8 40.9 50.8No high school diploma or GED 36.5 31.2 28.2 59.1 49.2
Work ExperienceWorked 13 weeks or more
in 12 months before assignment 50.1 58.5 46.2 53.0 39.5Worked fewer than 13 weeks
in 12 months before assignment 49.9 41.5 53.8 47.0 60.5
Public Assistance ReceiptNot receiving AFDC or other cash
assistance at assignment 71.7 83.5 59.2 87.6 67.3Receiving AFDC or other cash
assistance at assignment 28.3 16.5 40.8 12.4 32.7
AFDC HistoryNever received AFDC 73.2 92.2 49.6 98.4 71.5Received AFDC less than 2 years (a) 14.5 6.3 22.8 1.4 21.3Received AFDC 2 years or more (a) 12.4 1.6 27.6 0.2 7.2
Household CompositionSpouse present 23.6 35.8 22.6 10.5 11.4No spouse present, child present 28.7 7.9 53.2 4.2 35.5No spouse present, no child present 44.7 54.2 20.7 84.8 51.0
Sample Size 11,474 3,759 4,465 1,436 1,814(continued)
38

TABLE 2.12 (continued)
SOURCE: MDRC calculations from Background Information Form responses.
NOTES: Calculations for this table are based on data for all treatment group members
in the 18-month study sample.Distributions may not total 100.0 percent because of rounding.
(a) The AFDC receipt may not have been continuous.
39
S8

of adult women were high school graduates or had passed the GED test compared with 41
percent for male youths and 51 percent for female youths. Later chapters will return to a
more detailed discussion of the characteristics of this sample and how these characteristics
affect service recommendations within JTPA and enrollment in the program. This analysis
seeks to contribute to the ongoing national debate on how well JTPA term, individuals with
various key barriers to employment, men and women, and white and minority individuals.
Reports by the U.S. General Accounting Office have Analyzed JTPA services and
outcomes for subgroups defined by gender, ethnicity, and measures of job-readiness including
education, public assistance receipt, and recent work experience.19 In light of this continuing
interest in how JTPA serves the needs of minority and less employable applicants, subsequent
chapters in this report (and the 18-month impact report) will analyze separate subgroups
defined by ethnicity and employment barriers.
Following a framework similar to these existing studies, this report identifies individuals
as facing key employment barriers based on three factors:
education: individuals who have not received a high school diploma or passedthe GED test at random assignment,
work experience: individuals who worked fewer than 13 weeks in the 12months before random assignment, and
public assistance receipt: individuals who were receiving AFDC or othercash assistance at random assignment.
Table 2.13 shows the proportion of the entire treatment group and of the target groups
facing none, one, two, or three of these barriers to employment. As was mentioned earlier in
this chapter, many individuals in the sample do not face these barriers. In fact, 32 percent of
the sample have none of these barriers, and another 38 percent have only one.
Behind these summary numbers, however, there are important differences among the
target groups. Adult men as a group face the fewest barriers to employment; 81 percent have
one barrier or none. At the other extreme, only 58 percent of female youths have one barrier
or none.
Since subgroups based on the number of barriers to employment are analyzed in the
"See U.S. General Accounting Office, 1989, 1990, and 1991.
40

TABLE 2.13
PERCENTAGE DISTRIBUTIONS OF EMPLOYMENT BARRIER SUBGROUPSFOR TREATMENT GROUP MEMBERS,
BY TARGET GROUP
Number of All Target Adult Adult Male FemaleEmployment Groups Men Women Youths YouthsBarriers (a) (%) (%) (%) (%) (%)
None 31.6 40.3 29.6 25.9 22.9
1 38.4 40.5 36.6 42.4 35.0
2 23.5 16.3 26.1 26.8 29.6
3 6.5 2.9 7.6 5.0 12.4
Total 100.0 100.0 100.0 100.0 100.0
Sample Size 11,474 3,759 4,465 1,436 1,814
SOURCE: MDRC calculations from Background Information Form responses.
NOTES: Calculations for this table are based on data for all treatment group members in the18-month study sample.
Distributions may not total 100.0 percent because of rounding.(a) The barriers to employment include: not having a high school diploma or GED at
the time of random assignment; having worked fewer than 13 weeks during the 12 monthsprior to random assignment; and receiving AFDC or other cash assistance at the time ofrandom assignment.
41 n')

TA
BL
E 2
.14
PER
CE
NT
AG
E D
IST
RIB
UT
ION
S O
F E
MPL
OY
ME
NT
BA
RR
IER
SUB
GR
OU
PSFO
R T
RE
AT
ME
NT
GR
OU
P M
EM
BE
RS,
BY
SE
LE
CT
ED
BA
SEL
INE
CH
AR
AC
TE
RIS
TIC
S A
ND
TA
RG
ET
GR
OU
P
Cha
ract
eris
tic
AU
Tar
get
Gro
ups
Adu
lt M
enA
dult
Wom
enM
ale
You
ths
Fem
ale
You
ths
Em
ploy
men
t Bar
rier
sE
mpl
oym
ent B
arri
ers
Em
ploy
men
t Bar
rier
sE
mpl
oym
ent B
arri
ers
Em
ploy
men
t Bar
rier
sN
one
12
or 3
Non
e1
2 or
3N
one
12
or 3
Non
e1
2 or
3N
one
12
or 3
and
Subg
roup
(%)
(%)
(%)
(%)
(%)
(%)
(%)
(%)
(%)
(%)
(%)
(%)
(%)
(%)
(%)
Age 16
-19
18.2
35.7
46.1
0.0
0.0
0.0
0.0
0.0
0.0
17.9
40.2
42.0
18.4
31.9
49.7
20-2
131
.337
.531
.20.
00.
00.
00.
00.
00.
036
.845
.018
.227
.131
.741
.322
-29
34.3
34.4
31.3
40.5
39.0
20.5
28.9
30.3
40.8
0.0
0.0
0.0
0.0
0.0
0.0
30-4
433
.138
.728
.337
.542
.120
.329
.135
.635
.40.
00.
00.
00.
00.
00.
045
and
ove
r31
.041
.627
.331
.840
.927
.430
.442
.327
.30.
00.
00.
00.
00.
00.
0
Eth
nici
tyW
hite
, non
-His
pani
c34
.937
.727
.541
.438
.919
.733
.236
.530
.231
.142
.526
.427
.433
.539
.1B
lack
, non
-His
pani
c24
.534
.640
.834
.445
.020
.622
.928
.149
.018
.538
.842
.815
.627
.357
.1H
ispa
nic
22.1
37.7
40.2
32.0
41.2
26.8
23.3
33.3
43.4
14.2
45.9
39.9
15.1
34.1
50.7
Oth
er24
.837
.038
.229
.336
.234
.524
.536
.738
.811
.542
.346
.218
.236
.445
.5
Sex Fe
mal
e26
.933
.339
.80.
00.
00.
029
.233
.936
.90.
00.
00.
021
.931
.846
.3M
ale
34.4
41.0
24.7
38.2
40.6
21.2
0.0
0.0
0.0
25.0
42.0
33.0
0.0
0.0
0.0
Edu
catio
nH
igh
scho
ol d
iplo
ma
or G
ED
47.1
37.3
15.6
54.8
37.7
7.5
39.6
36.0
24.4
58.3
38.9
2.8
42.6
39.4
18.0
No
high
sch
ool d
iplo
ma
or G
ED
0.0
36.0
64.0
0.0
47.2
52.8
0.0
28.3
71.7
0.0
44.3
55.7
0.0
23.7
76.3
Wor
k E
xper
ienc
eW
orke
d 13
wee
ks o
r m
ore
in 1
2 m
onth
s be
fore
ass
ignm
ent
59.1
35.3
5.6
64.2
31.3
4.5
61.6
32.9
5.5
45.6
48.9
5.5
53.0
37.8
9.3
Wor
ked
few
er th
an 1
3 w
eeks
in 1
2 m
onth
s be
fore
ass
ignm
ent
0.0
38.5
61.5
0.0
54.2
45.8
0.0
34.8
65.2
0.0
33.6
66.4
0.0
27.6
72.4
(con
tinue
d)

TA
BL
E 2
.14
(con
tinue
d)
Cha
ract
eris
tic
All
Tar
get
Gro
ups
Adu
lt M
enA
dult
Wom
enM
ale
You
ths
Fem
ale
You
ths
Em
ploy
men
t Bar
rier
sE
mpl
oym
ent B
arri
ers
Em
ploy
men
t Bar
rier
sE
mpl
oym
ent b
arri
ers
Em
ploy
men
t Bar
rier
sN
one
12
or 3
Non
e1
2 or
3N
one
12
or 3
Non
e1
2 or
3N
one
I2
or 3
and
Subg
roup
(%)
(%)
(%)
(%)
(%)
(%)
(%)
(%)
(%)
(%)
(%)
(%)
(%)
(%)
(%)
Publ
ic A
ssis
tanc
e R
e?tip
tN
ot r
ecei
ving
AFD
C o
r ot
her
cash
assi
stan
ce a
t ass
ign,
nen
t41
.142
.716
.345
.543
.111
.447
.041
.611
.528
.345
.826
.032
.040
.627
.5R
ecei
ving
AFD
C o
r ot
her
cash
assi
stan
ce a
t ass
ignm
ent
0.0
20.4
79.6
0.0
27.4
72.6
0.0
21.4
78.6
0.0
13.0
87.0
0.0
12.8
87.2
AFD
C H
isto
ryN
ever
rec
eive
d A
FDC
35.8
40.9
23.3
39.9
41.3
18.8
41.6
41.4
17.0
25.2
42.2
32.6
28.5
37.7
33.8
Rec
eive
d A
FDC
less
than
2 y
ears
(a)
17.3
30.9
51.8
19.0
35.6
45.4
21.6
34.6
43.8
15.8
31.6
52.6
5.8
19.0
75.2
Rec
eive
d A
FDC
2 y
ears
or
mor
e (a
)11
.918
.769
.416
.320
.962
.812
.819
.667
.60.
00.
00.
02.
110
.587
.4
Hou
seho
ld C
ompo
sitio
nSp
ouse
pre
sent
32.5
40.8
26.7
39.3
38.8
21.8
27.7
44.8
27.5
26.4
45.5
28.1
15.5
31.8
52.7
No
spou
se p
rese
nt, c
hild
pre
sent
22.2
28.7
49.1
34.2
43.0
22.8
24.5
28.1
47.5
17.8
57.8
24.4
10.3
22.4
67.4
No
spou
se p
rese
nt, n
o ch
ild p
rese
nt34
.440
.025
.638
.041
.420
.642
.337
.020
.625
.240
.734
.131
.638
.629
.7
Sam
ple
Size
3,60
34,
373
3,42
41,
503
1,50
871
41,
314
1,62
41,
495
371
607
455
415
634
760
SOU
RC
E: M
DR
C c
alcu
latio
ns f
rom
Bac
kgro
und
Info
rmat
ion
Form
res
pons
es.
NO
TE
S: C
alcu
latio
ns f
or th
is ta
ble
are
base
d on
dat
a fo
r al
l tre
atm
nt g
roup
mem
bers
in th
e 18
-mon
th s
tudy
sam
ple.
Dis
trib
utio
ns m
ay n
ot to
tal 1
00.0
per
cent
bec
ause
of
roun
ding
.
The
bar
rier
s to
em
ploy
men
t inc
lude
: not
hav
ing
a hi
gh s
choo
l dip
lom
a or
GE
D a
t the
tim
e of
ran
dom
ass
ignm
ent;
havi
ng w
orke
d fe
wer
than
13 w
eeks
dur
ing
the
12 m
onth
s pr
ior
to r
ando
m a
ssig
nmen
t; an
d re
ceiv
ing
AFD
C o
r ot
her
cash
ass
ista
nce
at th
e tim
e of
ran
dom
ass
ignm
ent.
(a)
The
AFD
C r
ecei
pt m
ay n
ot h
ave
been
con
tinuo
us.
¶t4
remaining chapters of this report, Table 2.14 presents selected characteristics for all target
groups and their employment-barrier subgroups. For example, the first panel of the table on
age distribution indicates that 18 percent of those 16-19 years of age had none of the listed
employment barriers, 36 percent had one, and 46 percent had two or three. In general, thosewith two or three employment barriers were more likely than the rest of the sample to beteenagers, females, and single parents.
The next four chapters discuss the overall picture for the 16 study sites as a group inrecruiting, enrolling, and serving JTPA applicants. This aggregated analysis describes the JTPA
services received by the 18-month treatment group sample, for which impact estimates arecalculated. Chapter 7 of this report returns to site-specific analysis, discussing the variation
among the study sites on the topics discussed in the preceding chapters and seeking to link thisvariation to the features of individual sites discussed in this chapter.
44

CHAPTER 3
BALANCING RESEARCH GOALS AND THE ITY OF 'IPA PROGRAMS
The key issues discussed in this and the following chapter are interrelated. To organise the
discussion, this chapter first describes the goals of the National JTPA Study, which established
the basic structure of the research design. The chapter then presents the steps that potential
JTPA enrollees typically followed during program intake (labeled "client flow") in the study sites
and how the research procedures were superimposed on the usual routines. With this summary
of what actually happened in the sites during the study as background, Chapter 4 turns to a
discussion of the competing policy questions that could be addressed, the resulting research
designs, and the reasons for the approaches taken.
This organization reflects the diverse audience for this report: employment and training
practitioners, researchers, and policymakers. For researchers who may not be familiar with the
JTPA system, this chapter provides background on "how the program works." For the employment
and training community and policymakers, it provides a concrete example of "how random
assignment works" and the questions the study addresses.
I. The Goals of the National JTPA Study
Before launching into a discussion of client flow and the research design, it is important to
understand DOL's goals for the study. The central goal can be stated simply: to provide estimates
of the difference that Title II-A of JTPA makes (i.e., its impacts) on the employment, earnings,
and welfare receipt of those served in a diverse group of local programs. As part of this, DOL
wished to estimate program impacts for key groups of clients, including the target groups (adult
men, adult women, and male and female out-of-school youths) and, to the extent feasible, other
subgroups based on ethnicity, education, work experience, and receipt of public assistance.
To assess the impacts of this group of local JTPA programs, it is not possible merely to
observe the post-program employment rates, earnings, and rates of welfare receipt (the program
outcomes) for people who participate in JTPA because some of those served would have found
a new job on their own or improved their skills and raised their income through other means
45
113

even if they had not participated in the program.1 In a study of a voluntary program, the measureof a program's impacts is the difference between what happened to people who were given theoption to participate in the program and what would have happened to them if they did not havethis option.2 This calls for creating and studying two groups of people with no systematicdifferences except their access to the program under study. The approach taken in this study, forthe reasons given in Chapter 1, was to randomly assign individuals who applied to JTPA to eithera treatment group, which was given access to the program, or a control group, which was notgiven such access. As this and the following chapter will make clear, choosing the point in theJTPA application process at which random assignment is to occur involves baiancin competingresearch goals and the operational reality of JTPA programs.
Additional goals of the study complicated P:t. task of designing and implementing theresearch. DOL sought to estimate both (1) the overall impact of JTPA Title II-A servicesprovided in each of a sample of local programs and (2) the specific impact of important categories
of services such as those anchored in on-the-job training (OTT) and classroom training inoccupational skills (CT-OS). Finally, DOL sought to study local programs that were followingtheir normal practices as closely as possible.
II. Client Flow and Study Procedures
Figure 3.1 presents the basic steps common to all SDAs in the study by which an individual
eligible for JTPA could apply for the program, be randomly assigned, and (if assigned to thetreatment group) enroll in the program.3 Normally, many more people contact the SDA or aservice provider to learn about the program and inquire about eligibility rules than actually apply.4
Consequently, as Figure 3.1 shows, individuals may "exit" from the intake process at each step.This could occur because they find other opportunities, decide JTPA is unlikely to provide whatthey want, or are discouraged by what staff tell them about their prospects in the program. This
1These types of outcome measures are used in the existing performance standards system, which playsa central role in JTPA management. Performance stand:.: s are discussed in Chapters 1 and 2.
2The distinction between outcomes and impacts is not the saute as the distinction between short-termand long-term measures. Even long-term measures of program outcomes measure only the post-programstatus of the group served, not the difference the service made in their employment, earnings, and welfarereceipt.
'Appendix A presents profiles of the 16 study sites, including information about their recruitmentprocess, assessment practices, and service providers.
"Some SDAs have tracked client contacts and report that about one quarter of those inquiring aboutthe program ever enroll, with much of the drop-off coming early, before eligibility has been determined.
46

FIGURE 3.1
FLOW OF SAMPLE MEMBERS IN THE NATIONAL JTPA STUDY SITES
ISTAGE1
JTPA-Eligible Population
Recruitment
Application
Eligibility Determination
4Informed Consent Form
and 8W Completion
11:.tit
owl Exit
el Exit
awl Exit
l Exit
TAGS 2
Assessment
Recommendation of Servicesand Service Strategy
Classroom TrainingService Strategy
Exit
ServiceService Strategy
Random Assignment Random Assignment
Other ServicesService Strategyr
Random Assignment
Treatment Control Treatment Control Treatment Control
Group Group Group Group Group Group
1STAGE 3
Enroll
ReceiveServices
Do NotEnroll
ReceiveServices
ReceiveNo Services
NOTE: Because of limited space, the stage 3 sample flow has been fully depicted only for the OJT/JSA service strategy.
although it would be the same for the other two strategies.
47

section discusses these steps in the client flew shown in Figure 3.1 by grouping them into threestages.
A. Stage 1. Connedinr with Those Elivibk for and Interested in _MA:Recruitment. Determination.gaijuliljlECompletion
1. The JTPA-eligible population. The federal statute defines the basic eligibilityrequirements for JTPA, which are principally low family income during the previous six monthsor current receipt of public assistance -5 In each local area served through a single SDA, thesize of the eligible population will vary with the characteristics of the population and local labormarket conditions. However, JTPA is not a legal entitlement for all who satisfy the eligibilityrequirements. Nationally, JTPA funding is sufficient to serve fewer than 10 percent of thoseeligible, so the pool of eligible potential applicants normally greatly exceeds program capacity.
2. Recruitment. Nevertheless, recruitment of program applicants takes substantial effortin many (though not all) SDAs and can involve both the local administrative entity running the
program and agencies under contract to provide various kinds of training and employmentservices. Recruitment is a special challenge because SDAs must identify eligible individuals who
are interested in the types of training and employment services that JTPA provides and are ableto participate without receiving stipends or other program-related income support.6 For thosewithout other sources of support, the program must offer income-generating services such as 011'or job search.
The experience of program operators indicates that the level of unemployment n the areais the best predictor of the difficulty of recruitment: the lower the level of unemployment, the
5JTPA authorizes the provision of job training for economically disadvantaged individuals and othersfacing serious barriers to employment. An "economically disadvantaged individual' is defined as someonewho (1) receives cash welfare payments under a federal, state, or local welfare program or is a memberof a family that receives these payments; (2) has a total family income (excluding unemploymentcompensation, child support payments, and welfare payments) for the six-month period prior to applicationthat, in relation to family size, is not in excess of the higher of (a) the poverty standard established by theOffice of Management and Budget (OMB) or (b) 70 percent of the 'lower living' standard, which is thestandard above the poverty standard; (3) receives food stamps; (4) is a foster child on behalf of whom stateor local government payments are made; or (5) as permitted by regulations, is an adult individual with ahancliclp, whose own income meets the family income requirements, exclusive of the income of otherfamily members.
One of the important changes made in the shift from CETA (the Comprehensive Employment andTraining Act) to JTPA was that income support (in the form of regular stipends or public serviceemployment) was virtually eliminated. Many SDAs do provide small payments to cover some expenses ofparticipating (e.g., transportation expenses), but in general participants must be able to support themselvesthrough nonprogram resources.
48
9

harder it is to recruit applicants for JTPA. Because JTPA does not provide in-program income,
as jobs become more plentiful JTPA becomes relatively less attractive. As evidence of this, even
though low-income workers are eligible for JTPA, most applicants are unemployed or had
previously left the labor force altogether._?
During the period of random assignment, sites had to identify a large enough pool of eligible
applicants to be able to both serve the number of people they wished to enroll and to create a
control group. With a random-assignment ratio of two treatment group members. for each control
group member, sites had to identify an "care 50 percent of eligibles. In most sites, this involved
increasing recruitment efforts and expanding the applicant pool. However, as mentioned earlier,
the eligible population for JTPA remained much larger than the number of people recruited in
the study SDAs.
Because labor market conditions changed during the period of random assignment (in most
sites unemployment rates declined) it is difficult to isolate the effect of this "study-induced"
expansion in the applicant pool on the characteristics of applicants. However, program operators
in the study sites reported that the combination of factors led them to recruit less job-ready
applicants than had been the case in the mid 1980s, when unemployment war, higher.
3. Application and eligibility determination. Those who applied for JTPA completed the
SDA or state forms used to establish their eligibility for the program. They were also required
to provide documentation (usually information about recent family income or receipt of public
assistance), the extent of which varied from state to state. SDA staff then had to determine if
applicants were eligible for the program. Those found eligible would continue through to
assessment, while ineligibles were told they could not be served.8 The study made no change in
the eligibility determination process and staff were told to complete this process as they normally
would.9
4. Completion of the Background Information Form (BIF). By this point in the process.
applicants in the study sites typically had completed the study Background Information Form
(BIF) with assistance from the program staff. The study design allowed some local flexibility as
?For example, 86 percent of the sample for the National JTPA Study were not working when theyapplied for JTPA. See Bloom, 1991.
8Under JTPA rules, up to 10 percent of enrollees can have incomes above the normal eligibility cutoffif they have other barriers to employment.
9As in most studies of ongoing programs, the research design did not include a supplementary checkof eligibility. This is appropriate since the goal was to measure impacts of the program as operatednormally for those on whom the local programs spent funds.
49

to the precise point when the form was completed to lessen the burden on local staff who
assisted applicants in completing the form. In most sites, staff and applicants filled out the BIF
when the usual SDA application materials were completed. In some instances, completion of the
BIF occurred as part of the assessment interviews. The BIF provided basic data on the pre-
program characteristics of those randomly assigned, information that was used to identify members
of subgroups analyzed separately in the study.1°
B. Stage 2. Ideneine the Research Sample: Assessment. Recommendationfor Services. Desienation of a Service Stutter% and RandomAssiffnment
1. Assessment. Following eligibility determination (or possibly simultaneously for those
very likely to be eligible), SDA and/or service provider staff assessed the current interests, skills,
and service needs of applicants. The extent and complexity of this assessment varied greatly
among the study SDAs; in some it consisted of a multi-day period of testing and interviews, while
in others service recommendations were based on a short interview at the time the application
was completed. Rural areas with limited service offerings, in which applicants may have had to
travel long distances to the program office, were most likely to have combined the application
with an abbreviated assessment.
During the study, local staff were told to follow past practices as closely as possible, and in
most SDAs assessment practices were not changed by the study. In some SDAs, however,
modifications were made because of locally initiated changes in program design (e.g., changes to
streamline intake practices) or because staff were seeing less job-ready clients, as noted above.
2. Recommendation for services. Based on their assessment of clients, local staff
developed recommendations for services reflecting client needs, interests, and preferences. For
about three quarters of the 18-month treatment group sample, staff recommended a single service
(most commonly CT-OS or OJT), but for the remaining one quarter, staff recommended a
combination of services."
For some applicants, staff decided that no JTPA services would be appropriate and as
would normally be the case these individuals did not continue through the remaining steps of
10These data were used in the analysis of the characteristics of the 18-month treatment group samplein Chapter 2, later analysis of subgroups in this report, and the analysis of impacts for key subgroups inthe 18-month impact report. They were also used for the baseline characteristics report published earlierin the project (Bloom, 1991).
11The details of service recommendations are discussed later in this chapter.
50
the JTPA intake process. This judgment could be made for several reasons: the applicants' skills
were too poor to meet entrance requirements for JTPA services; staff believed applicants had
other problems (such as substance abuse or mental health issues or "poor motivation") that posed
serious obstacles to success in the program; applicants were so employable that the SDA did not
want to spend program funds serving them; or the SDA did not offer the type of service that the
applicants sought.'2 Applicants whom local staff believed to be inappropriate for ;TPA did not
become part of the research sample; the study did not, therefore, require staff to serve them.
3. r Iesignation of a service strategy. Since this aspect of the research design is complex,
some background on its origins is useful. In the planning stage of the study, DOL set as a goal
the estimation of program impacts for important categories of services. In addition, in
implementing the study, DOL also wished to change local program operations as little as possible.
Therefore, the research design had to define the study's service categories or strategies carefully
to reflect actual program practice.13 A central objective was to develop separate categories for
individuals recommended for the two most commonly provided, more intensive services under
JTPA: CT-OS and OJT.14 But the situation was complicated by the fact that, in a substantial
minority of cases, lo' al staff typically recommended more than one service.
The resulting research-defined service strategies, therefore, distinguished between these two
emphases or primary services, but also accommodated combinations of services. Individuals
recommended by local staff for CT-OS but not OJT were part of the service strategy labeled
classroom training (CT). Those recommended for OTT but not CT-OS were part of the service
12The issue of screening for motivation has been a contentious one m JTPA. Some SDAs havedeliberately set up application procedures that require people to return several times to complete formsor attend interviews in an effort to screen out those without the motivation to persevere. Others arguethat such approaches impose many costs on applicants (in terms of time) before the benefits of programparticipation are apparent and result in programs losing many applicants who could have been helped.See Kelly, 1987, for one view of this issue.
13This mesh of research-defined concepts and actual program practice was especially importantbecause, as discussed later in this chapter, staff had to designate a service strategy for each individual priorto random assignment and then follow a service plan consistent with this designation for individualsrandomly assigned to the treatment (or program) group. In effect, staff were not permitted to change theirmind after random assignment. The reason is discussed briefly later in this chapter and in Doolittle andTraeger, 1990. Consequently, it was important to develop service strategy definition that would inhibitlocal discretion as to services as little as possible and still produce patterns of post-random-assignmentservice receipt that represented real differences in emphasis.
14At the time the study started, data from the National Job Training Longitudinal Survey (TTLS)showed that about 75 percent of JTPA enrollees nationally were enrolled in only one service and slightlyunder 50 percent were enrolled in either CT-OS or OJT. During the period of study sample build-up, theproportion of enrollees in these two services increased to about 60 percent.
51
I (. 2

strategy labeled on-the-job training/job search assistance (OJT/JSA). This name was chosenbecause over the course of random assignment about one third of individuals in this categorywere recommended for both of these services designed to get individuals immediately into a job.Those recommended for neither CT-OS nor OJT, or for both services, were part of the thirdstrategy labeled other services.
Table 3.1 shows the services allowed under each of the three service strategies used in thisimplementation analysis and the 18-month impact report. Only restrictions on SDA andservice provider actions are implied. First, individuals designated for the classroom trainingservice strategy (i.e., recommended for Cr-OS as their primary service) were not later to receiveOff, and those recommended for the OJT/JSA service strategy were not to receive cros.15This restriction seemed to be consistent with operational reality; SDA experience suggested thatclients tend to divide into (1) those interested and able (in terms of educational attainment,learning style and study habits, and a source of income while in training) to participate inclassroom-based occupational training and (2) those seeking immediate employment because offinancial obligations or an aversion to the classroom setting, but also in need of training. Thus,these service strategies accommodated the needs and interests of most JTPA applicants, andclient preferences were an important factor in assessments in most SDAs. In addition, SDAsrarely provided both CT-OS and OJT to a single client, since the combined cost of these twoservices exceeded what most JTPA programs were prepared to spend on one person.
The second restriction on SDA actions was a ceiling on the proportion of clients who couldbe designated for the other services strategy. Since this strategy contained no restrictions onsubsequent service receipt, SDAs would have had an incentive to designate everyone for thisstrategy. Consequently, the research team negotiated with each site a ceiling on the strategy, withthe level reflecting past patterns of service receipt. For example, in SDAs where most individualstypically received only Off or Cr-OS, the ceiling on other services was set low; in SDAs where
many individuals received a combination of Cr-OS and OJT, or services other than these two,
15Part-way through the study, the research team agreed to allow SDAs to provide a small amount ofOJT following CT-OS in cases where it was needed to secure placement in a job. This OJT could notamount to more than 20 percent of total training time. Similarly, SDAs were allowed to provide a smallamount of CT-OS (again, no more than 20 percent of the training time) when needed to give the applicanta 'skills brush-up" in order to secure an OJT position. As the service enrollment data presented later inthis report show, this option was used very rarely.
52
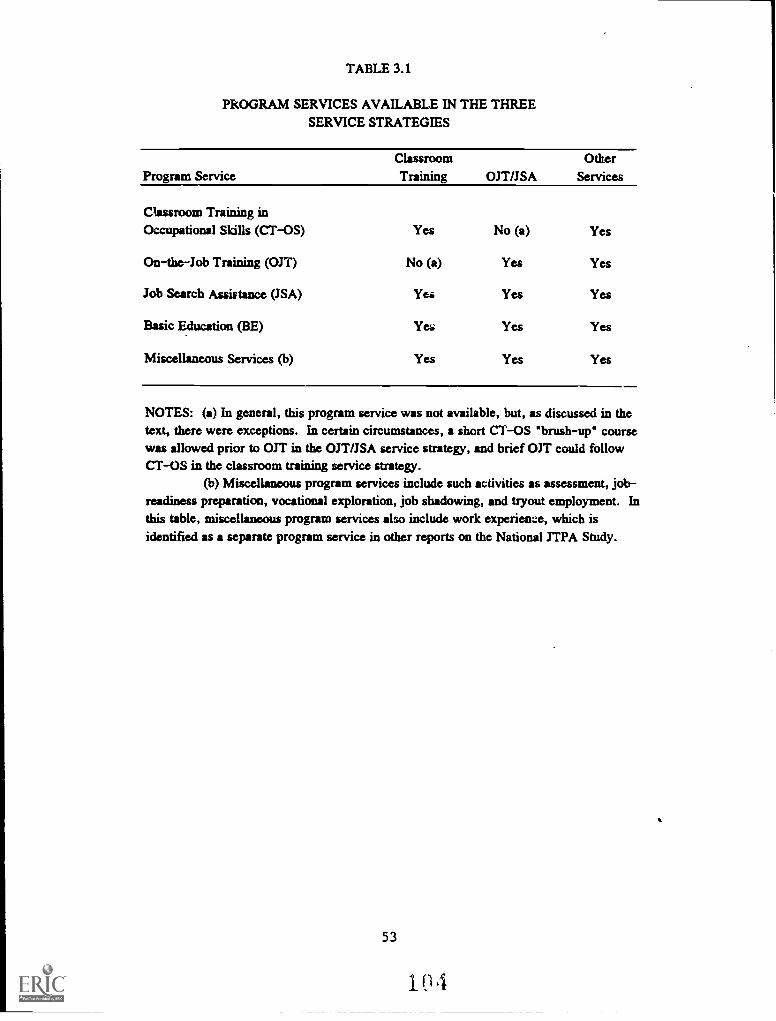
TABLE 3.1
PROGRAM SERVICES AVAILABLE IN THE THREESERVICE STRATEGIES
Program ServiceClassroomTraining OJT/JSA
OtherServices
Classroom Training inOccupational Skills (CT-OS) Yes No (a) Yes
On-the-Job Training (OJT) No (a) Yes Yes
Job Search Assistance (JSA) Yea Yes Yes
Basic Education (BE) Yes Yes Yes
Miscellaneous Services (b) Yes Yes Yes
NOTES: (a) In general, this program service was not available, but, as discussed in thetext, there were exceptions. In certain circumstances, a short CT-OS 'brush-up" coursewas allowed prior to OJT in the OJT/JSA service strategy, and brief OJT could followCT-OS in the classroom training service strategy.
(b) Miscellaneous program services include such activities as assessment, job-readiness preparation, vocational exploration, job shadowing, and tryout employment. Inthis table, miscellaneous program services also include work experience, which isidentified as a separate program service in other reports on the National JTPA Study.
53
1(I 4

the ceiling was set much higher. Among the 16 SDAs in the study, the range was from 15
percent to 70 percent, with more than half the sites at 35 percent or lower.16
4. Random ass ment to rea t e t or eo p. The random-assignment
procedure was straightforward. Site staff called MDRC (using a toll-free number), provided
background information on each individual to allow tracking of sample build-up by target group,
and listed the service recommendations and the service strategy designation. MDRC staff gavesite staff the person's research status (treatment or control); they were then to follow theirservice recommendations for those randomly assigned to the treatment group. MDRC staff kept
a roster of those randomly assigned and their research status to assure that if a person in thesample reapplied to the program, he or she would be treated consistently during the follow-upperiod.
Those in the control group were excluded from JTPA-funded services in the SDA for thefollowing 18 months, but were provided with a list of alternative service providers in thecommunity whom they could contact on their own." Detailed informationpresented in Appendix
B shows that sites were quite successful in enforcing this rule. About 3 percent of the controlswere enrolled in any JTPA services during the follow-up period. 18
Essentially, as shown in Figure 3.1, this process created a separate control group for each
service strategy, permitting separate impact estimates for how each strategy worked for the people
recommended for it. The process also permitted a combined impact estimate for the entire
sample. As will be described later in this report, local staff recommended people with different
characteristics for the three service strstegies, so at random assignment the sample in each
strategy varied in important ways from the others. Because of this, it is not possible to compare
the effectiveness of the three service strategies for similar groups of people. The treatment and
16Over the course of random assignment, most sites recommended many fewer applicants for the otherservices strategy than their ceiling allowed. Overall, the proportion of the 18-month treatment groupsample in this strategy was 27 percent.
"After 18 months, members of the control group could receive JTPA services if they returned to theSDA or service provider on their own. However, SDA staff agreed not to make any special effort torecruit members of the control group at the end of their exclusion from JTPA.
18Some members of the research sample were participating in a title of JTPA not included in thestudy (e.g., the summer youth program) prior to random assignment and hadapplied for Title II-A services.Those assigned to the treatment group were given access to Title II-A services, but those assigned to thecontrol group were not. However, since control group members were allowed to finish their non-Title II-A services, they would appear as enrolled in JTPA at the beginning of the follow-up period. Of the 159members of the control group with JTPA enrollment during the follow-up period, 60 people began theirenrollment before random assignment, mostly in non-Title II-A services. Thus, less than 2 percent ofcontrols began a JTPA enrollment after random assignment.
54

control groups in each strategy differed in initial characteristics ar.cf in the type of service
recommended by staff, making it impossible to isolate the effect of the service strategy on
impacts.19
C. Stage 3. Efforts to Arrange Services for the Treatment Group: Enrollmentin JTPA and Involvement of the Nonenrolled with III%
Individuals randomly assigned to the treatment group were offered access to JTPA services;
this offer and the resulting services provided were the "treatment" being tested through the
random-assignment experiment. In effect, this design was testing the impact of the decisions that
local staff and individual applicants made during the intake process: whether to try to arrange and
participate in JTPA services. As will become clear in the following discussion, many factors
affected whether an individual actually ended up enrolled in JTPA. Also, arranging services
involved considerable administrative effort and expended program resqurces; thus, starting the
impact story at the point of referral to services makes sense.
As will be explained later, the impact analysis in the National JTPA Study will also present
alternative impact estimates that seek to capture the difference that participation makes.
However, as will also be clarified later, the concept of "participation" in JTPA is somewhat vague
and hard to measure, complicating the interpretation of they; alternative impact estimates.
1. Enrollment in JTPA services. Enrollment in JTPA occurs when SDA staff enter a
person's name and application data into the local JTPA management information system (MIS)
and enroll her or him in one or more specific JTPA-funded services. This step makes the person
an official JTPA participant, whose service receipt and progress are tracked and whose
termination status (e.g., employment and wages on leaving the program) is noted as part of the
JTPA performance standard system. By enrolling clients, SDA staff are held accountable through
the JTPA performance standard system for the costs that JTPA incurs in serving them and for
their success when they leave the program.2° As discussed in more detail in Chapter 4, 64
19This issue is discussed in more detail in Chapter 4.2°As discussed in Chapter 1, during the period of the study, clients' employment was measured as of
their point of termination from the program. Starting in program year 1990, performance standards wereamended to include measures of employment 13 weeks after leaving the program. Controversy over thecosts standards led DOL to end their use in program year 1990. One major concern was whether a focuson costs per placement for adults or per positive termination for youths provided too many incentives torun short-term, low-intensity programs. A second concern was that the focus on JTPA program costs couldprovide a distorted cross-site comparison, since local programs varied in their ability to draw on otherfunders to provide services for JTPA clients. For example, in some SDAs it was relatively easy to getclients into basic education funded by state education programs, while in others this was difficult.
55
1-1 6

percent of the 18-month treatment group sample were enrolled in JTPA at some point in the 18-
month follow-up period. Thus, Figure 3.1 shows individuals who enrolled in JTPA as a subsetof each of the three treatment groups.
2. Nonenrolled treatment grout) members. Four factors help explain why some members
of the treatment group would never be enrolled in JTPA.
a. Despite the initial assessment that a client is appropriate for JTPA,staff may be unable to find a service provider willing to accept theperson. Service providers often have the final say on whether theywill accept an applicant. Many classroom training agencies haveentrance requirements on minimum initial skills, and employers whocan provide OJT will typically make their own assessment aboutwhether they want the applicant as an employee. In addition, anapplicant may be seeking classroom or other training at a time of theyear when it is not offered.
b. Applicants may change their mind about JTPA as they continue toseek other opportunities or learn more about the program. Many arelooking for work on their own, and some will find employment. Somemay discover different ways to finance the type of training they seek.And still others may decide that they are not interested in a job ortraining after all.
c. The design of the JTPA program encourages local staff to make surethat applicants are going to participate and do well in a servicebefore they are enrolled said counted as a JTPA participant. Thehigh visibility of standards within the JTPA system go well beyondtheir limited role in allocating incentive grants, consisting of up to 6percent of Title II-A funds. An SDA's success in exceeding itsperformance standards is often seen as a sign of how well a programis operating. This clearly encourages SDAs to focus on achievingtheir standards on the various outcomes measured, but it also createsan incentive to hold off on enrolling individuals (i.e., having themcount as part of the program) until they are placed in and begin aservice that staff feel is likely to produce success.21
d. Many SDAs believe that they have discretion in defining the pointat which individuals "count' in their performance standards andrespond to the incentives of the standards by delaying enrollment. Inthe initial years of JTPA, DOL adopted the position that JTPA wasto be primarily controlled by states and localities. Therefore, DOL
21Although the performance standard system has changed in recent years to include longer-termmeasures of success (i.e., 13 weeks after leavin 7, the program) and measures less closely tied to immediateemployment and low costs, the basic incentives remain unchanged. SDAs can be seen as well run and gainsome additional funding if a high proportion of people leaving their program find a job that pays well orhave attained a variety of employability-enhancing competencies.
56
in 7

did not define precisely many key administrative terms, including thepoint at which enrollment should occur. In recent years, this federalstance has changed, but a holdover from the initial period is thecontinued practice of linking enrollment to the actual beginning ofthe intended service, be it the first day of class attended, the firstworkday for OJT, or (in an extreme example of this) whenparticipation in job club or job search assistance leads to employment.
There is no national survey that has collected information on the point of enrollment in
local JTPA programs. However, most of the study sites enrolled individuals in classroom training
when they attended their first class or in OJT when they worked their first day, though one site
did enroll people during assessment. In a few sites, local staff could refer people to job search
assistance or job club without enrolling them and observe how they acted in this setting as part
of an "extended assessment" The applicants may never have been enrolled in JTPA unless they
found a job or were referred to another service because their behavior in the job club showed
motivation and promise of employability.22
These factors suggest that nonenrolled members (as well as enrolled members) of the
treatment group could have had some post-random-assignment involvement with the JTPA system.
As will become clearer in Chapter 4, this could complicate the calculation of impacts per person
"participating" in JTPA because enrollment and receipt of some JTPA assistance may not be
synonymous. In order to understand the extent to which *_; -,is occurred, the research team drew
a sample of nonenrolled treatment group members in 12 sits23 and talked with local staff about
their efforts to work with these individuals after randOm assignment.
Table 3.2 presents the findings from this special study. The local staff had no contact with
15 percent of this sample after random assignment; basically, they were unable to locate them
again. Another 11 percent reported that they were no longer interested in JTPA, for a variety
of reasons. Another 20 percent of the sample were recontacted, but staff never arranged service
for them. The remaining 53 percent of the sample of nonenrolled treatment group members had
some post-random-assignment involvement with JTPA without being enrolled. The most common
service, provided for 36 percent of the sample, was one or more referrals to employers for a
22Legislation proposed by DOI and by members of Congress in 1991 to amend JTPA would tightensome of the definitions of key administrative terms, in recognition of this problem. In addition, DOL hasrecently issued new guidelines defining more precisely key administrative terms.
23The samples were drawn in two time periods: November 1988-January 1989 and March-June 1989,and included most of the SDAs where random assignment was occurring at those times. Within these timeperiods, random samples of nonenrolled tr-fitment group members were drawn.
57
S

TABLE 3.2
PERCENTAGE DISTRIBUTION OFPOST-RANDOM ASSIGNMENT ACTIVITY IN JTPA
OF TREATMENT GROUP MEMBERS WHO DID NOT ENROLL
ActivityNonenrollees .
(%)
No Further Contact
Further Contact, But Not Eligible
15
No Langer Interested (a) 11
Got job on own 5Moved 2Health problems 1
In another program 1
Reason unknown 3
Interested, But Made Contact Onlyand Received No Services 20
Interested and Received Service(s) (b) 53Received further assessment
and counseling 11
Referred to classroomtraining provider(s) 5
Received support service(s) 2Referred to employer(s) for
possible on-the-job training 36Participated in job club or
received job search assistance 20
Total 100
Sample Size 307
SOURCE: Information collected by MDRC site representatives during the NationalJTPA Study.
NOTES: Calculations for this table are based on data for a random sample of3()7 treatment group members in the 18 -month study sample who did not enroll inJTPA.
(a) When totaled, the sub Amegory percentages are over 11 percent becausenonenrollees could cite more than one reason for no longer being interested in JTPA.
(b) When totaled, the subcategory percentages are over 53 percent becausesome nonenrollees received more than one service.
58

possible Off position. Twenty percent of the sample participated in job club or other job search
assistance. This small study suggests that local staff worked with about half of the treatment
group members who never enrolled in JTPA, though in many cases little service was provided.
The results from this survey suggest that local staff worked (with a wide range of intensity
and commitment) with about 80 percent of the treatment group. This 80 percent consisted of the
64 percent who were enrolled, plus an additional 18 percent (i.e., half of the 36 percent of
nonenrollees) who were never enrolled but did have some post-random-assignment JTPA
involvement.24
24 his finding does not relate directly to the ongoing debate about how much local JTPA programs'cream" in selecting enrollees, i.e., seek more employable clients and shy away from enrolling harder-to-serve clients. Much of this creaming, if it existed, could have occurred before the point of randomassignment, the point at which the 18-month treatment group sample was identified. Random assignmentfollowed local staff's assessment of clients and a decision that they would be appropriate for the program.Nevertheless, as analysis presented in Chapter 7 shows, there were differences in the rate at which SDAsin the study enrolled the subgroup in the sample with the most barriers to employment. There were alsosome differences in overall enrollment rates among subgroups in the sample defined by ethnicity, education,gender, and other personal characteristics.
59
1 kl

CHAPTER 4
KEY POLICY GUESTIONS AND THE RESULTING STUDY DESIGN
This chapter building on Chapter 3's description of the typical flow of potential JTPAenrollees discusses how competing study objectives presented issues that had to be addressedin developing the research design. The discussion focuses on three key research design issues:
choosing the random-assignment model, providing alternative program impact estimates, anddefining the service strategies analyzed in the study. In addressing this third issue, the chapterpresents information on the services received by treatment group members recommended for thethree service strategies analyzed.
I. Choosing the Random-Assignment Design
The choice of the random-assignment design determines the questions that the research can
address. DOL's multiple goals for the study presented a challenge in developing the researchdesign. These goals, in brief, were to estimate overall impacts for JTPA programs in the sites,to estimate impacts for specific service strategies anchored in classroom training in occupational
skills (CT-OS) and on-the-job training (OJT), and to assess the impact of local programs that were
following their normal practices as much as possible.
The first two goals (overall program net impacts and specific service strategy net impacts)
could both have been accomplished using the research design presented in Figure 4.1, whererandom assignment occurs after eligibility determination, but before local staff have an opportunityto recommend services. Under this approach, applicants who are found by local staff to beeligible for JTPA and appropriate for its services through a preliminary assessment would berandomly assigned to one of three service strategies or to a control group. This design couldproduce three types of impact estimates (the two required net impacts plus another type ofestimate):
1. Overall program impacts: Comparisons of the post-random-assignmentexperiences of the three treatment groups with the control group would produceestimates of the impact of the overall program.
2. Service strategy impacts: Comparisons of those in the treatment group for aservice strategy with the control group would produce estimates of the impactof that service strategy.
60
II

FIGURE 4.1
POTENTIAL DESIGN FOR RANDOM ASSIGNMENTTO A SERVICE STRATEGY OR TO THE CONTROL GROUP
(NOT USED IN THE NATIONAL JTPA STUDY)
Classroom TrainingService Strategy
Recruitment
EligibilityDetermination
OJT/JSAService Strategy
61
Other ServicesService Strategy
1 2
Control Group(Not Eligible forJTPA Services)

3. Comparisons of the relative (or " differential") impacts of service strategies:Because assignment to each of the three treatment groups and to the controlgroup would have been random, these groups would initially have been similarat random assignment except for the differences in access to JTPA services.This would permit comparisons of the impact of one service strategy withanother.
While this approach has advantages, it is clearly inconsistent with DOL's third objective: to
study local programs that were following normal JTPA practices insofar as possible. Random
assignment of applicants to service strategies would override the normal assessment and service
recommendation practices of SDAs and prevent the estimation of impacts for those who normally
receive the various services. Since individualized service plans based on client interests and needs
are one objective of JTPA, this research design was not acceptable.
Instead, the research team sought to introduce random assignment into the application
process in a less disruptive way while st;',i producing (1) an estimate of the net impact of overall
JTPA services in the study sites and (2) estimates of the net impact of each service strategy for
the people local staff found appropriate for it. In the resulting research design, presented in detail
in Figure 3.1 and summarized in Figure 4.2, random assignment follows local staff
recommendations for services and designation of a service strategy.
This design addresses the two central impact questions:
1. Overall program net imparts are estimated by combining the three treatmentgroups (recommended for the classroom training, OJT/JSA, and other servicesstrategies) and comparing their experience following random assignment with acombined control group made up of the three separate control groups.
2. Service strategy net impacts arz. estimated by comparing the experiences of thetreatment gro.so for each strategy with those of the control group for thatstrategy.
This strategy also preserves to a much greater extent local staffs ability to operate their programs
following normal practices as to intake, assessment, and :ervice referral. However, the research
design used in this study does not prodi,ze experimental comparisons of the relative (or
"differential") impacts of service .strategies because assignment to each of the three treatment
groups and the control group was not random. Therefore, those referred to .the three service
strategies differed initially on many characteristics in addition to the services to which they were
given access. This choice of research design rests on an implicit decision by DOL that testing
62
X13

FIG
UR
E 4
.2
FIN
AL
DE
SIG
N F
OR
RA
ND
OM
AS
SIG
NM
EN
TF
OLL
OW
ING
AS
SE
SS
ME
NT
AN
D R
EC
OM
ME
ND
AT
ION
OF
A S
ER
VIC
E S
TR
AT
EG
Y(U
SE
D IN
TH
E N
AT
ION
AL
JTP
A S
TU
DY
)
(R
ecru
itmen
t )
(Elig
ibili
tyD
eter
min
atio
n
i(
Ass
essm
ent)
Con
sent
For
m a
ndG
iF C
ompl
etio
n
+
i.4(
Ser
vice
Str
ateg
yR
ecom
men
datio
n
cA
V
Cla
ssro
om T
rain
ing
Ser
vice
Str
ateg
y
Ran
dom
Ass
ignm
ent
Tre
atm
ent G
roup
114
1
Oth
er S
ervi
ces
Ser
vice
Str
ateg
y
Con
trol
Gro
upC
ontr
ol G
roup
(Not
Elig
ible
for
Tre
atm
ent G
roup
(Not
Elig
ible
for
Tre
atm
ent G
roup
JTP
A S
ervi
ces)
JTP
A S
ervi
ces)
Con
trol
Gro
up(N
ot E
ligib
le fo
rJT
PA
Ser
vice
s) 11 5

JTPA as closely as possible to the way it normally operates was more important than producing,through the experiment, differential impacts for the service strategies.
Once this choice was made, the research team faced the issue of when in the client flowto do random assignment, which also involved balancing research goals. The goal of estimatingnet impacts leads to a desire to place random assignment as early in the intake process as possiblein order to lessen the control group's contact with the program. Yet local staff had to work witha client long enough to make recommendations for services and designate a service strategybefore random assignment.
Another factor also was relevant: as mentioned in Chapter 3's discussion of client flow, ateach stage in program intake applicants can "exit" the system. Therefore, the closer randomassignment is placed to the actual start of services (i.e., the later in the intake process), thehigher the proportion of the treatment group receiving services. This makes the comparison ofthe experiences of the treatment group to the control group closer to a test of the impact ofservice receipt (which would be preferred) as opposed to the offer of services.
The choice made for the research design placed oreater emphasis on producing net impactsof JTPA (i.e., a control group 4th little involvement with the program) than on producing highenrollment rates in specific JTPA services. The research team worked with staff in each site toidentify an early point in JTPA client flow at which local staff believed they could decide whetheran applicant was appropriate for JTPA and identify the appropriate services and service strategy.In most cases, this came at the end of the normal assessment, which typically occurred quite earlyin the application process. In one site, staff decided to perform an initial assessment of clientsearlier than it normally did.1
II. Providing Alternative Program Impact Estimates
These decisions on the point of random assignment increased the importance of providingaltemativt impact estimates:
a pure "experimental" comparison of the treatment group and the controlgroup, which measures the impact of providing access to JTPA services to thosepeople who local staff recruited, assessed, and found eligible and appropriatefor the program; and
1This occurred in Larimer County, Colorado. See Appendix A for the details of client flow andrandom assignment in this site.
64
1I6

a conversion of this estimate to an approximate measure of the impact of JTPAon people who actually received services; i.e., adjusting for the fact that sometreatment group members never received program services.
Calculating the pure experimental impact estimate is relatively straightforward: this estimate.
is the difference in the average outcomes for treatment group members compared with the
averages for control group members. The outcomes measured in this study include, among others,
employment rates and earnings. These impacts are labeled "impacts per assignee" in the 18-
month impact report and stand for "impacts per person randomly assigned to the 18-month
treatment group sample."2 This treatment-control group comparison rests solely on the validity
of random assignment, which assures that there were no systematic differences between the two
groups at random assignment except that the treatment group was then given access to JTPA
services and the control group was not.
Ideally, one would convert this measure of the impact of the offer of access to JTPA to
an estimate of the impact of receiving JTPA services, i.e., "impacts per service recipient."
However, two types of issues arise in this effort.
On the data side, the only measure of service receipt in JTPA available for the entire
sample comes from the local SDA enrollment records. The results reported earlier on the
involvement of nonenrolled treatment members with JTPA imply that enrollment records
understate the receipt of JTPA assistance. The small sample size of this special study of
nonenrolled treatment group members makes it impossible to use these data to develop a more
accurate measure of service receipt for the full sample; thus, enrollment has to be used as a
proxy measure of "participation" in the program, even though it is likely to understate service
receipt.
Putting aside these data problems, there is no technique for directly calculating impacts per
enrollee that is as reliable as the pure experimental calculation of impacts per assignee. Enrollees
in JTPA are not a random sample of all treatment group members so it is incorrect to compare
the experiences of enrollees with those of the entire control group. Since there is at this time
no reliable way to identify the control group counterparts of people in the treatment group who
ended up enrolling in JTPA, a different approach must be tried.3
2Bloom et al , 1993.3Such attempt; encounter the types of analytical difficulties that earlier nonexperimental impact studies
experienced, which led DOL to decide on a random-assignment impact study. The nonexperimentalcomponent of this project is attempting to develop new methods to address these problems.
65
17

The precise details of the underlying assumptions and the calculations used to convert
impacts per assignee to impacts per enrollee are discussed in the 18-month impact report, but the
approach used assumes that all program impacts accrue to those who participated in JTPA (i.e.,
that nonparticipants were unaffected by JTPA) and that enrollment is a good measure of
participation. Impacts per enrollee are, therefore, "scaled up" impacts per assignee, reflecting the
assumption that enrollees are the source of all program impacts. As an illustration of this
conversion from impacts per assignee to impacts per enrollee, if the program affects only
enrollees, and if half of the treatment group enrolls in the program, then impacts per enrollee will
be twice those per assignee.4
This implied impact per enrollee rests on an untestable assumption that nonenrollees are
unaffected by the program. However, the finding of nonenrolled service receipt, reported in
Chapter 3, illustrates the need to question this assumption.
Recognizing this need for caution, the 18-month impact report presents impacts per assignee
and per enrollee, but argues that these "bracket" the ideal estimate: impacts per service recipient.
To illustrate why this is true, assume again that 50 percent of the treatment group were enrolled,
so that a conversion from impacts per assignee to impacts per enrollee would double the size of
the impacts. However, if an additional 25 percent of the treatment group, for example, received
some JTPA service without enrollment, then 75 percent of the treatment group were actually
service recipients (50 percent enrolled, 25 percent not). Impacts per service recipient would be
only 50 percent larger than impacts per assignee.
The only assumption needed for this bracketing argument to hold is that any program
impacts on nonenrolled "service recipients" do not have a different sign than the impacts on
enrollees. For example, if program impacts on enrollees are positive, the impacts on nonenrollees
must be zero or positive. If this assumption holds, the "intensity" of the services received by
nonenrollees and the size of the resulting impacts determine the "viidth" of the bracket: typically,
the less intensive the services, the smaller the bracket.
The findings on nonenrolled involvement in JTPA, reported in Chapter 3, are generally
consistent with this view, since most of the service for the half of the sample receiving some
JTPA assistance is clearly not intensive. However, in instances where individuals are referred to
4The conversion is made by dividing impacts per assignee by the enrollment rate. In this example,division by .5 doubles impacts. See Bloom et al., 1993, for the details of this procedure.
66

job club, they could have participated in the same services that led to enrollment for those who
found a job.
M. Defining Understandable and Operationally Relevant Service Stratecies
The third major research issue confronted in the study was the need to define service
strategies for the analysis that allowed separate analysis of key service emphases (classroom
training and OJT) while modifying normal assessment and service delivery practices as little as
possible. The discussion in Chapter 3 on the client flow in JTPA described the definitions of
service strategies that local staff used as part of the random-assignment process. A proof of the
usefulness of the definitions comes not from their theoretical attractiveness, but rather by
examining the patterns of service recommendations and enrollment for the individuals randomly
assigned to see if these desired service emphases actually did emerge as the study was
implemented.
To summarize the conclusion of this section: treatment group members in the classroom
training service strategy clearly received services that emphasized basic education and CT -OS,
with relatively high enrollment rates and a high percentage of enrollees receiving some type of
classroom-based services. Treatment group members in the OJT/JSA service strategy had lower
rates of enrollment in JTPA, but again a high percentage of enrollees received one of these
services. As intended, the other services strategy produced a diverse collection of services. There
was great variation among the sites in service emphasis and enrollment rates, topics discussed in
Chapter 7 of this report.
Table 4.1 shows the service recommendations made by local staff for the 18-month treatment
group sample, with individuals grouped into the three service strategies defined for this study:
classroom training, OJT/JSA, and other services. For all groups (shown in the first column), staff
recommended the classroom training service strategy for 36 percent of the individuals, OJT/JSA
for 37 percent, and other services for 27 percent. Under each service strategy subheading, the
rows show the percentage of the sample that staff recommended for the individual services and
combinations of services. For example, staff recommended 32 percent of all groups for CT-OS
as a sole service, 1 percent for Cf-OS and job search assistance, and so forth.
The pattern of service recommendations varied greatly among the four target groups shown
in the remaining columns of Table 4.1. Staff recommended the classroom training service strategy
for 44 percent of adult women and female youths coma red with only 25 percent of adult men
67
Q

TABLE 4.1
PERCENTAGE DISTRIBUTIONS OF SERVICE STRATEGY RECOMMENDATIONSAND RECOMMENDED PROGRAM SERVICES,
BY TARGET GROUP
Recommended Service StrategyAll Target
GroupsAdultMen
AdultWomen
MaleYouths
FemaleYouths
and Program Services (%) (%) (%) (%) (%)
Classroom Training 35.9 24.6 44.0 29.9 443CT-OS only 31.5 21.4 38.6 26.4 39.3CT-OS and JSA 0.8 0.6 1.3 0.2 0.7CT-OS and BE 0.6 0.2 0.5 1.2 1.2CT-OS and misc. services (a) 0.2 0.1 0.2 0.3 0.5CT-OS and 2 or more
other services 2.7 2.4 3.4 1.7 2.6
OJT/JSA 37.4 48.7 35.0 32.9 2.3.2OJT only 24.0 29.8 23.6 19.9 16.0OJT and JSA 8.1 12.2 7.0 6.5 3.7OJT and BE 0.2 0.2 0.0 0.5 0.1OJT and misc. services (a) 0.6 0.1 1.1 0.6 0.7OJT and 2 or more
other services 4.5 6.5 3.2 5.4 2.7
Other Services 26.7 26.7 21.0 37.3 32.5JSA only 5.8 8.6 5.2 4.9 2.0BE only 2.7 0.4 1.1 8.5 6.9Misc. services only (a) 13.2 14.4 10.0 16.5 15.7CT-OS and OTT 0.3 0.1 0.4 0.3 0.3JSA and BE 0.1 0.1 0.0 0.1 0.1JSA and misc. services (a) 1.6 1.9 1.6 1.4 1.3
BE and misc. services (a) 1.1 0.2 0.3 3.6 3.33 or more services 2.0 1.0 2.4 1.9 2.9
Total 100.0 100.0 100.0 100.0 100.0
Sample Size 11,474 3,759 4,465 1,436 1,814
SOURCE: MDRC calculaLions from Background Information Form responses.
NOTES: Calculations for this table are based on data for all treatment group membersin the 18-month study sample.
Recommended service strategy distributions may not total 100.0 percentbecause of rounding. Recommended program service distributions may not total the percentagerecommended for the service strategy because of rounding.
(a) Miscellaneous program services include such activities as assessment,job-readiness preparation, vocational exploration, job shadowing, and tryout employment.In this table, miscellaneous program services also include work experience, which isidentified as a separate program service in other reports on the National JTPA Study.
68 4"

and 30 percent of male youths. Staff recommended the OJT/JSA service strategy for 49 percent
of adult men and 33 percent of male youths compared with 35 percent of adult women and 23
percent of female youths.5
Table 4.2 presents JTPA enrollment rates for treatment group members recommended for
each service strategy, by target group. In the 18-month treatment group sample, 64 percent of
the treatment group were enrolled in JTPA at some point in the 18-month follow-up period
covered by this report, as shown in the bottom row of the column marked "All Target Groups."
The rows show enrollment rates for each of the three service strategies, with classroom training
having the highest rate (72 percent) and OJT/JSA the lowest rate (57 percent) for all target
groups.6 Within each service strategy, the variation in enrollment rates across the target groups
is relatively small. Aggregating across all service strategies, adult men were slightly less likely to
enroll than were the other target groups.
Moving beyond this summary measure of JTPA enrollment, it is useful to describe the key
services received by individuals in each service strategy. This can be done in two ways: (1) by
calculating the proportion of all treatment group members enrolled in specific services and (2)
by focusing on those who enrolled and calculating the proportion of enrollees who received
specific services. Both measures are useful and are presented in the following discussion. The
first measure is useful in characterizing the overall "strength" of the JTPA services received by the
entire treatment group. In the impact analysis, the primary impact estimate is calculated by
comparing the experiences of treatment group members with control group members, so this
measure is important in assessing the additional services received by the treatment group
compared with the services received by the control group.7 The second measure services
received by those who enroll is the same as that used in national reports on JTPA services.
This second measure, because it involves a shift to the smaller base of enrollees, produces higher
rates of receipt for individual services.
Table 43 summarizes the !TPA enrollment data for the treatment group members by
presenting information on the two key services, by target grt ip and service strategy. The top
panel presents data for all members of the treatment group; e.g., 61 percent of all adult male
5Members of the nonexperimental analysis team of the National JTPA Study are seeking, ways tomodel statistically the process of assessment and service recommendation in four of the 16 study SDAs.See Bloom et al., 1990, Chapter 6, for a discussion of the plans for this research.
6A later section of this chapter discusses possible reasons for this pattern.?The 18-month impact report presents information on the differences between the treatment and control
groups in service receipt as part of its analysis of program impacts.
69

TABLE 4.2
ENROLLMENT RATES FOR TREATMENT GROUP MEMBERS,BY SERVICE STRATEGY AND TARGET GROUP
All TargetGroups
AdultMen
AdultWomen
MaleYouths
FemaleYouths
Service Strategy (%) (%) (%) (%) (%)
Classroom Training 72.4 71.2 72.8 74.8 71.5
OJT/JSA 56.5 56.6 55.4 58.5 57.5
Other Services 62.3 58.9 62.4 67.7 63.1
All Strategies 63.8 60.8 64.6 66.8 65.5
SOURCE: MDRC calculations from Background Information Form responses and programenrollment data from the 16 SDAs.
NOTE: Calculations for this table la: based on data for all treatment group members in the18-month study sample.
70t e

TABLE 4.3
KEY SERVICES FOR TREATMENT GROUP MEMBERS AND ENROLLEES,BY TARGET GROUP AND SERVICE STRATEGY
Sample andTarget Group
ClassroomTraining OTT/JSA
OtherServices
TreatmentGroup Members
Adult Men 61% enrolled in 49% enrolled in 52% enrolled inCT-OS or BE OJT or JSA JSA or misc. services (a)
Adult Women 65% enrolled in 49% enrolled in 52% enrolled inCT-OS or BE OJT or ISA JSA or misc. services (a)
Male Youths 60% enrolled in 49% enrolled in 56% enrolled inCT-OS or BE OJT or JSA BE or misc. services (a)
Female Youths 62% enrolled in 49% enrolled in 50% enrolled inCT-OS or BE OJT or JSA BE or misc. services (a)
Enrollees
Adult Men 86% enrolled in 87% enrolled in 89% enrolled inCT-OS or BE OJT or JSA JSA or misc. services (a)
Adult Women 89% enrolled in 88% enrolled in 82% enrolled inCT-OS or BE OJT or JSA JSA or misc. services (a)
Male Youths 80% enrolled in 85% enrolled in 83% enrolled inCT-OS or BE OJT or JSA BE or misc. services (a)
Female Youths 86% enrolled in 85% enrolled in 80% enrolled inCT-OS or BE OJT or JSA BE or mit.% services (a)
SOURCE: MDRC calculations from Background Information Form responses and fromprogram enrollment and participation data from the 16 SDAs.
NOTES: Calculations for this table are based on data for all treatment group members andenrollees in the 18-month study sample.
(a) Miscellaneous program services include such activities as assessment, job-readinesspreparation, vocational exploration, job shadowing, and tryout employment. In this table,miscellaneous program services also include work experience, which is identified asa separate program service in other reports on the National JTPA Study.
71? 3
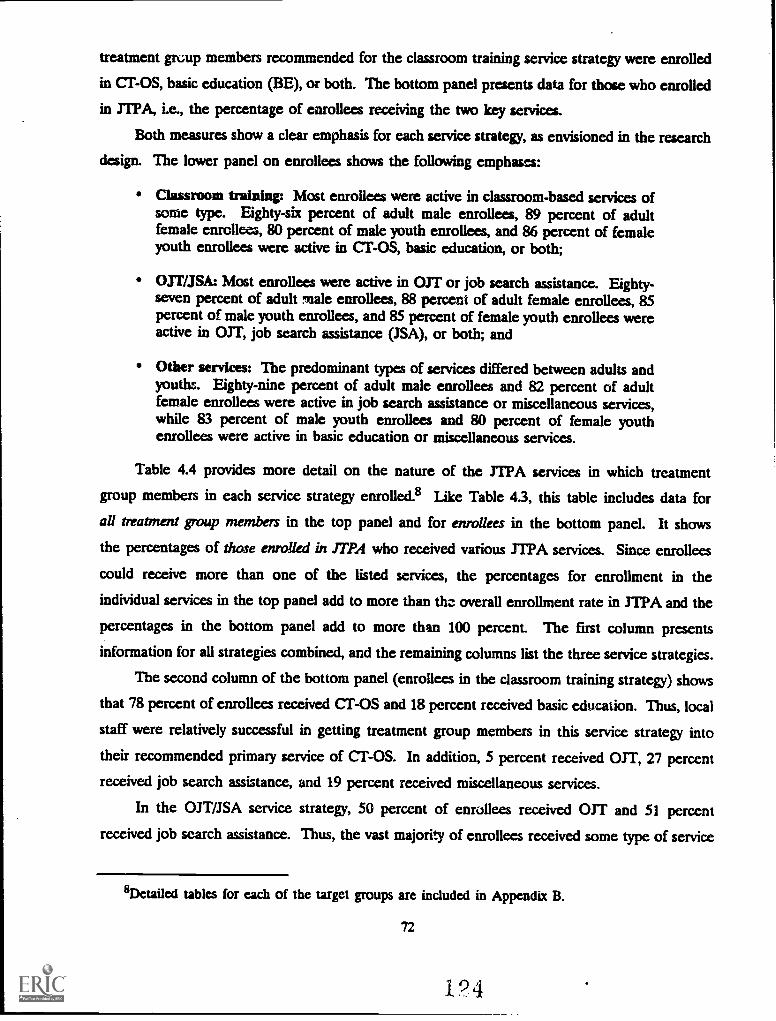
treatment group members recommended for the classroom training service strategy were enrolled
in Cr-OS, basic education (BE), or both. The bottom panel presents data for those who enrolled
in JTPA, i.e., the percentage of enrollees receiving the two key services.
Both measures show a clear emphasis for each service strategy, as envisioned in the research
design. The lower panel on enrollees shows the following emphases:
Classroom training: Most enrollees were active in classroom-based services ofsome type. Eighty-six percent of adult male enrollees, 89 percent of adultfemale enrollees, 80 percent of male youth enrollees, and 86 percent of femaleyouth enrollees were active in Cr-OS, basic education, or both;
OJT/JSA: Most enrollees were active in OJT or job search assistance. Eighty-seven percent of adult male enrollees, 88 percent of adult female enrollees, 85percent of male youth enrollees, and 85 percent of female youth enrollees wereactive in OJT, job search assistance (JSA), or both; and
Other services: The predominant types of services differed between adults andyouths. Eighty-nine percent of adult male enrollees and 82 percent of adultfemale enrollees were active in job search assistance or miscellaneous services,while 83 percent of male youth enrollees and 80 percent of female youthenrollees were active in basic education or miscellaneous services.
Table 4.4 provides more detail on the nature of the JTPA services in which treatment
group members in each service strategy enrolled.8 Like Table 4.3, this table includes data for
all treatment group members in the top panel and for enrollees in the bottom panel. It shows
the percentages of those enrolled in JTPA who received various JTPA services. Since enrollees
could receive more than one of the listed services, the percentages for enrollment in the
individual services in the top panel add to more than thz overall enrollment rate in JTPA and the
percentages in the bottom panel add to more than 100 percent. The first column presents
information for all strategies combined, and the remaining columns list the three service strategies.
The second column of the bottom panel (enrollees in the classroom training strategy) shows
that 78 percent of enrollees received Cr-OS and 18 percent received basic education. Thus, local
staff were relatively successful in getting treatment group members in this service strategy into
their recommended primary service of Cr-OS. In addition, 5 percent received OJT, 27 percent
received job search assistance, and 19 percent received miscellaneous services.
In the OJT/JSA service strategy, 50 percent of enrollees received OJT and 51 percent
received job search assistance. Thus, the vast majority of enrollees received some type of service
8Detailed tables for each of the target groups are included in Appendix B.
72
124

TABLE 4.4
SERVICE RECEIPT RATES FOR TREATMENT GROUP MEMBERS AND ENROLLEES,BY SERVICE STRATEGY
Sample andProgram Service Received
AllStrategies
ClassroomTraining OJT/JSA
OtherServices
Treatment Group Members
Ever Received (%)Classroom training in
occupational skills (CT-OS) 23.9 56.2 3.3 9.4On-the-job training (OJT) 13.1 3.8 28.0 4.7Job search assistance (JSA) 23.0 19.5 28.9 19.7Basic education (BE) 10.0 12.9 3.1 15.7Miscellaneous services (a) 16.6 13.4 8.6 31.9
Sample Size 11,474 4,123 4,287 3,064
Enrollees
Ever Received (%)Classroom training in
occupational skills (CT-OS) 37.5 77.6 5.8 15.1
On-the-job training (OJT) 20.S 5.2 49.6 7.5Job search assistance (JSA) 36.1 26.9 51.1 31.6Basic education (BE) 15.7 17.8 5.5 25.2Miscellaneous services (a) 26.0 18.6 15.2 51.1
Sample Size 7,316 2,986 2,421 1,909
SOURCE: MDRC calculations from Background Information Form responses and fromprogram enrollment and participation data from the 16 SDAs.
NOTES: Calculations for this table are based on data for all treatment group membersand enrollees in the 18-month study sample.
In each panel, the total service receipt rate in each service strategy may be over 100.0percent because some treatment group members and enrollees received more than one service.
Tests of statistical significance were not performed.(a) Miscellaneous program services include such activities as assessment, job readiness
preparation, vocational exploratiote, job shadowing, and tryout employment. In this table,miscellaneous program services also include work experience, which is identified asa separate program service in other reports on-the National JTPA Study.
73c5

designed to place them immediately in an unsubsidized job or a job providing subsidized training.
In addition, 15 percent received miscellaneous services.
As planned, the other services strategy comprises a mixture of services. This reflects the
fact that very different types of applicants could be referred to this service strategy. It includes
the most job-ready applicants, who were recommended only for job search assistance, and those
for whom pretraining services such as basic education or preemployment skills and exposure to
the world of work (included within miscellaneous services in Tables 43 and 4.4) were appropriate.
Consequently, the services received varied between adults and youths, with job search Assistance,
basic education, and miscellaneous services all being important.
The operational reality of tasks involved in arranging different types of JTPA services helps
explain the differing enrollment rates and service receipt across the three service strategies. For
classroom training, JTPA staff must identify a service provider (i.e., a community college, technical
institute, proprietary school, or community-based organization) that offers training the client wants
and that will accept someone with the client's qualifications. In many SDAs, especially those that
include urban areas, there are several agencies whose mission is to provide training.9
While making a match between a client and a classroom training provider is not always
easy, the JTPA agency and the service provider have similar missions (providing training) and
may well see each other as continuing partners. JTPA may be a major funder of training in a
community, especially at community-based organizations and other agencies without major state
government grants-in-aid. JTPA staff report that they often know the details of entrance
requirements for different types of training and use this in developing recommendations for
individual clients. In some jurisdictions, training agencies may even accept the test results and
assessment made by JTPA staff.19 These factors suggest that a relatively high proportion of the
classroom training program group will be placed with a training agency and enrolled in JTPA.
The process for developing an OJT position differs substantially and in ways likely to lead
to lower rates of enrollment both in OJT and in JTPA overall for the OJT/JSA service
strategy. Private employers' main goal is producing goods or services, not subsidized training.
They must be induced to participate as employers and trainers through a combination of financial
9Among the SDAs in the study, rural sites such as Butte, Montana, and Northwest Minnesota workedwith as few as three classroom training service providers for adults and out-of-school youths, while moreurban sites such as Fort Wayne, Indiana, typically contracted with 20 or more agencies for training.
19Service providers may be hesitant to do this when they are paid through a performance-based contractwith a substantial proportion of funds tied to successful completion of training and placement in a job.
74
incentives and assurances that the administrative costs will not overwhelm the subsidy they receive.
Even in small programs, local staff have to develop off positions with many different employers.
With minority clients, staff may face employer discrimination, which can be subtle and hard to
document, and employers considering offering an OJT position typically retain the hiring authority.
Finally, clients are likely to be actively seeking employment (as those slated for the classroom
training strategy often are not), either on their own or through other program services such as
job search assistance. If a client does find an unsubsidized job, it could result in no JTPA
enrollment (if the placement was unrelated to the program) or to an enrollment in job search and
a placement.
These operational realities also affect the experiences of those members of the treatment
group who were neve-L. enrolled in JTPA. Table 4.5 is based on the special survey of the
nonenrolled treatment group members referred to in Table 3.2. It shows that in the classroom
training strategy, most of those who were never enrolled in JTPA either lost contact with the
program (28 percent), were no longer interested in JTPA (19 percent), or did not receive any
substantial services from local staff (28 percent). In this service strategy, for the remaining 23
percent of the nonenrolled, local staff worked unsuccessfully to arrange a service and enroll the
client.
The situation for OJT/JSA is in sharp contrast. Staff worked unsuccessfully with 68 percent
of the nonenrolled to arrange a service and enroll the client. Fifty-seven percent of this sample
of the nonenrolled were referred to employers for a potential OJT position, while 23 percent
-received other help finding a job.
The data in this table provide supporting evidence that arranging placement in a service
that results in enrollment in JTPA is easiest in the classroom training service strategy. The JTPA
enrollment rate is highest for those recommended for this strategy, and the rate at which staff
work with clients without producing an enrollment is lowest (23 percent rate for classroom
training versus 68 percent for OJT/JSA and 49 percent for other services).
To summarize, nonenrolled post-random-assignment involvement in JTPA was most common
among those in the OJT/JSA service strategy and least common among those in the classroom
training strategy. Since JTPA enrollment rates follow an opposite pattern, when nonenrolled data
are combined with enrolled data, differences in involvement with JTPA among the service
strategies diminish. Those in the OJT/JSA strategy were slightly more likely (86 percent) to have
75
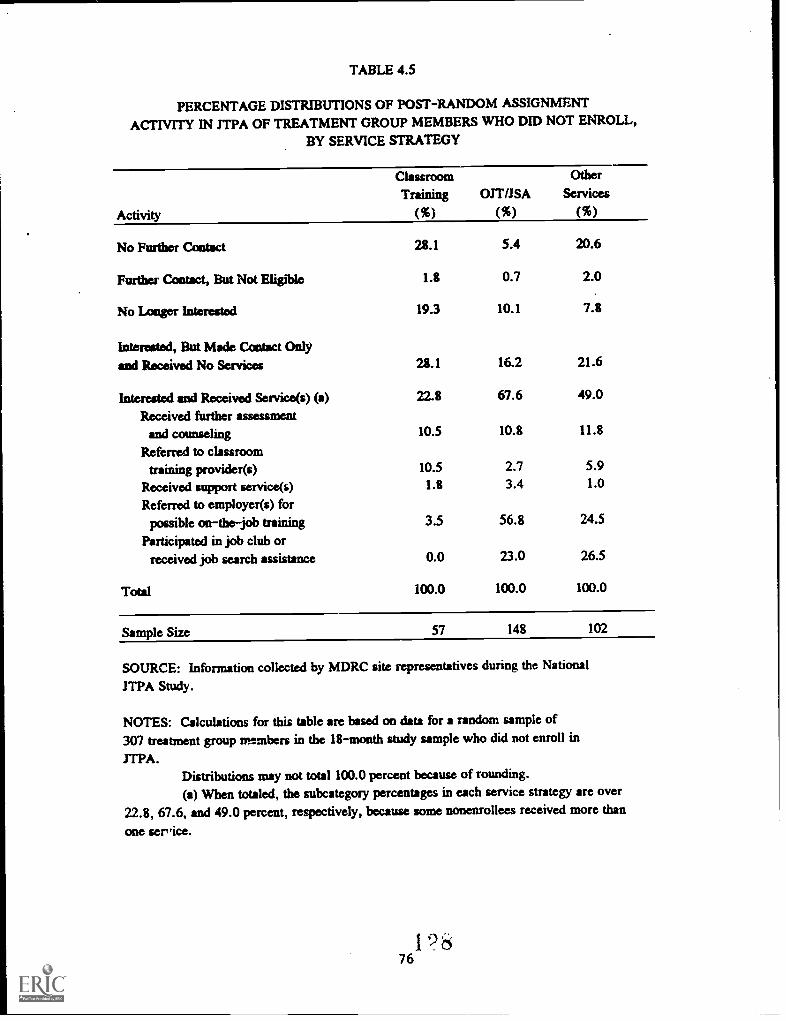
TABLE 4.5
PERCENTAGE DISTRIBUTIONS OF POST-RANDOM ASSIGNMENT
ACTIVITY IN JTPA OF TREATMENT GROUP MEMBERS WHO DID NOT ENROLL,
BY SERVICE STRATEGY
ClassroomTraining OJT /JSA
OtherServices
Activity (%) (%) (%)
No Further Contact 28.1 5.4 20.6
Further Contact, But Not Eligible 1.8 0.7 2.0
No Longer Interested 19.3 10.1 7.8
Interested, But Made Contact Onlyand Received No Services 28.1 16.2 21.6
Interested and Received Service(s) (a) 22.8 67.6 49.0
Received further assessmentand counseling 10.5 10.8 11.8
Referred to classroomtraining provider(s) 10.5 2.7 5.9
Received support service(s) 1.8 3.4 1.0
Referred to employer(s) forpossible on-the-job training 3.5 56.8 24.5
Participated in job club orreceived job search assistance 0.0 23.0 26.5
Total 100.0 100.0 100.0
Sample Size 57 148 102
SOURCE: Information collected by MDRC site representatives during the National
JTPA Study.
NOTES: Calculations for this table are based on data for a random sample of307 treatment group members in the 18-month study sample who did not enroll in
'TPA.Distributions may not total 100.0 percent because of rounding.(a) When totaled, the subcategory percentages in each service strategy are over
22.8, 67.6, and 49.0 percent, respectively, because some nonenrollees received more than
one ser 'ice.

had some post-random-assignment involvement with JTPA than people in the other strategies (81
percent for other services and 79 percent for classroom training).11
To sum up, three main findings emerge from this chapter. First, the chosen point of
random assignment produced estimates of the overall impact of JTPA for the entire sample and
target groups and subgroups, as well as impacts for individuals recommended for three service
strategies. Second, the research design allows calculation of estimates in two ways: impacts per
assignee (based on a comparison of the treatment and control groups), which can be converted
to impacts per enrollee, though the assumptions underlying this conversion (while they appear
reasonable) cannot be tested. Third, the service strategies analyzed in the implementation and
impact research did have clear programmatic emphases. The focus of the classroom training
strategy was as expected, while OJT/JSA involved job placement (through subsidized OJT or job
search). The other services strategy emphasized job search assistance and miscellaneous services
for adults, and basic education and miscellaneous services for youths.
iiThe Iple for this special study was too small to allow simultaneous disaggregation by target groupand service strategy.
77

CHAPTER S
SERVICES RECEIVED BY ADULT ENROLLEES
This chapter describes the distribution of JTPA services among adult members of the 18-month treatment group sample who were officially enrolled in JTPA.1 The analysis shifts awayfrom the focus of the previous chapters on artifacts of the mearch design such as distinctions
between all treatment group members and enrollees and the concept of "recommended service
strategies." For the analysis in this chapter, adult enrollees have been grouped according to thetypes of services they actually received rather than the service strategies for which they wererecommended at assessment and random assignment. Within this framework, the chapter analyzes
service receipt rates and the length of enrollment for the adult target groups (men and women)and other key subgroups of adult enrollees.
Readers of the 18-month impact report can use the information in Chapters 5 and 6 as acontext for understanding a key determinant of program impacts: the types and duration ofservices that enrolled treatment group members received.2 The chapters also provide a
perspective on how JTPA resources were distributed among key demographic groups that theSDAs tried to target for services.
This chapter (and Chapter 6, which focuses on out-of-school youths) organizes the analysis
of services received and length of enrollment around five mutually exclusive categories. The five
categories divide the sample into two groups of enrollees who received some form of occupational
training (either in the classroom or on the job) and free groups who received other services
without occupational training. The categories are: (1) classroom training in occupational skills
(CT -OS) only or CT-OS in combination with on-the-job training (UM, basic education, job
search assistance, or miscellaneous services (referred to in the tables and text as CF -OS); (2) OJT
only or OTT in combination with basic education, job search assistance, or miscellaneous services
lAs noted in earlier chapters, treatment group members were identified as 'officially enrolled in JTPA'if the local SDA staff established an enrollment record on their JTPA management infonaation system(MIS) during the 18-month follow-up period.
`See Bloom et al., 1993, for an analysis of another key determinant of program impacts: the extentto which control group members received equivalent services from sources other than JTPA.
78
a3

(referred to in the tables and text as OJT);3 (3) basic education only, without occupational
training, or basic education in combination with job search assistance or miscellaneous services
(referred to in the tables as non-training education and in the ext as basic education without
training);4 (4) job search assistance only; and (5) miscellaneous services only or miscellaneous
services in combination with job search assistance (referred to in the tables and text as
miscellaneous non-training services).
These five scivice categories provide a framework for examining service receipt rates for
JTPA enrollees and for analyzing the determinants of a key facet of service intensity: length of
enrollment. Following is an overview of key findings in this chapter:
A majority of the enrolled adults received some form of occupational trainingthrough either CT-OS or OJT. Thirty-eight percent of the adult enrolleesreceived CT-OS and an additional 21 percent received OJT. Nineteen percentof the adult enrollees received job search assistance only, and the remainderreceived either basic education without training or other non-training services.
Adult enrollees with two or three of the employment barriers analyzed (highschool dropout, limited work experience, and cash public assistance recipient)were less likely to receive OJT and job search assistance only and more likelyto receive basic education without training than those with no employmentbarriers. Adults with limited work experience or who were receiving publicassistance were more likely to receive classroom-based services such as CT-OSand basic education without training and less likely to receive employment-basedservices such as OJT and job search assistance only receipt than adults withoutthese employment barriers. Adults with no high school diploma or GED wereless likely to receive CT-OS and more likely to receive basic education withouttraining than high school graduates or GED recipients.
Women tended to receive classroom-based services while men tended to receiveemployment-based services. Employment barriers accounted for much of thegender difference in OJT receipt, but very little of the difference in CT-OSreceipt. Overall, 56 percent of the adult women compared with 34 percentof the men received either CT-OS or basic education without training. Bycontrast, 49 percent of the adult men compared with 33 percent of thewomen received OJT or job search assistance only.
3Note that the 1.3 percent of the adult enrollees who received both CT-OS and OJT are grouped onlyin the Cr-OS service category. This is because CT -OS was often the primary service, with an OJT usedas a temporary link to an unsubsidized job.
4Basic education includes a range of education services: adult basic education (commonly referred toas ABE), GED preparation, English as a second language classes (commonly referred to as ESL), andcommunity college courses. These are all grouped under the term "basic education" in order to differentiatethem from CT-OS.
79

Black and Hispanic enrollees were more likely to receive CT-OS and lesslikely to receive OJT than white enrollees. Employment barriers accounted forsome, but not all, of the ethnic differences in service receipt. Fifty-one percentof the black enrollees and 39 percent of the Hispanic enrollees received CT-OS compared with 31 percent of the white enrollees. By contrast, 26 percentof the white enrollees received OJT compared with 16 percent of the blackenrollees and 11 percent of the Hispanic enrollees.
The median length of JTPA enrollment for adults in the five service categoriesranged from almost five months to only one month. Overall, the medianlength of enrollment for adult enrollees was 3.2 months. The median length ofenrollment was longest at 4.8 months for those who received CI -os andshortest at one month for those who received job search assistance only. Themedian length of enrollment for adults who received OTT was 2.5 months.
These general findings are discussed in greater detail in the following sections of thechapter.
I. Service Receipt in the Five Service Categories
After describing the overall distribution of services among enrolled adults, this section
presents three levels of analysis of the types of services received by adults. It examines the
services received by each of the two adult target groups (men and women), analyzes differences
in service receipt rates among selected subgroups of adults, and, finally, examines whether service
receipt differences among adults with various combinations of employment barriers account for
gender and ethnic differences in service receipt.
The top row in Table 5.1 lists the service receipt rates for adult enrollees in each of the
five service categories. Overall, 59 percent of the adults received some type of occupational
training either in the classroom or on the job. This number was calculated by adding the
percentages of all adults who ever received CT-OS (38 percent) and of all adults who ever
received OJT (21 percent). The table also shows that 19 percent of the adults received job
search assistance as their only service, 8 meal received basic education without training, and theremaining 14 percent received miscellaneous non-training services.
The remainder of Table 5.1 lists selected subgroups of adult enrollees and the percentage
of each subgroup who received each category of services. Statistical tests were performed to
determine whether there were significant differences in service receipt rates between the first
subgroup listed under each characteristic and each of the other subgroups. For example, among
the subgroups defined by ethnicity, the table indicates that there was a statistically significant
80

TABLE 5.1
SERVICE RECEIPT RATES FOR ADULT ENROLLEES,BY SELECTED BASELINE CHARACTERISTICS
Characteristicand Subgroup
SampleSize
Non-Training
CT-OS (a) OJT (b) Education (c)(%) (%) (%)
JSAOnly
(%)
Misc.Non-TrainingServices (d)
(%)
All Adult Enrollees 5,169 38.0 20.8 7.9 19.2 14.0
Target GroupAdult Men 2,286 26.3 24.3 7.2 25.0 17.2
Adult Women 2,883 47.2 *** 18.1 *** 8.4 * 14.7 *** 11.6 ***
Age22-29 2,305 39.1 22.3 8.2 16.4 14.0
30-44 2,239 39.2 19.2 *** 8.2 19.5 *** 13.9
45 and over 625 29.6 *** 21.1 5.6 ** 28.8 *** 14.9
EthnicityWhite, non-Hispanic 2,941 30.6 25.9 9.1 20.0 14.5
Black, non-Hispanic 1,432 50.5 *** 15.6 *** 2.7 *** 19.7 11.5 ***Hispanic 589 38.7 *** 11.0 *** 15.8 *** 16.3 ** 18.2 **Other 207 55.1 *** 13.0 *** 3.9 ** 14.0 ** 14.0
EducationHigh school diploma or GED 3,491 41.3 20.8 4.0 20.3 13.6No high school diploma or GED 1,342 29.4 *** 21.7 17.8 *** 16.6 *** 14.5
Work ExperienceWorked 13 weeks or more
in 12 months before assignment 2,428 34.4 23.7 6.0 21.9 14.0
Worked fewer than 13 weeksin 12 months before assignment 2,178 42.2 *** 17.5 *** 9.6 *** 16.1 *** 14.6
Public Assistance ReceiptNot receiving AFDC or other cash
assistance at assignment 3,287 34.8 23.8 5.1 22.2 14.1
Receiving AFDC or other cashassistance at assignment 1,405 47.1 *** 14.0 *** 14.7 *** 11.5 *** 12.7
Bathers to Employment (e)None 1,828 35.6 24.1 2.6 23.5 14.2
1 1,952 37.5 21.6 * 6.7 *** 20.5 ** 137
2 1,092 42.4 *** 16.8 *** 13.6 *** 13.2 *** 14.0
3 263 40.3 10.3 *** 28.5 *** 6.1 *** 14.8
(continued)
81

TABLE 5.1 (continued)
Characteristic Sample CT-OS (a)
Non-Training
OTT (b) Education (c)JSAOnly
Misc.Non-TrainingServices (d)
and Subgroup Size (%) (%) (%) (%) (%)
AFDC HistoryNever received AFDC 3,461 32.7 23.2 6.4 22.8 14.8Received AFDC less than2 years (f) 837 44.1 *** 18.6 *** 10.4 *** 14.3 *** 12.5 *Received AFDC 2 yearsor more (f) 799 54.1 *** 13.6 *** 11.1 *** 9.0 *** 12.1 *
Household CompositionSpouse present 1,410 31.3 23.4 9.4 22.5 13.4No spouse present, child present 1,558 49.5 *** 18.0 *** 8.2 12.6 *** 11.6No spouse present, no childpresent 1,633 31.2 22.7 6.1 *** 23.1 16.9 ***
SOURCE: MDRC calculations from Background Information Form responses and from program enrollmentand participation data from the 16 SDAs.
NOTES: Calculations for this table are based on data for all adult enrollees in the 18-month study sample.The total sample size may vary among characteristics because of missing data for some enrollees.
The program service categories in this table are mutually exclusive; see notes a, b, c, and d below.For each characteristic, within each program service category, a chi-square test was applied to the
difference in service receipt rates between the first subgroup listed and, separately, each of the remaining subgroups.Statistical significance levels are indicated as * = 10 percent; ** = 5 percent; "* = 1 percent.
(a) The CT-OS service category includes enrollees who received CT-OS only, or CT-OS incombination with OJT, basic education, job search assistance, or miscellaneous program services.
(b) The OTT service category includes enrollees who received OTT only, or OJT in combinationwith basic education, job search assistance, or miscellaneous program services.
(c) The non-training education service category includes enrollees who received basic educationonly, or basic education in combination with job search assistance or miscellaneous program services.
(d) The miscellaneous non-training services category includes enrollees who received miscellane-ous program services only, or miscellaneous program services in combination with job search assistance.Miscellaneous program services include such activities as assessment, job-readiness preparation, vocationalexploration, job shadowing, and tryout employment. In this table, miscellaneous program services alsoinclude work experience, which is identified as a separate program service in other reports on the NationalJTPA Study.
(e) The barriers to employment include: not having a high school diploma or GED at the time ofrandom assignment; having worked fewer than 13 weeks during the 12 months prior to random assignment;and receiving AFDC or other cash assistance at the time of random assignment.
(f) The AFDC receipt may not have been continuous.
82

difference between the percentage of white adults who received CT-OS (31 percent) and the
percentage of black adults who received CT-OS (51 percent). The table also indicates that there
was a statistically significant difference between the percentage of white adults who received CT-
OS and the percentage of Hispanic adults who received cr-os (39 percent).5
A. Service Receipt Rates for Each of the Adult Target Groups
Table 5.1 shows several contrasts between men and women in the types of services they
received. Overall, a total of 65 percent of the women received either CT-OS or OTT compared
with only 51 percent of the men. The table also highlights the sharp contrast in the mode of
occupational training (classroom versus on-the-job) that men and women received. Specifically,
47 percent of the women received CT-OS compared with only 26 percent of the men, and 18
percent of the women received OJT compared with 24 percent of the men.
More generally, women tended to receive either type of classroom-based service CT-OS
or basic education without training while men tended to receive either type of employment-
based service OJT or job search assistance only. Specifically, a total of 56 percent of the
women received either CT-OS or basic education without training compared with 34 percent of
the men. Conversely, a total of 49 percent of the men received OJT or job search assistance only
compared with 33 percent of the women.
Finally, men and women differed in the extent to which they received multiple services. For
example, 30 percent of the women received two or more services compared with only 21 percent
of the men. This difference reflects the fact that women were more likely than men to combine
job search assistance and miscellaneous services with their classroom-based services.6 Further
analysis of the extent to which differences in service receipt rates associated with employment
barriers account for target group differences in service receipt rates is discussed later in the
chapter.
5Statistical tests to determine whether there were significant differences in service receipt rates betweenthe second and third subgroups listed under each characteristic were not performed. In this example, therewas no statistical test of the difference between the percentage of black enrollees who received CT-OS andthe percentage of Hispanic enrollees who received CT-OS. Unless otherwise noted, discussion of servicereceipt differences among subgroups focuses on those that are statistically significant at the 10 percent level
or lower.6These percentages are based on MDRC calculations from enrollment and participation data from the
16 SDAs in the National JTPA Study.
83

B. Service Receipt Rates for Subgroups of Adult Enrollees
This section discusses the distribution of JTPA services among the subgroups of adult
enrollees listed in Table 5.1. Although many of the subgroup differences in service receipt are
similar for men and women, any especially large differences are indicated in the text, and
Appendix B provides separate subgroup tables for adult men and women.
1. Age subgroups. Table 5.1 indicates that the largest differences in service receipt
among subgroups defined by age at random assignment are those between the oldest and youngest
adult enrollees. Adults aged 45 and over were less likely than those aged 22-29 to receive CT-
OS or basic education without training and more likely to receive job search assistance only. This
suggests that age may serve, in part, as an indication of job-readiness or previous employment
experience that orients older workers toward unsubsidized jobs rather than classroom-based
services.
2. Ethnic subgroups. Table 5.1 shows dramatic differences among white and black
adults in the percentage who received CT-OS and OJT. In total, black adults were more likely
to receive occupational training either in the classroom or on the job than white adults; 66
percent of the black adults received CT-OS or OJT compared with 57 percent of the white
adults? However, white and black adults differed markedly in the mode of training they received.
Specifically, 51 percent of the black adults received CT-OS compared with only 31 percent of the
white adults, and only 16 percent of the black adults received OJT compared with 26 percent of
the white adults.8
Two other black/white findings related to service receipt should be noted. First, black and
white adults were equally likely to receive job search assistance as their only service. Second,
white adults were three times more likely than black adults to receive basic education without
training.9 This is surprising because 26 percent of blacks had no high school diploma or GED
at the time of their JTPA application compared with 29 percent of whites.
Note that differences in the total percentage who received any type of occupational trainingcombining the percentage who received Cr-OS with the percentage who received OJT were not testedfor statistical significance.
8White/black differences in mode of occupational training (classroom versus on the job) that adultsreceived were especially large among the men. For example, black men were twice as likely as white mento receive CT-OS, but they were half as likely to receive OJT (see Appendix B).
9Closer analysis also showed that white enrollees were much more likely than black enrollees to receivebasic education in combination with CT-OS or OJT.
84

Table 5.1 also shows that Hispanic adults received different types of services than white
adults. First, only 11 percent of the Hispanic adults received OJT compared with 26 percent of
the white adults. In total, 50 percent of the Hispanic adults received occupational training
either CT-OS or OJT compared with 57 percent of the white adults. However, 16 percent of
Hispanic adults received basic education without training compared with 9 percent of the white
adults. The high rate of non-training education receipt among Hispanic adults may be due to the
fact that ESL classes are included among these services. This suggests that language may have
posed an important barrier to occupational training.
Later in the chapter, the discussion returns to an analysis of the extent to which differences
in service receipt rates associated with employment barriers account for differences in service
receipt rates among ethnic groups.1°
3. Employment barrier subgroups. This section focuses on the distribution of JTPA
service among subgroups of adult enrollees defined by three employment barriers: those with no
high school diploma or GED at the time of random assignment (referred to as high school
dropout), those who worked fev. -tr than 13 weeks in the year prior to random assignment
(referred to as limited work e cperience), and those who were receiving AFDC or other cash
assistance at the time of random assignment (referred to as cash public assistance recipient).
Table 5.1 highlights several associations between these employment barriers and the types
of services that adult enrollees were likely to receive. For example, high school dropouts were
less likely to receive CT-OS than graduates or those who obtained a GED, but they were equally
likely to receive OJT. In total, therefore, 51 percent of the high school dropouts received either
CT-OS or OJT compared with 62 percent of those withas
high school diploma or GED. Instead
of receiving CT-OS, however, it appears that high school dropouts tended to receive basic
education without training. Table 5.1 shows that dropouts were more than four times as likely
to receive basic education as those with a diploma or GED. The relatively low percentage of
high school dropouts who received CT-OS can be explained, in part, because some classroom
training providers require a high school diploma or its equivalent for enrollment in their programs.
However, very few of the SDAs in the study combined basic education and CT-OS for those who
lacked that educational credential.
10It should be noted that these differences in service receipt rates do not appear to have translated intostatistically significant differences in program impacts on earnings by ethnicity. See Bloom et al., 1993.
85
7

Not surprisingly, adults with limited work experience were less likely to receive OJT or job
search assistance only than those who worked 13 weeks or more in the previous year. This may
be due, in part, to the fact that those with limited work experience are likely to be less attractive
to employers who may tend to select the most qualified people for their OJT positions or
unsubsidized jobs. In total, however, 60 percent of those with limited work experience received
some type of occupational training either cr-os or OJT compared with 58 percent of
those with more work experience.11 This suggests that those with limited work experience were
able to substitute occupational training in the classroom for the OJT they did not obtain or did
not want.
Table 5.1 also shows that cash public assistance receipt was associated with higher rates of
CT-OS receipt. This is especially significant for women, who were much more likely than men
to be receiving public assistance at the time of JTPA application. Those who were not receiving
public assistance at JTPA application were almost twice as likely to receive job search assistance
only as those who were. However, public assistance recipients were almost three times as likely
to receive basic education without training as those who were not receiving AFDC or other cash
assistance at the time of random assignment. This may be due to the fact that approximately 75
percent of the adult cash public assistance recipients also lacked a high school diploma or GED
or had only limited work experience.
Service receipt rates were also associated with the number of employment barriers that
adults possessed. For example, adults with multiple employment barriers were less likely than
those with no employment barriers to receive OJT or job search assistance only and were more
likely to receive CT-OS or basic education without training.
4. AFDC history and household composition subgroups. Finally, Table 5.1 shows that
AFDC history and household composition were associated with service receipt rates. Like those
who were receiving cash assistance at the time of random assignment, long-term AFDC recipients
were also more likely to participate in classroom-based services and less likely to participate in
employment-based services than adults who had never received AFDC. This suggests that those
on public assistance may have been able to forgo earnings in order to invest in education and
11This finding reflects the average for all adults, but not necessarily for each subgroup of adults. Forexample, men with limited work experience were less likely to receive occupational training CT-OS orOTT than men with more work experience. This is primarily because men with limited work experiencewere no more likely to receive CT -OS than men with male work experience. For a separate analysis of menand women, see Appendix B.
86
`18

training. This is supported by the fact that half of the single parents those most likely to have
a history of AFDC receipt received CT-OS.
C. Further Discussion of Key Findings
Three sets of findings stand out from the analyses discussed in the previous sections: gender
differences in service receipt, ethnic differences in service receipt, and the association between
employment barriers and the types of services that adults received. Recently, considerable
attention has been focused on differences in the distribution of JTPA services among gender,
ethnic, and job-readiness groups of JTPA participants.12 This section addresses the question of
whether, within the 16 study sites, differences in service receipt rates associated with employment
barriers account for differences in the services received among gender and ethnic groups.
Specifically, the analysis examines gender and ethnic differences in service receipt within
subgroups of enrollees defined by the various combinations of the three employment barriers
analyzed earlier (high school dropout, limited work experience, and cash public assistance
recipient). This will permit a further investigation of the hypothesis that male and female adults
(or black and white adults) with the same employment barriers were equally likely to receive a
particular service.
Because many of the black and Hispanic adults were concentrated in the larger urban SDAs
and because black and Hispanic adults differed from white adults in characteristics other than
120ne highly publicized study investigated disparities in the services provided to gender and ethnicgroups of JTPA participants (see U.S. General Accounting Office, 1991). This study analyzed aggregate datafrom SDAs in 16 states and participant-level data in seven large-city SDAs. The report focused on itsfindings that, in general, women received classroom training more often than men.
This report also focused on its findings that in 20 percent of the SDAs it studied, white participantswere more likely to receive classroom training than minority group members; in 13 percent of the SDAs,white participants were more likely to receive OJTs; and in 18 percent of the SDAs, minority groupmembers were more likely to receive job search assistance only. In the rest of the SDAs, services wereeither distributed equally among ethnic and gender groups or minority and female participants were morelikely than white male participants to receive high-skill occupational training.
A second study investigated the relationship between the level of participants' job-readiness and thetypes of services they received. (See U.S. General Accounting Office, 1989.) The investigators used four"employment barriers" (lacking recent work experience, being a high school dropout, receiving AFDC orgeneral welfare, and being black or Hispanic) to identify groups of JTPA participants who were more orless job-ready. The report emphasized its finding that 60 percent of the "less job-ready" participants receivedoccupational training (either classroom or OJT) compared with 72 percent of the more job-ready. Inaddition, approximately one third of the more job-ready participants received training in "high-skilloccupations" compared with 16 percent of the less job-ready participants. The investigators also reportedthat 22 percent of the more job-ready participants received job search assistance only compared with 27percent of the less job-ready participants.
87

employment barriers, the analysis of ethnic differences in service receipt is extended further.
Specifically, ethnic differences in service receipt were tested within a multivariate regression
framework that adjusted for other differences in service receipt that may have been due to SDA
practices and characteristics or to other individual characteristics such as age, household
composition, and AFDC history.
1. Further analysis of render differences in service receipt. The top panel of Table 5.2
is taken directly from Table 5.1 and shows that adult women were more likely to receive CT-OS
and less likely to receive OJT or job search assistance only than adult men. The contrast in
service receipt rates between adult men and women can be traced, in part, to differences in
services for which they were recommended at assessment (see Table 4.1). While 44 percent of
the women were recommended for the classroom training, only 25 percent of the men were
recommended for it. Also, almost half of the men were recommended for OJT compared with
only 35 percent of the women (see Table 4.1).
The differences in service receipt among men and women may also be explained, in part,
by differences in the types of employment barriers they possessed. For example, men were more
likely to have recent work experience an important hiring criterion for employers interested in
selecting OJT recipients than women (see Table 2.12). Adult women were more likely than
adult men to be receiving public assistance, which may have provided the financial support that
enabled them to forgo earnings in order to invest in education and training (see Table 2.12).
In general, employment barriers accounted largely for target group differences in OJT
receipt, but they did not account for target group differences in CT-OS receipt. The remaining
panels in Table 5.2 display service receipt rates for adult men and women within subgroups
defined by each combination of the three employment barriers. The statistical significance levels
indicate whether the percentage of men who received a particular category of services differed
from the percentage of women who received that category of services. For example, the second
panel indicates that among adults with no employment barriers, 43 percent of the women received
CT-OS compared with 29 percent of the men. The statistical significance level indicates that this
difference was statistically significant at the 1 percent level.
Table 52 shows that among adults with the same employment barriers, adult women were
more likely to receive CT-OS than adult men. However, women in all but two of the
employment barrier subgroups were just as likely as their male counterparts to receive on.
Table 5.2 also shows that men were more likely than women to receive dab search assistance only
88
0

TABLE 5.2
SERVICE RECEIPT RATES FOR ADULT ENROLLEES,BY EMPLOYMENT BARRIER SUBGROUP AND TARGET GROUP
Employment Barrier Subgroup (a)and Target Group
All EmploymentBarrier Subarouvs
Adult menAdult women
jslo Employment Barriers
Adult menAdult women
1 Employment Barrier
Worked fewer than 13 weeksin 12 months before assignment
Adult menAdult women
No high school diploma or GEDat assignment
Adult menAdult women
Receiving AFDC or other cashassistance at assignment
Adult menAdult women
2 Employment Barriers
Worked fewer than 13 weeksin 12 months before assignmentand no high school diploma or GEDat assignment
Adult menAdult women
Worked fewer than 13 weeksin 12 months before assignmentand receiving AFDC or other cashassistance at assignment
Adult menAdult women
Sample
Non-Training
CT-OS (b) Orr (c) Education (d)JSAOnly
Misc.Non-TrainingServices (e)
Size (%) (%) (%) (%) (%)
2,286 26.3 24.3 7.2 25.0 17.2
2,883 47.2 *** 18.1 *** 8.4 * 14.7 *** 11.6 ***
949 28.7 25.5 2.0 26.6 17.3
879 43.1 *** 22.5 3.3 * 20.3 *** 10.8 ***
493 30.4 21.7 5.3 24.5 18.1
511 48.7 *** 18.0 3.9 18.4 ** 11.0 ***
318 21.1 30.2 8.8 25.5 14.5
235 35.7 *** 23.0 * 13.2 15.7 *** 12.3
95 24.2 23.2 8.4 29.5 14.7
300 53.0 *** 17.0 5.7 13.0 *** 11.3
192 18.2 23.4 10.9 24.0 23.4
153 35.3 *** 26.8 14.4 12.4 *** 11.1 ***
99 31.3 22.2 7.1 24.2 15.2
467 63.0 *** 10.1 *** 7.9 6.6 *** 12.4
1 en.
(continued)
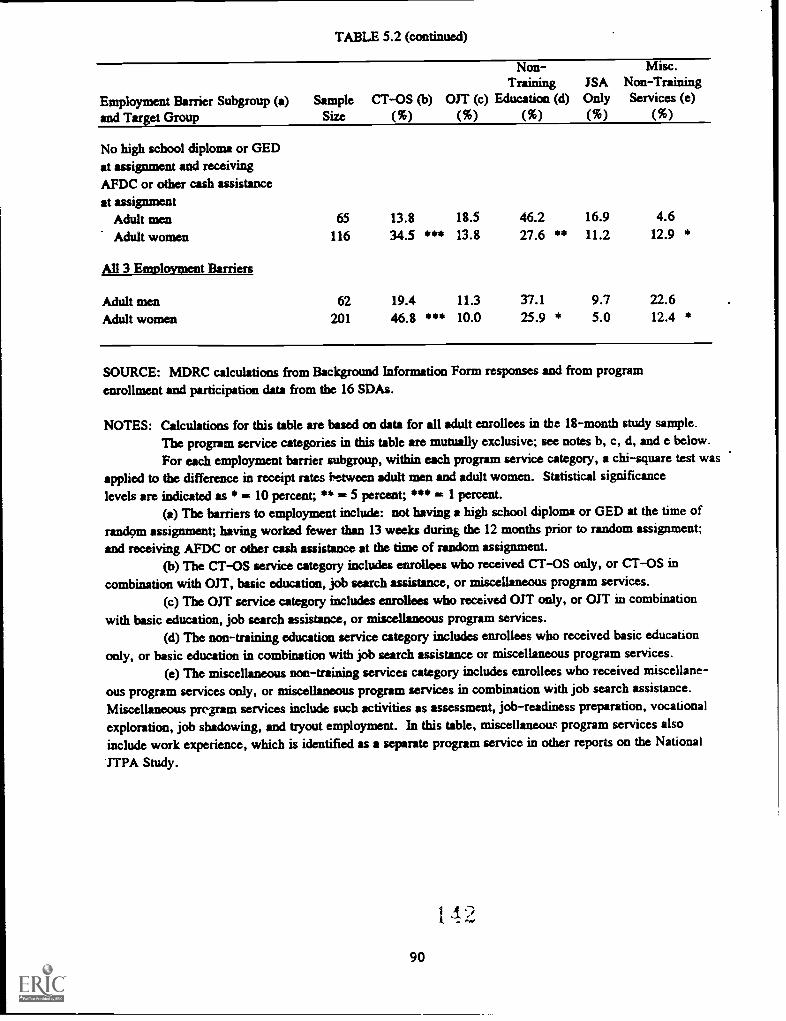
TABLE 5.2 (continued)
Employment Barrier Subgroup (a) Sampleand Target Group Size
CT-OS (b)(%)
Non-Training
OJT (c) Education (d)(%) (%)
JSAOnly(%)
Misc.Non-TrainingServices (e)
(%)
No high school diploma or GEDat assignment and receivingAFDC or other cash assistanceat assignment
Adult menAdult women
All 3 Employment Barriers
Adult menAdult women
65
116
13.8 18.5
34.5 *** 13.8
62 19.4 11.3
201 46.8 *** 10.0
46.2 16.927.6 ** 11.2
4.612.9 *
37.1 9.7 22.625.9 * 5.0 12.4 *
SOURCE: MDRC calculations from Background Information Form responses and from programenrollment and participation data from the 16 SDAs.
NOTES: Calculations for this table are based on data for all adult enrollees in the 18-month study sample.The program service categories in this table are mutually exclusive; see notes b, c, d, and e below.For each employment barrier subgroup, within each program service category, a chi-square test was
applied to the difference in receipt rates between adult men and adult women. Statistical significancelevels are indicated as * = 10 percent; *1', = 5 percent; *** = 1 percent.
(a) The barriers to employment include: not having a high school diploma or GED at the time ofrand9m assignment; having worked fewer than 13 weeks during the 12 months prior to random assignment;and receiving AFDC or other cash assistance at the time of random assignment.
(b) The CT-OS service category includes enrollees who received CT-OS only, or CT-OS incombination with OJT, basic education, job search assistance, or miscellaneous program services.
(c) The OJT service category includes enrollees who received OJT only, or OJT in combinationwith basic education, job search assistance, or miscellaneous program services.
(d) The non-training education service category includes enrollees who received basic educationonly, or basic education in combination with job search assistance or miscellaneous program services.
(e) The miscellaneous non-training services category includes enrollees who received miscellane-ous program services only, or miscellaneous program services in combination with job search assistance.Miscellaneous program services include such activities as assessment, job-readiness preparation, vocationalexploration, job shadowing, and tryout employment. In this table, miscellaneous program services alsoinclude work experience, which is identified as a separate program service in other reports on the National'TPA Study.
1 A. 2
90
in all the employment barrier subgroups. Note, however, that gender differences in job search
assistance only receipt are not statistically significant in the last two employment barrier
subgroups.
There are several possible explanations for the remaining difference in Cr-OS service.
receipt. The service preference of men and women may differ, or men and women as a group
may differ on other characteristics not included in the analysis that affect their appropriateness
for Cr-OS or the likelihood that service providers will accept them for training. Finally, SUA
and service provider assessment and referral practices may *treat similar men and women
differently. The information available for this report could not be used to isolate the importance
of these possible causes of the Cr-OS service difference.
2. Further analysis of ethnic differences in service receipt. The top panel of Table 53
is taken directly from Table 5.1 and shows that black adults were more likely to receive CT-OS
and less likely to receive OJT and basic education without training than white adults. Like the
gender differences in service receipt rates discussed above, white/black differences in service
receipt rates can be traced to the types of services that were recommended at assessment for
white and black adults. Black adult.% were much more likely than white adults to be
recommended for CT-OS and much less likely to be recommended for Off. Another explanation
for the differences in service receipt rates among ethnic groups may be that ethnicity is associated
with employment barriers. Recall that black adults (particularly women) were more likely to
possess multiple employment barriers than white adults (see Table 2.14). Also recall that, in
general, adults with multiple employ' _ent barriers were the least likely to receive employment-
based services such as OJT and job search assistance only and the most likely to receive
classroom-based services such as Cr-OS and basic education.
In general, employment barriers did not account consistently for the differences in service
receipt rates among black and white adults. The remaining panels in Table 53 display differences
in service receipt rates among white, black, and Hispanic adults within subgroups defined by each
combination of the three employment barriers.13 The statistical significance levels indicate
whether the percentage of white adults who received a particular category of services differed
from the percentage of either black or Hispanic adults who received that category of services.
For example, the second panel shows that among adults with no employment barriers, 30 percent
13Adults from 'other" ethnic groups were not included in the analysis because of small sample sizes.
91
4 3

TABLE 5.3
SERVICE RECEIPT RATES FOR ADULT ENROLLEES,BY EMPLOYMENT BARRIER SUBGROUP AND ETHNICITY
Employment Barrier Subgroup (a) Sample CT-OS (b)
Non-Training
OJT (c) Education (d)JSAOnly
Misc.Non-TrainingServices (e)
and Ethnicity Size (%) (%) (%) (%) (%)
All EmploymentBarrier Subffouvs
White, non-Hispanic 2,941 30.6 25.9 9.1 20.0 14.5
Black, non-Hispanic 1,432 50.5 *** 15.6 *** 2.7 *** 19.7 11.5 ***
Hispanic 589 38.7 *** 11.0 *** 15.8 *** 16.3 ** 18.2 **
No Employment Barriers
White, non-Hispanic 1,162 29.9 28.1 2.2 23.5 16.4
Black, non-Hispanic 451 45.9 *** 18.6 *** 1.1 25.3 9.1 ***
Hispanic 158 43.0 *** 13.3 *** 10.8 *** 20.3 12.7
1 Employment Barrier
Worked fewer than 13 weeksin 12 months before assignment
White, non-Hispanic 549 37.2 22.6 4.6 21.5 14.2
Black, non-Hispanic 282 41.5 18.1 2.8 22.7 14.9
Hispanic 119 41.2 11.8 *** 10.1 ** 22.7 14.3
No high school diploma or GEDat assignment
White, non-Hispanic 336 20.2 35.4 7.1 23.8 13.4
Black, non-Hispanic 98 45.9 *** 18.4 *** 5.! 18.4 12.2
Hispanic 93 19.4 12.9 *** 31.2 *** 18.3 18.3
Receiving AFDC or other cashassistance at assignment
White, non-Hispanic 206 39.3 21.8 7.8 17.5 13.6
Black, non-Hispanic 152 55.9 *** 15.8 1.3 ** 17.1 9.9
Hispanic 30 46.7 10.0 16.7 10.0 16.7
2 Employment Barriers
Worked fewer than 13 weeksin 12 months before assignmentand no high school diploma or GEDat assignment
White, non-Hispanic 195 24.1 31.8 12.3 15.9 15.9
Black, non-Hispanic 62 24.2 19.4 * 1.6 ** 33.9 *** 21.0Hispanic 65 20.0 13.8 *** 26.2 *** 16.9 23.1
(continued)

Employment Barrier Subgroup (a)and Ethnicity
Worked fewer than 13 weeksin 12 months before assignmentand receiving AFDC or other cashassistance at assignment
White, non-HispanicBlack, non-HispanicHispanic
No high school diploma or GEDat assignment and receivingAFDC or other cash assitanceat assignment
White, non-HispanicBlack, non-HispanicHispanic
All 3 Emnlovment Barriers
White, non-HispanicBlack, non-HispanicHispanic
TABLE 5.3 (continued)
Sample CT-OS (b)
Non-Training
OJT (c) Education (d)JSAOnly
Misc.Non-TrainingServices (e)
Size (%) (%) (%) (%) (%)
231 44.2 18.2 14.3 10.4 13.0247 68.4 *** 8.9 *** 2.8 *** 10.5 9.3
68 61.8 ** 5.9 ** 4.4 ** 4.4 23.5 **
118 13.6 19.5 45.8 13.6 7.643 60.5 *** 9.3 9.3 *** 11.6 9.314 35.7 ** 7.1 21.4 * 7.1 28.6 **
129 22.5 11.6 48.8 6.2 10.9
83 63.9 *** 9.6 8.4 *** 6.0 12.0
37 48.6 *** 2.7 13.5 *** 5.4 29.7 ***
SOURCE: MDRC calculations from Background Information Form responses and from program enrollmentand participation data from the 16 SDAs.
NOTES: Calculations for this table are based on data for all white, black, and Hispanic adult enrollees in the18-month study sample. Enrollees from other ethnic groups were not included because of small sample sizes.
The program service categories in this table are mutually exclusive; see notes b, c, d, and e below.For each employment barrier subgroup, within each program service category, a chi-square test
was applied to the difference in service receipt rates between white enrollees and black enrollees and
between white enrollees and Hispanic enrollees. Statistical significance levels are indicated as* = 10 percent; ** = 5 percent; *** = 1 percent.
(a) The bathers to employment include: not having a high school diploma or GED at the time ofrandom assignment; having worked fewer than 13 weeks during the 12 months prior to random assignment;and receiving AFDC or other cash assistance at the time of random assignment.
(b) The CT-OS service category includes enrollees who received CT-OS only, or CT-OS incombination with OJT, basic education, job search assistance, or miscellaneous program services.
(c) The OJT service category includes enrollees who received OJT only, or OJT in combinationwith basic education, job search assistance, or miscellaneous program services.
(d) The non-training education service category includes enrollees who received basic educationonly, or basic education in combination with job search assistance or miscellaneous program services.
(e) The miscellaneous non-training services category includes enrollees who received miscellane-ous program services only, or miscellaneous program services in combination with job search assistance.
Miscellaneous program services include such activities as assessment, job-readiness preparation, vocationalexploration, job shadowing, and tryout employment. In this table, miscellaneous program services alsoinclude work experience, which is identified as a separate program service in other reports on the National
JTPA Study.
93 1 4 5

of the white adults and 46 percent of the black adults received CT-OS. The table also indimtes
that this difference was statistically significant at the 1 percent level.
Table 5.3 indicates that, with the exception of enrollees with limited work experience as
their only employment barrier and enrollees with limited work experience who were also high
school dropouts, black adults were more likely to receive CT-OS than white adults with the same
employment barriers. Black and white adults in these two employment barrier subgroups were
about equally likely to receive CT-OS. Also, within employment barrier subgroups that comprised
over half of the black adults those with no employment barriers and those whose only
employment barrier included having limited work experience or no high school diploma or GED
black and white adults were about equally likely to receive basic education without training.
Among all other employment barrier Subgroups (particularly those that included public assistance
receipt), black enrollees were much less likely to receive basic education without training.
Table 53 also shows that there were no statistically significant differences between black
and white adults who received OJT in four of the eight employment barrier subgroups; in the
other four subgroups, whites were more likely than blacks to receive OJT.
Ethnic differences in service receipt may also be due to factors other than employment
barriers. For example, 62 percent of the black adults and 80 percent of the Hispanic adults lived
in 5 of the SDAs that were large and predominantly urban. These SDAs had access to large
numbers of CT-OS providers, which may account for part of the ethnic difference in CT-OS
receipt rates. Conversely, very few of the black and Hispanic adults lived in predominantly rural
SDAs, some of which tended to focus on OJT services. This may account, in part, for the higher
rates of OJT receipt among white adults.14
In order to investigate these and other hypotheses related to the association between service
receipt rates and other individual characteristics, the analysis was extended to construct
multivariate regression models that estimate service receipt rates while adjusting for differences
that might be due to a variety of individual background and SDA characteristics. The following
results are based on a regression model that adjusts for differences among ethnic groups that were
associated with age, gender, AFDC history, household composition, random-assignment date, Food
141t important to note that an analysis of variation among the 16 study sites did not reveal aconsistent relationship between service emphasis and urban/rural distinctions. In fact, even SDAs thatencompassed mostly rural areas and emphasized OJTs had at least one moderate-sized city that accountedfor a significant portion of the study sample.
94
1 4 rt .,
Stamp receipt at random assignment, previous enrollment in job club, having a high school
diploma rather than a GED, and SDA, as well as the employment bather combinations listed in
Table 5.3. The results from this model indicate that the ethnic differences in service receipt rates
decreased markedly when estimated with this model. For example, the regression-adjusted
percentage of white adults who received CT-OS was 35 percent compared with 31 percent of
the black adults and the regression-adjusted percentage of white adults who received OJT was
25 percent compared with 22 percent of the black adults. For this particular regression model
specification, the white/black difference in cr-os receipt was not judged to be statistically
significant and the white/black difference in OJT receipt was judged to be statistically significant
only at the 10 percent level. The results from this model indicate that ethnic differences in
service receipt can be explained on the basis of site differences in service emphasis and
differences in service receipt among subgroups defined by characteristics other than ethnicity.
However, other model specifications yielded differences that were statistically significant.
Readers should exercise caution in interpreting the multivariate regression results because
they are sensitive to the regression model specification used Also, this type of statistical
modeling is very difficult to translate into policy-relevant and practical conclusions. SDAs must
serve real people rather than individuals (reflected in the regression model) who are the same on
all characteristics except ethnicity. Therefore, the analysis shown in Table 5.3 is probably the
most realistic picture of ethnic differences in service receipt in the study sites.
The analysis discussed in this section provides a further context for interpreting the ethnic
differences in service receipt rates displayed in Table 5.1. In short, the discussion highlighted the
fact that white adults possessed different employment barriers than black or Hispanic adults and
that these factors do account for some of the differences in service receipt (particularly OJT
receipt) but not all of the differences. The analysis also showed that other measurable differences
among ethnic groups (such as the type of SDA they lived in or their family status), help explain
more of the service receipt differences depending on various aspects of the multivariate regression
modeling technique used; but again, differences may remain.
Several other factors not analyzed here are likely to play a role in the distribution of JTPA
services among ethnic (and other) subgroups of enrollees. First, the data collected for the
National JTPA Study, along with the analysis discussed in this report, did not include other
individual characteristics (such as basic skills level, motivation, and access to other opportunities
in the labor market) that may be associated with ethnicity and that may account for differences
95
1 4 7

7
in service receipt rates. Second, the analysis was also not able to account for the particular
service preferences of individual JTPA applicants. Third, the analysis discussed in tb1/4 report
cannot discount the possibility that employers discriminate on the basis of ethnicity in hiring orSDA staff discriminate in service allocation decisions.
Finally, the analysis discussed in this chapter focuses only on individuals who proceededthrough the three stages discussed in Chapter 3 in the JTPA service delivery process atwhich JTPA applicants are screened for service receipt. At each stage, it is likely that a
combination of individual characteristics, individual preferences, and SDA and service providerpractices (which, in some cases, may amount to racial discrimination) account for differences kr
the way JTPA services are distributed among ethnic groups.
II. The Len 2th of Enrollment for Adults
One potentially important indicator of the likely influence of the JTPA treatment is thelength of that treatment. This analysis uses the number of months that adults were enrolled in
JTPA during the 18-month follow-up period as the primary measure of service intensity. The
assumption here is that those who participated for substantial periods of time were more likely
to accumulate employable skills than those who participated for shorter periods of time.15
A. The Relationship Between Len 2th of Enrollment and Services Received
The top row in Table 5.4 lists the median length of enrollment for all adult enrollees andfor adult enrollees in each of the five service categories.16 It shows that, overall, the median
isIdeally, the analysis would also include other measures of service quality and intensity such as hoursper week, the skills level of classroom training or OJT, the orientation to the skills levels of theparticipants, coordination of occupational training and basic skills remediation, and level of job-relevantinformation in the curricula. The National JTPA Study did not provide the level of resources required toundertake an investigation of these measures in each of the SDAs in the study. For a discussion of theseissues, see U.S. Department of Labor, 1991.
16Length of enrollment for individuals in a particular service category is not necessarily equivalent tothe number of months they spent in a specific service. Length of enrollment is defined here as the totaltime during the follow-up period that an individual was counted by SDA staff as officially enrolled. In afew cases, this included a short period in the middle of a sequence of services in which SDA staff placedan individual in a 'hold' status.
The median is the most common measure of central tendency used in analyses of data on lengthof stay or duration. Here, median enrollment duration is defined as the number of months of enrollmentthat elapsed before half of the adult enrollees completed their JTPA participation. For those whoseenrollment records contained a valid start and end date, length of enrollment was simply the total numberof days between the start and end dates, which was divided by 30 to obtain the number of months enrolled.
(continued...)96

TA
BL
E 5
.4
ME
DIA
N L
EN
GT
H O
F E
NR
OL
LM
EN
T F
OR
AD
UL
TS,
BY
SE
LE
CT
ED
BA
SEL
INE
CH
AR
AC
TE
RIS
TIC
S A
ND
SE
RV
ICE
RE
CE
IPT
Cha
ract
eris
tic
and
Subg
roup
Sam
ple
Size
Non
-M
isc.
All
Tra
inin
gJS
AN
on-T
rain
ing
Serv
ices
CT
-OS
(a)
OJT
(b)
Edu
catio
n (c
)O
nly
Serv
ices
(d)
(mon
ths)
(mon
ths)
(mon
ths)
(mon
ths)
(mon
ths)
(mon
ths)
All
Adu
lt E
nrol
lees
5,16
93.
24.
82.
54.
31.
02.
3
Tar
get G
roup
Adu
lt m
en2,
286
2.6
4.1
2.6
3.8
0.9
1.9
Adu
lt w
omen
2,88
33.
6**
*5.
2**
*2.
54.
7**
1.0
*3.
0**
*
Age 22
-29
2,30
53.
14.
92.
54.
30.
9.2.
0
30-4
42,
239
3.3
4.8
2.8
*4.
31.
0**
2.6
**
%.0
4562
52.
8**
4.5
2.3
4.2
1.0
3.0
**J
and
over
Eth
nici
tyW
hite
, non
-His
pani
c2,
941
3.1
5.2
2.6
4.8
0.9
2.3
Bla
ck, n
on-H
ispa
nic
1,43
23.
04.
0**
*2.
0**
*4.
41.
5**
*2.
2
His
pani
c58
94.
0**
*9.
2**
*3.
6**
*3.
4**
*1.
1**
2.6
Oth
er20
72.
73.
7*A
,*1.
93.
10.
92.
1
Edu
catio
nH
igh
scho
ol d
iplo
ma
or G
ED
3,49
13.
35.
02.
73.
21.
02.
5
No
high
sch
ool d
iplo
ma
or G
ED
1,34
23.
0**
*4.
3**
*2.
0**
*5.
244
*0.
9**
*1.
9*
(con
tinue
d)
A 1
1t
, 1i

TA
BL
E 5
.4 (
cont
inue
d)
Cha
ract
eris
tican
d Su
b T
roup
Sam
ple
Size
Non
-A
llT
rain
ing
Serv
ices
CT
-OS
(a)
OJT
(b)
Edu
catio
n (c
)(m
onth
s)(m
onth
s)(m
onth
s)(m
onth
s)
Mis
c.JS
AN
on-T
rain
ing
Onl
ySe
rvic
es (
d)(m
onth
s)(m
onth
s)
Wor
k E
xper
ienc
eW
orke
d 13
wee
ks o
r m
ore
in 1
2 m
onth
s be
fore
ass
ignm
ent
2,42
82.
94.
62.
63.
70.
92.
3W
orke
d fe
wer
than
13
wee
ksin
12
mon
ths
befo
re a
ssig
nmen
t2,
178
3.4
***
4.9
2.7
4.7
**1.
1**
*2.
4
Publ
ic A
ssis
tanc
e R
ecei
ptN
ot r
ecei
ving
AFD
C o
r ot
her
cash
assi
stan
ce a
t ass
ignm
ent
3,28
72.
84.
52.
53.
30.
92.
1R
ecei
ving
AFD
C o
r ot
her
cash
assi
stan
ce a
t ass
ignm
ent
1,40
53.
9**
*5.
3**
*2.
8*
5.8
***
1.5
***
2.9
**
Bar
rier
s to
Em
ploy
men
t (e)
Non
e1,
828
3.0
4.7
2.7
1.0
1.0
2.3
11,
952
3.0
4.7
2.3
4*3.
544
*0.
92.
22
1,09
23.
6**
*5.
22.
75.
2**
*1.
12.
63
263
4.0
***
4.7
2.6
6.7
***
1.9
*2.
2
AFD
C H
isto
ryN
ever
rec
eive
d A
FDC
3,46
12.
84.
42.
53.
70.
92.
2R
ecei
ved
AFD
C le
ss th
an2
year
s (1
)83
73.
9**
*6.
3**
*2.
64.
7**
1.4
***
2.7
Rec
eive
d A
FDC
2 y
ears
or m
ore
(f)
799
3.8
***
5.0
**2.
95.
6**
*1.
22.
7
Hou
seho
ld C
ompo
sitio
nSp
ouse
pre
sent
1,41
02.
94.
72.
54.
70.
92.
5N
o sp
ouse
pre
sent
, chi
ld p
rese
nt1,
558
3.7
s5.
3*
2.7
5.2
1.2
***
2.5
No
spou
se p
rese
nt, n
o ch
ildpr
esen
t1,
633
2.7
**4.
52.
53.
1**
*0.
92.
1
(con
tinue
d)

TABLE
5.4
(con
tinue
d)
SOURCE: MDRC
calc
ulat
ions
fro
m B
ackg
roun
d In
form
atio
n Fo
rm r
espo
nses
and
fro
m p
rogr
am e
nrol
lmen
tan
d pa
rtic
ipat
ion
data
fro
m th
e 16
SD
As.
NOTES:
Cal
cula
tions
for
this
tabl
e ar
e ba
sed
on d
ata
for
all a
dult
enro
llees
in th
e 18
-mon
th s
tudy
sam
ple.
The
tota
l sam
ple
size
may
var
y am
ong
char
acte
rist
ics
beca
use
of m
issi
ng d
ata
for
som
e en
rolle
es.
The
med
ian
leng
th o
f en
rollm
ent i
s de
fine
d as
the
num
ber
of m
onth
s af
ter
enro
llmen
t by
whi
ch h
alf
of th
e en
rolle
es in
a s
ubgr
oup
com
plet
ed th
eir
JTPA
par
ticip
atio
n.T
he p
rogr
am s
ervi
ce c
ateg
orie
s in
this
tabl
e ar
e m
utua
lly e
xclu
sive
; see
not
es a
, b, c
, and
d b
elow
.Fo
r ea
ch c
hara
cter
istic
, with
in e
ach
prog
ram
ser
vice
cat
egor
y, a
chi
-squ
are
test
was
app
lied
to th
e di
ffer
ence
in m
edia
n le
ngth
of
enro
llmen
t bet
wee
n th
e fi
rst s
ubgr
oup
liste
d an
d, s
epar
atel
y, e
ach
of th
ere
mai
ning
sub
grou
ps. S
tatis
tical
sig
nifi
canc
e le
vels
are
indi
cate
d as
* =
10
perc
ent;
** =
5 p
erce
nt; *
** =
1 p
erce
nt.
(a)
The
CT
-OS
serv
ice
cate
gory
incl
udes
enr
olle
es w
ho r
ecei
ved
CT
-OS
only
, or
CT
-OS
inco
mbi
natio
n w
ith O
JT, b
asic
edu
catio
n, jo
b se
arch
ass
ista
nce,
or
mis
cella
neou
s pr
ogra
m s
ervi
ces.
(b)
The
OJT
ser
vice
cat
egor
y in
clud
es e
nrol
lees
who
rec
eive
d O
JT o
nly,
or
OJT
in c
ombi
natio
nw
ith b
asic
edu
catio
n, jo
b se
arch
ass
ista
nce,
or
mis
cella
neou
s pr
ogra
m s
ervi
ces.
(c)
The
non
-tra
inin
g ed
ucat
ion
serv
ice
cate
gory
incl
udes
enr
olle
es w
ho r
ecei
ved
basi
c ed
ucat
ion
only
, or
basi
c ed
ucat
ion
in c
ombi
natio
n w
ith jo
b se
arch
ass
ista
nce
or m
isce
llane
ous
prog
ram
ser
vice
s.(d
) T
he m
isce
llane
ous
non-
trai
ning
ser
vice
s ca
tego
ry in
clud
es e
nrol
lees
who
rec
eive
d m
isce
llane
-ou
s pr
ogra
m s
ervi
ces
only
, or
mis
cella
neou
s pr
ogra
m s
ervi
ces
in c
ombi
natio
n w
ith jo
b se
arch
ass
ista
nce.
Mis
cella
neou
s pr
ogra
m s
ervi
ces
incl
ude
such
act
iviti
es a
s as
sess
men
t, jo
b-re
adin
ess
prep
arat
ion,
voc
atio
nal
expl
orat
ion,
job
shad
owin
g, a
nd tr
yout
em
ploy
men
t. In
this
tabl
e, m
isce
llane
ous
prog
ram
ser
vice
s al
soin
clud
e w
ork
expe
rien
ce, w
hich
is id
entif
ied
as a
sep
arat
e pr
ogra
m s
ervi
ce in
oth
er r
epor
ts o
n th
e N
atio
nal
JTPAStudy.
(e)
The
bar
rier
s to
em
ploy
men
t inc
lude
: not
hav
ing
a hi
gh s
choo
l dip
lom
a orGED
at th
e tim
e of
rand
om a
ssig
nmen
t; ha
ving
wor
ked
few
er th
an 1
3 w
eeks
dur
ing
the
12 m
onth
s pr
ior
to r
ando
m a
ssig
nmen
t;
and
rece
ivin
gAFDC
or o
ther
cas
h as
sist
ance
at t
he ti
me
of r
ando
m a
ssig
nmen
t.
(I)
TheAFDC
rece
ipt m
ay n
ot h
ave
been
con
tinuo
us.
length of enrollment for adult enrollees was just over three months. The top row in Table 5.4
also indicates dramatic differences in length of enrollment among adults who received particular
categories of services. For example, the median length of enrollment among adults who received
Cf-OS was almost twice that of adults who received OJT and almost five times that of adultswhoreceived job search assistance only.17
The content, scheduling, and specifications of particular services usually determine theirlength. For example, the duration of most classroom training services usually corresponds to an
academic calendar that divides the year into trimesters. A review o" typical contracts between the
SDAs in the study and the vendors who provided services indicates that most classroom training
placements were specified for four months or more. A review of typical OJT contracts indicates
that training services were to last three months or fewer depending on the SDA and, in somecases, the skills level of the position.
B. Subgroup Differences in Length of Enrollment
The remainder of Table 5.4 lists selected subgroups of adult enrollees and the medianlength of enrollment (in months) for each subgroup, both overall and by the category of services
they received. Statistical tests were performed to determine whether there were significant
differences in median length of enrollment between the first subgroup listed under eachcharacteristic and each of the other subgroups. For example, among the subgroups del ned by
ethnicity, the table indicates that there was a statistically significant difference between the median
16(...continued)
While all of the enrollees had valid start dates, approximately 10 percent of them had no end dates.The data files from the SDAs did not identify whether these constituted coding errors or ongoingenrollments. In general, however, all of the exits from JTPA that were coded on the data files took placewithin 12 months of enrollment. In other words, there were no exits from JTPA after 12 months eventhough, depending on the subgroup and the primary service received, more than 10 percent of the sampleappeared to participate for 12 months or longer. This led to the conclusion that many of the enrollmentsthat lasted longer than 12 months without a formal termination represented coding errors. In order toinclude these sample members in the analyses without ending their enrollment periods arbitrarily, theseenrollment durations were coded as "open" after 12 months- This means that after month 12 they were nolonger included in the analysis of the likelihood of leaving JTPA in a particular month given that theirenrollment periods covered the previous 12 months. (See Appendix C for more information about the data.)
17These differences in length of enrollment among adults in each of the service categories account forsimilar differences in length of enrollment among adults in each of the recommended service strategies.For example, adult enrollees recommended for the classroom training service strategy had the longestmedian length of enrollment at 4.6 months, and those recommended for the OJT/JSA service strategy hadthe shortest median length of enrollment at 2.2 months. Adult enrollees recommended for the otherservices strategy had a median length of enrollment of 2.4 months.
100

length of enrollment for all white adults (3.1 months) and the median length of enrollment for
all Hispanic adults (4.0 months). The table also indicates that there was no statistically significant
difference between the median length of enrollment for white adults and the median length of
enrollment for black adults (3.0 months).18
Many of the differences in median length of enrollment among subgroups are associated
with the differences in service receipt rates exhibited in Table 5.1. Subgroups that were likely to
enroll in classroom-based services such as CT-OS and basic education without training tended to
have the longest enrollments while those likely to enroll in employment-based services such as
OJT and job search assistance only had the shortest enrollments. Even among enrollees who
received services in the same category, some subgroups had longer enrollments than others. In
many cases, however, these differences were due to the fact that those with longer enrollments
were more likely to receive two or more services than those with shorter enrollments.
The findings presented in Table 5.4 help illustrate the association between subgroup
differences in length of enrollment and the types and number of services enrollees received. For
example, they show that women remained in JTPA longer than men. The median length of
enrollment for men was 2.5 months compared with a median length of enrollment of 3.6 months
for women. This difference is due, in part, to differences in the types and numbers of services
they received. Recall from Table 5.1 that women tended to receive CT-OS and men tended to
receive Off and job search assistance only. However, Table 5.4 also shows that the median
length of enrollment for women who received CT-OS was one month longer than the median
length of enrollment for men who received CT-OS. This is primarily because women were more
likely than men to combine CT-OS with other services (particularly job search assistance and
miscellaneous services).
Table 5.4 indicates several other subgroup differences in length of enrollment that may not
be associated only with differences in the types or number of services received. First, the median
length of enrollment for black adults who received CT-OS or OJT was shorter than that for white
adults who received those services. This suggests that black adults may have been more likely to
leave than white adults either for positive reasons such as finding a job or for other reasons
such as lack of interest. It may also be that the training that black adults received was oriented
18Unless otherwise noted, discussion of median length of enrollment differences among subgroupsfocuses on those that are statistically significant at the 10 percent level or lower.
101
16
toward lower-skill occupations and therefore, by design, shorter than that received by white adults.
Interestingly, Hispanic adults who received cr-OS or OTT had longer enrollments than whiteadults who received these services.
Among adults who received ar-OS or OJT, high school dropouts had shorter enrollmentsthan those who had a high school diploma or GED at the time of their JTPA application. This
may signify that those who left school previously may have continued this pattern by notcompleting their training or that the training was, by design, shorter than that received bygraduates and GED recipients. However, the median length of enrollment for high schooldropouts who received basic education without training was actually two months longer than thatfor graduates who received basic education. Finally, Table 5.4 shows that the median length of
enrollment for public assistance recipients in all service categories was longer than that for thosewho were not receiving public assistance at the time of their JTPA application. In the absence
of supplementary support from JTPA, it is likely that cash public assistance payments provided
the financial support necessary to sustain these adults in their JTPA services for longer periodsof time.
102
i ?7

CHAPTER 6
SERVICES RECEIVED BYOUT-OF-SCHOOL YOUTH ENROLLEES
This chapter describes the distribution of JTPA services among out-of-school youths in the
18-month treatment group sample who were officially enrolled in JTPA at some point during the
18-month follow-up period.' Like Chapter 5, it is organized around the types of JTPA services
that out-of-school youths actually received and the length of their enrollments in the program
rather than around the services for which they were recommended and their status within the
research design (i.e., a!! treatment group members vs. those who were actually enrolled). For the
analysis in this chapter, youth enrollees have been grouped according to the five mutually exclusive
service categories described in Chapter 5. The analysis focuses on service receipt and length of
enrollment for the out-of-school youth target groups (male and female) and for other key
subgroups of youth enrollees. Like the information in Chapter 5, the information in this chapter
provides both a context for understanding program impacts and a perspective on how JTPA
resources were distributed among some of the key demographic groups that the SDAs in the study
tried to target for services.
Following is an overview of key findings in the chapter:
Just over half of the out-of-school youths received some form of occupationaltraining either in the classroom or on-the-job but a substantialpercentage received basic education without training. Thirty-six percent of theout-of-school youth enrollees received classroom training in occupational skills(Cr-OS) and an additional 16 percent received on-the-job training (OJT).Thirty-seven percent of the out-of-school youths received basic education ormiscellaneous services without training. The remaining 11 percent received jobsearch assistance only.
Youths with two or three of the employment barriers analyzed (high schooldropoui, limited work experience, and cash public assistance recipient) weremore likely to receive CT-OS or basic education without training and lesslikely to receive OJT or job search assistance only than those with noemployment barriers. Over 60 percent of the youths with two or three
1As noted in earlier chapters, treatment group members were identified as "officially enrolled in JTPA"if the local SDA staff established an enrollment record on their JTPA management information system(MIS) during the 18-month follow-up period.
103
r;
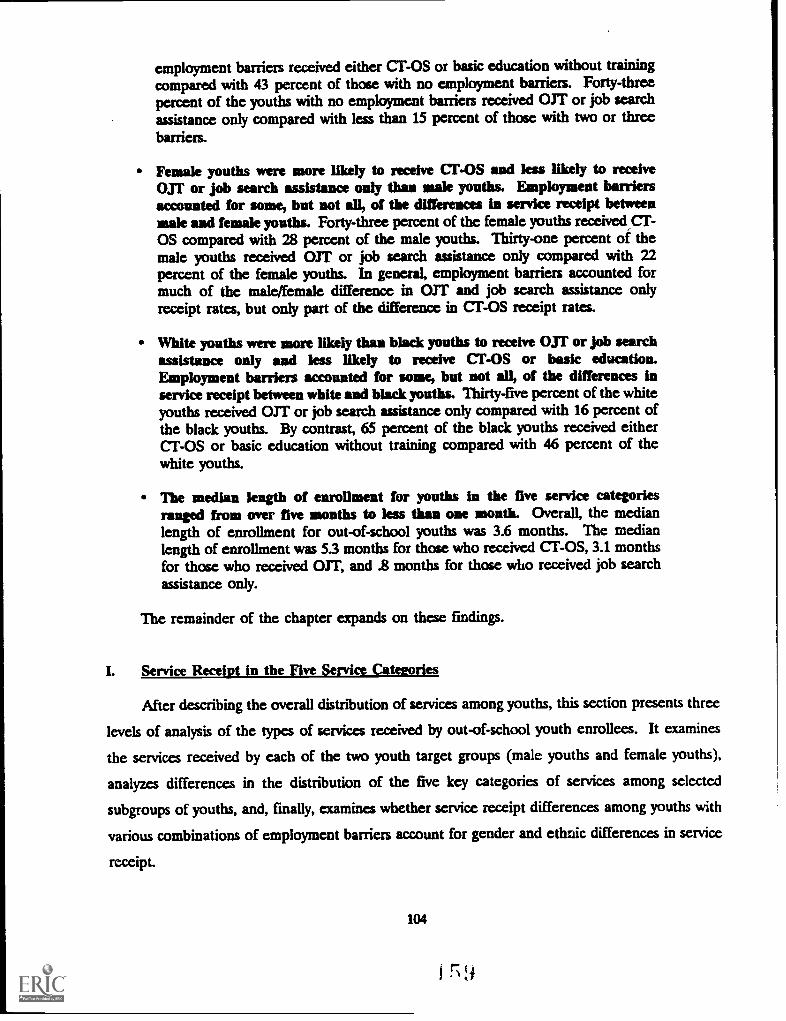
employment barriers received either CT-OS or basic education without trainingcompared with 43 percent of those with no employment barriers. Forty-threepercent of the youths with no employment barriers received OTT or job searchassistance only compared with less than 15 percent of those with two or threebarriers.
Female youths were more likely to receive CT-OS and less likely to receiveOJT or job search assistance only than male youths. Employment barriersaccounted for some, but not all, of the differences in service receipt betweenmale and female youths. Forty-three percent of the female youths received CT-OS compared with 28 percent of the male youths. Thirty-one percent of themale youths received OJT or job search assistance only compared with 22percent of the female youths. In general, employment barriers accounted formuch of the male/female difference in OJT and job search assistance onlyreceipt rates, but only part of the difference in CT-OS receipt rates.
White youths were more likely than black youths to receive OJT or job searchassistance only and less likely to receive CT-OS or basic education.Employment barriers accounted for some, but not all, of the differences inservice receipt between white and black youths. Thirty-five percent of the whiteyouths received OJT or job search assistance only compared with 16 percent ofthe black youths. By contrast, 65 percent of the black youths received eitherCT-OS or basic education without training compared with 46 percent of thewhite youths.
The median length of enrollment for youths in the five service categoriesranged from over five months to less than one month. Overall, the medianlength of enrollment for out-of-school youths was 3.6 months. The medianlength of enrollment was 5.3 months for those who received CT-OS, 3.1 monthsfor those who received OTT, and .8 months for those who received job searchassistance only.
The remainder of the chapter expands on these findings.
I. Service Receipt in the Five Service Categories
After describing the overall distribution of services among youths, this section presents three
levels of analysis of the types of services received by out-of-school youth enrollees. It examines
the services received by each of the two youth target groups (male youths and female youths),
analyzes differences in the distribution of the five key categories of services among selected
subgroups of youths, and, finally, examines whether service receipt differences among youths with
various combinations of employment barriers account for gender and ethnic differences in service
receipt.
104

The top row in Table 6.1 shows that 36 percent of all youths received CT-OS and an
additional 16 percent received off. Overall, therefore, 52 percent of the out-of-school youths
received some type of occupational training either in the classroom or on-the-job. The table
also shows that 37 percent of the out-of-school youths received basic education or miscellaneous
services without occupational training. The remaining 11 percent of the out-of-school youths
received job search assistance only.
A comparison of the service receipt rates listed in the top row of Tables 5.1 and 6.1
highlights several important differences between adults and youths.2 First, youths were somewhat
less likely than adults to receive some form of occupational training that included either CT-OS
or OJT. Fifty-two percent of the youths received either CT-OS or OJT compared with 59
percent of the adults. Second, youths were more likely than adults to receive basic education and
miscellaneous services without occupational training. Table 6.1 shows that 37 percent of the
youths received these non-training services compared with only 22 percent of the adults (Table
5.1). In particular, 19 percent of the youths received basic education without training compared
with 8 percent of the adults. Third, youths were less likely than adults to receive job search
assistance only. Table 6.1 shows that 11 percent of the youths received job search assistance as
their only service, compared with 19 percent of the adults (Table 5.1). Finally, although not
displayed in the tables, youths were more likely than adults to receive two or more services; 35
percent of the youths received two or more services compared with only 26 percent of the adults.
The remainder of Table 6.1 lists selected subgroups of youth enrollees and the percentage
of each subgroup who received each category of services. Statistical tests were performed to
determine whether there were significant differences in service receipt rates between the first
subgroup listed under each characteristic and each of the other subgroups. For example, among
the subgroups defined by ethnicity, the table indicates that there was a statistically significant
difference between the percentage of white youths who received CT-OS (30 percent) and the
percentage of Hispanic youths who received CT-OS (61 percent). The table indicates that there
was no statistically significant difference between the percentage of white youths who received
CT-OS and the percentage of black youths who received CT -OS (33 percent).3
2Note that service receipt differences between adults and youths were not tested for statisticalsignificance. As a result, the discussion of adult/youth differences in service receipt is confined to thelargest differences between the percentages in Table 5.1 and in Table 6.1.
3.1.1n less otherwise noted, discussion of service receipt differences among subgroups focuses on thosethat are statistically significant at the 10 percent level or lower.
105
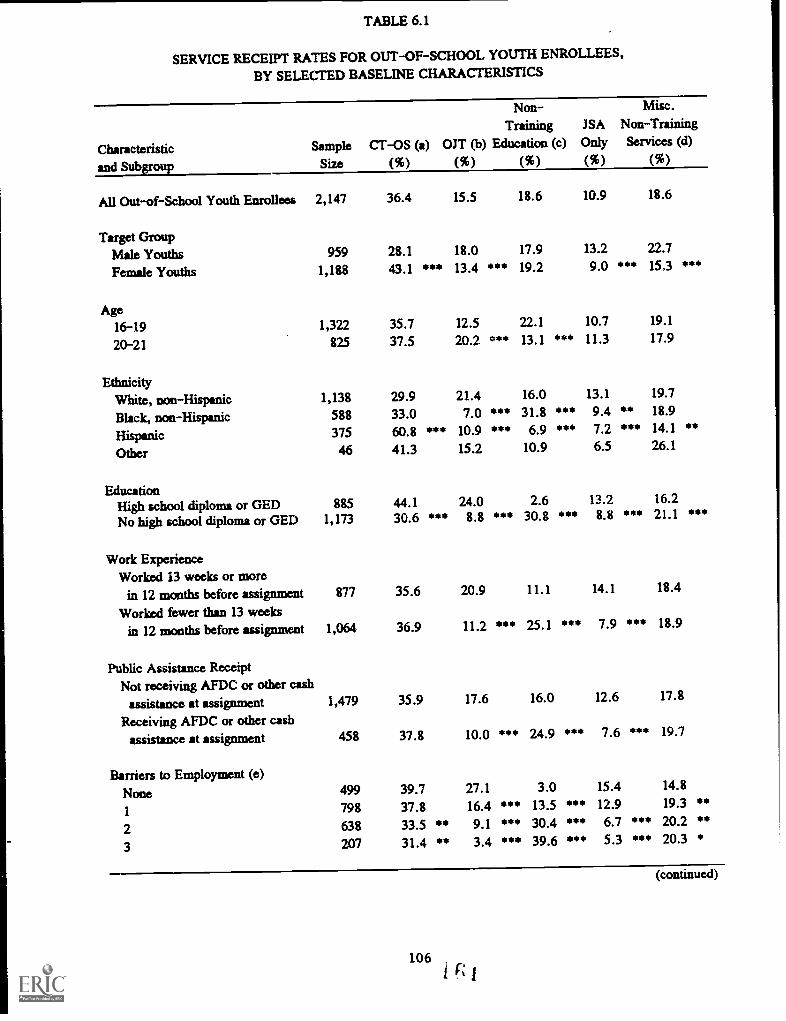
TABLE 6.1
SERVICE RECEIPT RATES FOR OUT-OF-SCHOOL YOUTH ENROLLEES,
BY SELECTED BASELINE CHARACTERISTICS
Characteristicand Subgroup
SampleSize
Non-Training
CT-OS (a) OJT (b) Education (c)
(%) (%) (%)
JSAOnly
(%)
Misc.Non-TrainingServices (d)
(%)
All Out-of-School Youth Enrollees 2,147 36.4 15.5 18.6 10.9 18.6
Target GroupMale Youths 959 28.1 18.0 17.9 13.2 22.7
Female Youths 1,188 43.1 "4' 13.4 *** 19.2 9.0 *** 15.3 ***
Age16-19 1,322 35.7 12.5 22.1 10.7 19.1
20-21 825 37.5 20.2 *** 13.1 *** 11.3 17.9
EthnicityWhite, non-Hispanic 1,138 29.9 21.4 16.0 13.1 19.7
Black, non-Hispanic 588 33.0 7.0 *** 31.8 *** 9.4 " 18.9
Hispanic 375 60.8 *** 10.9 *** 6.9 *** 7.2 *** 14.1 **
Other 46 41.3 15.2 10.9 6.5 26.1
EducationHigh school diploma or GED 885 44.1 24.0 2.6 13.2 16.2
No high school diploma or GED 1,173 30.6 *** 8.8 *** 30.8 *** 8.8 '4** 21.1 ***
Work ExperienceWorked 13 weeks or more
in 12 months before assignment 877 35.6 20.9 11.1 14.1 18.4
Worked fewer than 13 weeksin 12 months before assignment 1,064 36.9 11.2 *** 25.1 *** 7.9 *** 18.9
Public Assistance ReceiptNot receiving AFDC or other cash
assistance at assignment 1,479 35.9 17.6 16.0 12.6 17.8
Receiving AFDC or other cashassistance at assignment 458 37.8 10.0 *** 24.9 *** 7.6 *** 19.7
Barriers to Employment (e)None 499 39.7 27.1 3.0 15.4 14.8
1 798 37.8 16.4 *** 13.5 *** 12.9 19.3 **
2 638 33.5 ** 9.1 4.** 30.4 *** 6.7 *** 20.2 "3 207 31.4 ** 3.4 *** 39.6 *** 5.3 *** 20.3 *
(continued)
106f;

TABLE 6.1 (continued)
Characteristic Sample CT-OS (a)
Non-Training
OJT (b) Education (c)JSAOnly
Misc.Non-TrainingServices (d)
and Subgroup Size (%) (%) (%) (%) (%)
AFDC HistoryNever received AFDC 1,783 35.3 15.7 17.8 11.9 19.3
Received AFDC less than2 years (f) 267 38.6 15.0 24.0 ** 6.4 *** 16.1
Received AFDC 2 yearsor more (f) 82 52.4 *** 11.0 20.7 4.9 * 11.0 *
Household CompositionSpouse present 248 32.7 20.6 19.0 11.3 16.5
No spowie present, child present 437 43.0 *** 14.2 ** 20.8 8.7 13.3
No spouse present, no childpresent 1,316 35.3 15.6 * 16.3 11.8 21.1
SOURCE: MDRC calculations from Background Information Form responses and from program enrollmentand participation data from the 16 SDAs.
NOTES: Calculations for this table are based on data for all out-of-school youth enrollees in the 18-month studysample. The total sample size may vary among characteristics because of missing data for some enrollees.
The program service categories in this table are mutually exclusive; see notes a, b, c, and d below.For each characteristic, within each program service category, a chi-square test was applied to the
difference in service receipt rates between the first subgroup listed and, separately, each of the remaining subgroups.Statistical significance levels are indicated as * = 10 percent; ** = 5 percent; *** = 1 percent.
(a) The CT-OS service category includes enrollees who received CT-OS only, or CT-OS incombination with OJT, basic education, job search assistance, or miscellaneous program services.
(b) The OJT service category includes enrollees who received OJT only, or OJT in combinationwith basic education, job search assistance, or miscellaneous program services.
(c) The non-training education service category includes enrollees who received basic educationonly, or basic education in combination with job search assistance or miscellaneous program services.
(d) The miscellaneous non-training services category includes enrollees who received miscellane-ous program services only, or miscellaneous program services in combination with job search assistance.Miscellanee...t...c program services include such activities as assessment, job-readiness preparation, vocationalexploration, job shadowing, and tryout employment. In this table, miscellaneous program services alsoinclude work experience, which is identified as a separate program service in other reports on the National
JTPA Study.(e) The barriers to employment include: not having a high school diploma or GED at the time of
random assignment; having worked fewer than 13 weeks during the 12 months prior to random assignment;and receiving AFDC or other cash assistance at the time of random assignment.
(f) The AFDC receipt may not have been continuous.
107

A. Service Receipt Rates for Each of the Youth Target Groups
Table 6.1 shows that female youths were more likely than male youths to receive CT-OS,
but they were less likely to receive employment-based services such as OJT and job search
assistance only. Forty-three percent of the female youths received CT-OS compared with 28
percent of the male youths, and 18 percent of the male youths received OTT compared with 13
percent of the female youths. The large difference in the percentage of female and male youths
who received CT -OS produced an overall difference in the percentage who received any form of
occupational training. In total, 57 percent of the female youths received either CT-OS or OTT,
while 46 percent of the male youths did so. However, 31 percent of the male youths received
some type of employment-based service in the form of OJT or job search assistance only. This
was calculated by adding the percentage of male youths who received OJT (18 percent) to the
percentage receiving job search assistance as their only service (13 percent). By contrast, 22
percent of the female youths received either OJT or job search assistance only. Further analysis
of the target group differences in service receipt rates is discussed later in the chapter.
B. Service Receipt Rates for Subgroups of Youth Enrollees
This section discusses the service receipt rates for subgroups of out-of-school youth
enrollees. Although there were large differences in service receipt rates for male and female
youths, many of the other subgroup differences in service receipt are similar for these two target
groups. Subgroup findings that differ for male and female youths (e.g., those related to
employment barriers) are indicated in the text, and Appendix B provides separate subgroup tables
for male and female youths.
1. Age subgroups. Youths aged 16-19 were just as likely to receive CT-OS, job search
assistance only, and miscellaneous non-training services as youths aged 2u-21. However, 22
percent of the out-of-school youths aged 16-19 (compared with only 13 percent of those aged 20-
21) received basic education without training. These are the youths least likely to have returned
to school before their JTPA enrollment to obtain their high school diploma or GED. JTPA
afforded them the opportunity to do that. Finally, the older youths were more likely to receive
OTT than the younger youths. Here, the older youths may have accumulated more work
experience and thus become more attractive to employers trying to fill OJT slots.
2. Ethnic subgroups. Table 6.1 shows that 33 percent of the black youths and 30
108
I

percent of the white youths received Cr-OS and that this difference was not statistically
significant. It also shows that white youths were three times more likely to receive Off than
black youths.4 Fifty-one percent of the white youths received occupational training in the form
of Cr-OS or OJT, compared with 40 percent of the black youths. This contrasts with the
findings for adults, which show that black men and women were more likely to receive
occupational training than white men and women. Also, unlike the adults, black youths were
twice as likely as white youths to receive basic education without training, which included basic
education and GED preparation. This is surprising given that similar percentages of black and
white youths (56 and 51 percent, respectively) had no high school diploma or GED at the time
of JTPA application.
Hispanic youths were twice as likely as white youths to receive Cr-OS, but were about half
as likely to receive the employment-based services including Off and job search assistance only.
Although Table 6.1 shows that only 7 percent of the Hispanic youths received basic education
without training, an additional 28 percents received basic education in combination with either
Cr-OS or OJT. Recall that basic education services include classes in English as a second
language (ESL). This finding suggests that, like the Hispanic adults, Hispanic youths may have
used JTPA support as a means of improving their English. Unlike the adults, however, Hispanic
youths were more likely to combine basic education with occupational training to become more
competitive in the labor market.
Later in the chapter, the discussion returns to an analysis of the extent to which differences
in service receipt rates associated with employment barriers account for differences in service
receipt rates among ethnic groups.
3. Employment barrier subzoups. This section focuses on the receipt of JTPA services
for subgroups of youth enrollres defined by three employment barriers: those with no high school
diploma or GED at the time of random assignment (referred to as high school dropout);6 those
who worked fewer than 13 weeks in the year prior to random assignment (referred to as limited
work experience); and those who were receiving AFDC or other cash assistance at the time of
4This difference is even larger among male youths, where 25 percent of the white youths received OJTcompared with only 6 percent of the black youths (see Appendix B).
51n Table 6.1, these individuals are included among the 61 percent of Hispanic youths who receivedCT-OS and the 11 percent who received OJT.
'Note that although the sample includes only out-of-school youths, more than half of the youthsobtained a high school diploma or GED before they applied for JTPA services (set Table 2.12).
109

random assignment (referred to as cash public assistance recipient).
The general association between employment barriers and service receipt can be seen in the
panel of Table 6.1 that lists subgroups of youth enrollees defined by the number of employment
barriers they possessed. Compared with youths with none of the employment barriers, those with
two or three barriers were much more likely to receive basic education without training and much
less likely to receive OJT or job search assistance only. The following analysis of the individual
employment barrier subgroups helps illuminate some of the underlying relationships between
service receipt and the needs of out-of-school youths. For example, the effect of not having a
high school diploma or GED accounts for much of the difference in receipt of CF -OS between
those with multiple employment barriers and those with no employment barriers.
Table 6.1 indicates that not having an educational credential was a key barrier to receiving
occupational training, including Cf-OS or OJT. Forty-four percent of the high school graduates
and GED recipients received CT -OS compared with 31 percent of the high school dropouts.
Also, Table 6.1 shows an especially large difference in OJT receipt rates between those with a
high school diploma or GED and high school dropouts; 24 percent of the graduates and GED
recipients received on compared with only 9 percent of the dropouts. These findings suggest
that classroom training providers and employers were likely to be cautious about investing in
youths who had not yet demonstrated educational persistence by obtaining a high school diploma
or GED.
At the same time, however, high school dropouts were more than ten times as likely as
graduates and GED recipients to receive basic education services without training. Given that
these youths did not receive subsequent JTPA-funded CF -OS or on. services during the follow-
up period, the payoff on their investment in basic education or GED preparation, at least in
terms of further training, is likely to occur later than it is for those who received CT -OS or OJT
during the follow-up period.
Not surprisingly, youths with limited work experience were less likely to receive employment-
based services such as OJT or job search assistance only than those who worked 13 weeks or
more during the year prior to JTPA application. However, youths with limited work experience
were more likely to receive CT -OS (although this was not statistically significant) and basic
education without training.
Fully 87 percent of the youths who were receiving cash public assistance were either hiih
school dropouts or had limited work experience, or both, which may have required them to obtain
110
5
further education before entering the labor market. In fact, Table 6.1 shows that compared with
those who were not receiving cash welfare payments, youths who were receiving AFDC or other
cash assistance at the time of JTPA application were more likely to receive basic education
without training and were less likely to receive employment-based services such as OJT and job
search assistance only.
4. AFDC history and household composition subgroups. Table 6.1 shows that long-
term AFDC recipients and single parents those most likely to be AFDC recipients were
more hiely to receive Cf-OS than those who had never received AFDC and those who were
married, respectively.?
C. Further Discussion of Key Findings
Three sets of findings stand out from the analyses discussed in the previous sections: gender
differences in service receipt, ethnic differences in service receipt, and the association between
the three employment barriers analyzed and the types of services that out-of-school youths
received. As is the case with adults, these issues have been the subject of other recent reports
on JTPA.8 This section addresses the question of whether differences in service receipt rates
associated with the employment barriers account for differences in the services received among
gender and ethnic groups. Specifically, the analysis examines gender and ethnic differences in
service receipt within subgroups of enrollees defined by the various combinations of the three
employment barriers discussed in the previous section (high school dropout, limited work
experience, and cash public assistance recipient). This will permit a further investigation of the
hypothesis that male and female youths (or black and white youths) with the same employment
barriers are equally likely to receive CT-OS.
Because many of the black and Hispanic youths were concentrated in the larger urban
SDAs, the analysis of ethnic differences in service receipt is expanded further. Specifically, ethnic
differences in service receipt were tested within a multivariate regression framework that adjusted
?Given the small number of male youths who had any history of AFDC receipt, the percentages forsubgroups of this characteristic displayed in Table 6.1 reflect service receipt primarily for female youths.
8In particular, one study analyzed data on a random sample of about 5,000 youths from 63 SDAs andfound that: (1) JTPA served less job-ready youths in roughly the same proportion as their representationin the eligible population (as estimated by the U.S. Census Bureau's Current Population Survey); (2) morejob-ready youths tended to receive occupational training (either in the classroom or on the job), while theless job-ready were more likely to be enrolled in non-occupational training; (3) black youths were morelikely to receive either non - occupational training or job search assistance only, and less likely to be enrolledin occupational training. See U.S. General Accounting Office, 1990.
111
6

for other differences in service receipt that may have been due to the distribution of ethnic
groups among different types of SDAs or to individual characteristics such as age, household
composition, AFDC history, and previous earnings that may also be associated with ethnicity.
1. Further analysis of tender differences In service receipt. The top panel of Table
6.2 is taken directly from Table 6.1 and shows that, overall, male youths were more likely to
receive Off or job search assistance only and less likely to receive CT-OS than female youths.
In part, differences in the types of services male and female youths received can be traced to
differences in the services for which they were recommended at assessment (see Table 4.1). For
example, 44 percent of the female youths and 30 percent of the male youths were recommended
for CT-OS. Also, 33 percent of the male youths were recommended for OJT and an additional
5 percent were recommended for job search assistance only. By contrast, 23 percent of the
female youths were recommended for Off and an additional 2 percent were recommended for
job search assistance only.
Like the differences between adult men and women highlighted in Chapter 5, service receipt
(as well as service recommendation) differences between male and female youths may also be
explained by differences in the types of employment barriers they possessed. For example, 42
percent of the female youths had two or three of the employment barriers analyzed compared
with 32 percent of the male youths (see Table 2.13). Also, 61 percent of the female youths had
limited work experience an attribute, as discussed above, associated with lower receipt rates of
OTT or job search assistance only compared with only 47 percent of the male youths.
In general, employment barriers accounted largely for target group differences in OJT and
job search assistance only receipt, but only partly for target group differences in CT-OS receipt.
The amaining panels in Table 6.2 display service receipt rates for male and female youths within
subjoups defined by each combination of the three employment barriers. The statistical
significance levels indicate whether the percentage of male youths who received a particular
category of services differed from the percentage of female youths who received that category of
services. For example, the second panel indicates that among youths with no employment
barriers, 47 percent of the female youths received CT-OS compared with 31 percent of the male
youths. The statistical significance level indicates that this difference was statistically significant
at the 1 percent level. Because so few male youths were receiving cash public assistance at the
time of their JTPA application and because cash public assistance receipt was highly correlated
with the other two employment barriers, the following discussion focuses on employment barrier
112
1 ri
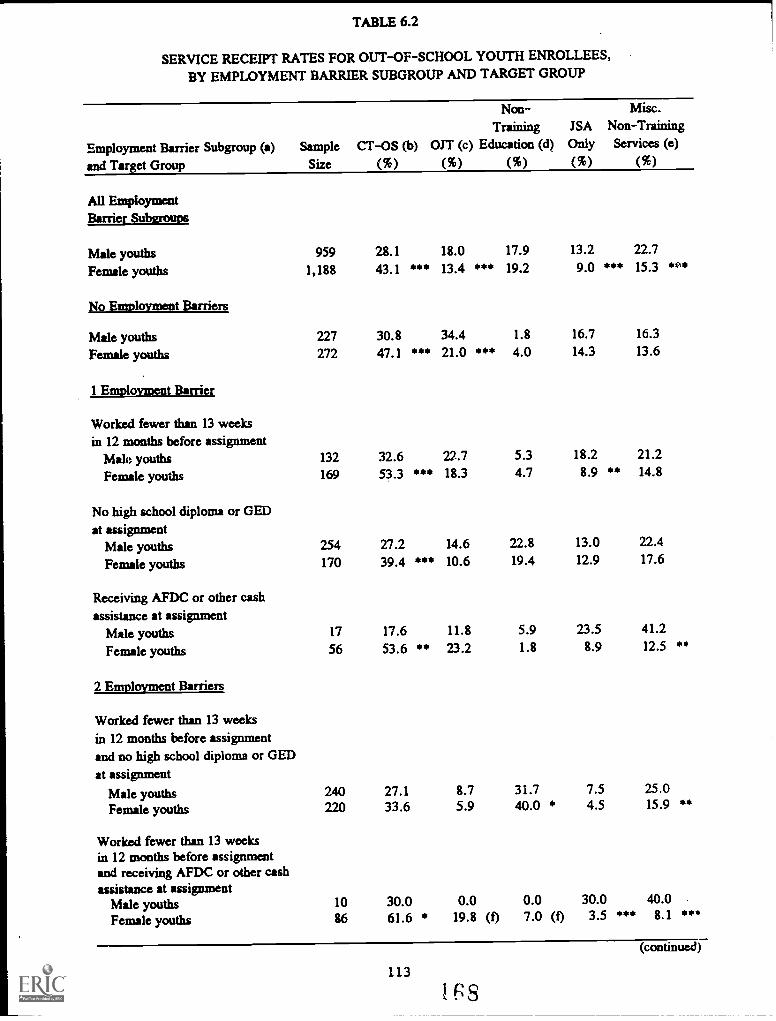
TABLE 6.2
SERVICE RECEIPT RATES FOR OUT-OF-SCHOOL YOUTH ENROLLEES,
BY EMPLOYMENT BARRIER SUBGROUP AND TARGET GROUP
Employment Barrier Subgroup (a) Sample CT-OS (b)
Non-Training
OJT (c) Education (d)JSAOnly
Misc.Non-TrainingServices (e)
and Target Group Size (%) (%) (%) (%) (%)
All EmploymentBarrier Subgroups
Male youths 9S9 28.1 18.0 17.9 13.2 22.7
Female youths 1,188 43.1 *** 13.4 *** 19.2 9.0 *** 15.3 *0*
No Employment Barriers
Male youths 227 30.8 34.4 1.8 16.7 16.3
Female youths 272 47.1 *** 21.0 *** 4.0 14.3 13.6
1 Employment Barrier
Worked fewer than 13 weeksin 12 months before assignment
Male youths 132 32.6 22.7 5.3 18.2 21.2
Female youths 169 53.3 *** 18.3 4.7 8.9 ** 14.8
No high school diploma or GEDat assignment
Male youths 254 27.2 14.6 22.8 13.0 22.4
Female youths 170 39.4 *** 10.6 19.4 12.9 17.6
Receiving AFDC or other cashassistance at assignment
Male youths 17 17.6 11.8 5.9 23.5 41.2
Female youths 56 53.6 ** 23.2 1.8 8.9 12.5 **
2 Employment Barriers
Worked fewer than 13 weeksin 12 months before assignmentand no high school diploma or GEDat assignment
Male youths 240 27.1 8.7 31.7 7.5 25.0
Female youths 220 33.6 5.9 40.0 * 4.5 15.9 **
Worked fewer than 13 weeksin 12 months before assignmentand receiving AFDC or other cashassistance at assignment
Male youths 10 30.0 0.0 0.0 30.0 40.0
Female youths 86 61.6 * 19.8 (f) 7.0 (f) 3.5 *** 8.1 ***
(continued)
113

TABLE 6.2 (continued)
Employment Barrier Subgroup (a) Sample CT-OS (b)
Non-Training
OJT (c) Education (d)ISAOnly
Misc.Non-TrainingServices (e)
and Target Group Size (%) (%) (%) (%) (%)
No high school diploma or GEDat assignment and receivingAFDC or other cash assistanceat assignment
Male youths 33 18.2 9.1 27.3 9.1 36.4Female youths 49 26.5 8.2 30.6 12.2 . 22.4
Ailltfinkaarriers
Male youths 45 22.2 2.2 37.8 8.9 28.9Female youths 162 34.0 3.7 40.1 4.3 17.9
SOURCE: MDRC calculations from Background Information Form responses and from programenrollment and participation data from the 16 SDAs.
NOTES: Calculations for this table are based on data for all out-of-school youth enrollees in the 18-monthstudy sample.
The program service categories in this table are mutually exclusive; see notes b, c, d, and e below.For each employment barrier subgroup, within each program service category, a chi-square test was
applied to the difference in service receipt rates between male youths and female youths. Statistical significancelevels are indicated as * = 10 percent; ** = 5 percent; *** = 1 percent.
(a) The barriers to employment include: not having a high school diploma or GED at the time ofrandom assignment; having worked fewer than 13 weeks during the 12 months prior to random assignment;and receiving AFDC or other cash assistance at the time of random assignment.
(b) The CT-OS service category includes enrollees who received CT-OS only, or CT-OS incombination with OJT, basic education, job search assistance, or miscellaneous program services.
(c) The OJT service category includes enrollees who received OJT only, or OJT in combinationwith basic education, job search assistance, or miscellaneous program services.
(d) The non-training education service category includes enrollees who received basic educationonly, or basic education in combination with job search assistance or miscellaneous program services.
(e) The miscellaneous non-training services category includes enrollees who received miscellane-ous program services only, or miscellaneous program services in combination with job search assistance.Miscellaneous program services include such activities as assessment, job-readiness preparation, vocationalexploration, job shadowing, and tryout employment. In this table, miscellaneous program services alsoinclude work experience, which is identified as a separate program service in other reports on the NationalJTPA Study.
(f) A chi-square test was inappropriate because of low expected cell frequencies.
1.1
114

combinations that do not include cash public assistance receipt.
Table 6.2 shows that the target group difference in OJT receipt was statistically significant
only among youths with no employment barriers. In other words, among youths with
combinations of employment barriers that included being a high school dropout or having limited
work experience, male and female youths were about equally likely to receive OJT. Similarly,
although male youths were more likely than female youths to receive job search assistance only,
the differences persisted only among youths with limited work experience, However, recall that,
in general, youths with these employment barriers were less likely to receive OJT or job search
assistance only than those with no employment barriers.
Among youths with no employment barriers and youths with only one employment barrier,
female youths were more likely to receive Cr-OS than male youths. As Table 6.2 indicates,
among youths who were high school dropouts and had limited work experience, however, there
were no statistically significant differences in CT-OS receipt between male and female youths.
2. Further analysis of ethnic differences in service receipt. The top panel of Table
63 is taken directly from Table 6.1 and displays the overall finding, discussed in the previous
section, that white youths were more likely than black youths to receive OJT or job search
assistance only and less likely to receive basic education without training. Like the ethnic
differences in service receipt among adults, service receipt differences among ethnic subgroups
of out-of-school youths may be associated with employment barriers. Black youths were much
more likely than white youths to have two or three ofthe employment barriers that were analyzed
(Table 2.14). Recall that, in general, all youths with multiple employment barriers were the most
likely to receive basic education without training or miscellaneous non-training services, while
those with none of the employment barriers were the most likely to receive employment-based
services, including Off or job search assistance only.
In general, employment barriers accounted for much of the difference between black and
white youths in their receipt of basic education without training, and for only some of the
difference in their receipt of employment-based services (Off and job search assistance only).
Table 6.3 displays service receipt rates for white, black, and Hispanic youths within subgroups
9Note that this difference was also statistically significant among youths with limited work experienceand cash public assistance receipt. However, only three male youths from this subgroup received job search
assistance only. As noted above, the discussion focuses on combinations of employment barriers thatincluded high school dropout and limited work experience because so few male youths were receiving cashpublic assistance at the time of their JTPA application.
115
7 0

TABLE 6.3
SERVICE RECEIPT RATES FOR OUT-OF-SCHOOL YOUTH ENROLLEES,- BY EMPLOYMENT BARRIER SUBGROUP AND ETHNICITY
Employment Barrier Subgroup (a)and Ethnicity
All EmploymentIkEduktgmaWhite, non-HispanicBlack, non-HispanicHispanic
No Employment Barriers
White, non-HispanicBlack, non-HispanicHispanic
1 Employment Barrier
Worked fewer than 13 weeksin 12 months before assignment
Whitd, non-HispanicBlack, non-HispanicHispanic
No high school diploma or GEDat assignment
White, non-HispanicBlack, non-HispanicHispanic
Receiving AFDC or other cashassistance at assignment
White, non-HispanicBlack, non-HispanicHispanic
2 Employment Barriers
Non-Training
Sample CT-OS (b) OJT (c) Education (d)Size (%) (%)
Worked fewer than 13 weeksin 12 months before assignmentand no high school diploma or GEDat assignment
White, non-HispanicBlack, non-HispanicHispanic
1,138588375
29.933.060.8
21.47.0
*** 10.9
345 33.6 31.373 49.3 ** 12.375 58.7 *** 21.3
148
7270
245102
66
4218
12
35.138.967.1 ***
28.223.559.1 ***
38.150.058.3
27.09.7
15.7
15.58.8
10.6
23.822.2
8.3
201 24.9 11.9167 19.8 2.479 64.6 *** 6.3
JSAOnly
Misc.Non-TrainingServices (e)
(%) (%) (%)
16.0 13.1 19.7*** 31.8 *** 9.4 ** 18.944* 6.9 *** 7.2 *** 14.1 44'
4.1 15.7 15.4*** 0.0 (f) 17.8 20.5* 1.3 10.7 8.0
4.1 12.8 20.9*** 9.7 19.4 22.2* 2.9 8.6 5.7 ***
19.2 16.3 20.837.3 *** 9.8 20.66.1 ** 6.1 ** 18.2
4.8 2.4 31.00.0 (f) 22.2 ** 5.6 *0.0 (f) 33.3 ** 0.0 (f)
31.8 10.9 20.4*** 53.3 ** 3.6 ** 21.0
10.1 *** 0.0 (f) 19.0
1 7 I,
116
(continued)

TABLE 6.3 (continued)
Employment Barrier Subgroup (a)and Ethnicity
SampleSize
Non-Training
CT-OS (b) OJT (c) Education (d)
(%) (%) (%)
ISAOnly(%)
Misc.Non-TrainingServices (e)
(%)
Worked fewer than 13 weeksin 12 months before assignmentand receiving AFDC or other cashassistance at assignment
White, non-Hispanic 37 27.0 35.1 10.8 8.1 18.9
Black, non-Hispanic 37 78.4 *** 8.1 5.4 2.7 5.4
Hispanic 22 77.3 *** 4.5 ** .0.0 (f) 9.1 9.1
No high school diploma or GEDat assignment and receivingAFDC or other cash assistanceat assignment
White, non-Hispanic 44 22.7 11.4 29.5 15.9 20.5
Black, non-Hispanic 25 16.0 8.0 36.0 4.0 36.0
Hispanic 11 45.5 0.0 (f) 18.2 9.1 27.3
All 3 Employment Barriers
White, non-Hispanic 74 21.6 5.4 43.2 4.1 25.7
Black, non-Hispanic 92 32.6 3.3 44.6 6.5 13.0
Hispanic 39 46.2 *** 0.0 (t) 23.1 ** 5.1 25.6
SOURCE: MDRC calculations from Background Information Form responses and from program enrollment
and participation data from the 16 SDAs.
NOTES: Calculations for this table are based on data for all white, black, and Hispanic out-of-school youth
enrollees in the 18-month study sample. Enrollees from other ethnic groups were not included because of small
sample sizes.The program service categories in this table are mutually exclusive; see notes b, c, d, and e below.
For each employment barrier subgroup, within each program service category, a chi-square test
was applied to the difference in service receipt rates between white enrollees and black enrollees and
between white enrollees and Hispanic enrollees. Statistical significance levels are indicated as
* 10 percent; ** it 5 percent; *** IM 1 percent.(a) The barriers to employment include: not having a high school diploma or GED at the time of
random assignment; having worked fewer than 13 weeks during the 12 months prior to random assignment;
and receiving AFDC or other cash assistance at the time of random assignment.
(b) The CT-OS service category includes enrollees who received CT-OS only, or CT-OS in
combination with OJT, basic education, job search assistance, or miscellaneous program services.
(c) The OJT service category includes enrollees who received OJT only, or OJT in combination
with basic education, job search assistance, or miscellaneous program services.(d) The non-training education service category includes enrollees who received basic education
only, or basic education in combination with job search assistance or miscellaneous program services.
(e) The miscellaneous non-training services category includes enrollees who received miscellane-
ous program services only, or miscellaneous program services in combination with job search assistance.
Miscellaneous program services include such activities as assessment, job-readiness preparation, vocational
exploration, job shadowing, and tryoutemployment. In this table, miscellaneous program services also
include work experience, which is identified as a separate program service in other reports on the National
JTPA Study.(1) A chi-square test was inappropriate because of low expected cell frequencies.
117

defined by each combination of the three employment barriers.1° The statistical significance levels
indicate whether the percentage of white youths who received a particular category of services
differed from the percentage of black or Hispanic youths who received that category of services.
For example, the second panel shows that among youths with no employment barriers, 34 percent
of the white youths and 49 percent of the black youths received CT-OS. The table also indicates
that this difference was statistically significant at the 5 percent level.
Employment barriers appear to account for some of the white/black difference in OJTreceipt. In four of the eight employment barrier subgroups which included more than 60percent of the youths white youths were more likely to receive OJT than black youths. Also,
although the top panel in Table 6.3 shows that there was no overall difference in CT-OS receipt
rates between white and black youths, there were differences within two of the employment
barrier subgroups. Among youths with no employment barriers and among those who had limited
work experience and were receiving public assistance, black youths were much more likely than
white youths to receive CI'-OS and much less likely to receive OJT. It appears that for black
youths in these two employment barrier subgroups, CT-OS served as a substitute for the OJT, job
search assistance, and other non-training services that they did not obtain or did not want.Among youths who were high school dropouts and had limited work experience, black youths
were less likely than white youths to receive OJT or job search assistance only, but were more
likely to receive basic education without training.
Finally, Table 6.3 indicates that employment barriers accounted partly for the white/Hispanic
differences in OJT and job search assistance only receipt, but for very little of the difference in
CT-OS receipt. For example, the differences in OJT receipt rates were not statistically significant
in three of the employment barrier subgroups and persisted in three others. The difference in
CT-OS receipt rates persisted in six of the employment barrier subgroups and were notstatistically significant in the other two.
Ethnic differences in service receipt may also be due to other factors such as theconcentration of minority youths in largely urban SDAs or other individual characteristics that may
be related to ethnicity and service receipt rates. In order to investigate this possibility, the
analysis was expanded to construct multivariate regression models that estimate service receipt
rates among ethnic groups while adjusting for differences that might be due to a variety of
10Youths from "other ethnic groups were not included in the analysis because of small sample sizes.
118

background and SDA characteristics. The following results are based on a regression model that
adjusts for differences among ethnic groups associated with age, gender, AFDC history, household
composition, random-assignment date, Food Stamp receipt at random assignment, previous
enrollment in job club, having a high school diploma rather than a GED, and SDA characteristics,
as well as the employment barrier combinations listed in Table 6.3. Like the findings for adults
discussed in the previous chapter, the results from this model help explain the ethnic differences
in service receipt rates. For example, the regression-adjusted percentage of white youths who
received CT-OS was 31 percent compared with 33 percent for black youths, and the regression-
adjusted percentage for white youths who received OJT was 18 percent compared with 14 percent
for black youths. For this particular regression model specification, the white/black differences
in CT-OS and OJT receipt were not judged to be statistically significant. Again, as was true for
adults, the results from this model indicate that ethnic differences in service receipt can be
explained on the basis of site differences in service emphasis and differences in service receipt
among subgroups defined by characteristics other than ethnicity. However, other model
specifications yielded differences that were statistically significant.
Again, readers should exercise caution in interpreting the multivariate regression results
because they are sensitive to the regression model specification used. Also, this type of statistical
modeling is difficult to translate into policy-relevant and practical conclusions. SDAs must serve
real people rather than individuals (reflected in the regression model) who are the same on all
characteriztlf:s except ethnicity. Therefore, the analysis shown in Table 6.3 is probably the most
realistic picture of ethnic differen service receipt in the study sites.
The analysis discussed here (like the analysis in Chapter 5) provides a further context for
interpreting the ethnic differences in service receipt rates displayed in Table 6.1. Examining these
differences within employment barrier subgroups and through a multivariate regression framework
sheds some light on why these differences occurred, but does not account for all of the
differences. Other factors such as individual characteristics and employment barriers not examined
here, individual preferences, and SDA, service provider, and employer practices (which, in some
cases, may amount to racial discrimination) may account for differences in the way JTPA services
are distributed among ethnic groups. It is also important to keep in mind that previous stages
in the JTPA client flow also include screening mechanisms that determine service receipt and may
result in ethnic differences not analyzed in this chapter.
119

IL The Length of Enrollment for Out-of-School Youths
A. The Relationship Between Length of Enrollment and Services Received
Like the findings for adults, length of enrollment for youth enrollees was most closely
associated with the types of services they received. The top row in Table 6.4 lists the median
length of enrollment for all out-of-school youths and for each of the five service categories. It
shows that, overall, the median length of enrollment for out-of-school youths was 3.6 months,
slightly longer than the median length of enrollment for adults (3.2 months). Table 6.4 also shows
that the median length of enrollment for those who received CT-OS the most widely utilized
service among youths was 5.3 months. At the other extreme, the me.lian length of enrollment
for youths who received job search assistance only was less than one month. In the middle, the
median length of enrollment for those who received OJT was 3.1 months. This was slightly
longer than the median length of enrollment for adults who received OJT. Basic education
without training played a key role in the way that SDAs in the study served out-of-school youths,
particularly those with multiple employment barriers. Table 6.4 shows that these services were
relatively long-lasting, with a median length of enrollment of almost four months.11
B. Stamen) Differences in Length of Enrollment
The relationship between the services that male youth enrollees received and the length
of their enrollments also helps explain subgroup differences in length of enrollment. Table 6.4
lists selected subgroups of youth enrollees and the median length of enrollment (in months) for
each subgroup, both overall and by the category of services they received. Statistical tests were
performed to determine whether there were significant differences in median length of enrollment
between the first subgroup listed under each characteristic and each of the other subgroups. For
example, among the subgroups defined by ethnicity, the table indicates that there was a
statistically significant difference between the median length of enrollment for all white youths
(3.4 months) and the median length of enrollment for all Hispanic youths (4.8 months). The
table also indicates that there was no statistically significant difference between the median length
11These differences in length of enrollment among youths in each of the service categories account forsimilar differences in length of enrollment among youths in each of the recommended service strategies.For example, youth enrollees recommended for the classroom training service strategy had the longestmedian length of enrollment at 5.0 months, and those recommended for the OJT/JSA service strategy hadthe shortest median length of enrollment at 2.7 months. Youth enrollees recommended for the otherservices strategy had a median length of enrollment of 3.0 months.
120
1 7 5

TA
BL
E 6
.4
ME
DIA
N L
EN
GT
H O
F E
NR
OL
LM
EN
T F
OR
OU
T-O
F-SC
HO
OL
YO
UT
HS,
BY
SE
LE
CT
ED
BA
SEL
INE
CH
AR
AC
TE
RIS
TIC
S A
ND
SE
RV
ICE
RE
CE
IPT
Cha
ract
eris
tic
and
Subg
roup
Sam
ple
Sizt
.
Non
-M
isc.
All
Tra
inin
gJS
AN
on-T
rain
ing
Serv
ices
CT
-OS
(a)
OJT
(b)
Edu
catio
n (c
)O
nly
Serv
ices
(d)
(mon
ths)
(mon
ths)
(mon
ths)
(mon
ths)
(mon
ths)
(mon
ths)
All
Out
-of-
Scho
ol Y
outh
Enr
olle
es2,
147
3.6
5.3
3.1
3.9
0.8
2.8
Tar
get G
roup
Mal
e yo
uths
959
3.3
5.1
3.1
3.7
0.8
2.4
Fem
ale
yout
hs1,
188
3.9
***
5.4
3.0
4.1
0.9
3.2
***
Age 16
-19
1,32
23.
75.
43.
13.
81.
03.
0
1-. N I-.
20-2
182
53.
55.
23.
04.
10.
7 **
*E
4**
Eth
nici
tyW
hite
, non
-His
pani
c1,
138
3.4
4.8
3.1
4.5
0.8
2.9
Bla
ck, n
on-H
ispa
nic
588
3.4
5.3
2.0
***
3.4
***
0.8
2.7
His
pani
c37
54.
8*
*u6.
5**
*4.
4**
*4.
50.
92.
6
Oth
er46
3.0
3.7
2.1
3.6
0.0
(e)
3.4
Edu
catio
nH
igh
scho
ol d
iplo
ma
or G
ED
885
3.8
5.7
3.3
3.7
0.7
2.8
No
high
sch
ool d
iplo
ma
or G
ED
1,17
33.
5**
4.9
**2.
74'
.3.
91.
1**
*2.
9
(con
tinue
d)
Is 7
67

TA
BL
E 6
.4 (
cont
inue
d)
Cha
ract
eris
tican
d Su
bgro
upSa
mpl
eSi
ze
Non
-M
isc.
All
Tra
inin
gJS
AN
on-T
rain
ing
Serv
ices
CT
-OS
(a)
OT
T (
b) E
duca
tion
(c)
Onl
ySe
rvic
es (
d)(m
onth
s)(m
onth
s)(m
onth
s)(m
onth
s)(m
onth
s)(m
onth
s)
Wor
k E
xper
ienc
eW
orke
d 13
wee
ks o
r m
ore
in 1
2 m
onth
s be
fore
ass
ignm
ent
877
3.4
5.0
3.0
4.3
0.8
2.5
Wor
ked
few
er th
an 1
3 w
eeks
in 1
2 m
onth
s be
fore
ass
ignm
ent
1,06
43.
8**
*5.
53.
23.
80.
9*
3.1
**
Publ
ic A
ssis
tanc
e R
ecei
ptN
ot r
ecei
ving
AFD
C o
r ot
her
cash
assi
stan
ce a
t ass
ignm
ent
1,47
93.
55.
32.
94.
00.
82.
6R
ecei
ving
AFD
C o
r ot
her
cash
assi
stan
ce a
t ass
ignm
ent
458
4.0
***
6.0
3.5
*4.
11.
2**
3.2
*1-
..
N t.
..)B
arri
ers
to E
mpl
oym
ent (
f)N
one
499
3.4
5.0
3.1
4.2
0.7
2.4
179
83.
65.
62.
93.
70.
8**
*2.
72
638
3.8
**5.
33.
54.
11.
2**
*3.
1*
320
73.
65.
11.
6**
3.8
2.0
***
3.2
*
AFD
C H
isto
ryN
ever
rec
eive
d A
FDC
1,78
33.
55.
23.
13.
70.
82.
7R
ecei
ved
AFD
C le
ss th
an2
year
s (g
)26
74.
2**
*6.
22.
84.
6**
1.0
3.6
**R
ecei
ved
AFD
C 2
yea
rs-
r1or
mor
e (g
)82
4.3
**5.
13.
74.
53.
13.
4
Hou
seho
ld C
ompo
sitio
nSp
ouse
pre
sent
248
3.5
5.0
3.0
5.2
0.9
1.7
No
spou
se p
rese
nt, c
hild
pre
sent
437
4.2
**6.
23.
04.
2*
0.8
3.7
***
No
spou
se p
rese
nt, n
o ch
ildpr
esen
t1,
316
3.4
5.0
3.1
3.5
***
0.8
2.7
**
(con
tinue
d)

TA
BL
E 6
.4 (
cont
inue
d)
SOU
RC
E: M
DR
C c
cicu
latio
ns f
rom
Bac
kgro
und
Info
rmat
ion
Form
resp
onse
s an
d fr
om p
rogr
am e
nrol
lmen
tan
d pa
rtic
ipat
ion
data
fro
m th
e 16
SD
As.
NO
TE
S: C
alcu
latio
ns f
or th
is ta
ble
are
base
d on
dat
a fo
r al
l out
-of-
scho
ol y
outh
enr
olle
es in
the
18-m
onth
stu
dy s
ampl
e. T
he to
tal s
ampl
e si
ze m
ay v
ary
amon
g ch
arac
teri
stic
s be
caus
e of
mis
sing
dat
afo
r so
me
enro
llees
.
The
med
ian
leng
th o
f en
rollm
ent i
s de
fine
d as
the
num
ber
of m
onth
s af
ter
enro
llmen
t by
whi
ch h
alf
of th
e en
rolle
es in
a s
ubgr
oup
com
plet
ed th
eir
JTPA
par
ticip
atio
n.T
he p
rogr
am s
ervi
ce c
ateg
orie
s in
this
tabl
e ar
e m
utua
lly e
xclu
sive
; see
not
es a
, b, c
, and
d b
elow
.Fo
r ea
ch c
hara
cter
istic
, with
in e
ach
prog
ram
ser
vice
cat
egor
y, a
chi
-squ
are
test
was
app
lied
to th
e di
ffer
ence
in m
edia
n le
ngth
of
enro
llmen
t bet
wee
n th
e fi
rst s
ubgr
oup
liste
d an
d, s
epar
atel
y, e
ach
of th
ere
mai
ning
sub
grou
ps. S
tatis
tical
sig
nifi
canc
e le
vels
are
indi
cate
d as
* =
10
perc
ent;
** =
5 p
erce
nt; *
**=
1 p
erce
nt.
(a)
The
CT
-OS
serv
ice
cate
gory
incl
udes
enr
olle
es w
ho r
ecei
ved
CT
-OS
only
, or
CT
-OS
inco
mbi
natio
n w
ith O
JT, b
asic
edu
catio
n, jo
b se
arch
ass
ista
nce,
or
mis
cella
neou
s pr
ogra
m s
ervi
ces.
.
(b)
The
OJT
ser
vice
cat
egor
y in
clud
es e
nrol
lees
who
rec
eive
d O
JT o
nly,
or
OJT
in c
ombi
natio
nw
ith b
asic
edu
catio
n, jo
b se
arch
ass
ista
nce,
or
mis
cella
neou
s pr
ogra
m s
ervi
ces.
-(c
) T
he n
on-t
rain
ing
educ
atio
n se
rvic
e ca
tego
ry in
clud
es e
nrol
lees
who
rec
eive
d ba
sic
educ
atio
non
ly, o
r ba
sic
educ
atio
n in
com
bina
tion
with
job
sear
ch a
ssis
tanc
e or
mis
cella
neou
s pr
ogra
m s
ervi
ces.
(d)
The
mis
cella
neou
s no
n-tr
aini
ng s
ervi
ces
cate
gory
incl
udes
enr
olle
es w
ho r
ecei
ved
mis
cella
ne-
ous
prog
ram
ser
vice
s on
ly, o
r m
isce
llane
ous
prog
ram
ser
vice
s in
com
bina
tion
with
job
sear
ch a
ssis
tanc
e.M
isce
llane
ous
prog
ram
ser
vice
s in
clud
e su
ch a
ctiv
ities
as
asse
ssm
ent,
job-
read
ines
s pr
epar
atio
n, v
ocat
iona
lex
plor
atio
n, jo
b sh
adow
ing,
and
tryo
ut e
mpl
oym
ent.
In th
is ta
ble,
mis
cella
neou
s pr
ogra
m s
ervi
ces
also
incl
ude
wor
k ex
peri
ence
, whi
ch is
iden
tifie
d as
a s
epar
ate
prog
ram
ser
vice
in o
ther
rep
orts
on
the
Nat
iona
lJT
PA S
tudy
.(e
) A
chi
-squ
are
test
was
inap
prop
riat
e be
caus
e of
low
exp
ecte
d ce
ll fr
eque
ncie
s.(f
) T
he b
arri
ers
to e
mpl
oym
ent i
nclu
de: n
ot h
avin
g a
high
sch
ool d
iplo
ma
or G
ED
at t
he ti
me
ofra
ndom
ass
ignm
ent;
havi
ng w
orke
d fe
wer
than
13
wee
ks d
urin
g th
e 12
mon
ths
prio
r to
ran
dom
ass
ignm
ent;
and
rece
ivin
g A
FDC
or
othe
r ca
sh a
ssis
tanc
e at
the
time
of r
ando
m a
ssig
nmen
t.(g
) T
he A
FDC
rec
eipt
may
not
hav
e be
en c
ontin
uous
.

of enrollment for white youths and the median length of enrollment for black youths (3.4months).12
Table 6.4 shows that those who received classroom-based services (CT-OS or basic education
without training) tended to have longer enrollments than those who received employment-basedservices (OJT or job search assistance only). For example, recall from Table 6.1 that femaleyouths were much more likely than male youths to receive CT-OS the service category withthe longest median length of enrollment. This accounts for the finding shown in Table 6.4 that
the median length of enrollment for all female youths was more than half a month longer thanthat for male youths. In fact, except for those who received miscellaneous non-training servicesonly, there were no statistically significant differences in median length of enrollment betweenmale and female youths who received the same services.
Table 6.4 also shows that there was no statistically significant difference in the median
length of enrollment between white and black youths. However, among those who received OJT
and basic education without training, black youths had shorter enrollments than white youths.This suggests that black youths may have been more likely to leave than white youths eitherfor positive reasons such as finding a job or for other reasons such as lack of interest. It mayalso be that the training and education that black youths received was oriented toward lower-
skill occupations and therefore, by design, shorter than that received by white youths.Interestingly, Hispanic youths bad longer enrollments than white youths among enrollees whoreceived CT-OS or OJT. This may be due, in large part, to the fact that Hispanic youths were
more likely to combine basic education with the occupational training services.
Among youths who received CT-OS or OJT, high school dropouts had shorter enrollments
than those who had a high school diploma or GED at the time of their JTPA application. Thismay signify that those who left school previously may have continued this pattern by notcompleting their training or it may be that the training was, by design, shorter than that received
by graduates and GED recipients. However, the median length of enrollment for high schooldropouts who received basic education without training was actually slightly longer (although not
statistically different) than that for graduates who received basic education without training. Thedifferences in length of enrollment among other employment barrier subgroups is due, in large
12Un less otherwise nosed, discussion of median length of enrollment differences among subgroupsfocuses on those that are statistically significant at the 10 percent level or lower.
124

part, to differences in the types of services they received. Those who tended to receive basic
education services such as those with limited work experience and those receiving cash public
assistance had longer enrollments than their more job-ready counterparts, who were more likely
to receive employment-based services, including OJT or job search assistance only.
125
I S 3

CHAPTER 7
VARIATIONS ACROSS THE SERVICE DELIVERY AREAS
Chapters 4-6 presented participation information about the entire JTPA study sample, bymajor target group and subgroup. However, by their nature, these pooled, cross-site analysesconceal any differences or variations that exist among the 16 diverse SDAs in the sample and,therefore, do not permit attempts to determine whether or how local conditions and SDAdecisions or actions are related to types of services offered or particular types of clientsenrolled by these 16 SDAs.
The conceptual framework for examining these kinds of potential relationships at thespecific SDA level is presented in Figure 7.1. On the left -hand side, under "Local Context ofthe JTPA Program," are listed the three main "external" factors over which the SDAs have littleor no control but that can reasonably be expected to affect the services offered and thepopulation served by a particular SDA: labor market and other local economic conditions,including the unemployment rate and the degree to which the area is urban or rural; thecharacteristics and size of the JTPA-eligible population residing in the SDA, from which actualenrollees are drawn; and the broad range of potential service providers in the community, fromwhich the SDA selects its actual service providers. On the right -band side are four areas ofSDA management and organization over which, as described in Chapter 1, the SDAs can exertsubstantial control, within statutory limits: the nature of the partnership between local electedofficials and the local private industry council (PIC); the service providers; the SDA'sadministrative processes (particularly recruitment, eligibility, and intake, and the method ofselecting and contracting with service providers); and the SDA's response to performancestandards.' Together, these external factors (on the left) and areas of SDA discretion (on the
'Two clarifications are needed about the data used for the analysis of performance standards.First, unlike Chapter 2, which discussed the performance and adjusted performance standards of theif study sites for one program year (PY 1988) based on JTPA Annual Status Report (JASR) data,this chapter relies on data on performance and adjusted performance standards that are averaged foreach SDA over the three program years of this study (PYs 1987, 1988, and 1989). These data werebased on information provided by the states in which the SDAs are located, and this proceduie wasfollowed to permit a fuller view of "performance' over time for the study sites. Typically, there are
(continued...)126
,4
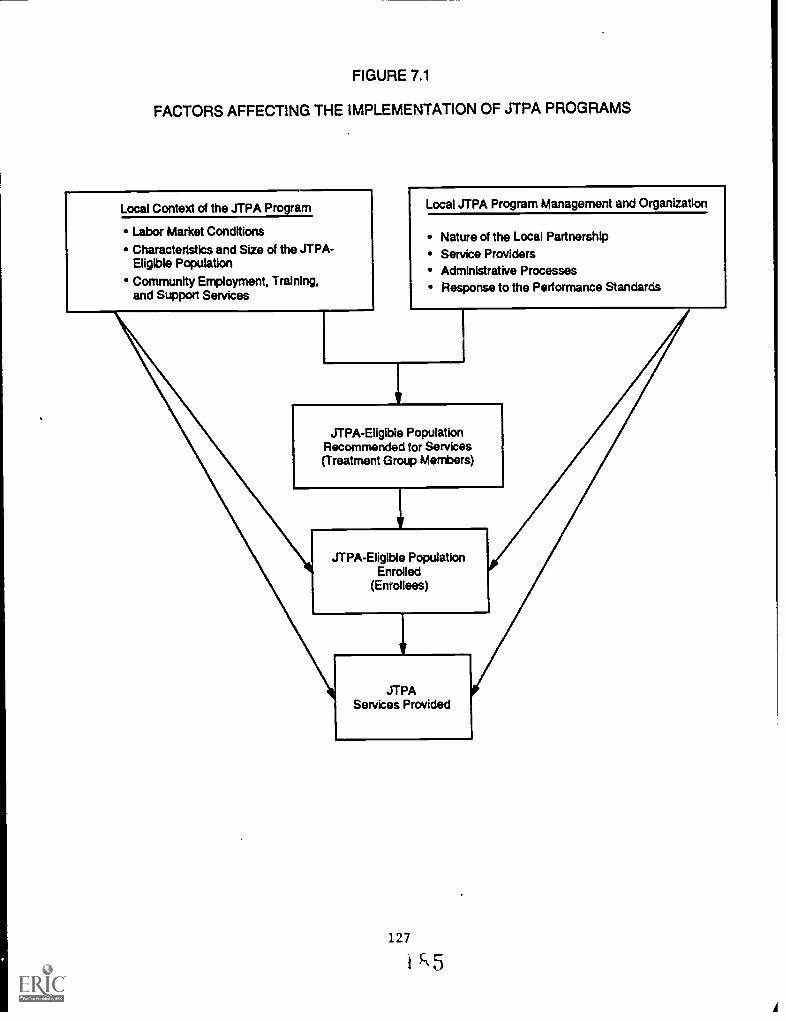
FIGURE 7.1
FACTORS AFFECTING THE IMPLEMENTATION OF JTPA PROGRAMS
Local Context of the JTPA Program
Labor Market Conditions
Characteristics and Size of the JTPA-Eligible Population
Community Employment, Training,and Support Services
Local JTPA Program Management and Organization
Nature of the Local PartnershipService ProvidersAdministrative ProcessesResponse to the Performance Standards
JTPAEligible PopulationRecommended for Services(Treatment Group Members)
JTPA-Eligible PopulationEnrolled
(Enrollees)
JTPAServices Provided
127
1S5
right) lead to the remaining boxes in Figure 7.1: the identification of the JTPA-eligible
population recommended for service strategies, the population actually enrolled, and the
particular set of services provided.
Chapter 2 presented and analyzed the high degree of variation across the 16 SDAs in
local economic conditions and in most of the factors on the right-hand side of Figure 7.1.
Section II of this chapter examines the variation and patterns of variation among SDAs in the
services they recommended, the "disadvantagedrtess" of the population they served, and theservices JTPA enrollees actually received. This analysis provides important contextual
information for understanding the pooled, cross-site impacts as well as the impacts of individual
SDAs presented in the 18-month impact report (Bloom et al., 1993). Section Di thenexamines
several commonly held "hypotheses" about the relationship between SDA characteristics and
the services they are likely to emphasize and the population they are likely to serve.2Examples of the hypotheses based on these potential relationships include the following:
Possible Hypotheses
Areas with higher unemployment rates tend to emphasize classroom training,on the grounds that immediate employment opportunities often viewed asa prerequisite for programs emphasizing OJT/JSA are more limited.
SDAs that substantially exceed their adjusted performance standards (e.g., jobplacement rates) tend to enroll individuals with fewer employment barriersthan do SDAs that do not meet, or only marginally meet, their adjustedperformance standards.
1(...continued)few differences in information provided by the states and JASRs. It is true that averaging performance
eover three years disguises the variation within an SDA over the three- riod; about half of theSDAs experienced notable variation in performance over these three h for adults and youths.However, since the study period covered these three years, and since no single year would represent theSDAs' performance over the entire study period, the three-year averages appeared to be the mostappropriate indicator for the desired analysis.
Second, for the analysis involving adult performance standards, only the entered employmentrate was used. It was the standard consistently adopted by the study sites and typically drew the mostattention. The separate analysis involving youth performance standards uses entered employment rateand positive termination rate.
The analysis in this chapter does not address a third set of issues concerning the relationshipbetween SDA characteristics and variation in SDA- specific program impacts. See Bloom et al., 1993,for a discussion of this.
128

In contrast to government-operated SDAs, PIC-operated SDAs tend toemphasize OJT as a service, since !* provides a training subsidy to the private
sector. (Alternatively, it has been hypothesized that PIC-operated SDAsemphasize classroom training to increase the skills level of the potentialemployees.) Further, PIC-operated SDAs also tend to enroll individuals withfewer employment barriers in order to meet the needs of the local employer
community.
SDAs that make greater use of fixed unit price, performance-based contractsenroll larger proportions of less disadvantaged individuals than do SDAs thatrely mostly on cost-reimbursement contracts.
It is important to note that these and similar hypotheses are addressed far less rigorously
than are other issues in this report and in the 18-month impact report, for three main reasons.
First, and most important, these analyses of relationships are nonexperimental; i.e., they result
not from comparing the experiences of treatment and control group members in the same
location, but from cross-site comparisons in which there are likely to be a host of other
unmeasured differences that may account for any relationships detected. In addition, relatively
simple comparative and descriptive methods were used to analyze the data. Hence, the cross-
site comparisons must be viewed largely as suggestive and descriptive, and not as definitive.3
The second reason is that the number of "observations" i.e., study sites is quite small
for this sort of analysis (or for sophisticated statistical modelling techniques, which were not
undertaken primarily for this reason). Given the large number of possible explanations for
variations across sites e.g., for the types of individuals served or services provided and the
limited number of sites, it is extremely difficult to conclude that one condition (such as the
unemployment rate or a high job placement rate) is the main factor or reason for the
enrollment of particular types of individuals or the provision of specific services, even if there
appears to be a strong correlation.
The third reason concerns the amount and level of available information about the
external factors the left-hand side of Figure 7.1 as well as some of the areas of SDA
3This caution also applies to any attempts to link local conditions or areas of SDA discretion toprogram impacts. Since both would be nonexperimental cross-site comparisons, they would be less
reliable; to answer, with equal rigor, the question of how program characteristics affect participationpatterns, or impacts, would require a 'differential" impact design, in which individuals would berandomly assigned to programs having different characteristics. As discussed in Chapter 3, measuringdifferential impacts was not a goal of the National JTPA Study. For a full discussion of the difficultiesinherent in drawing conclusions from cross-site comparisons, see Cave and Doolittle, 1991, pp. 161ff.
129
`,7

discretion that further limit the comprehensiveness and depth of analyses presented in this
chapter. As stated in Chapter 1, the Request for Proposals (RFP) issued by DOL did not
envision the collection of a large amount of information on the participating SDAs beyond the
type of enrollment and participation data and information on administrative structures
presented in the preceding chapters. Only a small amount of information about the external
factors was collected on the participating SDAs, such as the basic unemployment rate, wage
level, and population data presented in Chapter 2. Apart from a forthcoming nonexperimental
study conducted in four of the SDAs, little information was collected on the characteristics of
the JTPA-eligible population or on the range of potential service providers. Hence, regarding
the topics listed on the right-hand side of Figure 7.1, analysis must be quite limited.
With these important cautions in mind, this chapter now shifts the focus from ',he entire
"pooled" sample of treatment group members analyzed in the preceding four chapters to site-
specific findings in the 16 individual SDAs that agreed to be part of the National JTPA Study.
I. An Overview of the Findings
Several findings emerge from this chapter:
SDAs varied widely in the types of services they recommended for adults andyouths. For example, the proportion of adults recommended for theOJT/JSA service strategy ranged from 7 percent to 79 percent; the proportionof youths recommended for the other services strategy ranged from 0 percentto 88 percen
Similarly, SDAs varied widely in the types of services that enrollees actuallyreceived. For example, the proportion of adult enrollees who received basiceducation not in combination with OJT or classroom training ranged from 0percent to 47 percent; for youth enrollees, it ranged from 0 percent to 80percent.
With respect to treatment group members who had multiple employmentbard( s, there were large differences across sites in the formal JTPAenrol nent rate.4 For example, for adults with multiple barriers, the
4As discussed in Chapter 5, the employment barriers used in this study were based on amount ofprior employment, educational attainment, and welfare receipt. Other objective and subjectivecharacteristics that many experts believe to be important indicators of disadvantage are not consideredin these analyses.
130
S
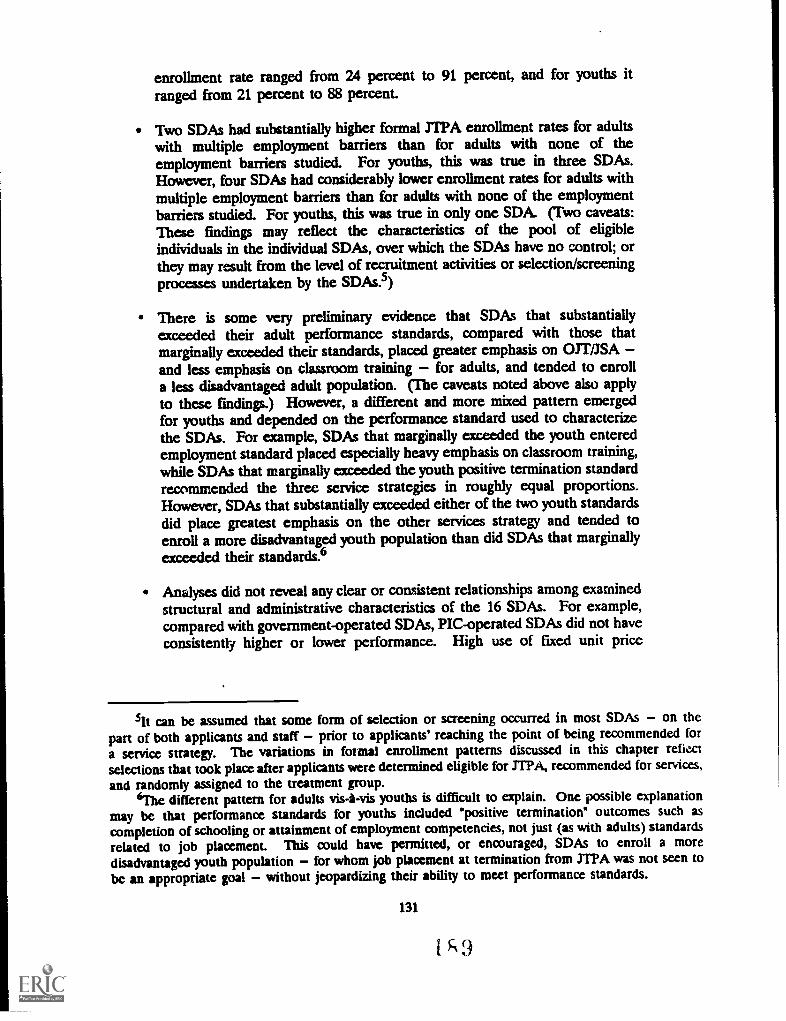
enrollment rate ranged from 24 percent to 91 percent, and for youths itranged from 21 percent to 88 percent.
Two SDAs had substantially higher formal JTPA enrollment rates for adultswith multiple employment barriers than for adults with none of theemployment barriers studied. For youths, this was true in three SDAs.However, four SDAs had considerably lower enrollment rates for adults withmultiple employment barriers than for adults with none of the employmentbarriers studied. For youths, this was true in only one SDA. (Two caveats:These findings may reflect the characteristics of the pool of eligibleindividuals in the individual SDAs, over which the SDAs have no control; orthey may result from the level of recruitment activities or selection/screeningprocesses undertaken by the SDAs S)
There is some very preliminary evidence that SDAs that substantiallyexceeded their adult performance standards, compared with those thatmarginally exceeded their standards, placed greater emphasis on OJT/JSAand less emphasis on classroom training for adults, and tended to enrolla less disadvantaged adult population. (The caveats noted above also applyto these findings.) However, a different and more mixed pattern emergedfor youths and depended on the performance standard used to characterizethe SDAs. For example, SDAs that marginally exceeded the youth enteredemployment standard placed especially heavy emphasis on classroom training,while SDAs that marginally exceeded the youth positive termination standardrecommended the three service strategies in roughly equal proportions.However, SDAs that substantially exceeded either of the two youth standardsdid place greatest emphasis on the other services strategy and tended toenroll a more disadvantaged youth population than did SDAs that marginallyexceeded their standards.6
Analyses did not reveal any clear or consistent relationships among examinedstructural and administrative characteristics of the 16 SDAs. For example,compared with government-operated SDAs, PIC-operated SDAs did not haveconsistently higher or lower performance. High use of fixed unit price
51t can be assumed that some form of selection or screening occurred in most SDAs on thepart of both applicants and staff prior to applicants' reaching the point of being recommended fora service strategy. The variations in formal enrollment patterns discussed in this chapter reflectselections that took place after applicants were determined eligible for JTPA, recommended for services,and randomly assigned to the treatment group.
(The different pattern for adults vis-i-vis youths is difficult to explain. One possible explanationmay be that performance standards for youths included "positive termination" outcomes such ascompletion of schooling or attainment of employment competencies, not just (as with adults) standardsrelated to job placement. This could have permitted, or encouraged, SDAs to enroll a moredisadvantaged youth population for whom job placement at termination from JTPA was not seen tobe an appropriate goal without jeopardizing their ability to meet performance standards.
131
is9

contracts did not appear to be associated with higher levels of performance,or with PIC-operated SDAs compared with government-operated SDAs.
Also, compared with government-operated SDAs, PIC-operated SDAs did notseem to enroll greater or lesser proportions of more disadvantaged peoplethan of less disadvantaged people. High use of fixed unit price contracts didnot seem to be correlated with the enrollment of greater proportions of lessdisadvantaged than more disadvantaged people. Finally, unemployment ratesdid not seem to be related to recommended service strategies or thedistribution of actual services received.
The remainder of this chapter discusses these and other findings in more detail.
H. Variation in Service Strategy Recommendations. Population Served,and Services Received
As noted in Chapter 1, within broad statutory requirements such as program eligibility,
the JTPA statute explicitly gives authority to SDAs to determine the population served and the
services provided.7 The legislation anticipated that different local conditions and decisions
would lead to the recommendation and provision of different services across the country to
different types of individuals. Not unexpectedly, there was substantial variation across the 16SDAs in these areas.
A. Service Strategy Recommendations
As noted in Chapter 3, SDA staff developed service recommendations for JTPA
applicants based on a combination of several factors, including an employability assessment, the
client's interests and preferences, the availability and eligibility of appropriate service providers
in the community, and the perceived likelihood that the client would be accepted by the
service provider. The recommendations that resulted from these factors reflect the emphasis
and priorities SDAs gave to the various service strategies.
Table 7.1 presents the percentage distributions of service strategy recommendations
among adult and youth treatment group members. In an effort to highlight the variation
among the sites, the table ranks the SDAs by their degree of emphasis on the OJT /SSA service
strategy. The left panel of Table 7.1 shows that five SDAs recommended OJT/JSA for more
7See section 121(b)(1) of JTPA.
132
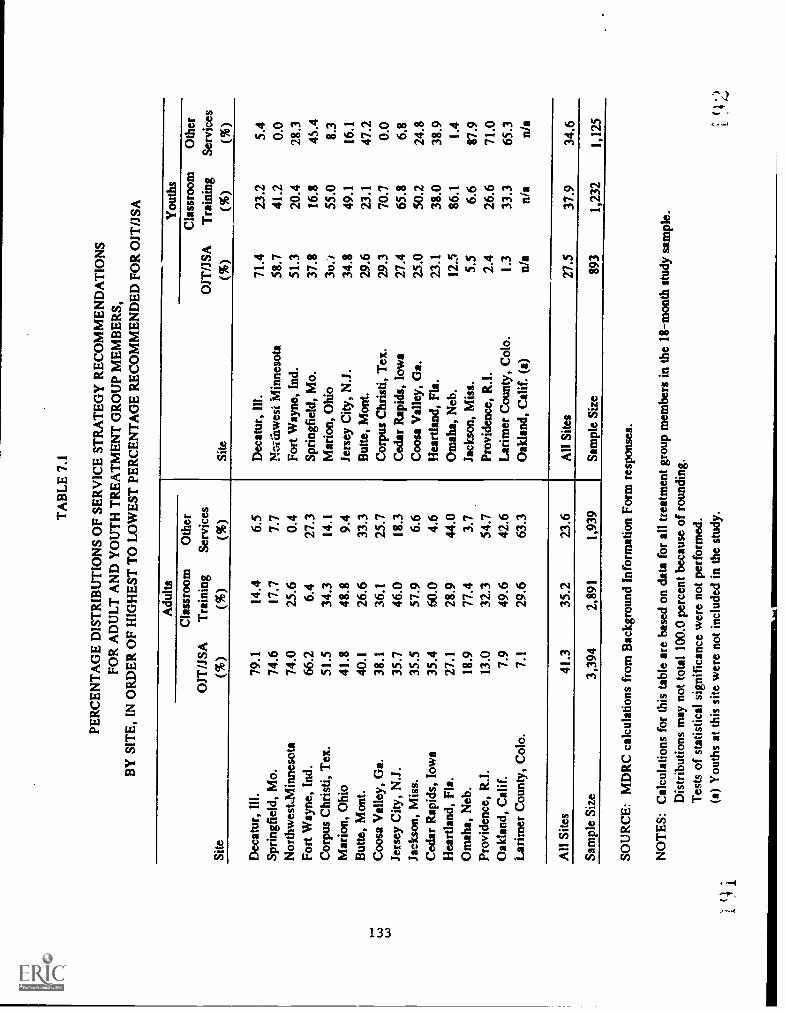
TA
BL
E 7
.1
PER
CE
NT
AG
E D
IST
RIB
UT
ION
S O
F SE
RV
ICE
ST
RA
TE
GY
RE
CO
MM
EN
DA
TIO
NS
FOR
AD
UL
T A
ND
YO
UT
H T
RE
AT
ME
NT
GR
OU
PM
EM
BE
RS,
BY
SIT
E, I
N O
RD
ER
OF
HIG
HE
ST T
O L
OW
EST
PE
RC
EN
TA
GE
RE
CO
MM
EN
DE
D F
OR
OJT
/JSA
Adu
ltsY
outh
s
OJT
/JSA
Cla
ssro
om
Tra
inin
g
Oth
erSe
rvic
esO
JT/J
SAC
lass
room
Tra
inin
g
Oth
erSe
rvic
esSi
te(%
)(%
)(%
)Si
te(%
)(%
)(%
)
Dec
atur
, Ill.
79.1
14.4
6.5
Dec
atur
, III
.71
.423
.25.
4Sp
ring
fiel
d, M
o.74
.617
.77.
7.M
Qvi
hwes
t Min
neso
ta58
.741
.20.
0N
orth
wes
t.Min
neso
ta74
.025
.60.
4Fo
rt W
ayne
, Ind
.51
.320
.428
.3Fo
rt W
ayne
, Ind
.66
.26.
427
.3Sp
ring
fiel
d, M
o.37
.816
.845
.4C
orpu
s C
hris
ti, T
ex.
51.5
34.3
14.1
Mar
ion,
Ohi
o30
.-,
55.0
8.3
Mar
ion,
Ohi
o41
.848
.89.
4Je
rsey
City
, N.J
.34
.849
.116
.1B
utte
, Mon
t.40
.126
.633
.3B
utte
, Mon
t.29
.623
.147
.2)-
-.t..
..) t...)
Coo
sa V
alle
y, G
a.
Jers
ey C
ity, N
.J.
38.1
35.7
36.1
46.0
25.7
18.3
Cor
pus
Chr
isti,
Tex
.C
edar
Rap
ids,
Iow
a29
.327
.470
.765
.80.
06.
8Ja
ckso
n, M
iss.
35.5
57.9
6.6
Coo
sa V
alle
y, G
a.25
.050
.224
.8C
edar
Rap
ids,
Iow
a35
.460
.04.
6H
eart
land
, Fla
.23
.138
.038
.9H
eart
land
, Fla
.27
.128
.944
.0O
mah
a, N
eb.
12.5
86.1
1.4
Om
aha,
Neb
.18
.977
.43.
7Ja
ckso
n, M
iss.
5.5
6.6
87.9
Prov
iden
ce, R
.I.
13.0
32.3
54.7
Prov
iden
ce, R
.I.
2.4
26.6
71.0
Oak
land
, Cal
if.
7.9
49.6
42.6
Lar
imer
Cou
nty,
Col
o.1.
333
.365
.3L
arim
er C
ount
y, C
olo.
7.1
29.6
63.3
Oak
land
, Cal
if. (
a)n/
ani
an/
a
All
Site
s41
.335
.223
.6A
ll Si
tes
27.5
37.9
34.6
Sam
ple
Size
3,39
42,
891
1,93
9Sa
mpl
e Si
ze89
31,
232
1,12
5
i
SOU
RC
E: M
DR
C c
alcu
latio
ns f
rom
Bac
kgro
und
Info
rmat
ion
Form
resp
onse
s.
NO
TE
S: C
alcu
latio
ns f
or th
is ta
ble
are
base
d on
dat
a fo
r al
l tre
atm
ent
grou
p m
embe
rs in
the
18 -
mon
th s
tudy
sam
ple.
Dis
trib
utio
ns m
ay n
ot to
tal 1
00.0
per
cent
bec
ause
of
roun
ding
.T
ests
of
stat
istic
al s
igni
fica
nce
wer
e no
t per
form
ed.
(a)
You
ths
at th
is s
ite w
ere
not i
nclu
ded
in th
e st
udy.

than half of the adults in the treatment group (Decatur, Springfield, Northwest Minnesota,Fort Wayne, and Corpus Christi), three SDAs recommended classroom training for more thanhalf of the adults in the treatment group (Omaha, Cedar Rapids, and Jackson), and two SDAsrecommended the other services strategy for more than half of the adults in the treatmentgroup (Larimer and Providence). The right panel of Table 7.1 shows that there is someoverlap among SDAs that emphasized the same service strategies for both adults and youths.For example, Decatur, Northwest Minnesota, and Fort Wayne also emphasized OJT/JSA foryouths; Cedar Rapids and Omaha also emphasized classroom training for youths; and Larimerand Providence also emphasized other services for youths.
Finally, three SDAs appear to have operated distinctly different programs for adults andyouths. Jackson emphasized classroom training for adults but placed a heavy emphasis onother services for youths. Corpus Christi emphasized OJT/JSA and, to a lesser extent,classroom training for adults, while placing heavy emphasis on classroom training for youths.Springfield placed a very heavy emphasis on OJT/JSA and very little emphasis on other servicesfor adults, but was much more likely to recommend other services and much less likely torecommend classroom training for youths.
B. Population Served
'TPA was designed to provide job training for economically disadvantaged individuals andothers facing serious barriers to employment. However, because access to JTPA is notguaranteed to all who satisfy the eligibility rules, the characteristics of the population enrolledin JTPA is a function of a variety of factors, including the characteristics of the eligiblepopulation in the SDA, the targeting and intensity of recruitment, and the types of servicesavailable to and desired by the eligible population. In addition, SDA staff and serviceproviders, as well as the clients themselves, can exercise discretion over whether clients enrollafter having applied and having been recommended for services. Given the variability in thesefactors across the country, it is reasonable to expect great variation across SDAs in thecharacteristics of JTPA enrollees. However, it is impossible to attribute the variation to anyone of these factors.
A full analysis of the differences across SDAs in the extent to which they served moreor less disadvantaged clients would at least require information on the enrollment rates for theelik,:ble populations in each SDA, but these data were not collected as part of the
134

implementation study. For example, it is not possible to determine the degree to which
differences in the pool of those recommended for services reflect other factors: differing
characteristics of the eligible populations across the 16 SDAs, variations in the level of
recruitment activities undertaken by SDAs (e.g., "passive" recruitment vs. aggressive efforts to
identify and attract more disadvantaged individuals), or differences in the pre-random-
assignment selection and "matching" process used by SDAs and clients. In the absence of this
information, the analysis must rely on comparisons that can be made using available data from
later stages in the selection and enrollment process, which means' that any findings are, at most,
suggestive and not definitive. The present discussion examines variation across SDAs in the
extent to which they formally enrolled more or less disadvantaged treatment group members
as defined by the three key employment barriers used earlier in this report.
Tables 7.2 and 7.3 present the percentage of adults and youths, respectively, in of
the three employment barrier :subgroups defined in Chapters 2-6: those with two or three of
the employment barriers and those with none of the employment barriers. In examining the
percentage of adults with two or three employment barriers, it appear, that some SDAs
targeted larger proportions of more disadvantaged clients than did other SDAs. For example,
Table 7.2 indicates that 12 percent of the adults in Larimer's treatment group had two or more
employment barriers compared to 47 percent in Marion. Among youths, the variation was
aintost as wide: 21 percent of Larimer's youth treatment group members had two or more
employment barriers compared to 52 percent of those in Jackson. Again, however, it is not
clear whether this was due to the characteristics of the eligible population, to the SDAs'
recruitment activities, or to the decisions of service providers, SDA staff, or the clients
themselves.
Tables 7.2 and 7.3 also highlight the great variation in the enrollment rates for treatment
group members in the employment barrier subgroups. At first glance, it appears that some
SDAs were more successful than others in targeting the more disadvantaged for enrollment.
For example, Table 7.2 shows that Northwest Minnesota enrolled 24 percent of the adult
treatment group members with two or three employment barriers compared with an enrollment
rate of 91 percent for the same group in Larimer. Table 7.3 shows similar variation in
enrollment rates among youths with multiple employment barriers. However, these differences
do not take into account the fact that some SDAs with low enrollment rates among the most
135
q 4

TA
BL
E 7
.2
PER
CE
NT
AG
E O
F A
DU
LT
TR
EA
TM
EN
TG
RO
UP
ME
MB
ER
SIN
EM
PLO
YM
EN
T B
AR
RIE
RSU
BG
RO
UPS
AN
D T
HE
IR E
NR
OL
LM
EN
TR
AT
ES,
BY
SIT
E, I
N O
RD
ER
OF
HIG
HE
STT
O L
OW
EST
EN
RO
LL
ME
NT
RA
TE
DIF
FER
EN
CE
Sam
ple
2 or
3 E
mpl
oym
ent B
arri
ers
(a)
No
Em
ploy
men
t Bar
rier
s (a
)
Enr
ollm
ent
Rat
e
Tre
atm
ent G
roup
Mem
bers
Enr
ollm
ent
Rat
eT
reat
men
t Gro
upM
embe
rsE
nrol
lmen
tR
ate
Site
Size
(%)
(%)
(%)
(%)
Dif
fere
nce
Om
aha,
Neb
.49
133
.056
.829
.140
.616
.2L
arim
er C
ount
y, C
olo.
367
12.3
91.1
50.1
85.3
5.8
Prov
iden
ce, R
.I.
513
41.3
69.8
22.0
65.5
4.3
Mar
ion,
Ohi
o60
947
.071
.023
.366
.94.
1H
eart
land
, Fla
.28
524
.236
.230
.532
.24.
0I- t..
)aN
Jack
son,
Mis
s.C
oosa
Val
ley,
Ga.
542
794
20.8
26.4
77.9
64.8
40.8
33.0
74.2
64.1
3.7
0.7
Cor
pus
Chr
isti,
Tex
.62
023
.968
.230
.670
.5-2
.3O
akla
nd, C
alif
.67
231
.464
.029
.367
.5-3
.5B
utte
, Mon
t.22
231
.184
.128
.8S9
.1-5
.0C
edar
Rap
ids,
Iow
a17
530
.373
.630
.379
.2-5
.6Sp
ring
fiel
d, M
o.54
813
.357
.549
.165
.4-7
.9Je
rsey
City
, N.J
.51
436
.039
.532
.148
.5-9
.0D
ecat
ur, I
II.
263
28.1
71.6
34.6
81.3
-9.7
Fort
Way
ne, I
nd.
1,28
816
.347
.643
.560
.5-1
2.9
Nor
thw
est M
inne
3012
255
34.9
23.6
29.8
64.5
-40.
9
All
Site
s8,
158
27.1
61.3
34.5
64.9
-3.6
(con
tinue
d)

TA
BLE
7.2
(co
ntin
ued)
SO
UR
CE
: MD
RC
cal
cula
tions
from
Bac
kgro
und
Info
rmat
ion
For
m r
espo
nses
and
from
pro
gram
enr
ollm
ent a
ndpa
rtic
ipat
ion
data
from
the
16 S
DA
s.
NO
TE
S: C
alcu
latio
ns fo
r th
is ta
ble
are
base
d on
dat
a fo
r al
l adu
lt tr
eatm
ent g
roup
mem
bers
in th
e 18
-mon
th s
tudy
sam
ple.
The
sub
grou
p w
ith o
nly
one
empl
oym
ent b
arrie
r is
not
incl
uded
in th
is ta
ble
in o
rder
to m
ore
clea
rly il
lust
rate
the
diffe
renc
e be
twee
n su
bgro
ups
at e
ither
ext
rem
e of
the
empl
oym
ent b
arrie
r sp
ectr
um. C
onse
quen
tly, t
he p
erce
ntag
eof
trea
tmen
t gro
up m
embe
rs a
t eac
h si
te w
ill n
ot to
te! 1
00.0
per
cent
.T
ests
of s
tatis
tical
sig
nific
ance
wer
e no
t per
form
ed.
(a)
The
bar
riers
to e
mpl
oym
ent i
nclu
de: n
ot h
avin
g a
high
sch
ool d
iplo
ma
or G
ED
at t
he ti
me
of r
ando
mas
sign
men
t; ha
ving
wor
ked
few
er th
an 1
3 w
eeks
dur
ing
the
12 m
onth
s pr
ior
to r
ando
m a
ssig
nmen
t; an
d re
ceiv
ing
AF
DC
or
othe
r ca
sh a
ssis
tanc
e at
the
time
of r
ando
m a
ssig
nmen
t.
x'1

TA
BL
E 7
.3
PER
CE
NT
AG
E O
F Y
OU
TH
TR
EA
TM
EN
T G
RO
UP
ME
MB
ER
SIN
EM
PLO
YM
EN
T B
AR
RIE
RSU
BG
RO
UPS
AN
D T
HE
IRE
NR
OL
LM
EN
T R
AT
ES,
BY
SIT
E, I
N O
RD
ER
OF
HIG
HE
ST T
O L
OW
EST
EN
RO
LL
ME
NT
RA
TE
DIF
FER
EN
CE
Sam
ple
2 or
3 E
mpl
oym
ent B
athe
rs(a
)N
o E
mpl
oym
ent B
athe
rs(a
)E
nrol
lmen
tR
ate
Tre
atm
ent G
roup
Mem
bers
Enr
ollm
ent
Rat
eT
reat
men
t Gro
upM
embe
rsE
nrol
lmen
tR
ate
Site
Size
(%)
(%)
(%)
(%)
Dif
fere
nce
Jack
son,
Mis
s.37
752
.075
.014
.914
.360
.7O
mah
a, N
eb.
144
40.3
41.4
24.3
28.6
12.8
Mar
ion,
Ohi
o10
937
.675
.624
.863
.012
.6Fo
rt W
ayne
, Ind
.45
224
.369
.133
.061
.18.
0Sp
ring
fiel
d, M
o.26
234
.077
.533
.273
.63.
9H
eart
land
, Fla
.10
727
.144
.837
.442
.52.
3- t..
.)co
Lar
imer
Cou
nty,
Col
o.B
utte
, Mon
t.75 10
821
.338
.987
.578
.642
.732
.487
.580
.00.
0-1
.4C
orpu
s C
hris
ti, T
ex.
386
39.6
83.7
19.2
85.1
-1.4
Jers
ey C
ity, N
.J.
267
41.9
55.4
19.5
57.7
-2.3
Prov
iden
ce, R
.I.
333
45.0
76.0
13.8
78.3
-2.3
Ced
ar R
apid
s, I
owa
7323
.370
.638
.475
.0-4
.4D
ecat
ur, I
ll.56
39.3
63.6
28.6
68.7
-5.1
Coo
sa V
alle
y, G
a.41
339
.064
.618
.671
.4-6
.8N
orth
wes
t Min
neso
ta80
23.8
21.1
40.0
62.5
-41.
4O
akla
nd, C
alif
. (b)
n/a
n/a
n/a
n/a
n/a
n/a
All
Site
s3,
242
37.5
69.5
24.2
63.5
6.0
SOU
RC
E: M
DR
C c
alcu
latio
ns f
rom
Bac
kgro
und
Info
rmat
ion
Form
resp
onse
s an
d fr
om p
rogr
am e
nrol
lmen
t and
part
icip
atio
nda
ta f
rom
the
16 S
DA
s.
NO
TE
S: C
alcu
latio
ns f
or th
is ta
ble
are
base
d on
dat
a fo
r al
l you
th tr
eatm
ent gr
oup
mem
bers
in th
e 18
-mon
th s
tudy
sam
ple.
Exc
ept f
or th
e fo
llow
ing,
see
Tab
le 7
.2 f
or th
e re
mai
nder
of th
e no
tes.
(b)
You
ths
at th
is s
ite w
ere
not i
nclu
ded
in th
est
udy.

disadvantaged also had low enrollment rates among the least disadvantaged. Similariy, some
SDAs had high enrollment rates among both groups. Similar enrollment rates among both
groups suggests that there was no c'ear enrollment targeting for the more disadvantaged in
these SDAs.
An alternative approach provides an opportunity to examine the extent to whichenrollment rates differed among more and less disadvantaged treatment group members in the
same SDA. This approach compares the enrollment rate for more disadvantaged individuals
(those with two or three employment barriers) with the enrollment rate for less disadvantaged
individuals (those with no employment barriers). Tables 7.2 and 7.3 rank the SDAs by thesedifferences, which are displayed in the last column of each table. A positive difference means
that the SDA enrolled a greater proportion of its more disadvantaged treatment group poolthan of its less disadvantaged treatment group pooL A negative difference means the reverse.
It is useful to "walk through" an example. Table 7.2 shows that Omaha enrolled 56.8
percent of the adult treatment group members who had two or three employment barriers and
40.6 percent of those who had no employment barriers. Hence, the difference is 16.2percentage points (56.8 minus 40.6), indicating that Omaha enrolled a larger proportion of
more disadvantaged adults (from its recommended pool) than less disadvantaged adults. The
corresponding difference for Northwest Minnesota is -40.9 percentage points, indicating that
it enrolled a larger proportion of less disadvantaged adults (from its recommended pool) than
more disadvantaged adults. It is also interesting to note that Omaha and Northwest Minnesota
had similar proportions of disadvantaged adults with multiple employment barriers in theirrecommended pools (33.0 percent compared with 34.9 percent, respectively).
This approach takes into account differences across SDAs in the distribution of treatment
group members among the employment barrier subgroups. It also takes into account the fact
that some SDAs had high enrollment rates for all groups, while others had high enrollment
rates for some groups and low enrollment rates for others. Note that this approach still cannot
take into account the recruitment or screening process that took place before applicantsbecame part of the recommended pool.
An examination of the last column in Tables 7.2 and 7.3 reveals several points:
There was great variation across sites in the difference in enrollment ratesfor those with multiple employment barriers and those with none. (Thisvariation is greater than the sizable cross-site variation in the proportion of
2 f)
139

treatment group members with multiple bakriers, which is shown in column2 of Tables 7.2 and 7.3.) For example, in Jackson, the enrollment rate foryouths with two or three employment barriers was 61 percentage pointshigher than it was for youths with none of the barriers, whereas in NorthwestMinnesota, the rate for youths with two or three barriers was 41 percentagepoints less than it was for youths with none.
Omaha enrolled substantially greater proportions of adults with multipleemployment barriers (compared with the rate for those with none) fromamong the pool of those recommended for services. Among youths, thiswas true of Jackson, Omaha, and Marion.
Three SDAs enrolled substantially larger proportions of adults with none ofthe employment barriers (compared with those with multiple barriers) fromamong the pool of those they recommended for services: NorthwestMinnesota, Springfield, and Fort Wayne. Among youths, this was the caseonly in Northwest Minnesota.
The differences in enrollment rates between the two employment barriersubgroups do not appear to have been as.sticiated with the proportion oftreatment group members with multiple employment barriers. For example,Northwest Minnesota and Omaha had approximately the same percentage ofadults with two or three barriers. However, Omaha enrolled a much largerproportion of those with multiple barriers than it did those with no barriers.The patterns for Northwest Minnesota ran in the opposite direction. Also,SDAs with similar enrollment rate differences among the employment barriersubgroups had very different proportions of adults or youths in those groups.
Comparing the rankings in Tables 7.2 and 7.3 suggests that most SDAs had roughlysimilar enrollment rate differences among youths and adults in the same employment barriersubgroups. However, three SDAs stand out as having had distinct enrollment rate differencesfor adults and youths in the same employment barrier subgroups. In Fort Wayne andSpringfield, adults with multiple employment barriers were less likely to enroll than adults withno employment barriers, while the opposite was true for youths. In Jackson, adults from bothemployment barrier subgroups had roughly the same enrollment rates, while youths withmultiple employment barriers were much more likely to enroll than were those with nobarriers.
140

C. Services Received
Table 7.4 presents the service receipt rates for adults and youths who were enrolled inJTPA during the follow-up period. (Following the presentations in Chapters 5 and 6, theservice categories in this table are mutually exclusive.) In order to highlight the wide variation
in service emphasis, the SDAs are ranked by the percentage of enrollees who received OJT.
Once again, the variation in service emphasis is quite substantiaL There are a number offindings of interest:
Two SDAs placed a clear emphasis on OJTs for both adults and youths: inboth Cedar Rapids and Northwest Minnesota, more than half of both theadult and the youth enrollees received OJTs. In four SDAs Omaha,Jackson, Jersey City, and Oakland more than half of the adult enrolleesreceived classroom training, while in only Corpus Christi and Omaha didmore than half of the youth enrollees receive classroom training. InProvidence and Larimer, more than half of the adults and youths receivedmiscellaneous non-training services.
There was wide variation in the receipt of job search assistance as a singleservice (ranging from 0 percent to 47 percent for adults and from 0 percentto 37 percent for youths).
For four SDAs, basic education was not provided, at least as a discreteservice, for either adult or youth enriiees. However, as many as 47 percentof the adult enrollees in Marion and 80 percent of the youth enrollees inJackson received basic education without training.
Most SDAs emphasized similar services for adults and youths, but threeSDAs stand out in emphasizing different services for each group. In Jackson,more than 7 of 10 adult enrollees received classroom training, while 8 of 10youth enrollees received basic education without training. In Corpus Christi,69 percent of the youths received classroom training compared to 35 percentof the adults, while 25 percent of the adults received basic education withouttraining compared to 9 percent of the youths. In Heartland, 36 percent ofthe youth enrollees received miscellaneous non-training services, and only 29percent received classroom training. In contrast, only 8 percent of the adultenrollees in Heartland received miscellaneous non-training services, while 44percent received classroom training.
A comparison of Tables 7.1 and 7.4 indicates that, with the exception of two SDAs,servo emphasis, as reflected in recommended service strategies, was roughly similar to service
emphasis reflected in actual services received. For example, Decatur, Springfield, Northwest
141
2f 3

TA
BL
E 7
.4
SER
VIC
E R
EC
EIP
T R
AT
ES
FOR
AD
UL
T A
ND
YO
UT
H E
NR
OL
LE
ES,
BY
SIT
E, I
N O
RD
ER
OF
HIG
HE
STT
O L
OW
EST
PE
RC
EN
TA
GE
RE
CE
IVIN
GO
JT
Adu
ltsY
outh
s
OJT
(a)
ISA
Onl
yN
on-T
r.C
T-O
S (b
)E
d. (
c)
Mis
c.N
on-T
r.Se
rv. (
d)O
JT (
a)JS
A
Onl
yN
on-T
r.C
T-O
S (b
) E
d. (
c)
Mis
c.N
on-T
r.Se
rv. (
d)Si
te(%
)(%
)(%
)(%
)(%
)Si
te(%
)(%
)(%
)(%
)(%
)C
edar
Rap
ids,
Iow
a54
.10.
020
.711
.913
.3N
orth
wes
t Min
neso
ta65
.82.
631
.60.
00.
0N
orth
wes
t Min
neso
ta50
.52.
829
.00.
017
.8C
edar
Rap
ids,
Iow
a57
.10.
018
.414
.310
.2C
oosa
Val
ley,
Ga.
35.3
1.0
46.0
1.0
16.7
Fort
Way
ne, I
nd.
29.0
36.7
30.4
0.0
3.9
Dec
atur
, III
.35
.125
.213
.43.
023
.3C
oosa
Val
ley,
Ga.
20.5
10.4
41.7
9.4
18.0
Fort
Way
ne, I
nd.
34.6
47.4
16.5
0.0
1.5
Spri
ngfi
eld,
Mo.
19.6
9.0
17.6
41.2
12.6
Spri
ngfi
eld,
Mo.
32.2
40.6
24.1
0.6
2.6
Cor
pus
Chr
isti,
Tex
.16
.75.
268
.59.
00.
6B
utte
, Mon
t.23
.20.
037
.119
.120
.6B
utte
, Mon
t.16
.10.
032
.235
.616
.1Ja
ckso
n, M
iss.
20.7
2.6
72.8
0.0
4.0
Dec
atur
, III
.15
.010
.020
.07.
547
.5H
eart
land
, Fla
.17
.629
.444
.11.
07.
8H
eart
land
, Fla
.8.
926
.728
.90.
035
.6C
orpu
s C
hris
ti, T
ex.
15.4
24.3
35.1
24.9
0.2
Jers
ey C
ity, N
.8.
726
.848
.68.
08.
0O
mah
a, N
. b.
10.6
0.0
75.2
0.0
14.2
Om
aha,
Neb
.7.
01.
868
.40.
022
.8Je
rsey
City
. N.J
.8.
627
.759
.13.
60.
9Pr
ovid
ence
, R.I
.1.
60.
033
.30.
065
.1M
ario
n, O
hio
6.9
17.9
17.7
47.4
10.0
Jack
son,
Mis
s.1.
40.
017
.179
.71.
8Pr
ovid
ence
, II.
6.6
0.0
31.2
0.0
62.2
Lar
imer
Cou
nty,
Col
o.0.
03.
024
.213
.659
.1O
akla
nd, C
alif
.4.
136
.758
.50.
00.
7M
ario
n, O
hio
0.0
12.2
12.2
39.2
36.5
Lar
imer
Cou
nty,
Col
o.3.
74.
333
.57.
550
.9O
akla
nd, C
alif
. (e)
n/a
n/a
n/a
n/a
n/a
All
Site
s20
.819
.238
.07.
914
.0A
ll Si
tes
15.5
10.9
36.4
18.6
18.6
Sam
ple
Size
1,07
799
51,
964
407
726
Sam
ple
Size
332
234
781
400
403
(con
tinue
d)

TA
BL
E 7
.4 (
cont
inue
d)
SOU
RC
E: M
DR
C c
alcu
latio
ns f
rom
pro
gram
enr
ollm
ent a
nd p
artic
ipat
ion
data
fro
m th
e 16
SD
As.
NO
TE
S: C
alcu
latio
ns f
or th
is ta
ble
are
base
d on
dat
a fo
r al
l enr
olle
es in
the
18-m
onth
stu
dy s
ampl
e.T
he p
rogr
am s
ervi
ce c
ateg
orie
s in
this
tabl
e ar
e m
utua
lly e
xclu
sive
; see
not
es a
, b, c
, and
d b
elow
.T
ests
of
stat
istic
al s
igni
fica
nce
wer
e no
t per
form
ed.
(a)
The
OJT
ser
vice
cat
egor
y in
clud
es e
nrol
lees
who
rec
eive
d O
JT o
nly,
or
OJT
in c
ombi
natio
n w
ith b
asic
edu
catio
n, jo
b se
arch
ass
ista
nce,
or m
isce
llane
ous
prog
ram
ser
vice
s.(b
) T
he C
T-O
S se
rvic
e ca
tego
ry in
clud
es e
nrol
lees
who
rec
eive
d C
T-O
S on
ly, o
r C
T-O
S in
com
bina
tion
with
OJT
, bas
ic e
duca
tion,
job
sear
chas
sist
ance
, or
mis
cella
neou
s pr
ogra
m s
ervi
ces.
(c)
The
non
-tra
inin
g ed
ucat
ion
serv
ice
cate
gory
incl
udes
enr
olle
es w
ho r
ecei
ved
basi
c ed
ucat
ion
only
, or
basi
c ed
ucat
ion
in c
ombi
natio
n w
ith jo
bse
arch
ass
ista
nce
or m
isce
llane
ous
prog
ram
ser
vice
s.(d
) T
he m
isce
llane
ous
non-
trai
ning
ser
vice
s ca
tego
ry in
clud
es e
nrol
lees
who
rec
eive
d m
isce
llane
ous
prog
ram
ser
vice
s on
ly, o
r m
isce
llane
ous
prog
ram
ser
vice
s in
com
bina
tion
with
job
sear
ch a
ssis
tanc
e. M
isce
llane
ous
prog
ram
ser
vice
s in
clud
e su
ch a
ctiv
ities
as
asse
ssm
ent,
job-
read
ines
s pr
epar
atio
n, v
ocat
iona
l exp
lora
tion,
job
shad
owin
g, a
nd tr
yout
em
ploy
men
t. In
this
tabl
e, m
isce
llane
ous
prog
ram
ser
vice
s al
soin
clud
e w
ork
expe
rien
ce, w
hich
is id
entif
ied
as a
sep
arat
e pr
ogra
m s
ervi
ce in
oth
er r
epor
ts o
n th
e N
atio
nal J
TPA
Stu
dy.
(e)
You
ths
at th
is s
ite w
ere
not i
nclu
ded
in th
e st
udy.

Minnesota, and Fort Wayne recommended the OJT/JSA strategy for well over half of theadults, and more than half of the adult enrollees in these SDAs received either OJT or JSA.8
111. The Relationship Between SDA Characteristics and Service Emphasis andPopulation Served
Section II described the variations among the 16 SDAs in the types of services for whichclients were recommended, the population that was ultimately enrolled, and the types ofservices enrollees received. Section III addresses the question of whether these variationsappear to have been associated with the variations in ;elected SDA characteristics that werepresented in Chapter 2.9 As noted earlier, this discussion will examine a number of"hypotheses" about these relationships.
A. The Relationships Among SDA Characteristics
Before moving on to the analysis of these relationships, it should be noted that theredo not appear to be clear or consistent relationships among the SDA characteristics examinedhere. Following is a brief summary of findings from the analysis of relationships among the'TPA program management and organizational characteristics described earlier: the nature ofthe local partnership; the extent to which the SDAs used fixed unit price, performance-basedvendor contracts; and the level of performance on entered employment rate standards foradults and youths and positive termination rate for youths.
1. SDA organizational structure (nature of the local partnership) and type of vendorcontracts. One hypothesis is that PIC-operated SDAs would tend to use fixed unit price,performance-based contracts extensively, on the grounds that the private sector is moreoriented toward "bottom-line" results. (Such contracts withhold full payment for services untila specified outcome is achieved.) In fact, during the development of the JTPA legislation,
9The distribution of recommended and actual services was quite different for adults and youthsin Cedar Rapids and for youths in Decatur. In Cedar Rapids, a high percentage of adults and youthswere recommended for the classroom training service strategy, but more than half of the adults andyouths who enrolled actually received 031'. In Decatur, 71 percent of the youths were recommendedfor OJT/JSA, and 5 percent were recommended for the other services strategy, but only 25 percent ofenrollees received either 037' or JSA, and 48 percent received miscellaneous non-training services. Itwas not possible to identify a plausible explanation for the difference between recommended and actualservices based on site observations during the study period.
9The reader is again reminded of the cautions that appear at the beginning of this chapter.
144
2 S

fixed unit price contracts were often referred to as the major way the private sector purchases
services. The corollary hypothesis is that government-operated SDAs would make little or no
use of fixed unit price contracts and more use of cost-reimbursement contracts, which assure
full payment regardless of outcome.
Comparing Table 2.3 with Table 2.6 provides little support for these hypotheses. It is
true that, of the six government-operated SDAs (see Table 2.3), four made little or no useof fixed unit price contracts (see Table 2.6): Butte, Cedar Rapids, Decatur, and Springfield.
The other two, Heartland and Omaha, made only moderate use of them. But no patternemerges with the PIC-operated SDAs. Of the three in that category (see Table 2.3), two made
little or no use of fixed unit price contracts, and one made high use. Of the three SDAs that
had the highest use of fixed unit price contracts for both adults and youths Coosa Valley,
Northwest Minnesota, and Jackson two were jointly operated by the PIC and government,
and one (Northwest Minnesota) was PIC-operated.
2. Type of vendor contracts and SDA performance. As noted above, full payment
under fixed unit price contracts is withheld until certain performance measures are met i.e.,
for adults, placement in a job at a certain wage rate for a specific period of time, and foryouths, these or other positive termination outcomes, such as completion of a GED. Oneobvious hypothesis is that. SDAs that use fixed unit price contracts achieve higher rates ofadjusted performance as defined by the degree to which they exceeded their adjusted
entered employment rates (for adults) and entered employment and positive termination rates
(for youths) than do SDAS that use cost-reimbursement contracts.1°
There is little evidence to support this hypothesis for either adults or youths. Of thethree SDAs that made the highest use of fixed unit price contracts for adult training programs
(see Table 2.6), two substantially exceeded their standards and one marginally exceeded its
standards. But of the eight SDAs that made little or no use of fixed unit price contracts for
adults, three substantially exceeded and two moderately exceeded their standards. Similarly, for
youths, among the five SDAS that made the greatest use of fixed unit price contracts, two
substantially exceeded and two marginally exceeded their entered employment rate standards;
wHere and later in this chapter, SDAs are broken out into three groups: SDAs that substantiallyexceeded the performance standard (by 15 percent or more), those that moderately exceeded thestandard (by 10 to 14.9 percent), and those that did not meet the standard or marginally exceeded it(by less than 10 percent).
145
2r19

a similar story presents itself for youth positive termination rates.
Hence, these 16 SDAs do not provide justification for the view that u of fixed unitprice contracts is associated with higher performance than use of cost-reimbursement contracts.
3. SPAAmphalloolAnslatf the local partnership) and SDAperformance. Mother hypothesis is that, owing to the stronger private sector role in programsrun by PICs, performance will be better in those programs than in government-operatedprograms. A comparison of each SDA's administrative arrangement and performance levelsshows no support for this hypothesis. Of the two SDAs in the study that substantiallyexceeded all three performance measures analyzed adult entered employment rate, youthentered employment rate, and youth positive termination rate one (Jackson) had a sharedPlC/government- operated structure and the other (Springfield) was government-operated.Further, among the three PIC-operated SDAs shown in Table 2.3, there is no consistentpattern in their degree of performance: for adults, one substantially exceeded its performancestandards, and two marginally exceeded their performance standards. Foryouths, all three PIC-operated SDAs marginally exceeded the youth performance standards. Therefore, these 16SDAs do not appear to provide support for this hypothesis.
B. SDA Characteristics and Service Emphasis
This discussion focuses on three SDA characteristics the unemployment rate (see Table2.2), the extent to which SDAs exceeded their performance standards, and the nature of thelocal partnership (see Table 2.3) and their possible relationship to the emphasis SDAsplaced on service strategy recommendations (see Table 7.1) and service receipt (see Table 7.4).Although other SDA characteristics were examined, these three are presented for discussionbecause they are particularly compelling conceptually and, in the case of SDA performance andorganizational structure, because there appears to be suggestive evidence that they are relatedto an SDA's service emphasis, at least in the 16 study sites.11
1. The unemployment rate and service emphasis. It is often assumed that the level
ilTwo other SDA characteristics that may be associated with service emphasis were also examined:urban/rural distinctions (see Table 2.2) and the extent to which SDAs used fixed unit price,performance-based vendor contracts (see Table 2.6). Neither of these characteristics appears to havebeen associated with either service strategy recommendations or service receipt patterns in the 16 SDAsin the study.
146
1

of unemployment in an SDA is a major determinant of the types of services clients demand
and SDAs are likely to provide. One hypothesis is that more classroom skills training would
be offered in areas with a higher unemployment rate, because immediate employment
opportunities, often seen as a prerequisite for OJT and job search assistance, aremore limited.
JTPA applicants may also prefer classroom training as a means to retool the skills they used
in previous jobs so that they can enter new occupations.
Interestingly, the unemployment rate in an SDA does not seem to have been consistently
related to emphasis on a particular service strategy recommendation or to the distribution of
actual services received among the 16 study sites. The three sites with the lowestunemployment rates (see Table 2.2) Cedar Rapids, Omaha, and Providence ;- recommended
(Table 7.1) and provided (Table 7.4) very different mixes of OJT, classroom training, and other
services for both adults and youths. Similarly, no consistent pattern can be seen in the service
strategies of the SDAs with the highest unemployment rates Corpus Christi, Decatur, and
Heartland.
2. alkLperformance and service emphasis. One widely held view in the JTPA
system is that higher levels of performance among SDAs as defined by the degree to which
they exceeded their adjusted entered employment rates (for adults) and entered employment
and positive termination rates (for youths) are associated with an emphasis on specific direct
employment strategies (i.e., OJT or job search assistance rather than classroom training). The
reasoning suggests that, in SDAs that strive to exceed performance standards, particularly since
many of the performance standards (especially for adults) are tied closely to labor market
outcomes, JTPA applicants may be encouraged to use services that get them attached to the
labor market as soon as possible. It is also possible that the greater focus on positive
terminations for youths (including completion of schooling or attainment of employment
competencies) may encourage SDAs to recommend more classroom training and basic
education for youths.
Tables 7.5 and 7.6 present information that permits a preliminary assessment, using
entered employment rate as the performance measure for both adults and youths in Table 7.5
and positive termination rate only for youths in Table 7.6. The percentages of adults and
youths recommended for each of the three service strategies are broken out for three groups
of SDAs: SDAs that substantially exceeded the performance standard (by 15 percent or more),
147

TABLE 7.5
PERCENTAGE DISTRIBUTIONS OF SERVICE STRATEGY RECOMMENDATIONSFOR ADULT AND YOUTH TREATMENT GROUP MEMBERS,
BY SITE ACHIEVEMENT OF THE JTPA PERFORMANCE STANDARDFOR ENTERED EMPLOYMENT
Site Achievement ofPerformance Standardand Service Strategy Recommendation
Adults(%)
Youths(%)
Sites that SubstantiallyExceeded the Standard (a)
Classroom Training 27.6 30.2OJT/JSA 52.6 27.4Other Services 19.8 42.4Total 100.0 100.0Sites that ModeratelyExceeded the Standard (b)
Classroom Training 28.1 50.1OJT/JSA 50.0 24.9Other Services 21.9 24.9Total 100.0 99.9Sites that MarginallyExceeded the Standard (c)
Classroom Training 47.3 61.2OJT/JSA 24.3 29.8Other Services 28.4 9.1Total 100.0 100.1
Difference MI
Classroom Training -19.7 -31.0OJT/JSA 28.3 -2.4Other Services -8.6 33.3
SOURCE: MDRC calculations from Background Information Form responses and from performancestandard and actual performance data from the 16 SDAs. See Appendix C for information about theperformance standard data.
NOTES: Calculations for this table are based on data for all treatment group members in the 18-monthstudy sample.
Distributions may not total 100.0 percent because of rounding.Tests of statistical significance were not performed.(a) This subgroup includes sites that exceeded the entered employment rate performance standard
by 15 percent or more.
(b) This subgroup includes sites that exceeded the entered employment rate performance standardby 10 to 14.9 percent.
(c) This subgroup includes sites that exceeded the entered employment rate performance standardby less than 10 percent. (Some sites included in this subgroup did not exceed the performance standard.)
(d) This is the recommendation rate difference between sites that substant;.:dly exceeded thestandard and those that marginally exceeded it.
148
2 1, _ ...

TABLE 7.6
PERCENTAGE DISTRIBUTIONS OF SERVICE STRATEGY RECOMMENDATIONSFOR YOUTH TREATMENT GROUP MEMBERS,
BY SITE ACHIEVEMENT OF THE JTPA PERFORMANCE STANDARDFOR YOUTH POSITIVE TERMINATIONS
Site Achievement ofPerformance Standard Youthsand Service Strategy Recommendation (%)
Sites that Substantially Exceeded the Standard (a)
Classroom Training 26.2OJT/JSA 21.1Other Services 52.7Total 100.0
Sites that Moderately Exceeded the Standard MI
Classroom Training 56.4OJT/JSA 31.3Other Services 12.4Total 100.1
Sites that Marginally Exceeded the Standard (c)
Classroom Training 36.7OJT/JSA 30.2Other Services 33.1Total 100.0
Difference MI
Classroom Training -10.5OJT/JSA -9.1Other Services 19.6
SOURCE: MDRC calculations from Background Information Form responses and fromperformance standard and actual performance data from the 16 SDAs. See Appendix C forinformation about the performance standard data.
NOTES: Calculations for this table are based on data for all youth treatment group membersin the 18-month study sample.
Distributions may not total 100.0 percent because of rounding.Tests of statistical significance were not performed.(a) This subgroup includes sites that exceeded the youth positive termination rate
performance standard by 15 percent or more.(b) This subgroup includes sites that exceeded the youth positive termination rate
performance standard by 10 to 14.9 percent.(c) This subgroup includes sites that exceeded the youth positive termination rate
performance standard by less than 10 percent. (Some sites included in this subgroup did notexceed the performance standard.)
(d) This is the recommendation rate difference between sites that substantiallyexceeded the standard and those that marginally exceeded it.
149 .2 1

SDAs that moderately exceeded the performance standard (by 10 to 14.9 percent), and SDAsthat did not meet the performance standard or that marginally exceeded it (by less than 10percent). The bottom panel of each table presents the difference in service emphasis betweenthe SDAs that substantially exceeded the standard and the SDAs that marginally exceeded thestandard; for example, a positive difference means that SDAs that substantially exceeded thestandard placed greater emphasis on the indicated activity compared to those that marginaryexceeded the standard. A negat ie difference would mean the opposite.
In general, it appears that, for adults, SDAs that substantiallyexceeded their performancestandards tended to emphasize the OJT/JSA service strategy when compared to SDAs thatmarginally exceeded their standards. The top panel of Table 7.5 shows that SDAs thatsubstantially exceeded their entered employment rate standard recommended the OJT/JSAservice strategy for adults much more frequently than either the classroom training or otherservices strategy. In fact, these SDAs recommended OJT/JSA more than twice as often foradults as SDAs that only marginally exceeded their entered employment rate performancestandards 52.6 percent vs. 243 percent, for a 23.3 percentage point difference, as shown inthe bottom panel of Table 7.5. The table also shows that, for both youths and adults, SDAsthat substantially exceeded their performance standard were much less likely to recommend theclassroom training service strategy than were SDAs that marginally exceeded their performancestandards (a -20 percentage point difference for adults and a -31 percentage point differencefor youths). Table 7.6 shows the same pattern of lower rates of classroom trainingrecommendations for youths among SDAs that substantially exceeded their positive terminationperformance standard (a -10.5 percentage point difference).
Interestingly, for youths, SDAs that substantially exceeded either their enteredemployment rate or their positive termination rate performance standards were much morelikely to have recommended the other services strategy than were SDAs that marginallyexceeded these performance standards (a 33 percentage point difference for enteredemployment rate and a 20 percentage point difference for positive termination rate). Since thisactivity category for youths consists largely of basic education and other classroom-basedactivities, the hypothesis that SDAs that substantially exceeded performanc standards woulduse less classroom training and more OJT/JSA does not have much support for youths in these16 SDAs although it does have substantial support for the adults.
150

3. SDA organizational structure (nature of the local partnership) and service,
emphasis. It is often suggested that one result of strong private sector involvement in JTPA
would be an emphasis on providing services, such as OJT, that offer the equivalent of a
training subsidy to business. (The opposite hypothesis that PIC-operated SDAs would favor
classroom training in order to have a higher-skilled work force has also been stated.) 1 able
7.7 presents information that may help answer this question. It displays the percentage of
adults and youths who were recommended for classroom training, OJT/JSA, and "other"services. These percentages are broken out for the three groups of SDAs presented in Table2.3: SDAs operated predominantly by a government entity, SDAs operated by a combination
of a government and the PIC, and SDAs operated predominantly by the PIC. The bottompanel presents the difference in service strategy recommendations between the government-
operated and PIC-operated SDAs; for example, a positive difference means that thegovernment-operated SDAs placed greater emphasis on the indicated service strategy compared
to PIC-operated SDAs. A negative difference would mean the opposite.
Table 7.7 indicates that, for both adults and youths, PIC-operated SDAs tended torecommend the OJT/JSA service strategy much more frequently than either the classroom
training or the other services strategy. Further, PIC-operated SDAs recommended OJT/JSA
more frequently than did the government-operated SDAs (as shown by the negative value in
the "OJT/JSA" row in the bottom panel for both adults and youths). Although government-
operated SDAs recommended OJT/JSA most frequently for adults, they recommended
classroom training for both adults and youths much more frequently than did PIC-operated
SDAs. Overall, therefore, there :s at best weak support for the hypothesis that strong private
sector involvement in JTPA is associated with greater use of OTT services.
C. SDA Characteristics and Population Served
This discussion focuses on three SDA characteristics the extent to which SDAs
exceeded their performance standards, the nature of the local partnership (see Table 2.3), and
the extent to which SDAs used fixed unit price, performance-based vendor contracts (see Table
2.6) and their possible relationship to the disadvantagedness of the population that was
enrolled in the SDAs (see Tables 7.2 and 7.3). As in Chapters 5 and 6 (and earlier in this
chapter), disadvantagedness is defined in terms of three employment barriers (i.e., low
educational attainment, limited labor market experience, and public assistance receipt) and the
151
2 1 5

TABLE 7.7
PERCENTAGE DISTRIBUTIONS OF SERVICE STRATEGY RECOMMENDATIONSFOR ADULT AND YOUTH TREATMENT GROUP MEMBERS,
BY SDA ORGANIZATIONAL STRUCTURE
SDA Organizational Structure Adults Youthsand Service Strategy Recommendation (Z) (%)SDAs that are Government-Operated (al
Classroom Training 38.3 39.3OJT/JSA47.3 31.2Other Services14.4 29.5Total
100.0 100.0SDAs that are Govemment/PIC-Operated (b)
Classroom Training 41.3 40.5OJT/JSA28 18.3Other Services30.1 41.2Total99.9 100.0
SDAs that are NC-Operated (c)
Classroom Training 20.6 28.9OJT/JSA60.3 49.8Other Services19.1 21.4Total
100.0 100.1
Difference (d)
Classroom Training 17.7 10.4OJT/JSA-13.0 -18.6Other Services -4.7 8.1
SOURCE: MDRC calculations from Background Information Form responses and informationcollected by MDRC site representatives during the National ITI,A Study.
NOTES: Calculations for this table are based on data for all treatment group membersin the 18-month study sample.
Distributions may not total 100.0 percent because of rounding.Tests of statistical significance were not performed.(a) This subgroup includes SDAs where the local government entity serves as the JTPA
funding recipient, the JTPA administrative body, and the contractor with local service providers.PICs in this subgroup are not incorporated and do not have a separate staff.
(b) This subgroup includes SDAs where the local government entity and the PICshare responsibility as the JTPA funding recipient, the JTPA administrative body, and thecontractor with local service providers. PICs in this subgroup may be incorporatedand may have a separate staff.
(c) This subgroup includes SDAs where the PIC serves as the JTPA funding recipient,the JTPA administrative body, and the contractor with local service providers. PICs inthis subgroup are incorporated and have a separate staff.
(d) This is the recommendation rate difference between government-operated andPIC-operated SDAs.
152
number of these barriers treatment group members had. The basic questions addressed in this
dismission concern the extent to which different types of SDAs were likely to have higher
enrollment rates among treatment group members with two or three of these barriers thanamong treatment group members with none of these barriers.
1. SDA Performance and isopulatias served. Ltire the view that SDA performance
may be related to service emphasis, one widely held view in the JTPA system is that higher
rates of performance among SDAs are associated with an emphasis on serving a lessdisadvantaged population. The reasoning here suggests that, in SDAs that strive to exceedperformance standards, less employable and more disadvantaged applicants are screened out.
Further, it may also be tha' the remaining pool of individuals, being more employable, is bettersuited for OJT or job search assistance, thus accounting for the emphasis on these servicesnoted above.
Evidence concerning this hypothesis is presented in Table 7.8, which is similar to Tables
72 and 7.3. The table presents the percentage of adults and youths in the employment barrier
subgroups and their enrollment rates. The SDAs in the study are grouped according to the
extent to which they exceeded their performance standards (using the entered employment ratestandard for both adults and youths and positive termination rate only for youths). Tests were
run to determine whether the enrollment rate in sites that substantially exceeded their
standards was statistically different from the enrollment rate in sites that moderately exceeded
their standards, and from the enrollment rate in sites that marginally exceeded their standards.
For example, the top panel of Table 7.8 shows the enrollment rate of adults with two or three
employment barriers in SDAs that substantially exceeded their performance standards (56
percent) compared with the enrollment rate for this subgroup in SDAs that marginally
.seeded their standards (66 percent). The table indicates that this difference was statistically
significant at the 1 percent leveL
As in Tables 7.2 and 73, the last column of Table 7.8 shows th enrollment ratedifferences between adults or youths with two or three employment barriers and those with
none. A positive difference means that the group of SDAs enrolled a greater proportion of
its more disadvantaged treatment group pool than of its less disadvantaged treatment group
pool. A negative difference means the reverse.
This anelysis, which is subject to the same caveats noted in the discussion of Tables 7.2
153

TA
BL
E 7
.8
PER
CE
NT
AG
E O
F A
DU
LT
AN
D Y
OU
TH
TR
EA
TM
EN
T G
RO
UP
ME
MB
ER
S IN
EM
PLO
YM
EN
T B
AR
RIE
R S
UB
GR
OU
PS A
ND
TH
EIR
EN
RO
LL
ME
NT
RA
TE
S,B
Y S
ITE
AC
HIE
VE
ME
NT
OF
TH
E .I
TPA
PER
FOR
MA
NC
E S
TA
ND
AR
DS
FOR
EN
TE
RE
D E
MPL
OY
ME
NT
AN
DY
OU
TH
PO
SIT
IVE
TE
RM
INA
TIO
NS
Perf
orm
ance
Sta
ndar
d,Su
bgro
up, a
ndSi
te A
chie
vem
ent o
fSa
mpl
e
2 or
3 E
mpl
oym
ent B
arri
ers
(a)
Na
Em
ploy
men
t Bar
rier
s (a
)E
nrol
lmen
tR
ate
Tre
atm
ent G
roup
Mem
bers
Enr
ollm
ent
Rat
eT
reat
men
t Gro
upM
embe
rsE
nrol
lmen
tR
ate
Perf
orm
ance
Sta
ndar
dSi
ze(%
)(%
)(%
)(%
)D
iffe
renc
e
EN
TE
RE
D E
MPL
OY
ME
NT
Adu
lts in
Site
s th
at
Subs
tant
ially
Exc
eede
d th
e St
anda
rd (
b)3,
686
21.5
55.5
40.1
62.8
-7.3
Mod
erat
ely
Exc
eede
d th
e St
anda
rd (
c)1,
390
25.9
64.2
***
31.1
67.0
**
-2.8
Mar
gina
lly E
xcee
ded
the
Stan
dard
(d)
3,08
234
.365
.8 *
**29
.567
.8 *
-2.0
You
ths
in S
ites
that
Subs
tant
ially
Exc
eede
d th
e St
anda
rd (
b)2,
288
37.8
68.7
25.0
58.3
10.4
Mod
erat
ely
Exc
eede
d th
e St
anda
rd (
c)41
339
.077
.7 *
*18
.680
.4 .0
**-2
.7M
argi
nally
Exc
eede
d th
e St
anda
rd (
d)54
134
.864
.625
.571
.4 *
*-6
.8
POSI
TIV
E T
ER
MIN
AT
ION
You
ths
in S
ites
that
Subs
tant
ially
Exc
eede
d th
e St
anda
rd (
b)1,
052
42.4
71.7
20.9
57.7
14.0
Mod
erat
ely
Exc
eede
d th
e St
anda
rd (
c)76
140
.365
.4 *
*21
.262
.03.
4M
argi
nally
Exc
eede
d th
e St
anda
rd (
d)1,
429
323
72.6
28.3
75.2
***
-2.6
(con
tinue
d)
9

In
4
TA
BLE
7.8
(co
ntin
ued)
SO
UR
CE
: MD
RC
cal
cula
tions
from
Bac
kgro
und
Info
rmat
ion
For
m r
espo
nses
and
from
per
form
ance
sta
ndar
d an
d ac
tual
per
form
ance
data
from
the
16 S
DA
s. S
ee A
ppen
dix
C fo
r in
form
atio
n ab
out t
he p
erfo
rman
ce s
tand
ard
data
.
NO
TE
S: C
alcu
latio
ns fo
r th
is ta
ble
are
base
d on
dat
a fo
r al
l tre
atm
ent g
roup
mem
bers
in th
e 18
-mon
th s
tudy
sam
ple.
The
sub
grou
p w
ith o
nly
one
empl
oym
ent b
arrie
r is
not
incl
uded
in th
is ta
ble
in o
rder
to m
ore
clea
rly il
lust
rate
the
diffe
renc
e be
twee
n"s
ubgr
oups
at e
ither
ext
rem
e of
the
empl
oym
ent b
arrie
r sp
ectr
um. C
onse
quen
tly, t
he p
erce
ntag
e of
trea
tmen
tgr
oup
mem
bers
inea
ch p
erfo
rman
ce s
tand
ard
subg
roup
will
not
tota
l 100
.0 p
erce
nt.
For
eac
h su
bgro
up (
adul
ts a
nd y
outh
s), w
ithin
eac
h em
ploy
men
t bar
rier
subg
roup
, a c
hi-s
quar
e te
st w
as a
pplie
d to
the
diffe
renc
e in
enro
llmen
t rat
es b
etw
een
the
site
s th
at s
ubst
antia
lly e
xcee
ded
the
perf
orm
ance
sta
ndar
d an
d, s
epar
atel
y, th
ose
that
mod
erat
ely
and
mar
gina
llyex
ceed
ed th
e st
anda
rd. S
tatis
tical
sig
nific
ance
leve
ls a
re in
dica
ted
as *
= 1
0 pe
rcen
t; **
= 5
per
cent
; ***
= 1
per
cent
.(a
) T
he b
arrie
rs to
em
ploy
men
t inc
lude
: not
hav
ing
a hi
gh s
choo
l dip
lom
a or
GE
D a
t the
tim
e of
ran
dom
ass
ignm
ent;
havi
ng w
orke
d fe
wer
than
13
wee
ks d
urin
g th
e 12
mon
ths
prio
r to
ran
dom
ass
ignm
ent;
and
rece
ivin
g A
FD
Cor
oth
er c
ash
assi
stan
ce a
t the
tim
e of
ran
dom
ass
ignm
ent.
(b)
Thi
s su
bgro
up in
clud
es s
ites
that
exc
eede
d th
e pe
rfor
man
ce s
tand
ard
by 1
5 pe
rcen
t or
mor
e.
(c)
Thi
s su
bgro
up in
clud
es s
ites
that
exc
eede
d th
e pe
rfor
man
ce s
tand
ard
by 1
0 to
14.
9 pe
rcen
t.(d
) T
his
subg
roup
incl
udes
site
s th
at e
xcee
ded
the
perf
orm
ance
sta
ndar
d by
less
than
10
perc
ent.
(Som
e si
tes
incl
uded
in th
is s
ubgr
oup
did
not e
xcee
d th
e pe
rfor
man
ce s
tand
ard.
)

and 7.3, suggests a mixed story for adults and youths. In SDAs that substantially exceededstandards, the enrollment rate for adults with two or three employment barriers was 7percentage points lower than the enrollment rate for adults with no employment barriers.Further, compared with SDAs that marginally exceeded their performance standards, SDAs thatsubstantit lly exceeded their standards began with smaller proportions of adults who hadmultiple employment barriers and were less likely to enroll these adults. However, comparedto SDAs that marginally exceeded their performance standards, SDAs that substantiallyexceeded the standards were also less likely to enroll adults with no employment barriers.
The opposite story appears to hold for youths when using either enteredemployment rateor positive termination rate as the basis. Here, in SDAs that substantially exceeded theirentered employment rate standard, the enrollment rate for youths with multiple barriers was10 percentage points larger than the enrollment rate for youths with none of the employmentbarriers. The comparable difference for the positive termination rate standard was 14percentage points. In each case, these SDAs began with a larger proportion of youths withmultiple employment barriers than youths with no employment barriers in their pools.
For adults (but not for youths), SDAs that substantially exceeded their standards tendedto provide more OJT (and less classroom training), and among all those recommended for aservice strategy, they tended to enroll a greater proportion of less than of more disadvantagedindividuals. One possible explanation is that performance standards for youths included"positive termination" outcomes such as completion of schooling or attainment of employmentcompetencies, not just as with adults standards related to job placement. This could havepermitted, or encouraged, SDAs to enroll a more disadvantaged youth population for whomjob placement at termination from JTPA was not seen to be an appropriate goal withoutjeopardizing their ability to meet performance standards.
2. SDA organizational structure (nature of the local partnership) and populationserved. One hypothesis concerning PIC-operated SDAs is that they would tend to be moreconcerned about meeting employers' needs than the needs of very disadvantaged clients, andthat they therefore would favor services to more readily employable individuals and those whoconfront fewer barriers to employment. This subsection explores this hypothesis using theapproach employed in the previous subsection. Table 7.9 displays the percentage of adultand youth treatment group members in the employment barrier subgroups, along with their
156

tr
29to
TA
BL
E 7
.9
PER
CE
NT
AG
E O
F A
DU
LT
AN
D Y
OU
TH
TR
EA
TM
EN
T G
RO
UP
ME
MB
ER
S IN
EM
PLO
YM
EN
T B
AR
RIE
K S
UB
GR
OU
PS A
ND
TH
EIR
EN
RO
LL
ME
NT
RA
TE
S,B
Y S
DA
OR
GA
NIZ
AT
ION
AL
ST
RU
CT
UR
E
Subg
roup
and
Sam
ple
2 or
3 E
mpl
oym
ent B
arri
ers
(a)
No
Em
ploy
men
t Bar
rier
s (a
)E
nrol
lmen
tR
ate
Tre
atm
ent G
roup
Mem
bers
Enr
ollm
ent
Rat
eT
reat
men
t Gro
upM
embe
rsE
nrol
lmen
tR
ate
SDA
Org
aniz
atio
nal S
truc
ture
Size
(%)
(%)
(%)
(%)
Dif
fere
nce
Adu
lts in
SD
As
that
are
PIC
-Ope
rate
d (b
)2,
437
27.2
55.4
36.2
62.1
-6.7
Gov
ernm
ent /
PIC
- O
pera
ted
(c)
4,02
227
.964
.2 *
**33
.168
.3 *
**-4
.1
Gov
ernm
ent-
Ope
rate
d (d
)1,
699
25.2
61.8
**
35.6
61.5
0.3
You
ths
in S
DA
s th
at a
re
PIC
-Ope
rate
d (b
)74
826
.565
.332
.461
.53.
8
Gov
ernm
ent/P
IC-O
pera
ted
(c)
1,85
142
.672
.2 *
18.2
65.3
6.9
Gov
ernm
ent-
Ope
rate
d (d
)64
334
.364
.232
.162
.71.
5
SOU
RC
E: M
DR
C c
alcu
latio
ns f
rom
Bac
kgro
und
Info
rmat
ion
Form
res
pons
es, p
rogr
am e
nrol
lmen
t and
par
ticip
atio
n da
ta
from
the
16 S
DA
s, a
nd in
form
atio
n co
llect
ed b
y M
DR
C s
itere
pres
enta
tives
dur
ing
the
Nat
iona
l JT
PA S
tudy
.
NO
TE
S: C
alcu
latio
ns f
or th
is ta
ble
are
base
d on
dat
a fo
r al
l tre
atm
ent g
roup
mem
bers
in th
e 18
-mon
th s
tudy
sam
ple.
The
sub
grou
p w
ith o
nly
one
empl
oym
ent b
arri
er is
not
incl
uded
in th
is ta
ble
in o
rder
to m
ore
clea
rly
illus
trat
e
the
diff
eren
ce b
etw
een
subg
roup
s at
eith
er e
xtre
me
of th
eem
ploy
men
t bar
rier
spe
ctru
m. C
onse
quen
tly, t
he p
erce
ntag
e
of tr
eatm
ent g
roup
mem
bers
in e
ach
SDA
org
aniz
atio
nal s
truc
ture
subg
roup
will
not
tota
l 100
.0 p
erce
nt.
For
each
sub
grou
p (a
dults
and
you
ths)
, with
in e
ach
empl
oym
ent
barr
ier
subg
roup
, a c
hi-s
quar
e te
st w
r3 a
pplie
d to
the
diff
eren
ce in
enr
ollm
ent r
ates
bet
wee
n PI
C-o
pera
ted
SDA
s an
d,se
para
tely
, tho
se th
at a
re g
over
nmen
t-
oper
ated
end
thos
e th
at a
re g
over
nmen
t/PIC
-ope
rate
d. S
tatis
tical
sign
ific
ance
leve
ls a
re in
dica
ted
as
* =
10
perc
ent;
** =
5 p
erce
nt; *
** =
1 p
erce
nt.
(a)
The
bar
rier
s to
em
ploy
men
t inc
lude
: not
hav
ing
a hi
ghsc
hool
dip
lom
a or
GE
D a
t the
tim
e of
ran
dom
assi
gnm
ent;
havi
ng w
orke
d fe
wer
than
13
wee
ks d
urin
gth
e 12
mon
ths
prio
r to
ran
dom
ass
ignm
ent;
and
rece
ivin
g
AFD
C o
r ot
her
cash
ass
ista
nce
at th
e tim
e of
ran
dom
assi
gnm
ent.
(b)
Thi
s su
bgro
up in
clud
es S
DA
s w
here
the
PIC
ser
ves
asth
e JT
PA f
undi
ng r
ecip
ient
, the
JT
PA a
dmin
istr
ativ
e
body
, and
the
cont
ract
or w
ith lo
cal s
ervi
ce p
rovi
ders
. PIC
sin
this
sub
grou
p ar
e in
corp
orat
ed a
nd h
ave
a se
para
te s
taff
.
(c)
Thi
s su
bgro
up in
clud
es S
DA
s w
here
the
loca
l gov
ernm
ente
ntity
and
the
PIC
sha
re r
espo
nsib
ility
as th
e JT
PA f
undi
ng r
ecip
ient
, the
JT
PAad
min
istr
ativ
e bo
dy, a
nd th
e co
ntra
ctor
with
loca
lse
rvic
e pr
ovid
ers.
PIC
s in
this
sub
grou
p m
ay b
e in
corp
orat
ed a
nd m
ay h
ave
a se
para
test
aff.
(d)
Thi
s su
bgro
up in
clud
es S
DA
s w
here
the
gove
rnm
ent e
ntity
ser
ves
as th
e JT
PA f
undi
ng r
ecip
ient
, the
JT
PA
adm
inis
trat
ive
body
, and
the
cont
ract
or w
ith lo
cal s
ervi
cepr
ovid
ers.
PIC
s in
this
sub
grou
p ar
e no
t inc
orpo
rate
d
and
do n
ot h
ave
a se
para
te s
taff
.22
4

enrollment rates. Here the SDAs are grouped according to whether they were predominantlyPIC-operated, predominantly government-operated, or operated by a more balancedcombination of the PIC and a government entity. For Table 7.9, tests were run to determinewhether the enrollment rate in PIC-operated SDAs was statistically different from the rate ineach of the other two groups. For example, the top panel of Table 7.9 shows the enrollmentrate of adults with two or three employment barriers in PICoperated SDAs (55 percent)compared to the analogous rate in government-operated SDP.- (62 percent). The tableindicates that this difference was statistically significant at the 5 percent level. The last columnin Table 7.9 indicates the difference in enrollment rates between those with two or threeemployment barriers and those with none. A positive difference means that the group ofSDAs was more likely to enroll those with multiple employment barriers than those with noneof the barriers.
The information in Table 7.9 suggests at most a modest and tenuous relationship betweenthe nature of the local partnership and the disadvantagedness of the population the SDAsserved. The relationship is also different for adults and youths. For example, in PIC-operatedSDAs, the enrollment rate for adults with multiple employment barriers was 7 percentagepoints lower than the rate for adults with none of the barriers. In government-operated SDAs,the enrollment rater for these two subgroups were approximately the same. Interestingly, boththe PIC-operated and government-operated SDAs began with roughly the same proportion ofadults with multiple employment barriers. The patterns for youths are different. Comparedto government-operated SDAs, PIC-operated SDAs began with a lower proportion of youthswith multiple employment barriers, but the enrollment rate for these youths was 4 percentagepoints higher than the rate for those with none of the three barriers. For both adults andyouths in government-operated SDAs, there was very little difference in enrollment rates forthe two employment barrier subgroups.
3. Types of vendor contracts SDAs use and population served. As described inChapter 2, there was considerable variation in the type of contracts SDAs used for contractedservices: fixed unit price, performance-based or cost-reimbursement. As discussed earlier, onefrequently posed hypothesis is that fixed unit price contracts since they withhold full paymentfor services until an enrollee is placed on a certain type of job for a particular period of timeat a specified wage rate provide strong incentives for contractors to serve a more employable
158
0 r-'.)

population, in order to be assured of covering their costs.12 In contrast, the argument states,
contracts that assure full payment regardless of outcome "cost-reimbursement" contracts
serve more disadvantaged individuals, since there is no monetary incentive to work with easier-to-place individuals.
Table 7.10 provides information that may shed some light on this hypothesis. It displays
the percentage of adult and youth treatment group members in the employment barriersubgroups and their enrollment rates. Here the SDAs are grouped according to the percentageof total Title II-A training ex mditures that were paid to vendors under fixed unit price,
performance-based contracts: "high use" if such contract payments exceeded 50 percent of total
Title II-A training expenditures; "moderate use" ifsuch contract payments were between 15 and49 percent of total Title II-A training expenditures; and "little or no use" if such contractpayments were under 15 percent of total Title II-A training expenditures. In Table 7.10, tests
were run to determine whether the enrollment rate in SDAs that made high use of fixed unit
price contracts was statistically different from the enrollment rate in each of the other twogroups of SDAs. For example, the top panel of Table 7.10 shows the enrollment rate of adults
with two or three employment barriers in "high use" SDAs (60 percent) compared to the ratein "low use" SDAs (61 percent). The table indicates that this difference was not statistically
significant. The last column in Table 7.10 indicates the difference in enrollment rates betweenthose with two or three employment barriers and those with none. A positive differencesmeans that the group of SDAs was more likely to enroll those with multiple employmentbarriers than those with none of the barriers.
Table 7.10 does not present any clear evidence supporting this hypothesis for either adults
or youths. For example, the enrollment rate among adults with multiple employment barriers
was lower than the rate for adults with none of the barriers in both SDAs that made high useof fixed unit price contracts and SDAs that made little or no use of them. It is also notablethat the high and low users of fixed unit price contracts began with roughly the sameproportion of adults in both employment barrier subgroups in their pools of personsrecommended for a service strategy.
"lbere are, of course, methods to structure Mixed unit price, performance-based contracts to avoidthis outcome, and instead to promote services to a more disadvantaged population. See NationalCommission for Employment Policy, 1985. However, these methods were not reported to be used inthe 16 study sites (or to be used widely in the JTPA system).
159
0

cro
colle
cted
by
Abt
Ass
ocia
tes
Inc.
fro
m th
e 16
SD
As.
0
TA
BL
E 7
.10
PER
CE
NT
AG
E O
F A
DU
LT
AN
D Y
OU
TH
TR
EA
TM
EN
T G
RO
UP
ME
MB
ER
S IN
EM
PLO
YM
EN
T B
AR
RIE
R S
UB
GR
OU
PS A
ND
TH
EIR
EN
RO
LL
ME
NT
RA
TE
S,B
Y S
ITE
LE
VE
L O
F U
SE O
FPE
RFO
RM
AN
CE
-BA
SED
CO
NT
RA
CT
S
Subg
roup
and
Site
Lev
el o
f U
se o
fSa
mpl
e
2 or
3 E
mpl
oym
ent B
arri
ers
(a)
No
Em
ploy
men
t Bar
rier
s (a
)E
nrol
lmen
tR
ate
Tre
atm
ent G
roup
Mem
bers
Enr
ollm
ent
Rat
eT
reat
men
t Gro
upM
embe
rsE
nrol
lmen
tR
ate
Perf
orm
ance
-Bas
ed C
ontr
acts
Size
(%)
(%)
(%)
(%)
Dif
fere
nce
Adu
lts in
Site
s w
ith
Hig
h U
se (
b)1,
591
25.9
59.5
35.1
68.2
-8.7
Mod
erat
e U
se (
c)2,
581
31.1
62.5
28.3
58.5
***
4.0
Litt
le o
r N
o U
se (
d)3,
986
25.0
61.2
38.3
66.8
-5.6
You
ths
in S
ites
with
Hig
h U
se (
b)1,
256
42.1
72.4
19.0
61.1
11.3
Mod
erat
e U
se (
c)58
440
.663
.7 *
20.7
52.1
11.6
Litt
le o
r N
o U
se (
d)1,
402
32.0
69.3
30.4
68.1
*1.
2
SOU
RC
E: M
DR
C c
alcu
latio
ns f
rom
Bac
kgro
und
Info
rmat
ion
Form
res
pons
es a
ndpr
ogra
m y
ear
1988
fis
cal r
ecor
ds
e) r
-- 0
001
NO
TE
S: C
alcu
latio
ns f
or th
is ta
ble
are
base
don
dat
a fo
r al
l tre
atm
ent g
roup
mem
bers
in th
e 18
-mon
thst
udy
sam
ple.
The
sub
grou
p w
ith o
nly
one
empl
sym
ent b
arri
er is
not
incl
uded
in th
is ta
ble
in o
rder
tom
ore
clea
rly
illus
trat
eth
e di
ffer
ence
bet
wee
n su
bgro
ups
at e
ither
ext
rem
e of
the
empl
oym
ent b
arri
er s
pect
rum
. Con
sequ
ently
, the
perc
enta
geof
trea
tmen
t gro
up m
embe
rs in
eac
hpe
rfor
man
ce-b
ased
con
trac
t sub
grou
p w
ill n
ot to
tal 1
00.0
perc
ent.
Und
er a
JT
PA p
erfo
rman
ce-b
ased
cont
ract
, ser
vice
pro
vide
rs c
an r
ecei
ve p
artia
l pay
men
ts o
nly
whe
nth
ey a
ttain
perf
orm
ance
ben
chm
arks
. Als
o, f
ull p
aym
ent u
nder
thes
e co
ntra
cts
isco
ntin
gent
upo
n th
ree
cond
ition
s: c
ompl
etio
n of
trai
ning
, pla
cem
ent i
n a
trai
ning
-rel
ated
job,
and
rec
eipt
of
a sp
ecif
ied
wag
e. A
ll pa
ymen
ts m
ade
unde
r th
ese
cont
ract
sca
n be
cha
rged
to tr
aini
ng e
xpen
ditu
res.
For
each
sub
grou
p (a
dults
and
you
ths)
, with
in e
ach
empl
oym
ent b
arri
er s
ubgr
oup,
a c
hi-s
quar
e te
st w
asap
plie
d to
the
diff
eren
ce in
enr
ollm
ent r
ates
bet
wee
n th
e si
tes
with
high
use
of
perf
orm
ance
-ba
sed
cont
ract
s an
d,se
para
tely
,th
ose
with
mod
erat
e us
e an
d th
ose
with
littl
eor
no
use.
Sta
tistic
al s
igni
fica
nce
leve
ls a
re in
dica
ted
as*
= 1
0pe
rcen
t; **
= 5
per
cent
; ***
= I
per
cent
.(a
) T
he b
arri
ers
to e
mpl
oym
ent i
nclu
de: n
ot h
avin
g a
high
sch
ool
dipl
oma
or G
ED
at t
he ti
me
of r
ando
mas
sign
men
t;ha
ving
wor
ked
few
er th
an 1
3 w
eeks
dur
ing
the
12 m
onth
spr
ior
to r
ando
m a
ssig
nmen
t; an
d re
ceiv
ing
AFD
C o
r ot
her
cash
assi
stan
ce a
t the
tim
e of
ran
dom
ass
ignm
ent.
(b)
A s
ite h
ad 'h
igh
use"
of
perf
orm
ance
-bas
ed c
ontr
acts
ifpa
ymen
ts u
nder
this
type
of
cont
ract
acc
ount
ed f
orov
er50
per
cent
of
tota
l Titl
e II
-Atr
aini
ng e
xpen
ditu
res.
(c)
A s
ite h
ad 'm
oder
ate
use"
of
perf
orm
ance
-bas
ed c
ontr
acts
ifpa
ymen
ts u
nder
this
type
of
cont
ract
acc
ount
ed f
or15
to 4
9 pe
rcen
t of
tota
l Titl
e 11
-Atr
aini
ng e
xpen
ditu
res.
(d)
A s
ite h
ad 'l
ittle
or
no u
se"
of p
erfo
rman
ce-b
ased
con
trac
ts if
paym
ents
und
er th
is ty
pe o
f co
ntra
ct a
ccou
nted
for
unde
r 15
per
cent
of
tota
l Titl
e II
-Atr
aini
ng e
xpen
ditu
res.

A very different pattern emerged for youths. In all SDAs, the enrollu- ent rate among
youths with multiple employment barriers was higher than the rate for youths with none.
However, this enrollment rate difference was much greater in SDAs with high or moderate use
of fixed unit price contracts (11.3 and 11.6 percentage points, respectively, compared to 1.2
percentage points). In addition, SDAs that made high use of fixed unit price contracts began
with a higher proportion of youths with multiple employment barriers than did SDAs that made
little or no use of fixed unit price contracts. The differences between adults and youths may
be accounted for in part by the ability of SDAs to write youth Etch unit price contracts for
outcomes other than job placement the only use to which they could be put for adults.
In conclusion, the 16 SDAs in the study showed often very large cross-site variations in
the activities to which they referred applicants, the services enrollees actually received, and the
enrollment rates of more and less disadvantaged individuals. This information should be useful
for understanding the findings presented in the 18-month impact report (Bloom et al., 1993).
The further analyses and findings in this chapter were subject to a number of very
important caveats and cautions about the limits of the SDA-level analysis that could be
undertaken in the National .TTPA Study. An examination of the evidence for a number of
hypotheses revealed few relationships, and in some cases where there was some suggestive
evidence of a relationship, the findings were notably different for adults and youths.
161
- 9

APPENDICES

APPENDIX A
PROFILES OF THE SERVICE DELIVERY AREASIN THE NATIONAL JTPA STUDY
This appendix contains brief profiles of the 16 service delivery areas (SDAs) that areparticipating in the National JTPA Study. It supplements the material in the body of thereport. Each profile describes the site's location, size, population, and labor market; itsprogram (structure and scrvices); and its implementation of the study. The profiles arepresented in alphabetical order, with the site name followed by the formal SDA name.
These profiles are intentionally brief and are . meant to provide the reader with someunderstanding of the diversity across sites. Programs not included in the sample, such as TitlesIII and 11-B, and services to in-school youths through Title II-A, are not specifically discussed.
To ensure a consistent base for comparison across sites, 1979 Census data were theprimary source of information on population and size, while the JTPA Annual Status Report(JASR) for 1986 was used for information on labor market conditions. SDAs' Annual JobTraining Plans, and observations and data collected by the researchers during theimplementation of the study, were also drawn on in developing these profiles.
The profiles depict the SDAs and their local environments as of the time the randomassignment process was going on, therefore do not reflect subsequent changes. Whenreferences are made to the research sample, they refer to all those randomly assigned in thesite, not just the 18-month study sample.
165
0 .k"... j

BUTTE, MONT.: CONCENTRATED EMPLOYMENT PROGRAM
Study Context
The Concentrated Employment Program (CEP) serves 10 counties in western Montana.The CEP SDA has approximately 125,000 residents, of whom about 37,000 live in Butte; 24,000live in Helena. The remaining parts of the SDA are very rural, with no towns over 15,000 inpopulation. SDA residents are primarily white, and 7.5 percent of all families had incomesbelow the federal poverty level in 1979.
The SDA's economy has traditionally been based on mining, timber, and ranching. Inthe late 1970s and early 1980s, major layoffs in mining and related industries occurred in Butteand Anaconda, causing a decline in the local economy in these areas. The state capital inHelena provides white-collar employment, while Butte's economy is gradually diversifying.Unemployment in the SDA was 9 percent in 1984 and gradually declined to 7.4 percent in1987 and 7 percent in 1988. The average annual wage for workers in the SDA was $16,700in program year 1986.
The Program
During the period of this study, the Montana Department of Labor and Industry,Employment Policy Division, was the grant recipient for the SDA, which has a NC appointedby the CEP Council of County Commissioners. The Council of County Commissioners alsois consulted on JTPA policy and at times meets jointly with the PIC. The JTPA program isoperated by the Montana Job Service Division, under contract with the Employment PolicyDivision. Four Job Service offices provide JTPA services: in Helena and Butte, separate JTPAintake offices serve clients, while in Anaconda and Dillon, the Job Service provides both itsusual job listing services and JTPA in a single office.
The Job Service staff offer job search assistance and OJT in all offices and provideclassroom training by referrals to other agencies. In Helena, a basic skills brush-up coursefollowed by clerical training was an important service, preparing people for employment in thecapital area, while in much of the rest of the SDA, OJT was the most common service. In therural parts of the SDA, the nearest provider of classroom training in occupational skills wasmany miles away.
Study Implementation
The normal intake procedures in the two larger offices (Helena and Butte) differedsomewhat from those in the smaller offices. In Helena and Butte, intake for JTPA wasnormally done on a group basis, typically scheduled once a week. Clients completed the JTPAapplication and met with staff for a brief assessment interview. An orientation session wasthen held for applicants who were eligible and appropriate for JTPA. At this session, staffwould provide job counseling, conduct a fuller assessment, and then work with individuals to
10n July 1, 1990, the operator of this SDA changed from the Montana Department of Labor andIndustry, a government entity, to Montana Job Training Partnership, Inc., a private nonprofitorganization formed by the two PICs in Montana.
166

arrange services. In the smaller offices, staff worked with clients individually and theprocedures could be handled more informally.
In order to introduce the study procedures in this SDA, three issues had to be addressed.First, in the two larger offices, an appropriate point for the designation of the recommendedservice strategy had to be identified that would come late enough to provide staff withinformation on the clients but before services were provided during orientation. Staff agreedto base recommendations for services on a review of the materials assembled during the groupintake sessions. At these sessions, applicants would complete the Background InformationForm and Informed Consent Form and random assignment was then conducted. Only thoserandomly assigned to the treatment group would be scheduled to attend orientation and thenbe referred to service providers.
Second, some clients who were interested in an OJT would try to arrange one on theirown; this was especially common in the smaller offices. Typically, the percentage of individualswho sought and found an OJT in this way was quite low, so random assignment could notcome before the beginning of this individual OJT search. However, individuals needed tounderstand that if they returned with a possible OJT, enrollment in JTPA was not guaranteed.As was always the case, their eligibility would have to be redetermined, and staff would haveto judge the appropriateness of the job for an OJT, and during the period of the studythey would have to go through random assignment.
Third, in Helena and Butte, agencies serving displaced homemakers provided pre-employment skills training and counseling, using state funds, and often then enrolled some oftheir participants into JTPA-funded clerical training. Since the initial portion of the sequencewas not funded by JTPA and only a portion of participants made it to the JTPA-fundedservices, clients referred from these service providers were excluded from the study.
The SDA began random assignment in July 1988 and completed it in September 1989,falling somewhat short of its original target sample.
CEDAR RAPIDS, IOWA: EAST CENTRAL IOWA
Study Context
The East Central Iowa SDA includes the cities of Cedar Rapids (population 110,000) andIowa City (population 50,000). Total population in the SDA is approximately 330,000, andoutside the two main cities the SDA is very rural. The largest SDA office is located in CedarRapids, and each of the surrounding five counties (Benton, Iowa, Johnson, Jones, andWashington) has a smaller office. About 6 percent of all families in the SDA had incomesbelow the federal poverty level in 1979.
The local labor market is closely linked to the fortunes of agriculture, through directproduction and processing of food products. Within the SDA, the University of Iowa is alsoa major employer. Unemployment remained at about 6 percent from 1984 through 1986, thendropped to 4.3 percent in 1987 and to 3.6 percent in 1988 with growth in the local economy.The average annual wage in the SDA was approximately $17,200 in program year 1986.
167
2:1 3

Theirgigam
The SDA (a private, nonprofit, multi-jurisdictional agency) administers the JTPAprogram. Each of its six offices is responsible for taking applications, determining eligibility,and assessing applicants. Staff in the offices are typically experienced, with many having beenwith the agency since the CETA program.
Client recruitment was not a problem in this SDA, except for occasional problemsenrolling youths. This was partly because, when the study began, many enrollees were carriedinto a new program year. In this second program year, funding was not as great as expected,so the target number of new enrollments dropped sharply.
These funding problems had implications for the services provided in the SDA. In pastyears, intensive services such as OJT had been the major services offered. With the declinein funding, SDA managers encouraged staff to provide less intensive services to allow moreapplicants to be served. Nevertheless, staff continued to recommend intensive services suchas OJT/BA and classroom training for most applicants.
Study Implementation
Study procedures could be integrated into the normal operations of the SDA withrelatively few changes. In the Cedar Rapids office, applications were taken during a grouporientation s.ssion. During this session, the staff briefly discussed the study and administeredshort tests of basic skills. Applicants then met with a coordinator to discuss the program anddetermine any further documentation needed to establish eligibility. Once eligibility wasestablished, applicants returned for an assessment appointment with a coordinator, during whichthe Background Information Form and Informed Consent Form were completed. Oncompletion of assessment, the coordinator recommended individual services and the appropriateservice strategy for the study and called MDRC for random assignment.
In the five rural offices, application and eligibility determination were done in anindividual meeting with clients. The Background Information Form and Informed ConsentForm were completed during these sessions. The assessment process was less formal than inthe Cedar Rapids office, and its length varied according to the needs and interests of the client.Once assessment was completed, staff recommended a service strategy and called MDRC forrandom assignment.
Random assignment began in this SDA in June 1988 and ended in June 1989. Becauseof the sharp decline in funding for new enrollments during the period of random assignment,the study sample of 498 fell well below the original target number. The vast majority of thesample were recommended for intensive activities such as classroom training (55 percent) andOJT /JSA (38 percent). General assistance applicants served by the SDA under a state-fundedwelfare employment program were excluded from the study.
COOSA VALLEY. GA.: COOSA VALLEY
Study Context
The Coosa Valley SDA provides JTPA services for a 10-county area in the northwesternpart of Georgia. The SDA is large and rural, and public transportation is nonexistent except
168

in Rome, which is the largest city, with a population of 30,000. Services are provided througha decentralized structure in order to reach the total SDA population of 355,000, which ispredominantly (more than 90 percent) white. Approximately 11 percent of the families hadincomes below the federal poverty level in 1979.
The most important employment sector is manufacturing, which employed 38 percent ofthe workforce in 1980. The textile and apparel industries dominate this sector. The servicesector also supplies a significant number of jobs, employing 19 percent of the workforce. Theunemployment rate started to decline just as random assignment began from 7 percent in1985 to 5.7 percent in 1986. By 1988, however, the unemployment rate had climbed back upto 63 percent. The average wage in the area was $15,300 per year in program year 1986.
The Program
A state-created but locally administered Regional Development Center (RDC) is theplanning and administrative entity and grant recipient for the SDA. RDCs fulfill multiplelabor-market-related functions in Georgia and receive funds from the state as well as from theprograms they oversee, such as JTPA. The Coosa Valley RDC provides fiscal and programoversight and contracts out all services. The PIC, whose members include a number of theJTPA contractors, provides input to the RDC. The RDC contracted with Berry College toprovide intake services as well as occupational training. Because of the large area served bythe SDA, intake was conducted at provider sites and in central public locations within thecounties (e.g., courthouses), as well as at Berry College's JTPA office. Following thedetermination of eligibility for services, Berry College staff made referrals to the 18 JTPAcontractors that dealt with the population covered by the study.
Community colleges, vocational colleges, technical schools, and private for-profit and not-for-profit organizations provided classroom training in a wide range of occupations.Community-based organizations worked primarily with out-of-school youth in GED preparation,job search activities, and the development of youth competencies. The private contractors alsoarranged OJTs. Contracts for all of the above services were primarily performance-based.
Study Implementation
Random assignment started in January 1988 and ended in August 1988. Recruitment wasnot a general problem, although some OJT providers said that the study caused them to losegood candidates. Over the study period, there were several organizational changes thatcomplkated the implementation process. Berry College had only recently become thecontractor for intake services and was still refining procedures at the time the study started.The good relationship that developed between the service providers, Berry College, and theSDA staff was critical to the successful implementation of the study. The need to recommendindividuals to a service strategy prior to random assignment required further adaptations forservice providers not providing classroom training in occupational skills. Berry College certifiedand referred applicants to the providers, who were asked to determine whether they wouldaccept the applicant. Most contractors for classroom training in occupational skills were alreadydoing this type of assessment. Once the client was found appropriate for services by thecontractor, Berry College would complete the random-assignment call and then inform boththe contractor and client of the client's status in the study.
169
9

Frequently, applicants interested in classroom training in occupational skills or OJT,including some employer-generated referrals, would make their first contact with the providerrather than with the college. When this occurred, the contractor would complete an assessmentand then refer the person to the college for an eligibility interview and random assignment.Off contractors prior to the study provided several days of job search activities and sometimesmade referrals to prospective employers prior to the official determination of eligibility. Duringthe study, this was restricted to no more than two days of job search and no direct employerreferrals until after random assignment was completed and the applicant was identified as inthe treatment group.
The intake procedures for a contractor who arranged customized training to fill employerneeds sometimes varied slightly from the procedures described above. In most cases, intakepersonnel went on-site and, if the applicant appeared to be JTPA-eligible, random assignmentwas conducted prior to obtaining all documentation to support the eligibility. This was doneto expedite the placement of individuals in these programs. Those who were assigned to thetreatment group were then required to complete the certification process; any who did notmeet all eligibility requirements were not enrolled by the SDA.
Approximately 40 percent of all applicants were recommended for classroom training overthe random-assignment phase of the study, with 34 percent of the applicants recommended forOJT/JSA. Special groups excluded from the study in this SDA were individuals served with3 percent funds or 6 percent funds, which were targeted for hard-to-serve individuals (a 15-slot program for people with multiple barriers to employment), people with handicaps, whowere to be served by a vocational rehabilitation contractor, individuals in a special program forthe deaf, and people served through a limited-slot reciprocal agreement with the neighboringSDA.
Adjustments to performance standards were not required in either year of the study.
CORPUS CHRISTI, TEX.: CORPUS CHRISTI/NUECES COUNTY
Study Context
The Corpus Christi/Nueces County SDA (previously called the Corpus Christi JobTraining Program) is located in southeastern Texas on the Gulf of Mexico. Corpus Christi,with a population of 232,000, has 86 percent of the 270,000 county residents. Hispanics andwhites have been represented almost equally in the population, at 47 percent each, but theHispanic population is increasing. Black residents represent about 5 percent. Approximately13 percent of the families in the SDA had incomes below the federal poverty level in 1979.
The local economy, with many jobs tied to the oil industry as well as tourism, wasaffected by the major recession in Texas in the mid-1980s. The unemployment rate fluctuatedfrom 9.1 percent in 1984 to 12 percent in 1987 to 10.4 percent in 1988. The average annualwage for the area in program year 1986 was $18,500.
The Program
At the beginning of program year 1988, the PIC was incorporated and assumedresponsibility as grant recipient and administrative entity. Staff then became employees of thePIC. There are two JTPA offices in the SDA, although the site outside the city is not a full-
170

service center. The SDA is responsible for Title II-A programs, including 3 percent and 8percent programs, as well as Titles II-B and IlL
OJT and classroom training in occupational skills are the most frequently emphasizedservices, with some GED and job search services also provided. Except for assessment andintake, the PIC uses performance-based contracts and subcontracts all services to outsideorganizations. The primary classroom training contractor, a community college, providesclassroom training in a wide range of occupational areas; JTPA participants are mainstreamedwith other students. A GED class, however, is offered only to JTPA clients. The TexasEmployment Commission, the public Employment Service, is currently responsible foradministering the OJT program, although in the first year of the study, a private for-profitcontractor fulfilled this function. Two community -based organizations are also majorcontractors to the SDA: LULAC conducts job search, job club, and job placement, originallyas a stand-alone activity, but more recently as a follow-up component for those who havecompleted classroom training in occupational skills at the community college; SER providesconcurrent GED and classroom skills training for out-of-school youths. The SDA expandedits own services to include some job search activities. Cost-reimbursement contracts were usedfor individual referrals to specific vocational training courses, offered primarily throughproprietary schools.
Study Implementation
Random assignment began in January 1988 and ended in January 1989, with 1,609 peoplerandomly assigned. Generally, recruitment was not a problem, although specific contractorsreported some difficulty meeting goals; the SDA felt this was only partly caused by theestablishment of the control group. During the first year of random assignment, all JTPA-funded students at the community college were excluded from the sample because enrollmentin classes had already occurred. In the second year, the SDA redefined procedures and onlynew students (or students who had taken only preparatory courses) who were randomlyassigned to the treatment group were allowed to receive JTPA funding. Excluded from thesample were older individuals served through 3 percent funding, the 8 percent program, a smallnumber of AFDC recipients in a GED program, and a program funded through Title II-A 6percent funds that covered work and training-related expenses, such as uniforms and carrepairs, for AFDC recipients.
Implementation of the study did require closer coordination between the SDA and itscontractors, although relationships prior to the study were already good. Responsibility forrecruitment was shared: the SDA conducted assessments and determined eligibility, and thecontractors were responsible for additional assessments and random assignment. Applicantswho were recruited and seen first by the contractor were sent to the SDA for eligibilitydetermination and referred back to the contractor for random assignment. Applicants whowere recruited by the SDA staff were assessed and screened by the service providers prior torandom assignment. Those determined inappropriate by the service providers were referredback to the SDA for further assessment. There were some problems with the flow of peopleand paper as a result of this process. Originally, paperwork was given to the applicant to takewith him or her to the other agency, but some of it was getting lost. Procedures were modifiedso that the contractor picked up a copy of the paperwork and could track who was beingreferred.
171

During the sample build-up period, 50 percent of the applicants were recommended forclassroom training and 42 percent were called in for OJT/JSA. The random-assignment processvaried slightly by provider. To expedite employer referrals, the OJT contractor completed thecall while the client waited. The contractor who focused on out-of-school youths scheduledapplicants in groups, completed the call-in for random assignment at the end of an orientationsession, and divided the group to inform them of the results. The community college made therandom-assignment call for all applicants just prior to the start of a new semester.
The SDA did experience some problems with performance over the period of the study.During the first year, funds were slightly underspent and the governor approved an adjustment.In the second year, the SDA requested an adjustment in the pest-program follow-upemployment rate for adults.
DECATUR. ILL: MACON/DE WITT COUNTIES
Study Context
The Macon/De Witt Counties SDA, located in central Illinois east of Springfield, servesthe two counties. They have a total population of nearly 150,000. Decatur, a city ofapproximately 90,000 located in Macon County, is the home of the larger JTPA office; asecond office is located in De Witt County in the town of Clinton, which has about 8,000residents. Outside of Decatur, the SDA is primarily rural, with scattered small towns. Decaturhas a significant black population, but the remaining parts of the SDA are primarily white. In1979, 7.8 percent of the families in the SDA had incomes below the federal poverty level.
The Macon/De Witt labor market continued to experience high unemploymentthroughout the 1980s. The unemployment rate was 10.7 percent in 1984, 10.2 percent in 1985,and 11.3 percent in 1986; it declined slightly to 10.6 percent in 1987 and to 9.3 percent in1988. Plant closings or layoffs in several large heavy manufacturing firms occurred in the1980s, and these cuts caused a leveling off in wholesale trade, finance-insurance, and real estateemployment. Construction of a nuclear power plant in Clinton did increase the demand forlabor in that part of the SDA. The average annual wage in the SDA was $22,300 in programyear 1986.
The Program
The JTPA grant recipient is Macon County, which administers the program. Anexperienced staff operate the program, with the director and assistant director having servedin the agency since the CETA program. The two JTPA offices in Decatur and Clinton conducttheir own intake, assessment, and service delivery. In light of the high unemployment rate inthe SDA, staff have not needed to actively recruit clients; 40 percent of applicants have beenwalk-ins, and the bulk of the remainder have been referrals from public aid or the EmploymentService.
The primary services offered by the SDA are OJT and job search assistance, thoughclassroom training in occupational skills and basic education were planned to increase in sizeduring the period of the study. At the time the study started, a local community collegeoperated the OTT and job search assistance activities. These were provided under anarrangement by which the SDA paid a specified portion of the salaries of college staff, with
172

the payment unrelated to the number of people served, though the college received bonuseswhen it placed certain groups in jobs. The SDA also funds basic education (through a regionalschool district) and work experience, with a combination of these two activities sometimesserving as a lead into an OJT.
Study Implementation
The study procedures could be introduced in this SDA with relatively few changes innormal operations, partly because the existing high demand for the program meant that demandfor program services clearly exceeded available program slots. When clients initially inquiredabout the program, staff provided them with information on program services and eligibilityrules and scheduled an individual intake interview with a counselor. At that appointment, thecounselor explained the study, provided an additional orientation to the program, filled out anapplication and Background Information Form with the client, and began the assessmentprocess. Once a week the counselors met with the supervisor to agree on an appropriateservice plan for applicants. Random-assignment calls were made following these meetings.Seventy-seven percent of those randomly assigned were recommended for the OJT/JSA servicestrategy.
Only one special change was made in the usual procedures to implement the study. Priorto the start of random assignment, SDA staff had referred applicants recommended for eitherOJT or job search assistance to the local community college providing these services, withoutdesignating which service should be provided. Prior to the study, SDA staff were consideringdesignating a single service at referral and used the start of random assignment (with itsrequirement of a single recommended service strategy) to introduce this change. The onlygroup specially excluded from the study in this SDA was older workers recommended for aspecial OJT program.
Random assignment began in November 1987 and continued through July 1988, with thetotal sample reaching 471, below the original target number. The SDA chose to end randomassignment early in order to participate in a state-initiated economic development project, whichrequired them to refer large numbers of carefully screened job candidates for possibleemployment at a new plant in the area.
FORT WAYNE, IND.: NORTHEAST INDIANA
Study Context
The Fort Wayne Area Job Training and Development Corporation or JobWorks, locatedin Indiana's northeastern corner, serves eight counties: Adams, Allen, De Kalb, Huntington,Noble, Steuben, Wells, and Whitley. (Northeast Indiana is the SDA name.) Fort Wayne, acity of approximately 175,000 in Allen County, is the largest urban center in the SDA and thesite of the SDA's central office. Outside of Allen County, the SDA is primarily rural, withmany small towns. The SDA's total population is approximately 500,000, about 93 percent ofwhom are white, with black residents making up the bulk of the remaining population. Anestimated 6 percent of the families in the Fort Wayne area had incomes below the federalpoverty level in 1979.
173

A strong recovery from the recession of the early 1980s dropped the unemployment ratefrom 8.9 percent in 1984, to 5.1 percent in 1987, to 4.8 percent in 1988. Some of the ruralcounties had unemployment rates well below this level. During 1988 and 1989, employers werehaving difficulties filling jobs, and some were seeking workers from outside the areaManufacturing remains the largest employer in the SDA, providing jobs for one-third of allworkers in 1987. Between 1983 and mid-1987, manufacturing employment increased by 26percent or 16,500 jobs, though many of the new manufacturing jobs paid less than heavyindustry jobs lost in the late 1970s and early 1980s. The average wage in the Fort Waynearea was $17,800 in program year 1986.
Program
The PIC is an incorporated nonprofit organization, which has an agreement withJob Works to administer the JTPA program through an office in each of the eight counties inthe SDA. Each Job Works office is responsible for its own intake, assessment, service delivery,and during the period of the study random assignment. A state ietiative to merge theactivities of the Indiana Employment Security Division (the state Employment Service) andJTPA led to greater cooperation between these two agencies at the local level and co-locationof offices in many of the rural counties surrounding Fort Wayne. Even before this, mostJob Works applicants had already registered with the Employment Security Division, and thosewho had not were required to register as part of JTPA intake.
Job Works offers a wide range of services, with the program emphasis varying by localoffice depending on the availability of service providers. The primary services offered are OJT,job search assistance, and in the areas close to Fort Wayne classroom training inoccupational skills. OJT and job search assistance are operated by the Job Works staff, whileall classroom training in occupational skills programs are run by service providers, most ofwhom operate under performance-based contracts. The site subcontracts with about 20 serviceproviders, with the usual number of clients ranging from 5 to 40 per program. Serviceproviders include local technical institutes and schools, community-based organizations, audother organizations that offer occupational training in a wide variety of areas or work withspecific populations such as youths or handicapped individuals.
Study Implementation
The intake process varied slightly from office to office, but generally random assignmentoccurred after the client had completed all application forms, been determined eligible forJTPA, been assessed by JobWorks staff, and been recommended for a specific service strategy.The Background Information Form for the study was completed along with other applicationmaterials, and the study was explained as part of the initial intake session. The InformedConsent Form was signed during an assessment interview. In the Fort Wayne office,assessment often involved extensive testing. In order to accommodate the study design,JobWorks staff in the Fort Wayne office agreed to reduce job search assistance duringassessment to approximately two hours.
Service strategy recommendations were made at the weekly staff meetings in the largeroffices and on an individual basis in the smaller offices. Fifty-eight percent of all personsrandomly assigned were recommended for OJT/JSA, 33 percent for other services, and 10
174
2 ,1 ()

percent for classroom training. Random-assignment calls were made on a batched basis atscheduled times, though individual calls at other times were also possible.
Over the course of random assignment, client recruitment became more of a problembecause of the decline in the unemployment rate. The SDA made extensive changes inrecruitment materials and introduced new procedures to retain a higher percentage ofapplicants in the program. Two small programs (one funded by the state for welfare recipientsas a lead into JTPA and a second for hard-to-serve youths) experienced special recruitmentproblems and were exempt from the study. Staff did notice that over time they were workingwith less skilled clients.
Random assignment began in this SDA in November 1987 and continued through August1989, reaching a total sample of 3,608.
HEARTLAND. FLA.: HEARTLAND
Study Context
The Heartland SDA serves five counties (De Soto, Hardee, Highlands, Polk, andOkeechobee) in central Florida between Tampa and Orlando. Seventy-five percent of theSDA's population resides in Polk County, the site of Lakeland (population 50,000), the largestcity in the SDA Winterhaven, a retirement community, is also in Polk County. The remainingfour counties are much less developed, though they are dotted with a number of cities andtowns. Eleven percent of families living in the SDA had incomes below the federal povertylevel in 1979.
Employment in the SDA is a mixture of manufacturing, services, and (near Orlando)tourism. The unemployment rate in the SDA stood at 11.3 percent in program year 1984,declining gradually to 9.4 percent in 1987 and to 8.1 percent in 1988. During the early 1980s,a major aircraft manufacturing facility closed, but after the start of the study, retail tradeemployment rose sharply with the opening of a major regional shopping center. Averageannual wages in program year 1986 were $15,200, among the lowest of the SDAs in the study.
The Program
The Heartland Private Industry Council (PIC), a nonprofit organization, operates theJTPA program within the SDA. At the time the study began, clients were served throughseven offices, three of which were in Polk County. OJTs are arranged by PIC staff, butclassroom training in occupational skills is subcontracted to approximately 10 service providersin a typical year, with the Polk County Board of Education being the largest. Though theseservice providers do recruit clients, the PIC staff conduct the JTPA intake and eligibilitydetermination. The Florida Employment Security Commission (ESC) offices in Lakeland andWinterhaven also provide job search assistance under a contract with the PIC and do conductJTPA intake.
Classroom training in occupational skills is the predominant service provided by the SDA.In program year 1986, two-thirds of all adult participants and almost 40 percent of youthsreceived this service. While recruitment had not been a problem in the mid-1980s, findingappropriate JTPA-eligible applicants for the more demanding courses could be difficult. At the
175
241

time the study began, the SDA planned to put somewhat more emphasis on OJT in its serviceplan.
Study Implementation
Since 80 percent of JTPA clients come from Polk County, implementation of the studywas limited to that area The Florida ESC offices in the county were also part of the study.Intake and eligibility determination were done in individual meetings with clients, duringwhich the study was explained and the Background Information Form and Informed ConsentForm were completed. Following this, eligible applicants were referred to assessment anextensive array of testing and counseling lasting up to six hours and culminating in thedevelopment of an employment development plan. Staff then designated a recommendedservice strategy for the study and reviewed with the applicant once again the Informed ConsentForm. As each assessment was completed, staff called MDRC for random assignment andinformed the client of the results. Special exclusions from the study included a limited numberof extreme hardship cases and applicants who had completed a state-funded remedial education
program and returned to JTPA for further training.The SDA began random assignment in May 1988. By October 1988, when only about500 persons had been randomly assigned, staff were concerned about the dramatic drop inapplicants and the shortfall in enrollments. This was occurring because of a decline in theunemployment rate in the SDA, the opening of the major retail center, and problems recruitingclients because of publicity about funding cuts in the SDA for JTPA services. All of thesefactors combined to present the SDA with a new challenge requiring more intensive recruiting
and better retention of applicants and new procedures to address the needs of hard-to-serveclients. Despite additional technical assistance on client recruiting and retention, the SDAcontinued to experience a major enrollment shortfall. After initially suspending randomassignment for two months, the SDA decided to end it in January 1989.
JACKSON. MISS.: CAPITAL AREA
Study Context
Three cities in northcentral Mississippi are served by the Capital Area SDA. They areJackson, Clinton, and Pearl, with Jackson having 85 percent of the total population of 239,000.Thirty-eight percent of the SDA's population is black and other minorities. An estimated 13percent of the families had incomes below the federal poverty level in 1979.
The unemployment rate was 6.9 percent in 1985 and 6.7 percent in 1986, and declinedto 5.6 percent in 1988. The largest source of jobs is the service sector. The state capital inJackson provides white-collar employment. Other service industries, such as hospitals, areanother major source of employment. The average wage in the SDA was $17,200 in programyear 1986.
176
t`.

The Program
The SDA is a consortium, with the city of Jackson serving as the administrative andplanning entity and grant recipient for the program. Staff, employed by the city in theDepartment of Human and Cultural Services, are housed in one central office. The SDA isthe grant recipient for Title II-A and II-8 funds, but does not operate Title II-A 3 and 8percent programs or Title III.
The SDA offers classroom training in a variety of occupational areas. Performance-based contracts are used to fund training in specific vocational areas such as health occupations,auto mechanics, truck driving, cooking, and security. JTPA is the primary source of businessfor a number of these contractors. Other contractors, including a community college andJackson State University, are funded to provide other services, including a 6- to 8-week jobclub/employability development program, which can lead to an OJT, and ABE and GEDclasses. A total of 12 contractors were utilized during the study period. In addition, SDA staffdevelop OJT positions and place participants in employment. Some of the OJTs are developedfor employer-referred candidates.
Study Implementation
Service providers are responsible for their own recruitment. The SDA has experiencedsome difficulty reaching enrollment targets for the white population. Sixty percent of theeligibility interviews are conducted by city JTPA staff at the SDA office, and 40 percent areheld at contractor sites prior to the start of new classes. Some applicants are screened by theprovider and then sent to the SDA office for the eligibility interview. When eligibility couldbe determined without additional follow-up during the initial interview, the random-assignmentphone call took place immediately. Otherwise, random assignment occurred after additionaldocumentation had been obtained, without the applicant being present. After randomassignment, those assigned to the treatment group were referred to the service providers, whodetermined whom they would enroll.
A variety of release and information forms, in addition to those required for the study,are required by the state for those enrolled in the program. Several months after randomassignment began, procedures were modified so that these additional forms were completedonly for individuals assigned to the treatment group.
The start-up of the study in February 1988 coincided with the release of additional fundsto the SDA by the state. Therefore, the SDA had to issue additional Requests for Proposalsand quickly initiate new programs just as assignments to the control group were beginning tooccur. The timing of these two events created some problems for the SDA, and a performanceadjustment was eventually needed over two program years, with random assignment ending inMarch 1989. Nevertheless, the SDA met its random-assignment sample goal several monthsearly and extended random assignment for one month in order to increase the sample abovethe original goal.
During the period of the study, 41 percent of the applicants were recommended forclassroom training, 37 percent for other services, and 22 percent for OJT/JSA. Individualsserved through a contract with vocational rehabilitation services were excluded from randomassignment.
177

JERSEY CITY. NJ.: CORPORATION FOR EMPLOYMENT AND TRAINING. INC.
Study Context
The Corporation for Employment and Training (referred to in this report as Jersey City)provides JTPA services to a single city area. This urban area, with a population of 224,000,is approximately 50 percent black, with the remainder of the residents divided primarily amongwhites, Hispanics, and Middle Eastern and Asian immigrants. With a population density of7,000 per square mile and 14.7 percent of the families with incomes below the federal povertylevel in 1979, the area shares problems similar to those confronting other large urban areas.
The overall average wage during the year preceding implementation of the study was$20,400. This average masks great differences in income within the community, with manylongtime minority residents earning much less and many recent arrivals in "gentrified"neighborhoods working in high-paid jobs elsewhere in the metropolitan area Theunemployment rate dropped from 10.9 percent in 1984 to 7.9 percent in 1987 and then to 7.2percent in 1988. However, many residents have sought employment outside the SDA becauseof a severe decline in manufacturing and the closing of many factories. The service sector,including financial institutions and distribution centers, are major employers, but wage rates arelower than in neighboring New York City.
The Proeram
The city contracted with the Corporation for Employment and Training, a private, non-profit organization that previously operated the CETA program, to administer the JTPA
The corporation administered the Title II-A 3 percent and 8 percent programs andTitle III in addition to the 78 percent and 6 percent funds, which are passed through to SDAsby the state.
The OJT program was implemented by in-house staff, who also provided directplacements and job search. The corporation subcontracted for classroom training inoccupational skills, using a total of 23 providers throughout the study period. Contracts wereperformance-based and often directed to specific service occupations. Training was providedin areas such as clerical, financial, health and food services, and drafting occupations. Oneprovider received funding to provide placement services to the Hispanic population during partof the study. Proprietary and business schools as well as vocational technical centers wereprimary contractors. The SDA increased its emphasis on individual referrals and contractstoward the end of the study implementation period.
Study Implementation
Applicants' first contact with the program was through the corporation or the contractor.Eligibility was determined at the corporation's intake office, and some brief testing wasconducted at that time. Applicants who were assessed and determined eligible were called infor random assignment at the end of the day. People assigned to the treatment group were
2The Corporation for Employment and Training lost its contract with Jersey City at the end ofJune 1990.
178
4 ) 4

notified of their status by phone or mail. Toward the end of random assignment, procedureswere modified and random assignment was completed while the applicant waited so that thoseassigned for services could be immediately referred to an appropriate service provider andenrolled by the end of the program year.
The corporation reported some difficulty recruiting youth throughout the study period,and some providers reported special recruit-ii..-nt problems. The random-assignment ratio wasadjusted at several point,, and then briefly suspended in order for the SDA to try to meet goalsfor the program year. 1 lthough the SDA met all the performance standards during the firstyear of the study, its performance was slightly down from the previous year, particularly in theentered employment rate for adults and youth. A performance adjustment was requested fromthe state, since this decline in performance affected the levels of incentive funds the SDAreceived. A small adjustment was approved.
Random assignment started in November 1987 and ended in September 1989, with a totalof 1,686 people in the sample. About 40 percent of the sample were recommended forclassroom training, while the other 60 percent were divided almost equally between OJT/JSAand the "ether services" strategy. The 3 percent program was excluded from the sample, as%Awe homeless people who had to be in a job training program to qualify for shelter.
LARIMER COUNTY, COLO.: LARIMER COUNTY
Study Context
Located in the northcentral part of the state, approximately 65 miles north of Denver,this rural county had a total population of 150,000 in 1980, 65 percent of whom lived in FortCollins or Loveland, site of the two JTPA offices. By the mid-1980s, the SDA's populationwas approximately 200,000. The population is predominantly white (92 percent in 1980); thelargest minority is Hispanic (6 percent). Only 5.9 percent of the families were classified ashaving incomes below the federal poverty level in 1979.
The county experienced strong growth in the late 1970s and early 1980s, but in the yearsimmediately preceding the study, unemployment began to rise from 4.8 percent in 1984 to7.4 percent in 1987. In 1988, however, unemployment had receded to 6.6 percent. The servicesector employs the largest number of workers, followed by trade and manufacturing. ColoradoState University is the largest employer, with Hewlett Packard and Anheuser-Busch next innumber of employees. The overall average wage in Larimer County was $17,500 in programyear 1986.
The Program
The county government is the planning and administrative entity and grant recipient forJTPA. SDA staff are county employees in a department called Larimer County Employmentand Training Services (ETS), but an active PIC guides the program. The SDA also administersthe Title II-A 3 percent program and Title III. Fort Collins is the administrative headquartersand serves about 60 percent of the SDA's clients, with the Loveland office serving theremainder. When the study started, the SDA and PIC also oversaw the local EmploymentService activities and staff, which are co-located with the SDA offices. But actions at the statelevel gradually resulted in a return to the more traditional, ..-,eparate administrative structure.
179
f)ti
4 5

ETS, because of its relatively small Title II-A 78 percent allocation, serves the majorityof its clients through short-term, low-cost, but highly structured activities, many conducted byits own personnel: job club, a three-week program with its own training area and phone bank,is offered monthly in each office; a one-week assessment program and youth competencyworkshops are also ongoing. A workshop to teach job retention skills was added.
Other programs are contracted to schools on a cost-reimbursement basis. Individualsrecommended for the classroom training service strategy begin their time in training with a two-week career planning program for JTPA participants conducted at Front Range CommunityCollege. EIS staff contribute to curriculum development and consult with instructors andclients in these programs. The high level of interaction between staff and other agencies isalso evidenced by a formal network of 19 community organizations, including groups notinvolved with JTPA, who meet regularly to foster coordination and develop solutions forindividual problem cases. The SDA has received national recognition for its networking system.
ETS, through the PIC, has also established itself as an employer resource in two keyways. First, several major companies have used ETS and the Employment Service as a centerfor screening and testing prospective employees. While both JTPA-eligible people and otherswho are not disadvantaged have been placed through this service, few of the large employersuse the OJT program. Second, as a service for employers, the PIC annually sponsors aBusiness Expo, bringing in experts to educate area employers.
Study I Dlementation
Before the study was implemented in December 1987, enrollment occurred prior toassessment in order to discourage the development of a screening process that might eliminatethe harder-to-serve. To accommodate the research design, the SDA decided to implement amini-assessment (locally called a pre-EDP) immediately following eligibility determination sothat applicants could be recommended for a service strategy prior to random assignment. ETSworked with a consultant to develop a checklist that was used to assist staff in determining anapplicant's appropriateness for each of the three service strategies.
Following the pre-EDP, the random-assignmentcall was placed and staff informed peopleof their research status in person. People assigned to the treatment group received additionalassessment either on the same day or shortly thereafter. Because of the large number ofparticipants served in job search and assessment, the "other services" strategy for this SDA wasset at the comparatively high level of 70 percent. During random assignment, 64 percent ofthe applicants were recommended for this strategy, and an unusually high percentage endedup enrolling only in miscellaneous services (sec Tables 7.3 and 7.4). Twenty percent of thepeople randomly assigned were recommended for classroom training in occupational skills, withonly 7 percent of those randomly assigned recommended for the OJT/JSA service strategy.
To avoid jeopardizing ETS's good relationship with other agencies, ETS and theresearchers conducted briefings on the study procedures for community agencies prior to thestart-up of random assignment. Groups not included in the research in this SDA were allindividuals 55 and over and referrals for service from Project Self-Sufficiency (PSS). PSS isa federally funded demonstration project designed to increase the self-sufficiency of AFDCrecipients. It uses the resources of multiple agencies to Frovide comprehensive servicesincluding housing, employment, and training services to help people make the transition fromwelfare to work.
180

Midway through random assignment, for about six months, the SDA also conductedgrouporientations prior to the eligibility interview. During these motivational sessions, a localizedversion of the random assignment videotape was shown. Recruitment activities did not changesubstantially during the sample build-up period, and particularly in the Loveland officeenrollment goals were difficult to meet.
Random assignment ended in Larimer County on September 30, 1989, with 1,027 peoplein the sample.
MARION, OHIO: CRAWFORD/HANCOCK/MARIONIWYANDOT COUNTIES
Study Context
Located in northcentral Ohio, this four-county SDA has a population of 206,000. Marionis the largest city, followed by Findlay; each has a population of about 36,000. The populationis predominantly white. Approximately 7 percent of the families had incomes below the federalpoverty level in 1979.
Economically, there is considerable variation. The county of Hancock has had the lowestunemployment rate in Ohio, while the other counties have been adversely affected by declinesin manufacturing. Overall, the unemployment rate for the area, which averaged 10.2 percentbetween 1984 and 1986, dropped to 8.3 percent in 1987 and to 6.8 percent in 1988. Theaverage annual wage in program year 1986 was $18,100.
The UP :ogfflin
The PIC is incorporated and serves as the administrative entity and grant recipient. Itsstaff includes employment advisors, testers, and basic education instructors. The centraladministrative office is in Marion. Five JTPA training centers are spread throughout the SDAand are staffed by PIC personnel, who conduct extensive assessments and provide casemanagement services. Through the training centers, participants can receive basic educationand GED courses, using computer-assisted instruction. PIC staff also conduct job club andarrange work experience and OJT placements. Classroom training in occupational skills isarranged on an individual basis through reimbursement contracts with vocational schools andtechnical colleges.
Participants formerly averaged approximately 40 weeks in the program as they movedthrough a variety of components designed to upgrade their skills. However, the decrease inthe unemployment rate, relative to other SDAs in the state, resulted in a reduction in Title II-A funds.
Study Implementation
Random assignment began in January 1988 and ended in July 1989, with 1,154 peoplein the sample, of whom more than 1,000 were recommended for services in either classroomtraining (49 percent) or OJT/JSA (40 percent). Exempted from the study were olderindividuals served with 3 percent funds and job-ready welfare recipients mandated to participatein a job club under a contract with the Department of Human Services in two of the counties(at one point, a third county also participated in this project).
181

Because the Title II-A funding was reduced, and fewer people could be served, therewere no recruitment problems during the period of random assignment. In the spring of 1989,enrollments for all groups except AFDC recipients were frozen because of the fundingshortage.
The need to identify service strategies prior to random assignment caused the SDA tolengthen its assessment process in some cases to ensure that applicants were assigned to thecorrect services. Assessments were individualized, but all applicants were given the samebattery of tests during half-day assessment sessions. The testing technician also provided thegeneral orientation to the program and briefly explained the study. After the tests anddetermination of eligibility, applicants met with an employment advisor to make their goalsfinal. For some people, determination of the appropriate service strategy was a short process;for others, it could extend over several days or weeks. Employment advisors would then discusstheir cases at a staff meeting so that the final decision could be made about an appropriateservice strategy. Subsequently, all cases handled in that week were called in for randomassignment. Applicants were notified of their status by phone or letter, depending on howsoon a service was scheduled to begin.
NORTHWEST MINNESOTA: NORTHWEST MINNESOTA
Study Context
The Northwest Minnesota Private Industry Council (PIC) serves seven counties (Kittson,Marshall, Norman, Pennington, Polk, Red Lake, and Roseau), which comprise a very rural areain the corner of the state abutting North Dakota and Canada. The population of the entireSDA is about 100,000, and its three largest towns (Crookston, East Grand Forks, and ThiefRiver Falls) each has slightly under 10,000 residents. The population is primarily white, andabout 11 percent of all families had incomes under the federal poverty level in 1979.
The local economy is agriculture-based, with farming, food processing, and related tradebeing the major industries. The severe winters make for a short growing season, and sugarbeets, potatoes, and wheat are the primary crops. The unemployment rate in the SDA stoodat 103 percent in 1984 and remained above 9 percent until 1987, when it dropped to 8.6percent. By 1988 unemployment had fallen to 8 percent. The average annual wage of $13,600in program year 1986 was the lowest of any SDA in the study.
The Program
The PIC is an incorporated nonprofit organization that is the JTPA grant recipient. Itdoes some client recruitment, but the high unemployment rate has allowed the JTPA programto rely primarily on walk-ins and referrals from other social service and education agencies.The Minnesota Job Service operates most of the JTPA program in the SDA under asubcontract from the PIC. In offices in Crookston and Thief River Falls, Job Service staffoffer the usual state Employment Service job listings plus JTPA and other state-fundedprograms for welfare recipients. The local community action agency conducts intake for a smallolder workers' program, which provides work experience and job search assistance.
182

Job Service staff directly provide job search assistance, career exploration, OJT, and workexperience. They refer people interested in classroom training in occupational skills to thelocal community college, technical institute, or campus of the state university. Those seekingadult basic education and a GED are referred to a local adult learning center for services. Alocal technical institute also provides an intensive job search assistance course, primarily forthose participating in classroom training in occupational skills. OJT and classroom training inoccupational skills are the two most common Title II-A services.
Study Implementation
Job Service staff offered all those who inquired about their services an orientation to thevarious programs available. Those who appeared to be eligible for JTPA and interested in itsservices then completed a JTPA application. Job Service staff then determined JTPA eligibility,conducted an assessment of needs, and designated appropriate services.
Study procedures were integrated into the usual Job Service intake by completion of theBackground Information Form and Informed Consent Form during an initial meeting with theclient. In Thief River Falls, much of this paperwork was done in a group, while the Crookstonstaff completed study forms during an individual meeting with clients. Choice of theappropriate service strategy was typically made based on an individual meeting with the client,during which an assessment of needs, interests, and current skills was made. Staff then calledMDRC for random assignment and informed the client of the result and next steps.
The main issue that had to be addressed in implementing the study concerned a state-funded welfare employment program (PATHS). The Job Service had a contractual obligationto use JTPA funds to serve welfare recipients referred by the county welfare departments.These referrals were excluded from random assignment and were not a part of the study.
Random assignment began in August 1988 and ended in May 1989. The SDA sligl- tlyexceeded its target sample of 550. Virtually all those randomly assigned had beenrecommended for intensive services such as OJT/JSA (69 percent) and classroom training (31percent).
OAKLAND. CALIF.: OAKLAND
Study Context
The City of Oakland, with a population of 340,000, is one of 49 service delivery areasin California. Its population is approximately 40 percent white, 30 percent black, 25 percentAsian, and 5 percent other minorities. There are 6,300 residents per square mile, and 8.7percent of the families had incomes below the federal poverty level in 1979.
Major industries are transportation (including shipping), manufacturing, government, andhealth care. Large employers are Kaiser, Pacific Bell, Merritt-Peralta Medical Supplies, CivicGas and Electric, and Childrens Hospital. The unemployment rate fluctuated in the yearspreceding the study's implementation: it was 7.0 percent in 1984, 6.8 percent in 1985, 8.7percent in 1986, 7.7 percent in 1987, and 6.6 percent in 1988. The overall average annualwage in the city was S22,000 in program year 1986.
183

The Program
The PIC is incorporated and shares administrative responsibility for the program with theCity of Oakland. The city is also the grant recipient and planning entity for the program. ThePIC and city have defined their oversight and administrative functions so that the city isresponsible for determining applicants' eligibility for programs and for tracking participationin the SDA's programs, while the PIC awards and monitors contracts for services.
A subsidiary of the PIC the Oakland Private Sector Corporation (OPSC) providesdirect client services. The SDA also contracts with numerous outside agencies to provideservices to the eligible population. Outside of OPSC, contracts tend to be targeted to serveparticular subgroups or to provide training through one of three recommended service strategiesdefined for the research. All subcontracts are performance-based.
Classroom training in occupational skills is the predominant service. Seven of thecontractors (community-based, private for-profit, and nonprofit organizations) providedclassroom training in occupational skills. Two of these also had contracts to provide OJT,along with another contractor whowas also funded to develop OJTs, primarily with the Koreanpopulation. Two other contractors provided job search services, with one of them targetingservices to people 55 and over and the other enrolling veterans.
OPSC, the largest contractor, provides classroom training in occupational skills, OJT, andother services to all JTPA-eligibles and conducts an older workers' program with Title II-A 3percent and 78 percent funds. At the same time the study began, a new program, fundedthrough Title II-A 6 percent funds, was initiated to provide training in nontraditional jobs. TheCenter for Employment and Training (CET), the second largest contractor, conducts trainingprograms in four occupational areas office occupations, shipping and receiving, automechanics, and maintenance and provides a small number of OJTs.
Study Implementation
The procedures for the study were integrated into the normal operations of the SDAwith relatively few changes in the flow. However, the involvement of multiple organizations,providing different services to different subgroups, made the process of adapting the study tothe site complex. Because of multiple population subgroups with varying degrees of proficiencyin English, the agreement to participate form was translated into nine languages. In addition,the exclusion of several programs and all youths from the study sample complicated the initialscreening process.
Youths were excluded from the study because of recruitment problems with this group.A residential treatment program for court-referred offenders was excluded. Also excluded wasa basic education program funded through Title II-A 8 percent funds. These funds werecarried over from the previous year and then targeted to serve AFDC recipients in a statewelfare-to-work initiative. Also exempted from the study were a program provided through anagreement with the Department of Vocational Rehabilitation to place people with handicapsin jobs and a program for homeless individuals (paid for with 6 percent funds).
Although contractors were responsible for recruitment for their own programs, peoplealso applied to JTPA by going to the SDA's central intake unit. In order to identify theappropriate service strategy for applicants, providers were divided into two groups: those thatoffered only one major category of service (classroom training in occupational skills, off, orjob search) and those that could offer multiple types of services. The first group was labeled
184

"single service providers" and the second group, represented by CET and OPSC, "multipleservice providers." The following description of the flow is the same for both groups, exceptthat CET and OPSC completed most of their assessment, recommended people for servicestrategies, and placed the random-assignment phone call themselves after eligibility had beendetermined.
In most cases, clients applied for programs directly at the service provider. In theseinstances, contractors conducted program orientations and assessments, which varied in lengthand intensity. During the initial meeting(s), the study was explained and the BackgroundInformation Form (BIF) was given to the applicant along with other intake documents neededfor the eligibility interview. Contractors, particularly those that served predominantly limited-English-speaking clients, sometimes helped applicants complete the BIF. Eligibility interviewswith city staff were then scheduled at either the central intake unit or the service provider site.The BIF was finalized, the agreement to participate form signed, and the random-assignmentphone call made during this interview, assuming all supporting documentation was available.
As noted above, some clients applied directly to the JTPA office. Applicants whoseinitial point of contact was the central intake unit had their eligibility determined and the studyexplained. Then they signed the BIF and agreement to participate form. After a briefassessment of interest, the appropriate activity category was identified and random assignmenttook place, followed by the referral of those in the treatment group to the appropriateprovider.
Random assignment began in July 1988 and ended in March 1989, with 1,072 peoplerandomly assigned, slightly more than the targeted sample. Classroom training was thepredominant recommended service strategy, with 50 percent of the sample recommended forthis strategy; 8 percent were recommended for OJT/JSA.
OMAHA. NEB.: JOB TRAINING OF GREATER OMAHA
Study Context
Located in eastern Nebraska, this SDA serves approximately 500,000 people and includesthe greater Omaha metropolitan area. The largest county is Douglas, with a population of398,000, of whom 312,000 live within the Omaha city limits The SDA also includes Sarpy(population 86,000) and Washington (population 16,000) counties. The majority of thepopulation is white, with black residents making up the largest minority group. In 1979, 6.6percent of all families had incomes below the federal poverty level.
The employment base includes large manufacturing and transportation employers as wellas jobs in clerical and administrative work and sales and sales-related employment. TheStrategic Air Command (SAC.) is the largest employer, followed by other large service-sectorfirms.
The unemployment rate ranged between 4.7 percent and 5.6 percent in the four yearspreceding the study. In 1987, it was 5 percent, dropping to 4.4 percent in 1988. The averageannual wage was $17,700 in program year 1986.
185

The Fromm
The Job Training of Greater Omaha SDA (formerly called the Omaha Office ofEmployment Resources) provides JTPA services in the three-county area The city of Omahais the administrative entity and grant recipient, but an active PIC guides the program and isclosely involved in major decisions. The SDA also administers Title III Eight percent fundsare used to enroll people in basic education classes combined with work experience; these areusually followed by OJT or classroom training in occupational skills. Eight percent funds arealso used for classroom training in occupational skills and other classes at the local communitycollege.
Classroom training in occupational skills is the predominant service for Title II-A JTPAparticipants. During implementation of the study, most participants in this service were trainedthrough five major contractors, predominantly community-basedorganizations. Classes providedtraining in service occupations, such as health services, cooking, finance, office equipmentrepair, and clerical work. Contracts were performance-based. Job search is conducted by in-house staff, who also monitor and arrange OJT placements.
Study Implementation
The service providers were responsible for recruitment, a function that had been assignedto them the year before the study began. However, the SDA also provided general recruitmentfor the program as a whole. Intake, consisting of completion of an application and eligibilitydetermination, was normally performed at the central Omaha office. (The office moved to anew location in early 1989.) During the intake interview, the Background Information Formwas filled out by staff and the study was briefly explained. Eligible applicants were thenreferred to an assessment and testing workshop, also conducted by SDA staff. At theworkshop, the videotaped explanation of the study was shown and the Informed Consent Formwas signed. Staff meetings for groups completing the assessment and testing workshop wereused to approve counselors' recommendations of services.
People recommended for the classroom training service strategy were referred to theappropriate contractor for a provider's assessment. People determined appropriate by thecontractors were then scheduled for an employability development plan (EDP) interview withSDA staff, which could take place in-person or by phone. After the EDP interview, SDAstaff completed random assignment and notified the contractor and applicant of his or herstatus. People recommended for OJT/JSA were scheduled to meet with an SDA job developerfor an EDP interview immediately following the staff meetings discussed above. Randomassignment took place after the plan was made final.
To implement the study, several changes were made in the assessment and testingworkshop. Previously, the workshop had extended over two days and was followed, for someapplicants, by a two-day job search assistance workshop. However, the SDA had difficultyretaining people through this whole process and requested on-site training by Cygnet Associatesprior to the start of the study. As a result of the training, the workshop was shortened to ahalf-day. The SDA also sought to discourage contractors from conducting an additionalassessment, although some continued to require their own job-readiness assessment.
Seventy-three percent of the people randomly assigned were recommended for theclassroom training service strategy. OJT/JSA was the second most frequently recommendedservice strategy, accounting for about 22 perctnt of the sample.
186
Random assignment began in October 1988 and continued through September 1989, with1,362 people randomly assigned. In program year 1988, the SDA did not meet the adultentered employment rate standard, and the director did not request an adjustment. In programyear 1989, the SDA rwtived adjustments in its adult and welfare entered employment ratestandards. The original sample goal of 1,600 was not met because two months before the studyended, the SDA was authorized to exempt from random assignment applicants recruited andreferred for intake by the contractors.
PROVIDENCE. R.I.: PROVIDENCE/CRANSTON
Study Context
The Providence/Cranston SDA serves theie two adjacent, older urban areas in northeastRhode Island. Providence, with a population of approximately 155,000, is the state capital andlargest city in the state, while Cranston has approximately 70,000 residents. About 8 percentof the residents of the SDA are blacks, and all minority groups comprise 13 percent of thetotal population. Nine percent of families in the SDA had incomes below the poverty levelin 1979.
The Providence/Cranston area has historically been one of the most industrialized in thecountry, with a higher than usual percentage of employment in manufacturing. In recent years,several of the state's major employers (makers of jewelry and silverware and the U.S. Navy)cut back employment, but other sectors (including services) grew with the New Englandrecovery of the early and mid-1980s. Unemployment in the SDA stood at 7.2 percent in 1984,but dropped to 4.3 percent in 1987 and to 3.7 percent in 1988 as the SDA benefited from thethen-booming regional high-tech and services economy. The average annual wage in the SDAin program year 1986 was $17,000.
The Proeram
The Providence/Cranston Job Training Partnership (PCJTP) is the grant recipient andadministers the program through offices in each of the two cities in the SDA. Recruitmentof clients, done by both the PCJTP and service providers, has become increasingly a challengeas the area's unemployment rate dropped throughout the mid-1980s. Intake, eligibilitydetermination, assessment, and counseling are performed by the SDA staff in each office,though the Cranston office must file case documentation of eligibility in the main Providenceoffice before assessment can be scheduled.
PCJTP staff arrange OJTs for clients, but the remainder of SDA services are providedby subcontractors operating under a mix of performance-based and cost-reimbursementcontracts. Among the services provided in this way have been adult basic education, Englishas a second language, classroom training in occupational skills, vocational exploration programs(pre-employment skills and work experience for youths), and job clubs.
Study Implementation
PCJTP staff conduct intake, eligibility determination, and assessment of applicants. TheBackground Information Form and Informed Consent Form were completed as part of an
187

assessment interview. During the assessment interview, the counselor determined whetherfurther testing was required. If not, as was often the case for those recommended for OJT,job search assistance, and vocational exploration, staff called MDRC for random assignmentduring the assessment interview and informed the client of the result at that time. If furthertesting was needed, as was possible for classroom training in occupational skills, this additionalassessment was completed before random assignment occurred.
The increasing difficulty the SDA faced in recruiting clients because of the decline in thearea's unemployment rate created issues in the implementation of the study. Early in randomassignment, the SDA encountered serious problems recruiting youths and meeting the required40 percent of expenditures for services to youths. This was soon followed by problemsrecruiting adults. To allow continuation of the study, the random-assignment ratio was changedto ease the recruitment difficulties. Service providers also did less intensive testing ofapplicants, and some shifted to individualized open/entry, open/exit services as opposed totraditional group training.
The SDA did not meet two of its adult standards in program year 1987, in part becauseof the attention paid throughout the year to the problems in youth programs. The state didnot adopt adjustments in the performance standards suggested by the U.S. Department ofLabor, and incentive funds to the SDA declined as a result.
Random assignment began in this SDA in November 1987 and ended in September 1989,with the SDA meeting its sample target.
SPRINGFIELD. MO.: JOB COUNCIL OF THE OZARKS
Study Context
The Job Council of the Ozarks SDA, located in southwestern Missouri, serves sevencounties: Christian, Dallas, Greene, Polk, Stone, Taney, and Webster. Springfield (population133,000), in Greene County, is the largest city and the location of the SDA's central office.The SDA is primarily rural, with a total population of 304,000, of whom more than 90 percentare white. An estimated 10 percent of the families had incomes below the federal poverty levelin 1979.
The economy has been strong, with employment increasing in both the service sector,which employs the majority of the labor force, and manufacturing. Greene County also hashad a strong agribusiness base. The unemployment rate has gradually declined in recent years,from 7.7 percent in 1984, to 5.7 percent in 1987, to 5.3 percent in 1988; in areas that arestrongly influenced by tourism, seasonal changes can bring the rate as high as 20 percent. Theaverage wage in program year 1986 was $15,200.
The Program
The City of Springfield Human Resources Department is the administrative entity andgrant recipient. JTPA services are provided through the Job Council of the Ozarks, with full-service offices in Springfield, Branson, and Bolivar, a regularly staffed outreach office inBuffalo, and application sites in Kimberling City and Marshfield. Staff in each office areresponsible for intake, assessment, service delivery, and implementation of the study procedures.
188

The PIC and local elected officials act as policymakers and planners and provide programoversight.
Most of the classroom training in occupational skills programs are located in theSpringfield area and transportation is a problem for many SDA residents, so there is heavyreliance on OJT programs to meet the population's training needs. Classroom training inoccupational skills was provided primarily in health occupations, with programs such as licensedpractical nursing and respiratory therapy. Welding, office occupations, and auto mechanics werealso among the offerings. GED training was provided to dropout youths through areimbursement contract with a community-based organization. Youths also received pre-employment skills training and job placement services. Work experience and a job-seekers'clinic were provided for both adults and youths.
The Job Council of the Ozarks consistently had high outcomes on performance standards.However, in program year 1986, the average wage for adults employed fell slightly below themodel-adjusted standard.
Study Implementation
The SDA made significant changes in its recruitment, intake, and assessment processmidway through the implementation of random assignment. Using the training provided byCygnet Associates, it streamlined its enrollment process, eliminating an initial screeninginterview and some tests and emphasizing program benefits. SDA staff developed a variety ofmaterials to explain and facilitate implementation of the study.
In the Springfield office, applicants were scheduled for motivational group orientations,dut:ng which the study was explained, the Informed Consent Form signed, and the BackgroundInformation Form (BIF) handed out with a list of other documents the applicant would needfor the eligibility interview. Applicants were then scheduled to see a technician, whodetermined eligibility, briefly assessed the applicant to determine appropriate activities, andcompleted the BIF. While the applicant waited, a clerk made the random-assignment call andthe applicant was informed of the results. People assigned to the treatment group were thenreferred to the next step in the service plan, which was agreed to during the assessment.
Procedures for the other, smaller offices did not include the group orientation.Applicants were informed in-person or by phone about the study and the paperwork neededto determine eligibility. Whenever feasible, the eligibility interview and assessment and random-assignment phone call occurred during a single visit.
Recruitment was difficult owing to the low unemployment rate, and staff reported thatthey did relax some of their entry requirements during the study. Because of various concerns,a decision was made to shorten the lenrth of random assignment from 17 to 12 months. Thestudy did affect the SDA's ability to fully expend Title II-A funds, and the SDA said thatperformance declined, although performance standards were met.
Over the study period, about 65 percent of those randomly assigned were recommendedfor the OJT/JSA service strategy, about 17 percent were recommended for the classroomtraining strategy, and 18 percent were recommended for the other service strategy. The 3percent program, administered outside the SDA, was excluded from the study, as was thelicensed practical nurse training. The research design was modified to enable the SDA to adda short OJT component for some classroom training participants.
Random assignment began in April 1988 and continued through March 1989. A totalof 1,202 people were assigned for the study sample.
189

APPENDIX B
SUPPLEMENTAL TABLES TO CHAPTERS 4. 5. AND 6

TABLE B.1
PERCENTAGE DISTRIBUTIONS OF SERVICE STRATEGY RECOMMENDATIONSFOR ADULT MALE TREATMENT GROUP MEMBERS,
BY SELECTED BASELINE CHARACTERISTICS
Characteristicand Subgroup
SampleSize
ClassroomTraining
(%)OJT /JSA
(%)
OtherServices
(%)
All Adult Male TreatmentGroup Members 3,759 24.6 48.7 26.4
Age22-29 1,676 26.6 48.1 25.430-44 1,628 23.6 ** 49.6 26.845 and over 455 21.1 ** 48.1 30.8 **
EthnicityWhite, non-Hispanic 2,142 19.6 59.6 20.8Black, non-Hispanic 1,084 33.7 *** 29.8 *** 36.5 ***Hispanic 365 21.9 48.8 *** 29.3 ***Other 168 35.7 *** 32.1 *** 32.1 ***
Education
High school diploma or GED 2,410 27.0 48.3 24.7No high school diploma or GED 1,092 20.1 *** 51.1 28.8 ***
Work ExperienceWorked 13 weeks or more
in 12 months before assignment 1,977 25.7 50.8 23.4Worked fewer than 13 weeks
in 12 months before assignment 1,405 24.0 47.6 * 28.4 ***
Public Assistance ReceiptNot receiving AFDC or other cashassistance at assignment 2,770 24.5 48.6 26.8
Receiving AFDC or other cashassistance at assignment 546 27.5 55.5 *** 17.0 ***
Barriers to Employment (a)None 1,503 26.7 48.0 25.31 1,508 22.9 ** 49.1 28.02 607 24.7 49.8 25.53 107 18.7 * 57.9 ** 23.4
(continued)
192 ( ) r- -,% r

TABLE B.1 (continued)
Characteristicand Subgroup
SampleSize
ClassroomTraining
(%)
OJT/JSA
(%)
OtherServices
(%)
AFDC HistoryNever received AFDC 3,419 24.3 48.7 27.0Received AFDC less than2 years (b) 233 28.3 48.5 23.2
Received AFDC 2 yearsor more (b) 58 20.7 69.0 *** 10.3 ***
Household CompositionSpouse present 1,270 23.9 53.9 22.1No spouse present, child present 281 24.6 42.7 *** 32.7 ***No spouse present, no childpresent 1,885 25.1 48.1 *** 26.8 ***
SOURCE: MDRC calculations from Background Information Form responses.
NOTES: Calculations for this table are based on data for all adult male treatmentgroup members in the 18-month study sample. The total sample size may vary amongcharacteristics because of missing data for some treatment group members.
Distributions may not total 100.0 percent because of rounding.For each characteristic, within each service strategy, a chi-square test
was applied to the difference in service strategy recommendation rates between thefirst subgroup listed and, separately, each of the remaining subgroups. Statisticalsignificance levels are indicated as * = 10 percent; ** = 5 percent; *** = 1 percent.
(a) The bathers to employment include: not having a high school diplomaor GED at the time of random assignment; having worked fewer than 13 weeksduring the 12 months prior to random assignment; and receiving AFDC or othercash assistance at the time of random assignment.
(b) The AFDC receipt may not have been continuous.
19.3

TABLE B.2
PERCENTAGE DISTRIBUTIONS OF SERVICE STRATEGY RECOMMENDATIONSFOR ADULT FEMALE TREATMENT GROUP MEMBERS,
BY SELECTED BASELINE CHARACTERISTICS
Characteristicand Subgroup
SampleSize
ClassroomTraining
(%)OJT/JSA
(%)
OtherServices
(%)
All Adult Female TreatmentGroup Members 4,465 44.0 35.0 21.0
Age22-29 1,974 46.8 34.3 18.830-44 1,922 45.6 33.6 20.845 and over 569 29.2 *** 41.8 *** 29.0 ***
EthnicityWhite, non-Hispanic 2,433 39.8 40.2 20.1Black, non-Hispanic 1,377 48.3 ***. 31.2 *** 20.5Hispanic 507 50.5 *** 23.5 *** 26.0 ***Other 148 52.0 *** 24.3 *** 23.6
EducationHigh school diploma or GED 2,989 45.3 35.3 19.4No high school diploma or GED 1,174 40.9 *** 35.9 23.2 ***
Work ExperienceWorked 13 weeks or morein 12 months before assignment 1,797 41.4 38.3 20.3
Worked fewer than 13 weeksin 12 months before assignment 2,092 47.9 *** 31.7 *** 20.3
Public Assistance ReceiptNot receiving AFDC or other cash
assistance at assignment 2,437 37.4 39.8 22.8Receiving AFDC or other cash
assistance at assignment 1,683 54.7 *** 27.5 *** 17.8 ***
Barriers to Employment (a)None 1,314 37.7 40.5 21.81 1,624 42.2 ** 36.4 ** 21.42 1,160 50.8 *** 29.9 *** 19.33 335 53.7 *** 26.3 *** 20.0
(continued)
194
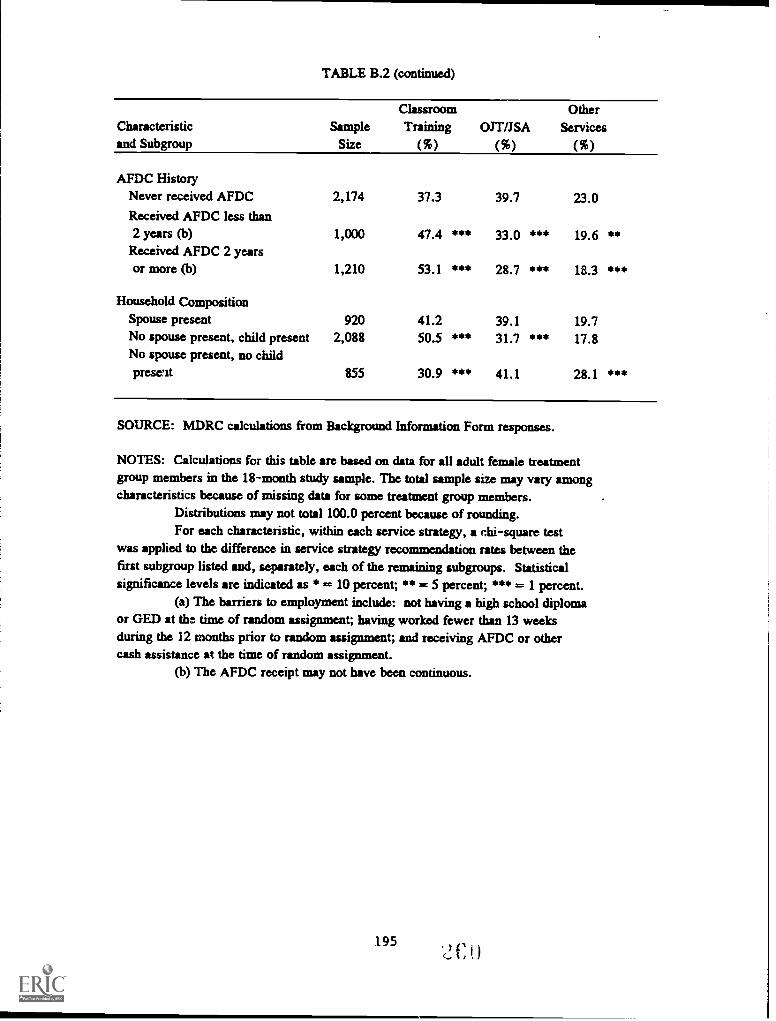
TABLE B.2 (continued)
Characteristicand Subgroup
SampleSize
ClassroomTraining
(%)
OJT/JSA
(%)
OtherServices
(%)
AFDC HistoryNever received AFDC 2,174 37.3 39.7 23.0Received AFDC less than2 years (b) 1,000 47.4 *** 33.0 *** 19.6 **
Received AFDC 2 yearsor more (b) 1,210 53.1 *** 28.7 *** 13.3 ***
Household CompositionSpouse present 920 41.2 39.1 19.7No spouse present, child present 2,088 50.5 *** 31.7 *** 17.8No spouse present, no childpresent 855 30.9 *** 41.1 28.1 ***
SOURCE: MDRC calculations from Background Information Form responses.
NOTES: Calculations for this table are based on data for all adult female treatmentgroup members in the 18-month study sample. The total sample size may vary amongcharacteristics because of missing data for some treatment group members.
Distributions may not total 100.0 percent because of rounding.For each characteristic, within each service strategy, a chi-square test
was applied to the difference in service strategy recommendation rates between thefirst subgroup listed and, separately, each of the remaining subgroups. Statisticalsignificance levels are indicated as * = 10 percent; ** = 5 percent; *** = 1 percent.
(a) The barriers to employment include: not having a high school diplomaor GED at the time of random assignment; having worked fewer than 13 weeksduring the 12 months prior to random assignment; and receiving AFDC or othercash assistance at the time of random assignment.
(b) The AFDC receipt may not have been continuous.
195C

TABLE B.3
PERCENTAGE DISTRIBUTIONS OF SERVICE STRATEGY RECOMMENDATIONSFOR MALE YOUTH TREATMENT GROUP MEMBERS,
BY SELECTED BASELINE CHARACTERISTICS
Characteristicand Subgroup
SampleSize
ClassroomTraining
(%)OJT/JSA
(%)
OtherServices
(%)
AB Male Youth TreatmentGroup Members 1,436 29.9 32.9 37.3
Age16-19 892 33.2 27.4 39.520-21 544 24.4 *** 41.9 *** 33.6 **
EthnicityWhite, non-Hispanic 771 27.2 42.4 30.4Black, non-Hispanic 424 25.5 19.1 *** 55.4 ***Hispanic 211 50.2 *** 27.5 *** 22.3 **Other 30 16.7 20.0 ** 63.3 ***
EducationHigh school diploma or GED 564 27.8 47.0 25.2No high school diploma or GED 814 31.2 22.9 *** 45.9 *4*
Work ExperienceWorked 13 weeks or more
in 12 months before assignment 694 28.2 41.4 30.4Worked fewer than 13 weeks
in 12 months before assignment 616 32.1 25.6 *** 42.2 ***
Pub li A.ssistance ReceiptIslf receiving AFDC or other cash
assistance at assignment 1,120 29.1 34.4 36.5Receiving AFDC or other cash
assistance at assignment 158 35.4 31.0 33.5
Barriers to Employment (a)None 371 25.6 48.8 25.61 607 30.1 33.1 *** 36.7 ***2 384 33.3 ** 19.5 *** 47.1 ***3 71 32.4 19.7 *** 47.9 *4*
(continued)
196

TABLE B.3 (continued)
Characteristicand Subgroup
SampleSize
ClassroomTraining
(%)
OJT/JSA
(%)
OtherServices
(%)
AFDC HistoryNever received AFDC 1,406 29.9 32.6 37.6
Received AFDC less than2 years (b) 20 35.0 60.0 *4' 5.0 **
Received AFDC 2 yearsor more (b) 3 0.0 (c) 0.0 (c) 100.0 (c)
Household CompositionSpouse present 147 21.1 54.4 24.5No spouse present, child present 58 39.7 *** 27.6 *** 32.8No spouse present, no childpresent 1,159 30.5 ** 31.3 *** 38.2 ***
SOURCE: MDRC calculations from Background Information Form responses.
NOTES: Calculations for this table are based on data for all male youth treatmentgroup members in the 18-month study sample. The total sample size may vary amongcharacteristics because of missing data for some treatment group members.
Distributions may not total 100.0 percent because of rounding.For each characteristic, within each service strategy, a chi-square test
was applied to the difference in service strategy recommendation rates between thefirst subgroup listed and, separately, each of the remaining subgroups. Statisticalsignificance levels are indicated as * = 10 percent; ** = 5 percent; *** = 1 percent.
(a) The bathers to employment include: not having a high school diplomaor GED at the time of random assignment; having worked fewer than 13 weeksduring the 12 months prior to random assignment; and receiving AFDC or othercash assistance at the time of random assignment.
(b) The AFDC receipt may not have been continuous.(c) A chi-square test was inappropriate because of low expected cell frequencies.
2c2197
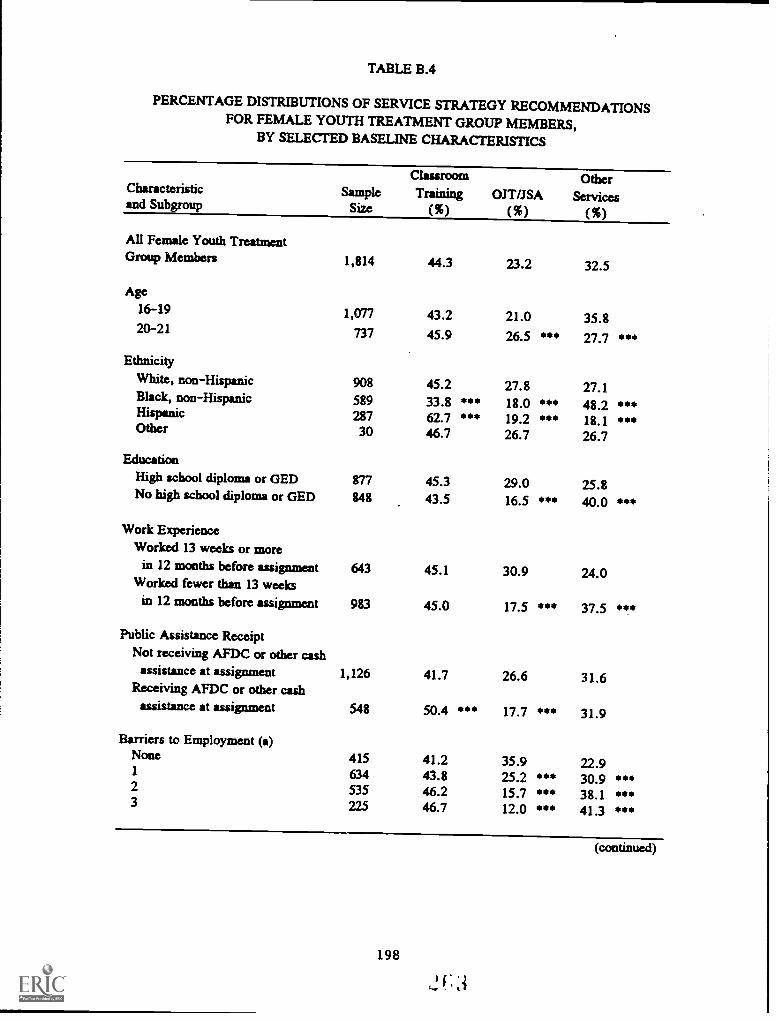
TABLE B.4
PERCENTAGE DISTRIBUTIONS OF SERVICE STRATEGY RECOMMENDATIONSFOR FEMALE YOUTH TREATMENT GROUP MEMBERS,
BY SELECTED BASELINE CHARACTERISTICS
Characteristicand Subgroup
SampleSize
ClassroomTraining
(%)OJT /JSA
(%)
OtherServices
(%)
All Female Youth TreatmentGroup Members 1,814 443 23.2 32.5
Age16-19 1,077 43.2 21.0 35.820-21 737 45.9 26.5 *** 27.7 ***
EthnicityWhite, non-Hispanic 908 45.2 27.8 27.1Black, non-Hispanic 589 33.8 *** 18.0 *** 48.2 ***Hispanic 287 62.7 *** 19.2 *** 18.1 ***Other 30 46.7 26.7 26.7
EducationHigh school diploma or GED 877 45.3 29.0 25.8No high school diploma or GED 848 43.5 16.5 *** 40.0 ***
Work ExperienceWorked 13 weeks or more
in 12 months before assignment 643 45.1 30.9 24.0Worked fewer than 13 weeks
in 12 months before assignment 983 45.0 17.5 *** 37.5 ***
Public Assistance ReceiptNot receiving AFDC or other cash
assistance at assignment 1,126 41.7 26.6 31.6Receiving AFDC or other cash
assistance at assignment 548 50.4 *** 17.7 *** 31.9
Bathers to Employment (a)None 415 41.2 35.9 22.91 634 43.8 25.2 *** 30.9 **02 535 46.2 15.7 *** 38.1 ***3 225 46.7 12.0 *** 41.3 *4*
198
(continued)

TABLE B.4 (continued)
Characteristicand Subgroup
SampleSize
ClassroomTraining
(%)
OJT/JSA
(%)
OtherServices
(%)
AFDC HistoryNever received AFDC 1,287 42.3 24.7 32.9Received AFDC less than2 years (b) 384 47.9 * 20.3 * 31.8
Received AFDC 2 yearsor more (b) 129 52.7 ** 16.3 ** 31.0
Household CompositionSpouse present 197 45.7 28.9 25.4No spouse present, child present 607 46.1 21.9 ** 32.0 *No spouse present, no childpresent 880 42.0 23.6 34.3 **
SOURCE: MDRC calculations from Background Information Form responses.
NOTES: Calculations for this table are based on data for all female youth treatmentgroup members in the 18-month study sample. The total sample size may vary amongcharacteristics because of missing data for some treatment group members.
Distributions may not total 100.0 percent because of rounding.For each characteristic, within each service strategy, a chi-square test
was applied to the difference in service strategy recommendation rates between thefirst subgroup listed and, separately, each of the remaining subgroups. Statisticalsignificance levels are indicated as * 2= 10 percent; ** = 5 percent; *** = 1 percent.
(a) The bathers to employment include: not having a high school diplomaor GED at the time of random assignment; having worked fewer than 13 weeksduring the 12 months prior to random assignment; and receiving AFDC or othercash assistance at the time of random assignment.
(b) The AFDC receipt may not have been continuous.
199
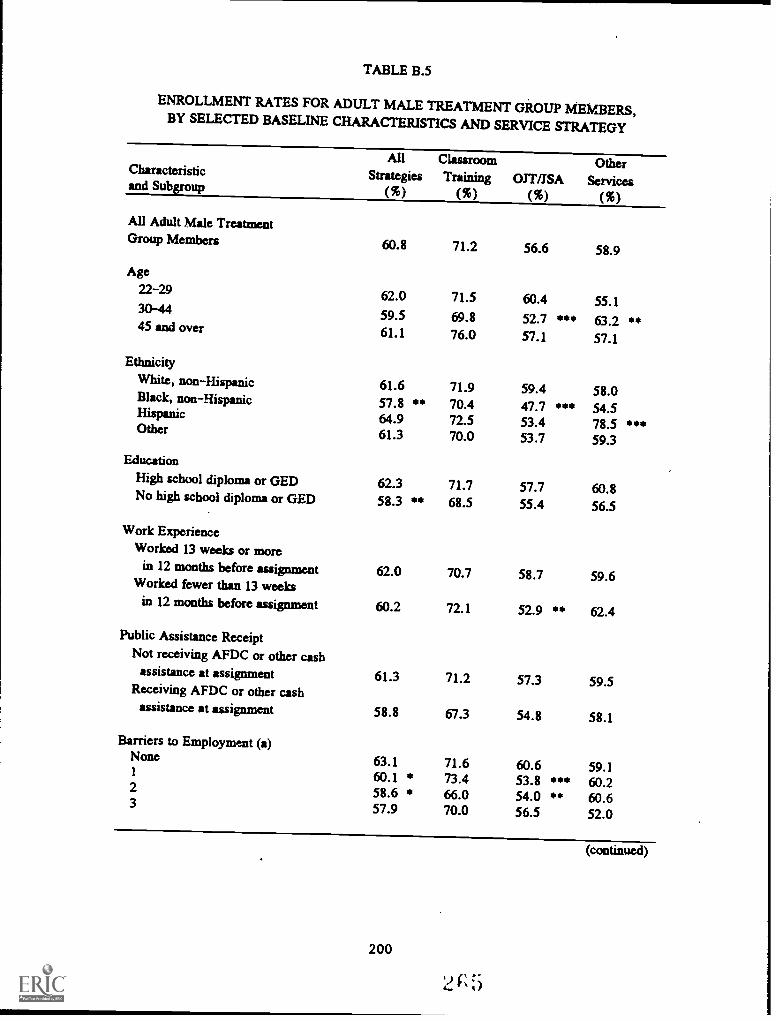
TABLE B.5
ENROLLMENT RATES FOR ADULT MALE TREATMENT GROUP MEMBERS,BY SELECTED BASELINE CHARACTERISTICS AND SERVICE STRATEGY
CharacteristicAll
StrategiesClassroomTraining OJTIJSA
OtherServicesand Subgroup
(%) (%) (%) (%)
All Adult Male TreatmentGroup Members 60.8 71.2 56.6 58.9
Age22-29 62.0 71.5 60.4 55.130-44 59.5 69.8 52.7 *** 63.2 **45 and over 61.1 76.0 57.1 57.1
EthnicityWhite, non-Hispanic 61.6 71.9 59.4 58.0Black, non-Hispanic 57.8 ** 70.4 47.7 *** 54.5Hispanic 64.9 72.5 53.4 78.5 ***Other 61.3 70.0 53.7 59.3
EducationHigh school diploma or GED 62.3 71.7 57.7 60.8No high school diploma or GED 58.3 ** 68.5 55.4 56.5
Work ExperienceWorked 13 weeks or more
in 12 months before assignment 62.0 70.7 58.7 59.6Worked fewer than 13 weeks
in 12 months before assignment 60.2 72.1 52.9 ** 62.4
Public Assistance ReceiptNot receiving AFDC or other cash
assistance at assignment 61.3 71.2 57.3 59.5Receiving AFDC or other cash
assistance at assignment 58.8 67.3 54.8 58.1
Barriers to Employment (a)None 63.1 71.6 60.6 59.11 60.1 73.4 53.8 *** 60.22 58.6 66.0 54.0 ** 60.63 57.9 70.0 56.5 52.0
(continued)
200

TABLE B.5 (continued)
CharacteristicAll
StrategiesClassroomTraining OJT /JSA
OtherServices
and Subgroup (%) (%) (%) (%)
AFDC HistoryNever received AFDC 60.5 71.3 56.2 58.5Received AFDC less than2 years (b) 68.2 ** 74.2 61.9 74.1 **
Received AFDC 2 yearsor more (b) 63.8 58.3 62.5 83.3
Household CompositionSpouse present 63.0 71.7 59.9 61.2No spouse present, child present 59.4 66.7 62.5 50.0 *No spouse present, no childpresent 59.5 ** 71.5 52.7 *** 60.4
SOURCE: MDRC calculations from Background Information Form responses andprogram enrollment data from the 16 SDAs.
NOTES: Calculations for this table are based on data for all adult male treatmentgroup members in the 18-month study sample. The total sample size may vary amongcharacteristics because of missing data for some treatment group members.
For each characteristic, within each service strategy, a chi-square testwas applied to the difference in enrollment rates between the first subgrouplisted and, separately, each of the remaining subgroups. Statistical significancelevels are indicated as * = 10 percent; ** = 5 percent; *** = 1 percent.
(a) The barriers to employment include: not having a high school diplomaor GED at the time of random assignment; having worked fewer than 13 weeksduring the 12 months prior to random assignment; and receiving AFDC or othercash assistance at the time of random assignment.
(b) The AFDC receipt may not have been continuous.
2 Fz
201

TABLE B.6
ENROLLMENT RATES FOR ADULT FEMALE TREATMENT GROUP MEMBERS,BY SELECTED BASELINE CHARACTERISTICS AND SERVICE STRATEGY
CharacteristicAll
StrategiesClassroomTraining OJT/JSA
OtherServicesand Subgroup (%) (%) (%) (%)
All Adult Female TreatmentGroup Members 64.6 72.8 55.4 62.4
Age22-29 64.1 71.3 54.6 63.730-44 66.1 74.7 55.1 65.045 and over 61.0 71.7 58.8 53.3 **
EthnicityWhite, non-Hispanic 66.7 74.8 58.1 67.6Black, non-Hispanic 58.5 *** 66.3 *4.* 52.8 * 48.6 ***Hispanic 69.4 79.7 42.9 *** 73.5Other 70.3 81.8 55.6 60.0
EducationHigh school diploma or GED 66.6 74.2 57.4 65.4No high school diploma or GED 60.1 *** 69.2 ** 52.4 * 55.9 ***
Work ExperienceWorked 13 weeks or more
in 12 months before assignment 66.9. 75.4 58.3 65.8Worked fewer than 13 weeks
in 12 months before assignment 63.7 ** 71.5 * 52.7 ** 62.4
Public Assistance ReceiptNot receiving AFDC or other cash
assistance at assignment 65.2 75.7 56.6 63.1Receiving AFDC or other cash
assistance at assignment 64.4 70.4 ** 54.2 61.9
Barriers to Employment (a)None 66.9 77.4 58.5 64.51 64.4 72.3 *I, 55.5 64.02 63.4 * 71.6 ** 52.2 * 59.43 60.0 ** 66.1 *** 50.0 56.7
(continued)
1; 7
202

TABLE B.6 (continued)
CharacteristicAll
StrategiesClassroomTraining OTT/JSA
OtherServices
and Subgroup (%) (%) (%) (%)
AFDC HistoryNever received AFDC 64.1 73.7 55.9 62.8Received AFDC less than2 years (b) 67.8 ** 75.5 58.5 64.8
Received AFDC 2 yearsor more (b) 63.0 69.9 51.9 60.2
Household CompositionSpouse present 66.3 76.3 56.7 64.6No spouse present, child present 66.6 73.0 57.7 64.5No spouse present, no childpresent 59.9 *** 67.4 ** 53.3 61.2
SOURCE: MDRC calculations from Background Information Form responses andprogram enrollment data from the 16 SDAs.
NOTES: Calculations for this table are based on data for all adult female treatmentgroup members in the 18-month study sample. The total sample size may vary amongcharacteristics because of missing data for some treatment group members.
For each characteristic, within each service strategy, a chi-square testwas applied to the difference in enrollment rates between the first subgrouplisted and, separately, each of the remaining subgroups. Statistical significancelevels are indicated as * = 10 percent; ** = 5 percent; *** = 1 percent.
(a) The barriers to employment include: not having a high school diplomaor GED at the time of random assignment; having worked fewer than 13 weeksduring the 12 months prior to random assignment; and receiving AFDC or othercash assistance at the time of random assignment.
(b) The AFDC receipt may not have been continuous.
203

TABLE B.7
ENROLLMENT RATES FOR MALE YOUTH TREATMENT GROUP MEMBERS,BY SELECTED BASELINE CHARACTERISTICS AND SERVICE STRATEGY
Characteristicand Subgroup
All ClassroomStrategies Training
(%) (%)OJT/JSA
(%)
OtherServices
(%)
All Male Youth TreatmentGroup Members 66.8 74.8 58.5 67.7
Age16-19 68.9 75.7 59.0 70.220-21 63.2 ** 72.9 57.9 62.8 *
EthnicityWhite, non-Hispanic 68.7 73.3 62.7 73.1Black, non-Hispanic 59.7 *0* 67.6 44.4 *0* 61.3 ***Hispanic 72.0 84.0 ** 55.2 66.0Other 80.0 100.0 (a) 50.0 84.2
EducationHigh school diploma or GED 62.2 75.8 59.2 52.8No high school diploma or GED 70.3 *** 75.6 55.9 73.8 ***
Work ExperienceWorked 13 weeks or morein 12 months before assignment 64.7 73.0 57.1 67.3
Worked fewer than 13 weeksin 12 months before assignment 69.3 * 74.7 60.8 70.4
Public Assistance ReceiptNot receiving AFDC or other cash
assistance at assignment 65.9 74.2 58.7 66.0Receiving AFDC or other cash
assistance at assignment 66.5 71.4 55.1 71.7
Barriers to Employment (b)None 61.2 74.7 58.6 52.61 66.4 * 74.3 58.7 66.8 0*2 73.7 ** 76.6 58.7 77.9 .3 63.4 69.6 50.0 64.7
(continued)
204

TABLE B.7 (continued)
Characteristicand Subgroup
AllStrategies
(%)
ClassroomTraining
(%)
OJT /JSA
(%)
OtherServices
(%)
AFDC HistoryNever received AFDC 66.6 74.8 57.9 67.8Received AFDC less than2 years (c) 75.0 71.4 75.0 100.0 (a)
Received AFDC 2 yearsor more (c) 66.7 0.0 (a) 0.0 (a) 66.7
Household CompositionSpouse present 74.8 83.9 73.7 69.4No spouse present, child present 63.8 82.6 43.7 ** 57.9No spouse present, no childpresent 65.4 72.5 55.1 *** 68.2
SOURCE: MDRC calculations from Background Information Form responses andprogram enrollment data from the 16 SDAs.
NOTES: Calculations for this table are based on data for all wale youth treatmentgroup members in the 18-month study sample. The total sample size may vary amongcharacteristics because of missing data for some treatment group members.
For each characteristic, within each service strategy, a chi-square testwas applied to the difference in enrollment rates between the first subgrouplisted and, separately, each of the remaining subgroups. Statistical significancelevels are indicated as = 10 percent; ** = 5 percent; *** = 1 percent.
(a) A chi-square test was inapproprire because of low expected cell frequencies.(b) The barriers to employment include: not having a high school diploma
or GED at the time of random assignment; having worked fewer than 13 weeksduring the 12 months prior to random assignment; and receiving AFDC or othercash assistance at the time of random assignment.
(c) The AFDC receipt may not have been continuous.
7 ()205

TABLE B.8
ENROLLMENT RATES FOR FEMALE YOUTH TREATMENT GROUP MEMBERS,BY SELECTED BASELINE CHARACTERISTICS AND SERVICE STRATEGY
CharacteristicAll
StrategiesClassroomTraining OJT/JSA
OtherServices
and Subgroup (%) (%) (%) (%)
All Female Youth TreatmentGroup Members 65.5 71.5 57.5 63.1
Age16-19 65.6 72.0 55.8 63.720-21 65.3 70.7 59.5 61.8
EthnicityWhite, non-Hispanic 67.0 68.0 61.9 7C.3Black, non-Hispanic 56.9 *** 63.8 49.1 ** 54.9 ***Hispanic 77.7 *** 86.7 *** 54.5 71.2Other 73.3 85.7 50.0 75.0
EducationHigh school diploma or GED 60.9 72.0 59.1 43.4No high school diploma or GED 70.9 *** 71.3 55.7 76.7 ***
Work ExperienceWorked 13 weeks or more
in 12 months before assignment 66.6 71.7 63.3 61.0Worked fewer than 13 weeks
in 12 months before assignment 64.8 70.6 50.0 *** 64.8
Public Assistance ReceiptNot receiving AFDC or other cash
assistance at assignment 65.8 73.2 59.3 61.5Receiving AFDC or other cash
assistance at assignment 64.4 67.4 * 54.6 65.1
Barriers to Employment (a)None 65.5 76.0 63.8 49.51 62.3 71.2 55.0 55.62 66.4 68.4 * 53.6 69.13 72.0 * 71.4 48.1 79.- .0**
(continued)
206

TABLE B.8 (continued)
CharacteristicAll
StrategiesClassroomTraining OJT/JSA
OtherServices
and Subgroup (%) (%) (%) (%)
AFDC HistoryNever received AFDC 65.7 72.1 58.2 63.2Received AFDC less than2 years (b) 65.6 71.7 60.3 59.8
Received AFDC 2 yearsor more (b) 62.0 64.7 38.1 * 70.0
Household CompositionSpouse present 70.1 78.9 56.1 70.0No spouse present, child present 65.9 71.8 55.6 64.4No spouse present, no childpresent 63.4 * 69.2 * 58.2 59.9
SOURCE: MDRC calculations from Background Information Form responses andprogram enrollment data from the 16 SDAs.
NOTES: Calculations for this table are based on data for all female youth treatmentgroup members in the 18-month study sample. The total sample size may vary amongcharacteristics because of missing data for some treatment group members.
For each characteristic, within each service strategy, a chi-square testwas applied to the difference in enrollment rates between the first subgrouplisted and, separately, each of the remaining subgroups. Statistical significancelevels are indicated as * = 10 percent; ** = 5 percent; *** = 1 percent.
(a) The bathers to employment include: not having a high school diplomaor GED at the time of random assignment; having worked fewer than 13 weeksduring the 12 months prior to random assignment; and receiving AFDC or othercash assistance at the time of random assignment.
(b) The AFDC receipt may not have been continuous.
4)1,,
207

TABLE B.9
SERVICE RECEIPT RATES FOR ADULT ENROLLEES,BY NUMBER AND TYPE OF SERVICES RECEIVED AND BY TARGET GROUP
Number and Type ofServices Received
AllAdults
(%)
AdultMen(%)
AdultWomen
(%)
Ever ReceivedClassroom training in
occupational skills (CT-OS) 38.0 26.3 47.2On-the-job training (OJT) 22.2 25.5 19.5Job search assistance (JSA) 36.5 40.1 33.6Basic education (BE) 10.9 9.1 12.3Miscellaneous services (a) 24.7 24.5 24.8
Received 1 Service 73.7 79.1 69.7CT-OS only 25.5 19.4 30.4OJT only 14.1 16.4 12.3JSA only 19.2 25.0 14.7BE only 3.2 3.4 3.0Miscellaneous only (a) 11.7 14.9 9.3
Received 2 or More Services 26.3 20.9 30.3CT-OS + OJT 1.3 1.2 1.4CT-OS + JSA 7.2 3.6 10.0CT-OS + BE 2.6 1.5 3.4CT-OS + Miscellaneous (a) 5.6 3.2 7.5OJT + JSA 5.3 6.9 4.1OJT ). BE 0.8 0.9 0.7OJT + Miscellaneous (a) 3.0 2.9 3.1JSA + BE 4.0 3.5 4.4JSA + Miscellaneous (a) 5.1 4.8 5.3BE + Miscellaneous (a) 3.7 1.9 5.1
Sample Size 5,169 2,286 2,883
SOURCE: MDRC calculations from Background Information Form responses and from programenrollment and participation data from the 16 SDAs.
NOTES: Calculations for this table are based on data for all adult enrollees in the 18-monthstudy sample.
In the top panel, the total service receipt rate for each target group is over 100.0 percentbecause some enrollees received more than one service. in the bottom panel, the total service receiptrate for each target group is over 26.3, 20.9, and 30.3 percent, respectively, because some enrolleesreceived more than two services and are included in each combination of services they received.
Tests of statistical significance were not performed.(a) Miscellaneous program services include such activities as assessment, job-readiness
preparation, vocational exploration, job shadowing, and tryout employment. In this table,miscellaneous program services also include work experience, which is identified as a separateprogram service in other reports on the National JTPA Study.
208

TABLE B.10
SERVICE RECEIPT RATES FOR OUT-OF-SCHOOL YOUTH ENROLLEES,BY NUMBER AND TYPE OF SERVICES RECEIVED AND BY TARGET GROUP
Number and Type ofServices Received
AllYouths
(%)
MaleYouths
(%)
FemaleYouths
(%)
Ever ReceivedClassroom training in
occupational skills (CT-OS) 36.4 28.1 43.1On-the-job training (OTT) 16.5 19.2 14.3Job search assistance (ISA) 35.3 36.3 34.5Basic education (BE) 27.2 26.5 27.9Miscellaneous services (a) 29.1 31.9 26.8
Received 1 Service 65.0 66.6 63.7CT-OS only 17.5 10.5 23.1OJT only 8.9 10.0 8.0JSA only 10.9 13.2 9.0BE only 11.9 12.9 11.1Miscellaneous only (a) 15.8 20.0 12.5
Received 2 or More Services 35.0 33.4 36.3CT-OS + OJT 1.0 1.1 0.9CT-OS + JSA 12.9 11.1 14.5CT-OS + BE 8.2 7.8 8.5CT-OS + Miscellaneous (a) 4.4 4.1 4.7OTT + ISA 5.5 7.4 4.0OJT + BE 0.7 1.1 0.3OJT + Miscellaneous (a) 1.6 1.3 1.9JSA + BE 9.1 7.2 10.6JSA + Miscellaneous (a) 5.4 5.0 5.7BE + Miscellaneous (a) 5.7 4.9 6.3
Sample Size 2,147 959 1,188
SOURCE: MDRC calculations from Background Information Form responses and from programenrollment and participation data from the 16 SDAs.
NOTES: Calculations for this table are based on data for all out-of-school youth enrolleesin the 18-monkstudy sample.
In thel4 panel, the total service receipt rate for each targei. group is over 100.0 percentbecause some enrollees received more than one service. In the bottom panel, the total service receiptrate for each target group is over 26.3, 20.9, and 30.3 percent, respectively, because some enrolleesreceived more than two services and are included in each combination of services they received.
Tests of statistical significance were not performed.(a) Miscellaneous program services include such activities as assessment, job-readiness
preparation, vocational exploration, job shadowing, and tryout employment. In this table,miscellaneous program services also include work experience, which is identified as a separateprogram service in other reports on the National JTPA Study.
209
2 "4

TABLE B.11
SERVICE RECEIPT RATES FOR ADULT MALE ENROLLEES,BY SELECTED BASELINE CHARACTERISTICS
Characteristic Sample
Non-Training
CT-OS (a) OJT (b) Education (c)JSAOnly
Misc.Non-TrainingServices (d)
and Subgroup Size (%) (%) (%) (%) (%)
All Adult Male Enrollees 2,286 26.3 24.3 7.2 25.0 17.2
Age22-29 1,039 27.8 26.0 7.2 20.9 18.130-44 969 25.4 23.4 7.5 26.8 *** 16.845 and over 278 24.1 21.2 5.8 33.8 *** 15.1
EthnicityWhite, non-Hispanic 1,319 18.5 30.6 8.7 24.9 17.4Black, non-Hispanic 627 40.8 *** 15.2 *** 1.9 *** 27.0 15.2Hispanic 237 23.2 18.1 *** 14.3 *** 23.6 20.7Other 103 45.6 *** 14.6 *** 2.9 * 17.5 * 19.4
EducationHigh school diploma or GED 1,501 29.3 24.2 3.5 25.8 17.1No high school diploma or GED 637 19.3 *** 25.1 16.0 *** 22.6 17.0
Work ExperienceWorked 13 weeks or more
in 12 months before assignment 1,226 26.1 26.5 5.6 25.6 16.2Worked fewer than 13 weeks
in 12 months before assignment 846 27.0 21.4 *** 9.1 *** 23.3 19.3
Public Assistance ReceiptNot receiving AFDC or other cash
assistance at assignment 1,698 26.9 25.4 4.7 25.8 17.1Receiving AFDC or other cash
assistance at assignment 32i 23.4 19.6 ** 21.2 *** 21.5 14.3
Bathers to Employment (e)None 949 28.7 25.5 2.0 26.6 17.31 906 26.5 24.8 6.8 *** 25.4 16.42 356 21.1 *** 22.2 16.3 *** 22.8 17.73 62 19.4 11.3 ** 37.1 *** 9.7 *** 22.6
(continued)
210
2. ,5
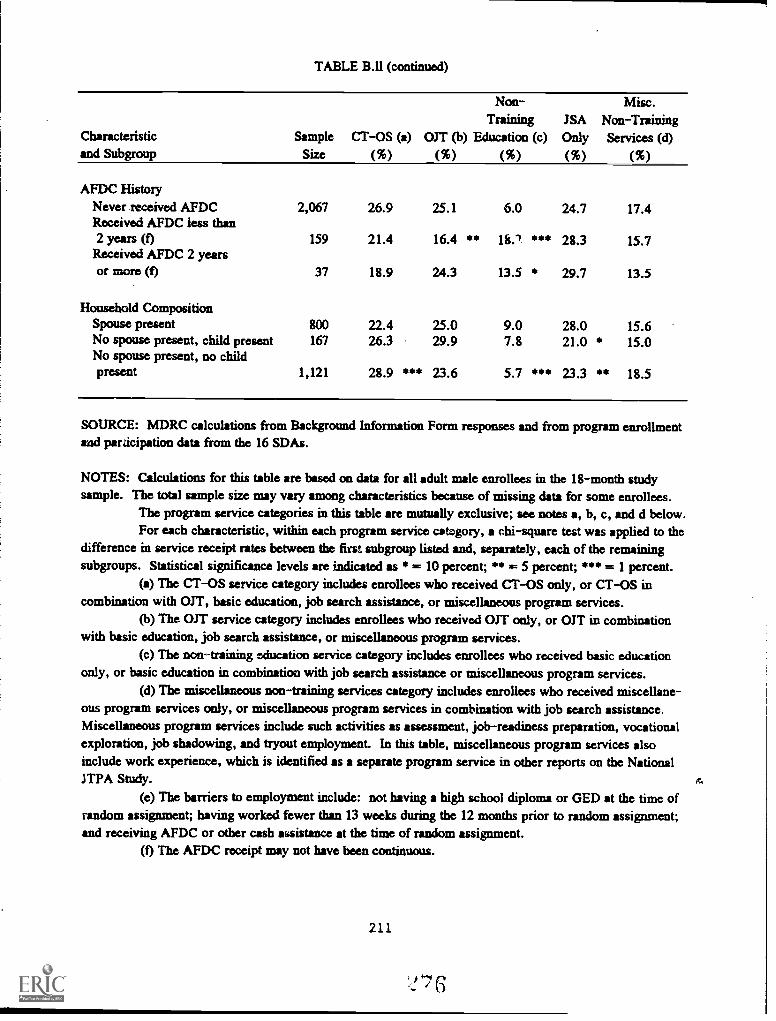
TABLE B.11 (continued)
Characteristic Sample CT-OS (a)
Non-Training
OJT (b) Education (c)JSAOnly
Misc.Non-TrainingServices (d)
and Subgroup Size (%) (%) (%) (%) (%)
AFDC HistoryNever received AFDC 2,067 26.9 25.1 6.0 24.7 17.4Received AFDC less than2 years (f) 159 21.4 16.4 ** 18.1 *** 28.3 15.7
ReceivedAFDC 2 yearsor more (0 37 18.9 24.3 13.5 * 29.7 13.5
Household CompositionSpouse present 800 22.4 25.0 9.0 28.0 15.6No spouse present, child present 167 26.3 29.9 7.8 21.0 * 15.0No spouse present, no childpresent 1,121 28.9 *** 23.6 5.7 *** 23.3 ** 18.5
SOURCE: MDRC calculations from Background Information Form responses and from program enrollmentand participation data from the 16 SDAs.
NOTES: Calculations for this table are based on data for all adult male enrollees in the 18-month studysample. The total sample size may vary among characteristics because of missing data for some enrollees.
The program service categories in this table are mutually exclusive; see notes a, b, c, and d below.For each characteristic, within each program service category, a chi-square test was applied to the
difference in service receipt rates between the first subgroup listed and, separately, each of the remainingsubgroups. Statistical significance levels are indicated as * = 10 percent; ** = 5 percent; *** = 1 percent.
(a) The CT-OS service category includes enrollees who received CT-OS only, or CT-OS incombination with OJT, basic education, job search assistance, or miscellaneous program services.
(b) The OJT service category includes enrollees who received OJT only, or OJT in combinationwith basic education, job search assistance, or miscellaneous program services.
(c) The non-training education service category includes enrollees who received basic educationonly, or basic education in combination with job search assistance or miscellaneous program services.
(d) The miscellaneous non-training services category includes enrollees who received miscellane-ous program services only, or miscellaneous program services in combination with job search assistance.Miscellaneous program services include such activities as assessment, job-readiness preparation, vocationalexploration, job shadowing, and tryout employment. In this table, miscellaneous program services alsoinclude work experience, which is identified as a separate program service in other reports on the NationalJ TPA Study.
(e) The barriers to employment include: not having a high school diploma or GED at the time ofrandom assignment; having worked fewer than 13 weeks during the 12 months prior to random assignment;and receiving AFDC or other cash assistance at the time of random assignment.
(f) The AFDC receipt may not have been continuous.
211
0(7.
et,

TABLE B.12
S3RVICE RECEIPT RATES FOR ADULT FEMALE ENROLLEES,BY SELECTED BASELINE CHARACTERISTICS
Characteristic Sample
Non-Training
CT-OS (a) OTT (b) Education (c)ISAOnly
Misc.Non-TrainingServices (d)
and Subgroup Size (%) (%) (%) (%) (%)
All Adult Female Enrollees 2,883 47.2 18.1 8.4 14.7 11.6
Age22-29 1,266 48.4 19.4 8.9 12.7 10.630-44 1,270 49.7 16.0 ** 8.7 13.9 11.745 and over 347 34.0 *0* 21.0 5.5 ** 24.8 *** 14.7 **
EthnicityWhite, non-Hispanic 1,622 40.4 22.1 9.4 16.0 12.1Black, non-Hispanic 805 58.0 *** 16.0 *** 3.4 *** 14.0 8.6 ***Hispanic 352 49.1 **a 6.3 *** 16.8 *** 11.4 *0 16.5 **Other 104 64.4 *** 11.5 ** 4.8 10.6 8.7
EducationHigh school diploma or GED 1,990 50.4 18.2 4.4 16.1 10.9No high school diploma or GED 705 38.6 *** 18.6 19.4 *0* 11.2 *** 12.2
Work ExperienceWorked 13 weeks or morein 12 months before assignment 1,202 42.9 20.8 6.4 18.1 11.7
Worked fewer than 13 weeksin 12 months before assignment 1,332 51.9 *** 15.0 *** 9.8 *0* 11.6 *** 11.7
Public Assistance ReceiptNot receiving AFDC or other cash
assistance at assignment 1,589 43.3 22.1 5.5 18.3 10.8Receiving AFDC or other cash
assistance at assignment 1,034 54.2 *** 12.4 *** 12.7 *** 8.6 *** 12.2
Bathers to Employment (e)None 879 43.1 22.5 3.3 20.3 10.81 1,046 47.0 * 18.8 ** 6.5 *** 16.3 * 11.42 736 52.7 *** 14.1 *** 12.4 *0* 8.6 * 0 * 12.23 201 4.6.8 10.0 *** 25.9 sib* 5.0 * * 12.4
(continued)
212
)
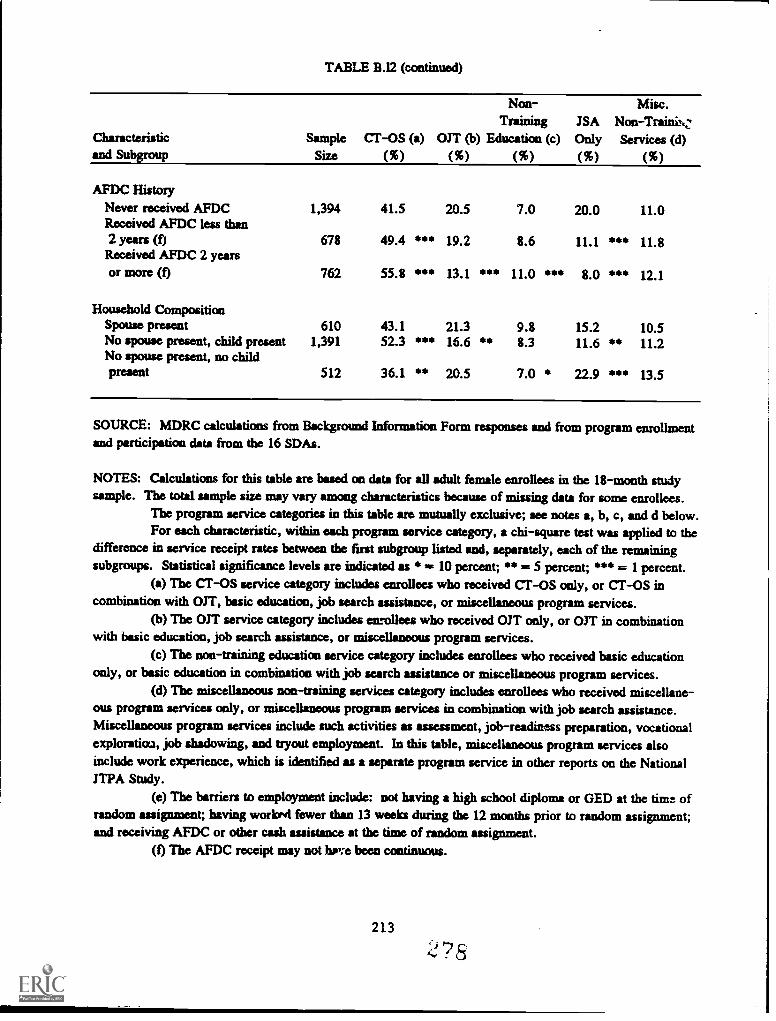
TABLE B.12 (continued)
Characteristic Sample CT-OS (a)
Non-Training
OJT (b) Education (c)ISAOnly
Misc.Non-TrainihzServices (d)
and Subgroup Size (%) (%) (%) (%) (%)
AFDC HistoryNever received AFDC 1,394 41.5 20.5 7.0 20.0 11.0Received AFDC less than2 years (f) 678 49.4 *** 19.2 8.6 11.1 *** 11.8
Received AFDC 2 yearsor more (f) 762 55.8 *** 13.1 *** 11.0 *** 8.0 *** 12.1
Household CompositionSpouse present 610 43.1 21.3 9.8 15.2 10.5No spouse present, child present 1,391 52.3 *** 16.6 ** 8.3 11.6 ** 11.2No spouse present, no childpresent 512 36.1 ** 20.5 7.0 * 22.9 *** 13.5
SOURCE: MDRC calculations from Background Information Form responses and from program enrollmentand participation data from the 16 SDAs.
NOTES: Calculations for this table are based on data for all adult female enrollees in the 18-month studysample. The total sample size may vary among characteristics because of missing data for some enrollees.
The program service categories in this table are mutually exclusive; see notes a, b, c, and d below.For each characteristic, within each program service category, a chi-square test was applied to the
difference in service receipt rates between the first subgroup listed and, separately, each of the remainingsubgroups. Statistical significance levels are indicated as * = 10 percent; ** = 5 percent; *** = 1 percent.
(a) The CT-OS service category includes enrollees who received CT-OS only, or CT-OS incombination with OJT, basic education, job search assistance, or miscellaneous program services.
(b) The OJT service category includes enrollees who received OJT only, or OJT in combinationwith basic education, job search assistance, or miscellaneous program services.
(c) The non-training education service category includes enrollees who received basic educationonly, or basic education in combination with job search assistance or miscellaneous program services.
(d) The miscellaneous non-training services category includes enrollees who received miscellane-ous program services only, or miscellaneous program services in combination with job search assistance.Miscellaneous program services include such activities as assessment, job readiness preparation, vocationalexploration, job shadowing, and tryout employment. In this table, miscellaneous program services alsoinclude work experience, which is identified as a separate program service in other reports on the NationalJTPA Study.
(e) The barriers to employment include: not having a high school diploma or GED at the time ofrandom assignment; having workr4 fewer than 13 weeks during the 12 months prior to random assignment;and receiving AFDC or other cash assistance at the time of random assignment.
(f) The AFDC receipt may not have been continuous.
213
;"?

TABLE B.13
SERVICE RECEIPT RATES FOR MALE YOUTH ENROLLEES,BY SELECTED BASELINE CHARACTERISTICS
Characteristicand Subgroup
SampleSize
CT-OS (a)(%)
Non-Training
OJT (b) Education (c)(%) (%)
JSAOnly
(%)
Misc.Non-TrainingServices (d)
(%)
All Male Youth Enrollees 959 28.1 18.0 17.9 13.2 22.7
Age16-19 615 29.9 14.1 21.0 13.0 22.020-21 344 24.7 * 25.0 *** 12.5 *** 13.7 24.1
EthnicityWhite, non-Hispanic 530 21.9 24.5 13.0 16.2 24.3Black, non-Hispanic 253 26.1 6.3 *** 35.2 *** 10.7 ** 21.7Hispanic 152 52.0 dlt. 16.4 ** 7.2 * 7.2 *** 17.1Other 24 33.3 8.3 12.5 12.5 33.3
EducationHigh school diploma or GED 351 32.2 29.1 2.0 17.4 19.4No high school diploma or GED 572 26.2 10.8 *** 28.0 *** 10.1 *** 24.8
Work ExperienceWorked 13 weeks or more
in 12 months before assignment 449 27.4 24.3 12.0 15.1 21.2Worked fewer than 13 weeks
in 12 months before assignment 427 28.3 12.2 *** 23.4 *** 11.5 24.6
Public Assistance ReceiptNot receiving AFDC or other cash
assistance at assignment 738 28.5 20.6 15.4 14.1 21.4Receiving AFDC or other cash
assistance at assignment 105 21.0 5.7 *** 25.7 *** 13.3 34.3 *Bathers to Employment (e)
None 227 30.8 34.4 1.8 16.7 16.31 403 28.5 17.1 *** 16.4 *** 15.1 22.8 *2 283 26.1 8.5 *** 30.0 *** 8.5 26.93 45 22.2 2.2 *** 37.8 *** 8.9 28.9
214
(continued)

TABLE B.13 (continued)
Characteristicand Subgroup
SampleSize
CT-OS (a)(%)
Non-Training
OJT (b) Education (c)(%) (%)
Misc.JSA Non-TrainingOnly Services (d)
(%) (%)
AFDC HistoryNever received AFDC 937 28.5 18.1 17.9 13.2 22.2Received AFDC less than2 years (f) 15 0.0 (g) 13.3 26.7 13.3 46.7 **
Received AFDC 2 yearsor more (f) 2 0.0 (g) 0.0 (g) 0.0 (g) 0.0 (g) 100.0 (g)
Household CompositionSpouse present 110 17.3 31.8 12.7 15.5 22.7No spouse present, child present 37 29.7 13.5 ** 24.3 * 16.2 16.2No spouse present, no childpresent 758 30.1 * ** 16.8 ** 17.2 12.9 23.1
SOURCE: MDRC calculations from Background Information Form responses and from program enrollmentand participation data from the 16 SDAs.
NOTES: Calculations for this table are based on data for all male youth enrollees in the 18-month studysample. The total sample size may vary among characteristics because of missing data for some enrollees.
The program service categories in this table are mutually exclusive; see notes a, b, c, and d below.For each characteristic, within each program service category, a chi-square test was applied to the
difference in service receipt rates between the first subgroup listed and, separately, each of the remainingsubgroups. Statistical significance levels are indicated as 10 percent; ** = 5 percent; *** = 1 percent.
(a) The CT-OS service category includes enrollees who received CT-OS only, or CT-OS incombination with OJT, basic education, job search assistance, or miscellaneous program services.
(b) The OJT service category includes enrollees who received OJT only, or OJT in combinationwith basic education, job search assistance, or miscellaneous program services.
(c) The non-training education service category includes enrollees who received basic educationonly, or basic education in combination with job search assistance or miscellaneous program services.
(d) The miscellaneous noa-training services category includes enrollees who received miscellane-ous program services only, or miscellaneous program services in combination with job search assistance.Miscellaneous program services include such activities as assessment, job-readiness preparation, vocationalexploration, job shadowing, and tryout employment. In this table, miscellaneous program services alsoinclude work experience, which is identified as a separate program service in other reports on the NationalJTPA Study.
(e) The barriers to employment include: not having a high school diploma or GED at the time ofrandom assignment; having worked fewer than 13 weeks during the 12 months prior to random assignment;and receiving AFDC or other cash assistance at the time of random assignment.
(f) The AFDC receipt may not have been continuous.(g) A chi-square test was inappropriate because of low expected cell frequencies.
215

TABLE B.14
SERVICE RECEIPT RATES FOR FEMALE YOUTH ENROLBY SELECTED BASELINE CHARACTERISTICS
PPS,
Characteristicand Subgroup
Sample
Size
Non-Training
CT-OS (a) OJT (b) Education (c)(%) (%) (%)
Misc.JSA Non-TrainingOnly Services (d)(%) (%)
All Female Youth Enrollees 1,188 43.1 13.4 19.2 9.0 15.3
Age16-19 707 40.7 11.0 23.1 8.6 16.520-21 481 46.6 * 16.8 *** 13.5 *** 9.6 13.5
EthnicityWhite, non-Hispanic 608 36.8 18.6 18.6 10.4 15.6Black, non-Hispanic 335 38.2 7.5 *** 29.3 ** 8.4 16.7Hispanic 223 66.8 * 7.2 *** 6.7 *** 7.2 12.1Other 22 50.0 22.7 9.1 0.0 (c) 18.2
EducationHigh school diploma or GED 534 51.9 20.6 3.0 10.5 14.0No high school diploma or GED 601 34.8 *** 6.8 *** 33.4 *** 7.5 * 17.5
Work ExperienceWorked 13 weeks or more
in 12 months before assignment 428 44.2 17.3 10.0 13.1 15.4Worked fewer than 13 weeksin 12 mouths before assignment 637 42..7 10.5 ** 26.2 *** 5.5 *** 15.1
Public Assistance ReceiptNot receiving AFDC or other cash
assistance at assignment 741 43.3 14.7 16.5 11.2 14.3Receiving AFDC or other cashassistance at assignment 353 42.8 11.3 24.6 *** 5.9 *0* 15.3
Barriers to Employment (1)None 272 47.1 21.0 4.0 14.3 13.61 395 47.3 15.7 * 10.6 ** 10.6 15.72 355 39.4 9.6 *** 30.7 *** 5.4 ** 14.93 162 34.0 * 3.7 ** 40.1 *0* 4.3 *** 17.9
(continued)
216
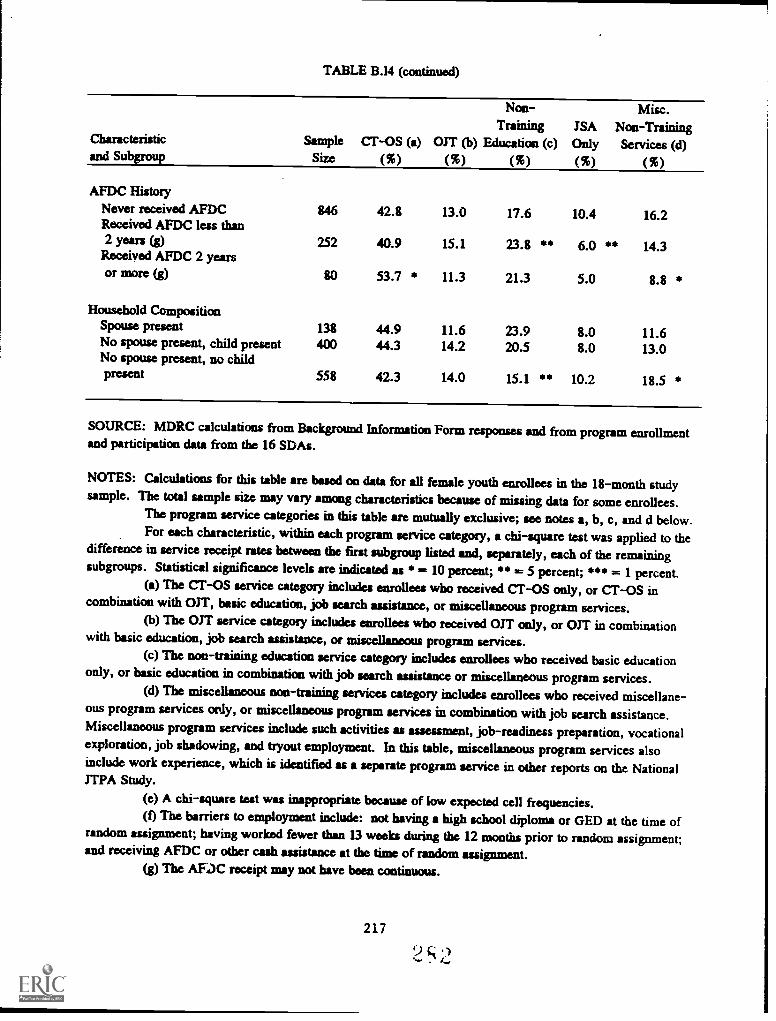
TABLE B.14 (continued)
Characteristic Sample CT-OS (a)
Non-Training
OJT (b) Education (c)JSAOnly
Misc.Non-TrainingServices (d)
and Subgroup Size (%) (%) (%) (%) (%)
AFDC HistoryNever received AFDC 846 42.8 13.0 17.6 10.4 16.2Received AFDC less than2 years (g) 252 40.9 15.1 23.8 ** 6.0 ** 14.3
Received AFDC 2 yearsor more (g) 80 53.7 11.3 21.3 5.0 8.8
Household CompositionSpouse present 138 44.9 11.6 23.9 8.0 11.6No spouse present, child present 400 44.3 14.2 20.5 8.0 13.0No spouse present, no childpresent 558 42.3 14.0 15.1 ** 10.2 18.5 *
SOURCE: MDRC calculations from Background Information Form responses and from program enrollmentand participation data from the 16 SDAs.
NOTES: Calculations for this table are based on data for all female youth enrollees in the 18-month studysample. The total sample size may vary among characteristics because of missing data for some enrollees.
The program service categories in this table are mutually exclusive; see notes a, b, c, and d below.For each characteristic, within each program service category, a chi-square test was applied to the
difference in service receipt rates between the first subgroup listed and, separately, each of the remainingsubgroups. Statistical significance levels are indicated as = 10 percent; ** = 5 percent; *** = 1 percent.
(a) The CT-OS service category includes enrollees who received CT-OS only, or CT-OS incombination with OJT, basic education, job search assistance, or miscellaneous program services.
(b) The OJT service category includes enrollees who received OJT only, or OJT in combinationwith basic education, job search assistance, or miscellaneous program services.
(c) The non-training education service category includes enrollees who received basic educationonly, or basic education in combination with job search assistance or miscellaneous program services.
(d) The miscellaneous non-training services category includes enrollees who received miscellane-ous program services only, or miscellaneous program services in combination with job search assistance.Miscellaneous program services include such activities as assessment, job-readiness preparation, vocationalexploration, job shadowing, and tryout employment. In this table, miscellaneous program services alsoinclude work experience, which is identified as a separate program service in other reports on the NationalJTPA Study.
(e) A chi-square test was inappropriate because of low expected cell frequencies.(f) The barriers to employment include: not having a high school diploma or GED at the time of
random assignment; having worked fewer than 13 weeks during the 12 months prior to random assignment;and receiving AFDC or other cash assistance at the time of random assignment.
(g) The AFJC receipt may not have been continuous.
217

TABLE B.15
SERVICE RECEIPT RATES FOR ADULT MALE ENROLLEES,BY EMPLOYMENT BARRIER SUBGROUP AND ETHNICITY
Employment Barrier Subgroup (a)and Ethnicity
SampleSize
CT-OS (b)(%)
Non-Training
OJT (c) Education (d)(%) (%)
JSAOnly
(%)
Misc.Non-TrainingServices (e)
(%)
No Employment Barriers
White, non-Hispanic 587 19.1 31.5 1.7 26.6 21.1Black, non-Hispanic 259 46.3 *** 15.4 *** 0.8 27.8 9.7 ***Hispanic 75 33.3 *** 16.0 *** 9.3 *** 24.0 17.3
1 Employment Barrier
Worked fewer than 13 weeksin 12 months before assignment
White, non-Hispanic 226 25.7 28.3 5.3 25.2 15.5Black, non-Hispanic 183 38.3 *** 14.8 *WY 3.8 23.5 19.7Hispanic 58 24.1 19.0 12.1 * 27.6 17.2
No high school diploma or GEDat assignment
White, non-Hispanic 197 13.2 38.6 7.6 27.9 12.7Black, non-Hispanic 57 45.6 44* 12.3 *** 3.5 22.8 15.8Hispanic 50 12.0 24.0 * 20.0 ** 22.0 22.0 *
Receiving AFDC or other cashassistance at assignment
White, non-Hispanic 64 21.9 25.0 9.4 26.6 17.2Black, non-Hispanic 28 32.1 17.9 0.0 (f) 39.3 10.7Hispanic 2 0.0 (f) 50.0 50.0 0.0 (1) 0.0 (f)
2 Employment Barriers
Worked fewer than 13 weeksin 12 months before assignmentand no high school diploma or GEDat assignment
White, non-Hispanic 91 16.5 29.7 13.2 20.9 19.8Black, non-Hispanic 43 16.3 20.9 2.3 * 34.9 * 25.6Hispanic 41 12.2 14.6 * 17.1 24.4 31.7
Worked fewer than 13 weeksin 12 months before assignmentand receiving AFDC or other cashassistance at assignment
White, non- Hispanic 56 21.4 32.1 10.7 21.4 14.3Black, non-Hispanic 31 45.2 ** 12.9 * 0.0 (f) 29.0 12.9Hispanic 5 40.0 0.0 (f) 20.0 20.0 20.0
(continued)
218

TABLE B.15 (continued)
Employment Barrier Subgroup (a)and Ethnicity
SampleSize
CT-OS (b)(%)
Non-Training
OJT (c) Education (d)(%) (%)
Misc.JSA Non-TrainingOnly Services (e)(%) (%)
No high school diploma or GEDat assignment and receivingAFDC or other cash assitanceat assignment
White, non-Hispanic 54 7.4 20.4 53.7 13.0 5.6Black, non-Hispanic 7 42.9 ** 14.3 0.0 (f) 42.9 * 0.0 (f)Hispanic 2 50.0 * 0.0 (f) 50.0 0.0 (f) 0.0 (f)
All 3 Employment :3arriers
White, non-Hispanic 37 5.4 10.8 62.2 10.8 10.8
Black, non-Hispanic 13 38.5 *** 7.7 0.0 (f) 15.4 38.5 *Hispanic 4 50.0 ** 25.0 0.0 (f) 0.0 (f) 25.0
SOURCE: MDRC calculations from Background Information Form responses and from program enrollmentand participation data from the 16 SDAs.
NOTES: Calculations for 'this table are based on data for all white, black, and Hispanic adult male enrolleesin the 18-month study sample. Enrollees from other ethnic groups were not included because of smallsample sizes.
The program service categories in this table are mutually exclusive; see notes b, c, d, and e below.For each employment barrier subgroup, within each program service category, a chi-square test
was applied to the difference in service receipt rates between white enrollees and black enrollees andbetween white enrollees and Hispanic enrollees. Statistical significance levels are indicated as
= 10 percent; ** = 5 percent; ** =1 percent.(a) The barriers to employment include: not having a high school diploma or GED at the time of
random assignment; having worked fewer than 13 weeks during the 12 months prior to random assignment;and receiving AFDC or other cash assistance at the time of random assignment.
(b) The CT-OS service category includes enrollees who received CT-OS only, or CT-OS incombination with OJT, basic education, job search assistance, or miscellaneous program services.
(c) The OJT service category includes enrollees who received OJT only or OJT in combination' with basic education, job search assistance, cr miscellaneous program services.
(d) The non-training education service category includes enrollees who received basic educationonly, or basic education in combination with job search assistance or miscellaneous program services.
(e) The miscellaneous non-training services category includes enrollees who received miscellane-ous program services only, or miscellaneous program services in combination with job search assistance.Miscellaneous program services include such activities as assessment, job-readiness preparation, vocationalexploration, job shadowing, and tryout employment. In this table, miscellaneous program services alsoinclude work experience, which is identified as a separate program service in other reports on the NationalJTPA Study.
(f) A chi-square test was inappropriate because of low expected cell frequencies.
219

TABLE B.16
SERVICE RECEIPT RATES FOR ADULT FEMALE ENROLLEES,BY EMPLOYMENT BARRIER SUBGROUP AND ETHNICITY
Employment Bather Subgroup (a)and Ethnicity
SampleSize
Non-Training
CT-OS (b) OJT (c) Education (d)(%) (%) (%)
JSAOnly
(%)
Misc.Non-TrainingServices (e)
(%)No EmPloYment Barriers
White, non-Hispanic 575 40.9 24.7 2.6 20.3 11.5Black, non-Hispanic 192 45.3 22.9 1.6 21.9 8.3Hispanic 83 51.8 * 10.8 12.0 *** 16.9 8.41 Employment Barrier
Worked fewer than 13 weeksin 12 months before assignment
White, non-Hispanic 323 45.2 18.6 4.0 18.9 13.3Black, non-Hispanic 99 47.5 24.2 1.0 21.2 6.1Hispanic 61 57.4 4.9 *0 8.2 18.0 11.5No high school diploma or GEDat assignment
White, non-Hispanic 139 30.2 30.9 6.5 18.0 14.4Black, non-Hispanic 41 46.3 26.8 7.3 12.2 7.3Hispanic 43 27.9 0.0 (f) 44.2 *** 14.0 14.0Receiving AFDC or other cashassistance at assignment
White, non-Hispanic 142 47.2 20.4 7.0 13.4 12.0Black, non-Hispanic 124 61.3 * 15.3 1.6 12.1 9.7Hispanic 28 50.0 7.1 14.3 10.7 17.92 Employment Barriers
Worked fewer than 13 weeksin 12 months before assignmentand no high school diploma or GEDat assignment
White, non - Hispanic 104 30.8 33.7 11.5 11.5 12.5Black, non-Hispanic 19 42.1 15.8 0.0 (f) 31.6 * 10.5Hispanic 24 33.3 12.5 41.7 ** 4.2 8.3Worked fewer than 13 weeksin 12 months before assignmentand receiving AFDC or other cashassistance at assignment
White, non-Hispanic 175 51.4 13.7 15.4 6.9 12.6Black, non-Hispanic 216 71.8 8.3 * 3.2 *** 7.9 8.8Hispanic 63 63.5 6.3 3.2 * 3.2 23.8
(continued)
220

TABLE B.16 (continued)
Employment Barrier Subgroup (a) Sample CT-OS (b)
Non-Training
OJT (c) Education (d)ISAOnly
Misc.Non-TrainingServices (e)
and Ethnicity Size (%) (%) (%) (%) (%)
No high school diploma or GEDat assignment and receivingAFDC or other cash assitanceat assignment
White, non-Hispanic 64 18.8 18.8 39.1 14.1 .4
Black, non-Hispanic 36 63.9 *** 8.3 11.1 up** 5.6 11.1
Hispanic 12 33.3 8.3 16.7 8.3 33.3 **
All 3 Employment Barriers
White, non-Hispanic 92 29.3 12.0 43.5 4.3 10.9
Black, non-Hispanic 70 68.6 *** 10.0 10.0 *** 4.3 7.1
Hispanic 33 48.5 ** 0.0 (f) 15.2 *** 6.1 30.3 **
SOURCE: MDRC calculations from Background Information Form responses and from program enrollmentand participation data from the 16 SDAs.
NOTES: Calculations for this table are based on data for all white, black, and Hispanic adult femaleenrollees in the 18-month study sample. Enrollees from other ethnic groups were not included because ofsmall sample sizes.
The program service categories in this table are mutually exclusive; see notes b, c, d, and e below.For each employment barrier subgroup, within each program service category, a chi-square test
was applied to the difference in service receipt rates between white enrollees and black enrollees andbetween white enrollees and Hispanic enrollees. Statistical significance levels are indicated as* = 10 percent; ** = 5 percent; *** = 1 percent.
(a) The barriers to employment include: not having a high school diploma or GED at the time ofrandom assignment; having worked fewer than 13 weeks during the 12 months prior to random assignment;and receiving AFDC or other cash assistance at the time of random assignment.
(b) The CT -0S service category includes enrollees who received CT-OS only, or CT-OS incombination with OJT, basic education, job search assistance, or miscellaneous program services.
(c) The OJT service category includes enrollees who received OJT only, or OJT in combinationwith basic education, job search assistance, or miscellaneous program services.
(d) The non-training education service category includes enrollees who received basic educationonly, or basic education in combination with job search assistance or miscellaneous program services.
(e) The miscellaneous non-training services category includes enrollees who received miscellane-ous program services only, or miscellaneous program services in combination with job search assistance.Miscellaneous program services include such activities as assessment, job-readiness preparation, vocationalexploration. job shadowing, and tryout employment. In this table, miscellaneous program services alsoinclude work experience, which is identified as a separate pragram service in other reports on the National
JTPA Study.(f) A chi-square test was inappropriate because of low expected cell frequencies.
221
s 6

TABLE B.17
SERVICE RECEIPT RATES FOR MALE YOUTH ENROLLEES,BY EMPLOYMENT BARRIER SUBGROUP AND ETHNICITY
Employment Barrier Subgroup (a)and Ethnicity
SampleSize
Non-Training
CT-OS (b) OJT (c) Education (d)(%) (%) (%)
Misc.JSA Noe-TrainingOnly Services (e)(%) (%)
No Employment Barriers
White, non-Hispanic 164 25.6 38.4 1.8 17.1 17.1Black, non-Hispanic 28 46.4 ** 17.9 ** 0.0 (f) 17.9 17.9Hispanic 32 43.7 ** 31.3 3.1 9.4 12.51 Employment Barrier
Worked fewer than 13 weeksin 12 months before assignment
White, non-Hispanic 69 18.8 30.4 4.3 18.8 27.5Black, non-Hispanic 31 35.5 * 9.7 ** 9.7 22.6 22.6Hispanic 27 59.3 *** 18.5 3.7 14.8 3.7 41*
No high school diploma or GEDat assignment
White, non-Hispanic 141 26.2 18.4 17.7 14.9 22.7Black, non-Hispanic 75 20.0 6.7 ** 40.0 *** 12.0 21.3Hispanic 33 48.5 ** 15.2 6.1 6.1 24.2
Receiving AFDC or other cashassistance at assignment
White, non-Hispanic 11 9.1 9.1 9.1 9.1 63.6Black, non- Hispanic 3 33.3 0.0 (f) 0.0 (f) 66.7 0.0 (f)Hispanic 3 33.3 33.3 0.0 (f) 33.3 0.0 (f)
2 Employment Barriers
Worked fewer than 13 weeksin 12 months before assignmentand no high school diploma or GEDat assignment
White, non-Hispanic 95 18.9 14.7 23.2 16.8 26.3Black, non-Hispanic 93 21.5 3.2 ** 50.5 *** 2.2 *** 22.6Hispanic 43 55.8 *** 9.3 11.6 0.0 (f) 23.3
Worked fewer than 13 weeksin 12 months before assignmentand receiving AFDC or other cashassistance at assignment
White, non-Hispanic 6 16.7 0.0 0.0 33.3 50.0Black, non-Hispanic 2 50.0 0.0 (f) 0.0 (f) 0.0 (f) 50.0Hispanic 2 50.0 0.0 (f) 0.0 (f) 50.0 0.0 (f)
(continued)
222C

TABLE B.17 (continued)
Employment Barrier Subgroup (a)and Ethnicity
SampleSize
CT-OS (b)(%)
Non-Training
OJT (c) Education (d)(%) (%)
Misc.JSA Non-TrainingOnly Services (e)(%) (%)
No high school diploma or GEDat assignment and receivingAFDC or other cash assitanceat assignment
White, non-Hispanic 21 14.3 14.3 19.0 14.3 38.1Black, non-Hispanic 5 0.0 (f) 0.0 (f) 80.0 ** 0.0 (f) 20.0Hispanic 5 60.0 ** 0.0 (t) 20.0 0.0 (f) 20.0
,6k3 Emnlovment Barriers
White, non-Hispanic 22 4.5 4.5 50.0 9.1 31.8Black, non-Hispanic 16 31.3 * 0.0 (f) 31.2 12.5 25.0Hispanic 7 57.1 *** 0.0 (f) 14.3 0.0 (f) 28.6
SOURCE: MDRC calculations from Background Information Form responses and from program enrollmentand participation data from the 16 SDAs.
NOTES: Calculations for this table are based on data for all white, black, and Hispanic male youthenrollees in the 18-month study sample. Enrollees from other ethnic groups were not included because ofsmall sample sizes.
The program service categories in this table are mutually exclusive; see notes b, c, d, and e below.For each employment barrier subgroup, within each program service category, a chi-square test
was applied to the difference in service receipt rates between white enrollees and black enrollees andbetween white enrollees and Hispanic enrollees. Statistical significance levels are indicated as* = 10 percent; ** = 5 percent; *** i= 1 percent.
(a) The barriers to employment include: not having a high school diploma or GED at the time ofrandom assignment; having worked fewer than 13 weeks during the 12 months prior to random assignment;and receiving AFDC or other cash assistance at the time of random assignment.
(b) The CT-OS service category includes enrollees who received CT-OS only, or CT-OS incombination with OJT, basic education, job search assistance, or miscellaneous program services.
(c) The OJT service category includes enrollees who received OJT only, or OJT in combinationwith basic education, job search assistance, or miscellaneous program services.
(d) The non-training education service category includes enrollees who received basic educationonly, or basic education in combination with job search assistance or miscellaneous program services.
(e) The miscellaneous non-training services category includes enrollees who received miscellane-ous program services only, or miscellaneous program services in combination with job search assistance.Miscellaneous program services include such activities as assessment, job-readiness preparation, vocationalexploration, job shadowing, and tryout employment. In this table, miscellaneous program services alsoinclude work experience, which is identified as a separate program service in other reports on the NationalJTPA Study.
(f) A chi-square test was inappropriate because of low expected cell frequencies.
223
L

TABLE B.18
SERVICE RECEIPT RATES FOR FEMALE YOUTH ENROLLEES,BY EMPLOYMENT BARRIER SUBGROUP AND ETHNICITY
Employment Barrier Subgroup (a)and Ethnicity
SampleSi7t
Non-Training
CT-OS (b) OJT (c) Education (d)
(%) (%) (%)
Misc.JSA Non-TrainingOnly Services (e)
(%) (%)
No Employment Barriers
White, non-Hispanic 181 40.9 24.9 6.1 14.4 13.8
Black, non-Hispanic 45 51.1 8.9 ** 0.0 (f) 17.8 22.2Hispanic 43 69.8 *** 14.0 0.0 (f) 11.6 4.7
IfdaplomolatenWorked fewer than 13 weeksin 12 months berm assignment
White, non-Hispanic 79 49.4 24.1 3.8 7.6 15.2
Black, non-Hispanic 41 41.5 9.8 9.8 17.1 22.0Hispanic 43 72.1 ** 14.0 2.3 4.7 7.0
No high school diploma or GEDat assignment
White, non-Hispanic 104 30.8 11.5 21.2 18.3 18.3
Black, non-Hispanic 27 33.3 14.8 29.6 3.7 * 18.5
Hispanic 33 69.7 a** 6.1 6.1 6.1 12.1
Receiving AFDC or other cashassistance at assignment
White, non-Hispanic 31 48.4 29.0 3.2 0.0 19.4
Black, non-Hispanic 15 53.3 26.7 0.0 (f) 13.3 (f) 6.7
Hispanic 9 66.7 0.0 (f) 0.0 (f) 33.3 (f) 0.0 (f)
2 Employment Barriers
Worked fewer than 13 weeksin 12 months before assignmentand no high school diploma or GEDat assignment
Whit *, non-Hispanic 106 30.2 9.4 39.6 5.7 15.1
Black, non-Hispanic 74 17.6 * 1.4 56.8 ** 5.4 18.9Hispanic 36 75.0 *** 2.8 8.3 *** 0.0 (f) 13.9
Worked fewer than 13 weeksin 12 months before assignmentrazd receiving AFDC or ether cashassistance at assignment
White, non-Hispanic 31 29.0 41.9 12.9 3.2 12.9
Black, non-Hispanic 35 80.0 *** 8.6 *** 5.7 2.9 2.9
Hispanic 20 80.0 *** 5.0 ** 0.0 (f) 5.0 10.0
(continued)
224
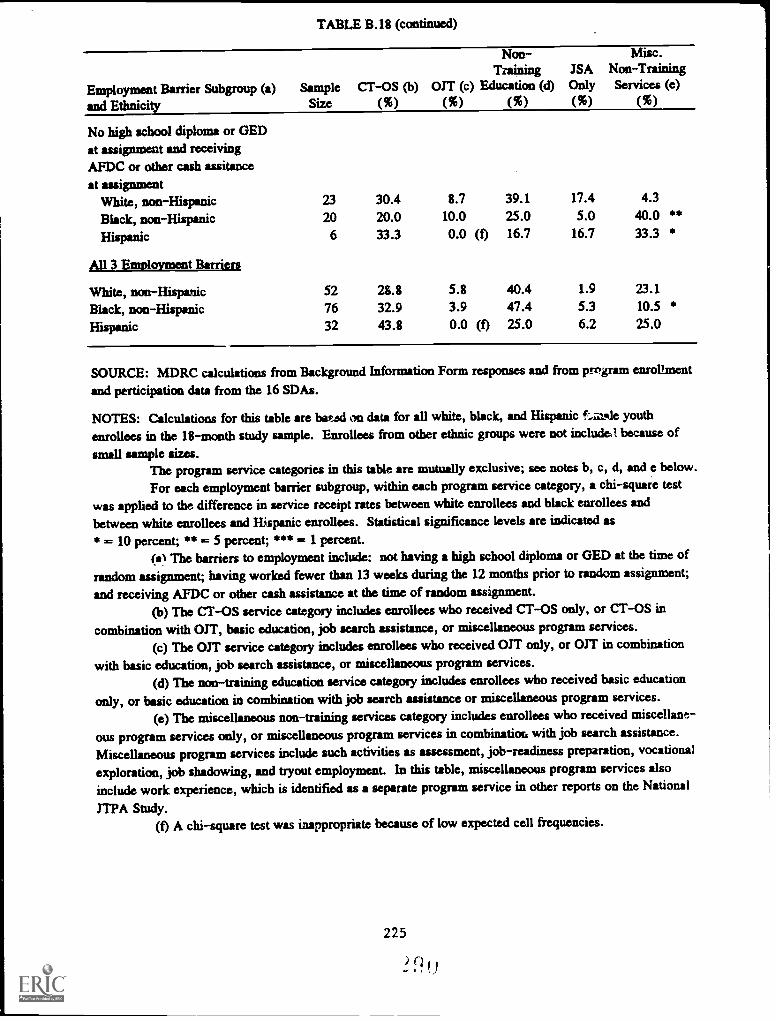
TABLE B.18 (continued)
Employment Barrier Subgroup (a) Sample CT-OS (b)
Non-Training
OJT (c) Education (d)JSAOnly
Misc.Non-TrainingServices (e)
and Ethnicity Size (%) (%) (%) (%) (%)
No high school diploma or GEDat assignment and receivingAFDC or other cash assitanceat assignment
White, non-Hispanic 23 30.4 8.7 39.1 17.4 4.3
Black, non-Hispanic 20 20.0 10.0 25.0 5.0 40.0 **Hispanic 6 33.3 0.0 (0 16.7 16.7 33.3 *
A113 Employment Barriers
White, non-Hispanic 52 28.8 5.8 40.4 1.9 23.1
Black, non-Hispanic 76 32.9 3.9 47.4 5.3 10.5 *Hispanic 32 43.8 0.0 (f) 25.0 6.2 25.0
SOURCE: MDRC calculations from Background Information Form responses and from pr'gram enrollmentand participation data from the 16 SDAs.
NOTES: Calculations for this table are bated on data for all white, black, and Hispanic f--i-aRle youthenrollees in the 18-month study sample. Enrollees from other ethnic groups were not includetl because of
small sample sizes.The program service categories in this table are mutually exclusive; see notes b, c, d, and e below.For each employment bather subgroup, within each program service category, a chi-square test
was applied to the difference in service receipt rates between white enrollees and black enrollees andbetween white enrollees and Hispanic enrollees. Statistical significance levels are indicated as* = 10 percent; ** = 5 percent; *** = 1 percent.
(11 The barriers to employment include: not having a high school diploma or GED at the time of
random assignment; having worked fewer than 13 weeks during the 12 months prior to random assignment;
and receiving AFDC or other cash assistance at the time of random assignment.(b) The CT-OS service category includes enrollees who received CT-OS only, or CT-OS in
combination with OJT, basic education, job search assistance, or miscellaneous program services.(c) The OJT service category includes enrollees who received OJT only, or OJT in combination
with basic education, job search assistance, or miscellaneous program services.(d) The non-training education service category includes enrollees who received basic education
only, or basic education in combination with job search assistance or miscellaneous program services.
(e) The miscellaneous non-training services category includes enrollees who received miscellane-
ous program services only, or miscellaneous program services in combination with job search assistance.
Miscellaneous program services include such activities as assessment, job-readiness preparation, vocational
exploration, job shadowing, and tryout employment. In this table, miscellaneous program services also
include work experience, which is identified as a separate program service in other reports on the National
JTPA Study.(f) A chi-square test was inappropriate because of low expected cell frequencies.
225

TA
BL
E B
.19
ME
DIA
N L
EN
GT
H O
F E
NR
OL
LM
EN
TFO
R M
AL
E A
DU
LT
S,B
Y S
EL
EC
TE
D B
ASE
LIN
EC
HA
RA
CT
ER
IST
ICS
AN
D S
ER
VIC
E R
EC
EIP
T
Cha
ract
eris
tican
d Su
bgro
upSa
mpl
eSi
te
Non
-M
isc.
All
Tra
inin
gJS
AN
on-T
rain
ing
Serv
ices
CT
-OS
(a)
OJT
(b)
Edu
catio
n (c
)O
nly
Serv
ices
(d)
(mon
ths)
(mon
ths)
(mon
ths)
(mon
ths)
(mon
ths)
(mon
ths)
All
Adu
lt M
ale
Enr
olle
es2,
286
2.6
4.1
2.6
3.8
0.9
1.9
Age 22
-29
1,03
92.
44.
02.
73.
90.
81.
830
-44
969
2.6
4.0
2.9
3.S
1.0
***
2.1
45 a
nd o
ver
278
2.5
3.8
2.5
5.4
1.0
**2.
7*
1..)
1., a,
Eth
nici
tyW
hite
, non
-His
pani
c1,
319
2.4
4.7
2.6
5.1
0.8
2.0
Bla
ck, n
on-H
ispa
nic
627
2.4
3.1
***
2.6
1.3
***
1.4
***
1.9
His
pani
c23
73.
0**
7.4
**3.
6**
*1.
4**
*1.
0*
2.1
Oth
er1,
032.
63.
6**
2.7
6.2
0.9
1.9
Edu
catio
nH
igh
scho
ol d
iplo
ma
or G
ED
1,50
12.
64.
02.
91.
41.
02.
2N
o hi
gh s
choo
l dip
lom
aor
GE
D63
72.
43.
92.
4**
5.3
***
0.8
**1.
7*
Wor
k E
xper
ienc
eW
orke
d 13
wee
ks o
r m
ore
in 1
2 m
ontL
e be
fore
assi
gnm
ent
1,22
62.
43.
82.
73.
60.
92.
0W
orke
d fe
wer
than
13
wee
ksin
12
mon
ths
befo
reas
sign
men
t84
62.
7*I
'4.
12.
83.
81.
0*
2.0
(con
tinue
d)

TA
BL
E B
.19
(con
tinue
d)
Cha
ract
eris
tic
and
Subg
roup
Sam
ple
Size
Non
-M
isc.
All
Tra
inin
gIS
AN
on-T
rain
ing
Serv
ices
CT
-OS
(a)
OJT
(b)
Edu
catio
n (c
)O
nly
Serv
ices
(d)
(mon
ths)
(mon
ths)
(mon
ths)
(mon
ths)
(mon
ths)
(mon
ths)
Publ
ic A
ssis
tanc
e R
ecei
ptN
ot r
ecei
ving
AFD
C o
r ot
her
cash
assi
stan
ce a
t ass
ignm
ent
1,69
82.
33.
82.
72.
60.
92.
0R
ecei
ving
AFD
C o
r ot
her
cash
assi
stan
ce a
t ass
ignm
ent
321
3.5
***
4.8
**3.
06.
0**
*1.
641
"2.
4
Bar
rier
s to
Em
ploy
men
t (e)
Non
e94
92.
43.
82.
80.
80.
92.
2
190
62.
33.
92.
63.
0**
*0.
91.
8
235
63.
0**
*4.
7*
2.8
5.5
***
1.0
2.2
ts.) i) -4
362
3.6
***
3.6
2.7
6.2
***
3.0
1.9
AFD
C H
isto
ryN
ever
rec
eive
d A
FDC
2,06
72.
43.
92.
83.
60.
91.
9R
ecei
ved
AFD
C le
ss th
an2
year
s (f
)15
93.
2**
*5.
7**
2.0
*4.
52.
3**
*2.
7R
ecei
ved
AFD
C 2
yea
rsor
mor
e (f
)37
3.3
*9.
0'-'
2.8
8.6
*0.
81.
9
Hou
seho
ld C
ompo
sitio
nSp
ouse
pre
sent
800
2.5
3.9
2.7
5.1
0.9
2.3
No
spou
se p
rese
nt, c
hild
pre
sent
167
2.9
*4.
13.
J5.
81.
31.
9
No
spou
se p
rese
nt, n
o ch
ildpr
esen
t1,
121
2.5
4.2
2.6
3.3
***
0.9
1.9
(con
tinue
d)

TA
BL
E B
.19
(con
tinue
d)
SOU
RC
E: M
DR
C c
alcu
latio
ns f
rom
Bac
kgro
und
Info
rmat
ion
Form
res
pons
es a
nd f
rom
prog
ram
enr
ollm
ent
and
part
icip
atio
n da
ta f
rom
the
16 S
DA
s.
NO
TE
S: C
alcu
latio
ns f
or th
is ta
ble
are
base
d on
dat
a fo
r al
l adu
lt m
ale
enro
llees
in th
e 18
-mon
thst
udy
sam
ple.
The
tota
l sam
ple
size
may
var
yam
ong
char
acte
rist
ics
beca
use
of m
issi
ng d
ata
for
som
e en
rolle
es.
The
med
ian
leng
th o
f en
rollm
ent i
s de
fine
das
the
num
ber
of m
onth
s af
ter
enro
llmen
t by
whi
ch h
alf
of th
e en
rolle
es in
a s
ubgr
oup
com
plet
ed th
eir J
TPA
par
ticip
atio
n.T
he p
rogr
am s
ervi
ce c
ateg
orie
s in
this
tabl
ear
e m
utua
lly e
xclu
sive
; see
not
es a
, b, c
, and
d b
elow
.Fo
r ea
ch c
hara
cter
istic
, with
in e
ach
prog
ram
ser
vice
cat
egor
y, a
chi
-squ
are
test
was
app
lied
to th
e di
ffer
ence
in m
edia
n le
ngth
of
enro
llmen
t bet
wee
nth
e fi
rst s
ubgr
oup
liste
d an
d, s
epar
atel
y, e
ach
ofth
ere
mai
ning
sub
grou
ps. S
tatis
tical
sig
nifi
canc
e le
vels
are
indi
cate
d as
* =
10
perc
ent;
** S
E 5
per
cent
; ***
= 1
per
cent
.(a
) T
he C
T-O
S se
rvic
e ca
tego
ry in
clud
es e
nrol
lees
who
rec
eive
d C
T-O
S on
ly, o
r C
T-O
S in
com
bina
tion
with
OJT
, bas
ic e
duca
tion,
job
sear
chas
sist
ance
, or
mis
cella
neou
s pr
ogra
m s
ervi
ces.
(b)
The
OJT
ser
vice
cat
egor
y in
clud
es e
nrol
lees
who
rec
eive
d O
JT o
nly,
or
OJT
in c
ombi
natio
nr.
)w
ith b
asic
edu
catio
n, jo
b se
arch
ass
ista
nce,
or m
isce
llane
ous
prog
ram
ser
vice
s.C
O(c
) T
he n
on-t
rain
ing
educ
atio
n se
rvic
e ca
tego
ryin
clud
es e
nrol
lees
who
rec
eive
d ba
sic
educ
atio
non
ly, o
r ba
sic
educ
atio
n in
com
bina
tion
with
job
sear
ch a
ssis
tanc
e or
mis
cella
neou
spr
ogra
m s
ervi
ces.
(d)
The
mis
cella
neou
s no
n-tr
aini
ng s
ervi
ces
cate
gory
incl
udes
enr
olle
es w
ho r
ecei
ved
mis
cella
ne-
ous
prog
ram
ser
vice
s on
ly, o
r m
isce
llane
ous
prog
ram
ser
vice
s in
com
bina
tion
with
job
sear
ch a
ssis
tanc
e.M
isce
llane
ous
prog
ram
ser
vice
s in
clud
e su
ch a
ctiv
ities
as a
sses
smen
t, jo
b-re
adin
ess
prep
arat
ion,
voc
atio
nal
expl
orat
ion,
job
shad
owin
g, a
nd tr
yout
em
ploy
men
t.In
this
tabl
e, m
isce
llane
ous
prog
ram
ser
vice
s al
soin
clud
e w
ork
expe
rien
ce, w
hich
is id
entif
ied
as a
sep
arat
e pr
ogra
m s
ervi
ce in
oth
er r
epor
ts o
n th
e N
atio
nal
JTPA
Stu
dy.
(e)
The
har
rier
s to
em
ploy
men
t inc
lude
: not
hav
ing
a hi
gh s
choo
l dip
lom
a or
GE
D a
t the
tim
e of
rand
om a
ssig
nmen
t; ha
ving
wor
ked
few
er th
an 1
3w
eeks
dur
ing
the
12 m
onth
s pr
ior
to r
ando
mas
sign
men
t;an
d re
ceiv
ing
AFD
C o
r ot
her
c.sh
ass
ista
nce
at th
e tim
e of
ran
dom
ass
ignm
ent.
(f)
The
AFD
C r
ecei
pt m
ay n
ot h
ave
been
con
tinuo
us.
)t)
r"."
.4.
..1

TA
BL
E B
.20
ME
DIA
N L
EN
GT
H O
F E
NR
OL
LM
EN
T F
OR
FE
MA
LE
AD
UL
TS,
BY
SE
LE
CT
ED
BA
SEL
INE
CH
AR
AC
TE
RIS
TIC
S A
ND
SE
RV
ICE
RE
CE
IPT
Cha
ract
eris
tic
and
Subg
roup
Sam
ple
Size
Non
-M
isc.
All
Tra
inin
gJS
AN
on-T
rain
ing
Serv
ices
CT
-OS
(a)
OJT
(b)
Edu
catio
n (c
)O
nly
Serv
ices
(d)
(mon
ths)
(mon
ths)
(mon
ths)
(mon
ths)
(mon
ths)
(mon
ths)
All
Adu
lt Fe
mal
e E
nrol
lees
2,88
33.
65.
22.
54.
71.
03.
0
Age 22
-29
1,26
63.
75.
42.
14.
61.
22.
430
-44
1,27
03.
75.
22.
54.
51.
13.
245
and
ove
r34
73.
1**
*5.
02.
03.
61.
03.
2
Eth
nici
tyW
hite
, non
-His
pani
c1,
622
3.6
5.5
2.6
4.7
1.0
3.0
Bla
ck, n
on-H
ispa
nic
805
3.5
4.6
***
1.5
***
5.7
1.6
***
2.7
His
pani
c35
25.
2**
*9.
5**
it3.
63.
91.
43.
1O
ther
104
2.9
**3.
8*I
PS1.
1**
0.7
SS*
1.1
3.1
Edu
catio
nH
igh
scho
ol d
iplo
ma
or G
ED
1,99
03.
85.
62.
53.
71.
23.
1N
o hi
gh s
choo
l dip
lom
a or
GE
D70
53.
4**
*4.
6**
*1.
7**
*5.
3**
*0.
8**
*2.
5
Wor
k E
xper
ienc
eW
orke
d 13
wee
ks o
r m
ore
in 1
2 m
onth
s be
fore
ass
ignm
ent
1,20
23.
55.
22.
33.
81.
03.
0W
orke
d fe
wer
than
13
wee
ksin
12
mon
ths
befo
re a
ssig
nmen
t1,
332
3.9
***
5.3
2.5
5.1
**1.
33.
0
(con
tinue
d)
2 1

,,.,1
TA
BL
E 1
3.20
(co
ntin
ued)
Cha
ract
eris
tican
d Su
bgro
upSa
mpl
eSi
ze
Non
-A
llT
rain
ing
JSA
Serv
ices
CT
-OS
(a)
OJT
(b)
Edu
catio
n (c
)O
nly
(mon
ths)
(mon
ths)
(mon
ths)
(mon
ths)
(mon
ths)
Mis
c.
Non
-Tra
inin
gSe
rvic
es (
d)
(mon
ths)
Publ
ic A
ssis
tanc
e R
ecei
ptN
ot r
ecei
ving
AFD
C o
r ot
her
cash
assi
stan
ce a
t ass
ignm
ent
1,58
93.
35.
02.
13.
61.
02.
8R
ecei
ving
AFD
C e
t oth
er c
ash
assi
stan
ce a
t ass
ignm
ent
1,08
44.
1**
*5.
52.
65.
7*4
411.
33.
0
Bar
rier
s to
Em
ploy
men
t (e)
Non
e87
93.
55.
52.
51.
31.
12.
81
1,04
63.
55.
21.
9*
3.9
***
1.0
3.0
273
63.
9**
*5.
32.
54.
9**
*1.
33.
0Iv 4 (. 0
320
14.
2**
*4.
92.
37.
044
*1.
42.
3
AFD
C H
isto
ryN
ever
rec
eive
d A
FDC
1,39
43.
34.
92.
03.
71.
03.
1R
ecei
ved
AFD
C le
ss th
an2
year
s (f
)67
84.
1**
*6.
4**
2.6
4.7
*1.
12.
8R
ecei
ved
AFD
C 2
yea
rsor
mor
e (f
)76
23.
9**
*5.
02.
7*
5.3
***
1.3
2.8
Hou
seho
ld C
ompo
sitio
nSp
ouse
pre
sent
610
3.5
5.2
2.0
e 5
1.0
3.1
No
spou
se p
rese
nt, c
hild
pre
sent
1,39
13.
8**
5.5
2.5
4.9
1.3
2.6
No
spou
se p
rese
nt, n
o ch
ildpr
esen
t51
23.
1*
4.6
2.5
3.0
**0.
93.
1
(con
tinue
d)

TA
BL
E B
.20
(con
tinue
d)
SOU
RC
E: M
DR
C c
alcu
latio
ns f
rom
Bac
kgro
und
Info
rmat
ion
Form
res
pons
es a
nd f
rom
pro
gram
enr
ollm
ent
and
part
icip
atio
n da
ta f
rom
the
16 S
DA
s.
NO
TE
S: C
alcu
latio
ns f
or th
is ta
ble
are
base
d on
dat
a fo
r al
l adu
lt fe
mal
e en
rolle
es in
the
18-m
onth
stu
dy s
ampl
e.T
he to
tal s
ampl
e si
ze m
ay v
ary
amon
g ch
arac
teri
stic
s be
caus
e of
mis
sing
dat
a fo
r so
me
enro
llees
.T
he m
edia
n le
ngth
of
enro
llmen
t is
defi
ned
as th
e nu
mbe
r of
mon
ths
afte
r en
rollm
ent b
y w
hich
hal
fof
the
enro
llees
in a
sub
grou
p co
mpl
eted
thei
r JT
PA p
artic
ipat
ion.
The
pro
gram
ser
vice
cat
egor
ies
in th
is ta
ble
are
mut
ually
exc
lusi
ve; s
ee n
otes
a, b
, c, a
nd d
bel
ow.
For
each
cha
ract
eris
tic, w
ithin
eac
h pr
ogra
m s
ervi
ce c
ateg
ory,
a c
hi-s
quar
e te
st w
as a
pplie
dto
the
diff
eren
ce in
med
ian
leng
th o
f en
rollm
ent b
etw
een
the
firs
t sub
grou
p lis
ted
and,
sep
arat
ely,
eac
h of
the
rem
aini
ng s
ubgr
oups
. Sta
tistic
al s
igni
fica
nce
leve
ls a
re in
dica
ted
as *
= 1
0 pe
rcen
t; **
= 5
per
cent
; ***
= 1
per
cent
.(a
) T
he C
T-0
1 se
rvic
e ca
tego
ry in
clud
es e
nrol
lees
who
rec
eive
d C
T-O
S on
ly, o
r C
T-O
S in
com
bina
tion
with
OJT
, bas
ic e
duca
tion,
job
sear
ch a
ssis
tanc
e, o
r m
isce
llane
ous
prog
ram
ser
vice
s.(b
) T
he O
JT s
ervi
ce c
ateg
ory
incl
udes
enr
olle
es w
ho r
ecei
ved
OJT
onl
y, o
r O
JT in
com
bina
tion
ts.)
with
bas
ic e
duca
tion,
job
sear
ch a
ssis
tanc
e, o
r m
isce
llane
ous
prog
ram
ser
vice
s.(c
) T
he n
on-t
rain
ing
educ
atio
n se
rvic
e ca
tego
ry in
clud
es e
nrol
lees
who
rec
eive
d ba
sic
educ
atio
non
ly, o
r ba
sic
educ
atitm
in c
ombi
natio
n w
ith jo
b se
arch
ass
ista
nce
or m
isce
llane
ous
prog
ram
ser
vice
s.(d
) T
he m
isce
llane
ous
non-
trai
ning
ser
vice
s ca
tego
ry in
clud
es e
nrol
lees
who
rec
eive
d m
isce
llane
-ou
s pr
ogra
m s
ervi
ces
only
, or
mis
cella
neou
s pr
ogra
m s
ervi
ces
in c
ombi
natio
n w
ith jo
b se
arch
ass
ista
nce.
Mis
cella
neou
s pr
ogra
m s
ervi
ces
incl
ude
such
act
iviti
es a
s as
sess
men
t, jo
b-re
adin
ess
prep
arat
ion,
voc
atio
nal
expl
orat
ion,
job
shad
owin
g, a
nd tr
yout
em
ploy
men
t. In
this
tabl
e, m
isce
llane
ous
prog
ram
ser
vice
s al
soin
clud
e w
ork
expe
rien
ce, w
hich
is id
entif
ied
as a
sep
arat
e pr
ogra
m s
ervi
ce in
oth
er r
epor
ts o
n th
e N
atio
nal
JTPA
Stu
dy.
(e)
The
bar
rier
s to
em
ploy
men
t inc
lude
: not
hav
ing
a hi
gh s
choo
l dip
lom
a or
GE
D a
t the
tim
e of
rand
om a
ssig
nmen
t; ha
ving
wor
ked
few
er th
an 1
3 w
eeks
dur
ing
the
12 m
onth
s pr
ior
to r
ando
m a
ssig
nmen
t;an
d re
ceiv
ing
AFD
C o
r ot
her
cash
ass
ista
nce
at th
e tim
e of
ran
dom
ass
ignm
ent.
(f)
The
AFD
C r
ecei
pt m
ay n
ot h
ave
been
con
tinuo
us.
3112
3n

TA
BL
E B
.21
ME
DIA
N L
EN
GT
H O
F E
NR
OL
LM
EN
T F
OR
MA
LE
YO
UT
HS,
BY
SE
LE
CT
ED
BA
SEL
INE
CH
AR
AC
TE
PJST
ICS
AN
D S
ER
VIC
E R
EC
EIP
T
Cha
ract
eris
tican
d Su
bgro
upSa
mpl
eSi
ze
Non
-A
llT
rain
ing
Serv
ices
CT
-OS
(a)
OJT
(b)
Edu
catio
n (c
)(m
onth
s)(m
onth
s)(m
onth
s)(m
onth
s)
Mis
c.IS
AN
on-T
rain
ing
Onl
ySe
rvic
es (
d)(m
onth
s)(m
onth
s)
All
Mal
e Y
outh
Enr
olle
es95
93.
35.
13.
13.
70.
82.
4
Age 16
-19
615
345.
23.
23.
81.
02.
720
-21
344
2.8
***
4.5
3.4
3.6
0.6
***
1.7
***
Eth
nici
ty4.
3"W
hite
, non
-His
pani
c53
02.
94.
63.
34.
10.
82.
2N
JB
lack
, non
-His
pani
c25
33.
3*
5.3
2.5
3.6
0.8
2.6
His
pani
c15
24.
1**
*5.
54.
7**
3.5
0.7
2.2
Oth
er24
2.4
3.1
2.3
3.2
0.0
(e)
2.6
Edu
catio
nH
igh
scho
ol d
iplo
ma
or G
ED
351
3.1
5.2
3.5
2.8
0.7
2.0
No
high
sch
ool d
iplo
ma
or G
ED
572
3.2
4.7
3.0
3.8
0.9
***
2.5
Wor
k E
xper
ienc
eW
orke
d 13
wee
ks o
r m
ore
in 1
2 m
onth
s be
fore
ass
ignm
ent
449
3.0
4.8
3.3
4.0
0.8
1.9
Wor
ked
few
er th
an 1
3 w
eeks
in 1
2 m
onth
s be
fore
ass
ignm
ent
427
3.4
**5.
13.
53.
80.
92.
8**
*
(con
tinue
d)
3
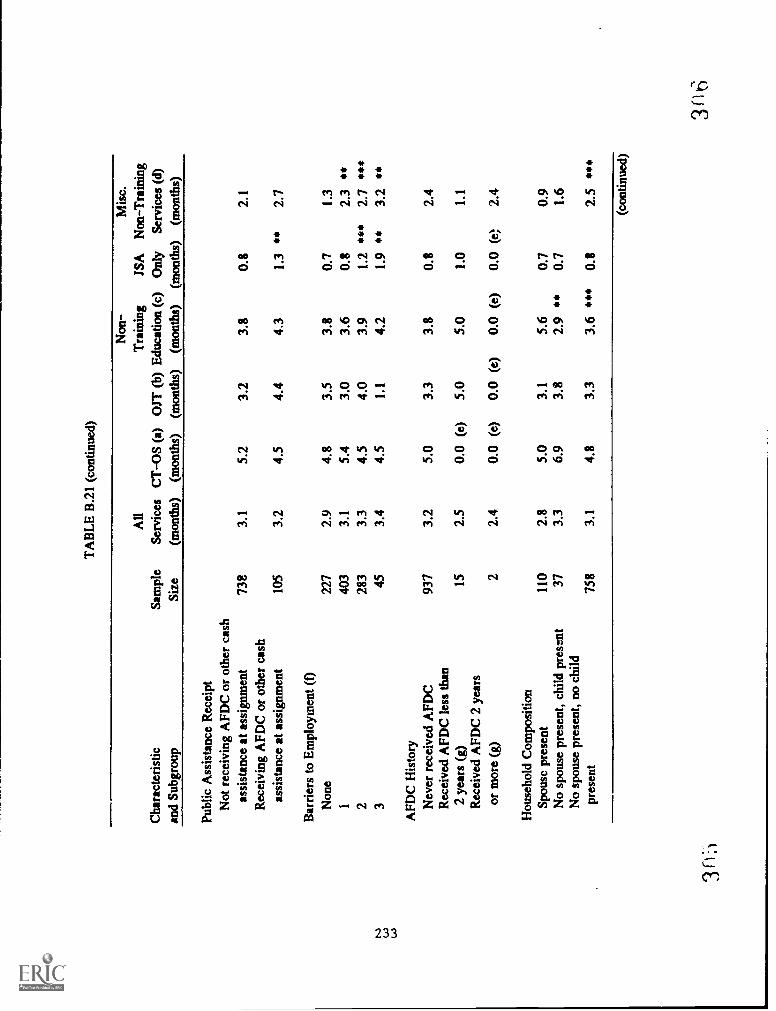
TA
BL
E B
.21
(con
tinue
d)
Cha
ract
eris
tic
and
Subg
roup
Sam
ple
Size
All
Serv
ices
(mon
ths)
Non
-M
isc.
Tra
inin
gJS
AN
on-T
rain
ing
CT
-OS
(a)
OJT
(b)
Edu
catio
n (c
)O
nly
Serv
ices
(d)
(mon
ths)
(mon
ths)
(mon
ths)
(mon
ths)
(mon
ths)
Publ
ic A
ssis
tanc
e R
ecei
ptN
ot r
ecei
ving
AFD
C o
r ot
her
cash
assi
stan
ce a
t ass
ignm
ent
738
3.1
5.2
3.2
3.8
0.8
2.1
Rec
eivi
ng A
FDC
or
othe
r ca
shas
sist
ance
at a
ssig
nmen
t10
53.
24.
54.
44.
31.
3 **
2.7
Bar
rier
s to
Em
ploy
men
t (f)
Non
e22
72.
94.
83.
53.
80.
71.
31
403
3.1
5.4
3.0
3.6
0.8
2.3
**2
283
3.3
4.5
4.0
3.9
1.2
*44
2.7
***
345
3.4
4.5
1.1
4.2
1.9
**3.
2 **
AFD
C H
isto
ryN
ever
rec
eive
d A
FDC
937
3.2
5.0
3.3
3.8
0.8
2.4
Rec
eive
d A
FDC
less
than
2 ye
ars
(g)
152.
50.
0 (e
)5.
05.
01.
01.
1R
ecei
ved
AFD
C 2
yea
rsor
mor
e (g
)2
2.4
0.0
(e)
0.0
(e)
0.0
(e)
0.0
(e)
2.4
Hou
seho
ld C
ompo
sitio
nSp
ousc
pre
sent
110
2.8
5.0
3.1
5.6
0.7
0.9
No
spou
se p
rese
nt, c
hild
pre
sent
373.
36.
93.
82.
9 **
0.7
1.6
No
spou
se p
rese
nt, n
o ch
ildpr
esen
t75
83.
14.
83.
33.
6 **
*0.
82.
541
**
(con
tinue
d)
311
3 II

TA
BL
E B
.21
(con
tinue
d)
SOU
RC
E: M
DR
C c
alcu
latio
ns f
rom
Bac
kgro
und
Info
rmat
ion
Form
res
pons
es a
nd f
rom
pro
gram
enr
ollm
ent
and
part
icip
atio
n da
ta f
rom
the
16 S
DA
s.
NO
TE
S: C
alcu
latio
ns f
or th
is ta
ble
are
base
don
dat
a fo
r al
l mal
e yo
uth
enro
llees
in th
e 18
-mon
th s
tudy
sam
ple.
The
tota
l sam
ple
size
may
var
y am
ong
char
acte
rist
ics
beca
use
of m
issi
ng d
ata
for
som
e en
rolle
es.
The
med
ian
leng
th o
f en
rollm
ent i
s de
fine
das
the
num
ber
of m
onth
s af
ter
enro
llmen
t by
whi
ch h
alf
of th
e en
rolle
es in
a s
ubgr
oup
com
plet
ed th
eir
JTPA
part
icip
atio
n.T
he p
rogr
am s
ervi
ce c
ateg
orie
s in
this
tabl
ear
e m
utua
lly e
xclu
sive
; see
not
es a
, b, c
, and
d b
elow
.Fo
r ea
ch c
hara
cter
istic
, with
in e
ach
prog
ram
ser
vice
cat
egor
y, a
chi
-squ
are
test
was
app
lied
to th
e di
ffer
ence
in m
edia
n le
ngth
of
enro
llmen
t bet
wee
n th
e fi
rst s
ubgr
oup
liste
d an
d, s
epar
atel
y, e
ach
of th
ere
mai
ning
sub
grou
ps. S
tatis
tical
sig
nifi
canc
e le
vels
are
indi
cate
d as
* =
10
perc
ent;
**5
perc
ent;
*0*
= 1
per
cent
.(a
) T
he C
T-O
S se
rvic
e ca
tego
ry in
clud
es e
nrol
lees
who
rece
ived
CT
-OS
only
, or
CT
-OS
inco
mbi
natio
n w
ith O
JT, b
asic
edu
catio
n, jo
b se
arch
ass
ista
nce,
or m
isce
llane
ous
prog
ram
ser
vice
s.(b
) T
he O
JT s
ervi
ce c
ateg
ory
incl
udes
enr
olle
es w
hore
ceiv
ed O
JT o
nly,
or
OJT
in c
ombi
natio
nt.41.
3w
ith b
asic
edu
catio
n, jo
b se
arch
ass
ista
nce,
or m
isce
llane
ous
prog
ram
ser
vice
s.(c
) T
he n
on-t
rain
ing
educ
atio
n se
rvic
e ca
tego
ry in
clud
esen
rolle
es w
ho r
ecei
ved
basi
c ed
ucat
ion
only
, or
basi
c ed
ucat
ion
in c
ombi
natio
n w
ith jo
b se
arch
ass
ista
nce o
r m
isce
llane
ous
prog
ram
ser
vice
s.(d
) T
he m
isce
llane
ous
non-
trai
ning
ser
vice
s ca
tego
ry in
clud
esen
rolle
es w
ho r
ecei
ved
mis
cella
ne-
ous
prog
ram
ser
vice
s on
ly, o
r m
isce
llane
ous
prog
ram
ser
vice
s in
com
bina
tion
with
job
sear
eh a
ssis
tanc
e.M
isce
llane
ous
prog
ram
ser
vice
s in
clud
e su
ch a
ctiv
ities
as a
sses
smen
t, jo
b-re
adin
ess
prep
arat
ion,
voc
atio
nal
expl
orat
ion,
job
shad
owin
g, a
nd tr
yout
em
ploy
men
t. In
this
tabl
e,m
isce
llane
ous
prog
ram
ser
vice
s al
soin
clud
e w
ork
expe
rien
ce, w
hich
is id
entif
ied
as a
sep
arat
e pr
ogra
m s
ervi
ce in
oth
er r
epor
ts o
n th
e N
atio
nal
JTPA
Stu
dy.
(e)
A c
hi-s
quar
e te
st w
as in
appr
opri
ate
beca
use
of lo
w e
xpec
ted
cell
freq
uenc
ies.
(I)
The
bar
rier
s to
em
ploy
men
t inc
lude
: not
hav
ing
a hi
gh s
choo
l dip
lom
a or
GE
D a
t the
tim
e of
rand
om a
ssig
nmen
t; ha
ving
wor
ked
few
er th
an 1
3 w
eeks
dur
ing
the
12m
onth
s pr
ior
to r
ando
m a
ssig
nmen
t;an
d re
ceiv
ing
AFD
C o
r ot
her
cash
ass
ista
nce
at th
e tim
e of
ran
dom
ass
ignm
ent.
(g)
The
AFD
C r
ecei
pt m
ay n
ot h
ave
been
con
tinuo
us.
.
1
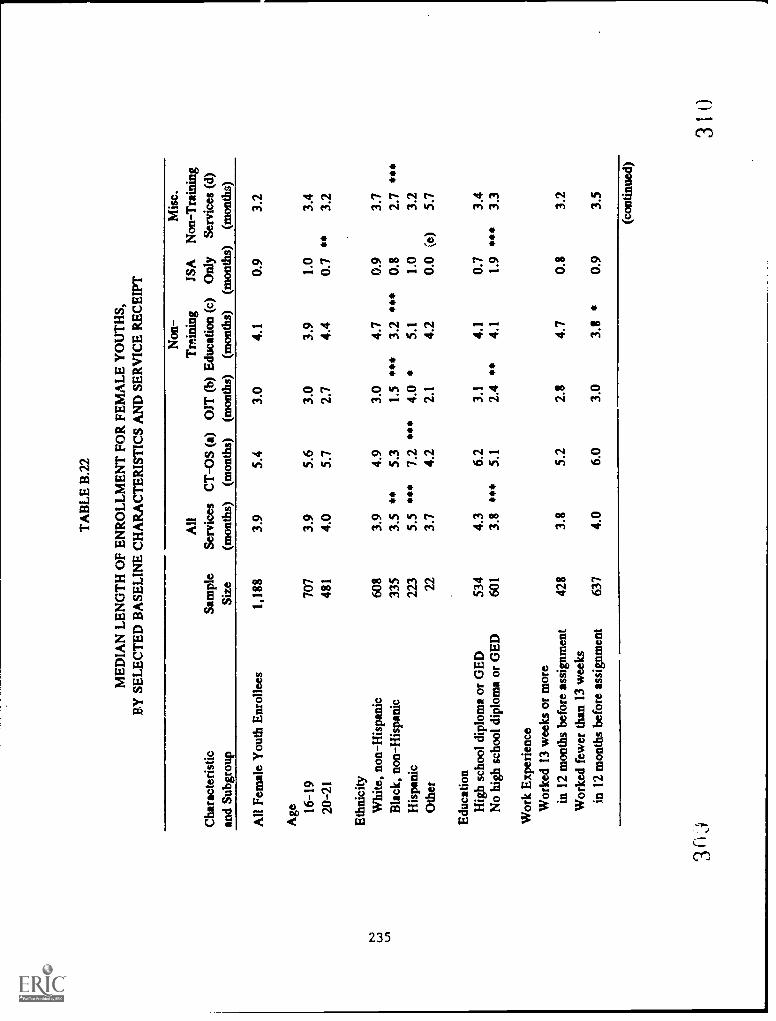
TA
BL
E B
.22
ME
DIA
N L
EN
GT
H O
F E
NR
OL
LM
EN
T F
OR
FE
MA
LE
YO
UT
HS,
BY
SE
LE
CT
ED
BA
SEL
INE
CH
AR
AC
TE
RIS
TIC
S A
ND
SE
RV
ICE
RE
CE
IPT
Cha
ract
eris
tican
d Su
bgro
upSa
mpl
eSi
ze
Non
-M
isc.
All
Tra
inin
gJS
AN
on-T
rain
ing
Serv
ices
CT
-OS
(a)
OJT
(b)
Edu
catio
n (c
)O
nly
Serv
ices
(d)
(mon
ths)
(mon
ths)
(mon
ths)
(mon
ths)
(mon
ths)
(mon
ths)
All
Fem
ale
You
th E
nrol
lees
1,18
83.
95.
43.
04.
10.
93.
2
Age 16
-19
707
3.9
5.6
3.0
3.9
1.0
3.4
20-2
148
14.
05.
72.
74.
40.
7 **
3.2
Eth
nici
tyW
hite
, non
-His
pani
c60
83.
94.
93.
04.
70.
93.
7
Bla
ck, n
on-H
ispa
nic
335
3.5
**5.
31.
5**
*3.
2**
*0.
82.
7**
*
His
pani
c22
35.
5**
*7.
2**
*4.
0*
5.1
1.0
3.2
Oth
er22
3.7
4.2
2.1
4.2
0.0
(e)
5.7
Edu
catio
nH
igh
scho
ol d
iplo
ma
or G
ED
534
4.3
6.2
3.1
4.1
0.7
3.4
No
high
sch
ool d
iplo
ma
or G
ED
601
3.8
***
5.1
2.4
**4.
11.
9si
t*3.
3
Wor
k E
xper
ienc
eW
orke
d 13
wee
ks o
r m
ore
in 1
2 m
onth
s be
fore
ass
ignm
ent
428
3.8
5.2
2.8
4.7
0.8
3.2
Wor
ked
few
er th
an 1
3 w
eeks
in 1
2 m
onth
s be
fore
ass
ignm
ent
637
4.0
6.0
3.0
3.8
*0.
93.
5
3
(con
tinue
d)
3 1
0

TABLE B.22
(con
tinue
d)
Cha
ract
eris
tican
d Su
bgro
upSa
mpl
eSi
ze
Non
-M
isc.
All
Tra
inin
gJSA
Non
-Tra
inin
gSe
rvic
es C
T-O
S (a
) O
JT (
b) E
duca
tion
(c)
Onl
ySe
rvic
es (
d)(m
onth
s)(m
onth
s)(m
onth
s)(m
onth
s)(m
onth
s)(m
onth
s)
Publ
ic A
ssis
tanc
e R
ecei
ptN
ot r
ecei
ving
AFD
C o
r ot
her
cash
assi
stan
ce a
t ass
ignm
ent
741
3.8
5.2
2.7
4.3
0.8
3.3
Rec
eivi
ngAFDC
or o
ther
cas
has
sist
ance
at a
ssig
nmen
t353
4.4
**
6.5
*3.2
4.0
1.1
3.6
Bat
hers
to E
mpl
oym
ent (
f)N
one
272
3.7
5.3
2.8
4.4
0.7
3.3
1395
4.0
5.7
2.8
4.1
0.9
**
3.2
2355
4.2
**
6.0
3.2
4.2
1.4
**
3.5
ts)
1...)
et,
3162
3.7
5.3
1.6
3.7
2.4
**
3.4
AFDC
His
tory
Nev
er r
ecei
vedAFDC
846
3.8
5.5
2.9
3.8
0.8
3.2
Rec
eive
dAFDC
less
than
2ye
ars
(g)
252
4.4
**
6.4
2.6
4.5
*0.9
4.1
**R
ecei
vedAFDC 2
year
sor
mor
e (g
)80
4.4
5.2
3.4
4.4
3.2
3.7
Hou
seho
ld C
ompo
sitio
nSp
ouse
pre
sent
138
4.1
5.1
3.0
4.9
2.0
3.0
No
spou
se p
rese
nt, c
hild
pre
sent
400
4.3
6.4
2.8
4.3
0.8
4.1
*N
o sp
ouse
pre
sent
, no
child
pres
ent
558
3.7
5.2
2.9
3.3
se.
0.8
*3.0
(con
tinue
d)3
1

TA
BL
E B
.22
(con
tinue
d)
SOU
RC
E: M
DR
C c
alcu
latio
ns f
rom
Bac
kgro
und
Info
rmat
ion
Form
res
pons
es a
nd f
rom
pro
gram
enr
ollm
ent
and
part
icip
atio
n da
ta f
rom
the
16 S
DA
s.
NO
TE
S: C
alcu
latio
ns f
or th
is ta
ble
are
base
d on
dat
a fo
r al
l fem
ale
yout
h en
rolle
es in
the
111-
mon
th s
tudy
sam
ple.
The
tota
l sam
ple
size
may
var
y am
ong
char
acte
rist
ics
beca
use
of m
issi
ng d
ata
for
som
e en
rolle
es.
The
med
ian
leng
th o
f en
rollm
ent i
s de
fine
d as
the
num
ber
of m
onth
s af
ter
enro
llmen
t by
whi
ch h
alf
of th
e en
rolle
es in
a s
ubgr
oup
com
plet
ed th
eir
JTPA
par
ticip
atio
n.T
he p
rogr
am s
ervi
ce c
ateg
orie
s in
this
tabl
e ar
e m
utua
lly e
xclu
sive
; see
not
es a
, b, c
, and
d b
elow
.Fo
r ea
ch c
hara
cter
istic
, with
in e
ach
prog
ram
ser
vice
cat
egor
y, a
chi
-squ
y s
test
was
app
lied
to th
e di
ffer
ence
in m
edia
n le
ngth
of
enro
llmen
t bet
wee
n th
e fi
rst s
ubgr
oup
liste
d an
d, s
epar
atel
y,ea
ch o
f th
ere
mai
ning
sub
grou
ps. S
tatis
tical
sig
nifi
canc
e le
vels
are
indi
cate
d as
* =
10
perc
ent;
** =
5 p
erce
nt; *
** =
1 p
erce
nt.
(a)
The
CT
-OS
serv
ice
cate
gory
incl
udes
enr
olle
es w
ho r
ecei
ved
CT
-OS
only
, or
CT
-OS
inco
mbi
natio
n w
ith O
JT, b
asic
edu
catio
n, jo
b se
arch
ass
ista
nce,
or
mis
cella
neou
s pr
ogra
m s
ervi
ces.
(b)
The
OJT
ser
vice
cat
egor
y in
clud
es e
nrol
lees
who
rec
eive
d O
JT o
nly,
or
OJT
in c
ombi
natio
n
tr.)
with
bas
ic e
duca
tion,
job
sear
ch a
ssis
tanc
e, o
r m
isce
llane
ous
prog
ram
ser
vice
s.(c
) T
he n
on-t
rain
ing
educ
atio
n se
rvic
e ca
tego
ry in
clud
es e
nrol
lees
who
rev
ived
bas
ic e
duca
tion
only
, or
basi
c ed
ucat
ion
in c
ombi
natio
n w
ith jo
b se
arch
ass
ista
nce
or m
isce
llane
ous
prog
ram
ser
vice
s.(d
) T
he m
isce
llane
ous
non-
trai
ning
ser
vice
s ca
tego
ry in
clud
es e
nrol
lees
who
rec
eive
d m
isce
llane
-ou
s pr
ogra
m s
ervi
ces
only
, or
mis
cella
neou
s pr
ogra
m s
ervi
ces
in c
ombi
natio
n w
ith jo
b se
arch
ass
ista
nce.
Mis
cella
neou
s pr
ogra
m s
ervi
ces
incl
ude
such
act
iviti
es a
s as
sess
men
t, j,,
b-re
adin
ess
prep
arat
ion,
voc
atio
nal
expl
orat
ion,
job
shad
owin
g, a
nd tr
yout
em
ploy
men
t. In
this
tabl
e, m
isce
llane
ous
prog
ram
ser
vice
s al
soin
clud
e w
ork
expe
rien
ce, w
hich
is id
entif
ied
as a
sep
arat
e pr
ogra
m s
ervi
ce in
oth
er r
epor
ts o
n th
e N
atio
nal
JTPA
Stu
dy.
(e)
A c
hi-s
quar
e te
st w
as in
appr
opri
ate
beca
use
of lo
w e
xpec
ted
cell
freq
uenc
ies.
(f)
The
bar
rier
s to
em
ploy
men
t inc
lude
: not
hav
ing
a hi
gh s
choo
ldi
plom
a or
GE
D a
t the
tim
e of
rand
om a
ssig
nmen
t; ha
ving
wor
ked
few
er th
an 1
3 w
eeks
dur
ing
the
12 m
onth
s pr
ior
to r
ando
m a
ssig
nmen
t;
and
rece
ivin
g A
FDC
or
othe
r ca
sh a
ssis
tanc
e at
the
time
of r
ando
mas
sign
men
t.
(g)
The
AFD
C r
ecei
pt m
ay n
ot h
ave
been
con
tinuo
us.
314
31 3
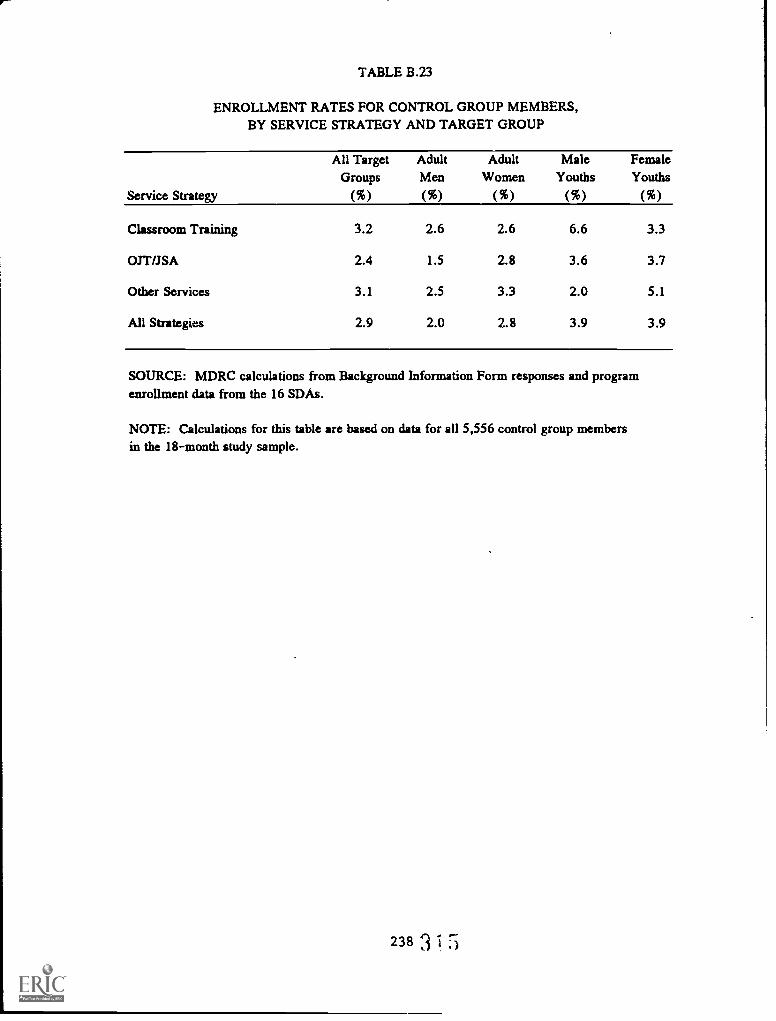
TABLE B.23
ENROLLMENT RATES FOR CONTROL GROUP MEMBERS,BY SERVICE STRATEGY AND TARGET GROUP
All TargetGroups
AdultMen
AdultWomen
MaleYouths
FemaleYouths
Service Strategy (%) (%) (%) (%) (%)
Classroom Training 3.2 2.6 2.6 6.6 3.3
OJT/JSA 2.4 1.5 2.8 3.6 3.7
Other Services 3.1 2.5 3.3 2.0 5.1
All Strategies 2.9 2.0 2.8 3.9 3.9
SOURCE: MDRC calculations from Background Information Form responses and programenrollment data from the 16 SDAs.
NOTE: Calculations for this table are based on data for all 5,556 control group membersin the 18-month study sample.
238 3 1 5

APPENDIX C
DATA SOURCES FOR THIS REPOR7'
Seven data sources were used for this report. Each source is described below.
1. The JTPA Background Information Form
A Background Information Form (BIF) was completed by all program applicants in the
study with assistance from local JTPA staff when necessary no more than 45 days before
random assignment. The BIF is the primary source of baseline information on members of the
experimental sample (both the treatment and control groups). It includes data on the applicant's
demographic characteristics; education, employment, and public assistance history; and family and
household situation. Bloom, 1991, provides a complete analysis of the BIF responses and its
implications for the National JTPA Study.
2. Participation and Program Tracking Data fromSDA Management Information Systems
Each of the 16 SDAs in the study (or, in some cases, the state in which the SDA is
located) maintains automated management information system (MIS) records that include data
on individual JTPA enrollments, activities, and terminations. The research team requested data
tapes from each SDA twice a year in order to compile a longitudinal record of JTPA
participation covering the 18 months following random assignment for each sample member.
Although each SDA collected essentially the same information, the format of their records was
different. To aid the analysis, the research team extracted the information from each SDA's
records to be used in the study and created a standard record format for it. The data elements
used in this report include: enrollment dates, activity codes, activity start and end dates, and
termination codes and dates. This information was used to identify initial and subsequent
enrollments in JTPA, the number and type of activities in which enrollees participated, and the
length of enrollment.
3. Qualitative Information and SDA Omanizational Characteristics and Practices
During the site selection process and the implementation of random assignment in the 16
selected SDAs, the research and operations teams collected a range of information from the sites,
including Job Training Plans for various JTPA program years, recruiting materials, lists of service
239
3 1 6

providers, and samples of typical vendor contracts. The team also collected information about
the SDAs' organizational structure and client flow for the purpose of designing appropriate
random-assignment procedures. This was done through meetings and interviews with local JTPA
staff and administrators, service providers, local elected officials, and PIC board members.
Systematic field research was not undertaken to study other aspects of SDA operations such as
program planning and administrative procedures, staff attitudes and daily practices, and the nature
of the services provided.
4. The ITPA Annual Status Report
The JTPA Annual Status Report (JASR) provides aggregate data on the enrollment,
participation, termination, and socioeconomic characteristics of all JTPA terminees on an annual
basis, It provides SDA performance data as well see also Section 7 in this appendix). The
research team used JASR files for program years 1987-89 to obtain background information on
the 16 SDAs in the National JTPA Study and to compare them with all SDAs in the national
JTPA system.
S. The ITPA Start Survey on Nonenrollees
Early in the random-assignment period, it became apparent to the MDRC researchers that
about one-third of the treatment group members were not being enrolled in JTPA activities. In
order to learn about the extent to which SDA staff worked with nonenrollees, the research team
drew a random sample of treatment group members from 12 of the study sites where random
assignment was occurring. The sample was drawn during two tinic periods: November 1988 -
January 1989 and March-June 1989. Slightly fewer than 40 percent of these treatment group
members were identified as not being enrolled in a JTPA activity at the time. (The final sample
of nonenrollees used for this report includes 307 treatment group members who, according to
MIS data, did not enroll in JTPA during the entire 18-month follow-up period.) The research
team then conducted telephone interviews with local staff to ask about their efforts to make
contact with the nonenrollees and to place them with a service provider or employer.
6. JTPA Fiscal Records
In order to compare the benefits and costs of JTPA, the research team collected data from
program year 1988 fiscal records in all 16 SDAs. The data include the costs of administration and
support services as well as training. In addition, all costs were tracked to identify whether money
240
317

was expended through fixed unit price, performance-based vendor contracts, cost-reimbursement
contracts, or in-house accounts. The data were collected in order to permit estimates of costs
per treatment group member for each of the three service strategies and four target groups
studied in this report, and to separate the training costs for adults and youths.
7. SDA Performance Data
In general, states have the option to adapt the SDA performance standards established by
the U.S. Department of Labor (DOL), usually by using a DOL regression model to adjust the
standards to reflect local differences in clients and labor market conditions. There is a second
adjustment methodology that enables states to account for other differences in local conditions
by allowing them to include additional factors not in the DOL model. DOL must approve any
adjustments to the standards using this second option.
Data on SDA performance standards and levels of performance used in this report come
from two sources. In Chapter 2, the research team used data reported in JASR to compare the
16 study SDAs to all SDAs in the JTPA system (see Section 4 above). In Chapter 7, in an effort
to more accurately capture trends in SDA levels of performance over the three years covered by
the study, the research team asked the 16 SDAs to provide the final state-adjusted performance
standards and levels for program years 1987-89, instead of relying solely on JASR data. The
SDA-provided standards and levels were often found to be the same as those reported in JASR,
although sometimes the state had made further adjustments that were not reflected in the most
recent JASR file. In some cases, a comnarison was not possible because the JASR data were
missing.
241
3 1

Barnow, Burt. 1987. 'The Impact of CETA Programs on Earnings: A Review of theLiterature." Journal of Human Resources 22(2):157-93.
Bassi, Laurie J. 1983. "The Effect of CETA on Postprogram Earnings of Participants." Journalof Human Resources 18(4):539-56.
Betsey, Charles L, et al., eds. 1985. Youth Employment and Training Programs: The YEDPAYeats. Washington, DC: National Research Council, National Academy Press.
Bloom, Howard S. 1991. The National JTPA Study: Baseline Characteristics of the ExperimentalSample. Bethesda, Md.: Abt Associates Inc.
Bloom, Howard S., Larry L Orr, Fred Doolittle, Joseph Hotz, and Burt Barrow. 1990. Designof the National JTPA Study. New York and Bethesda, Md.: Manpower DemonstrationResearch Corporation and Abt Associates Inc.
Bloom, Howard S., Larry L Orr, George Cave, Stephen H. Bell, and Fred Doolittle. 1993. TheNational JTPA Study: Tittle II-A Impacts on Earnings and Employment at 18 Months.Bethesda, Md.: Abt Associates Inc.
Bloom, Howard S., and Maureen A. McLaughlin. 1982. "CETA Training Programs Do TheyWork for Adults?" Washington, D.C.: Joint Congressional Budget Office-National Com-mission for Employment Policy.
Cave, George, and Fred Doolittle. 1991. Assessing JOBSTART Interim Impacts of a Programfor School Dropouts. New York: Manpower Demonstration Research Corporation.
Doolittle, Fred, and Linda Traeger. 1990. Implementing the National JTPA Study. New York:Manpower Demonstration Research Corporation.
Federal Register. March 13, 1989. "ETA Interpretation on Acceptable Performance-BasedContracts." Washington, D.C.: U.S. Government Printing Office.
Gueron, Judith M., and Edward Pauly. 1991. From Welfare to Work New York: Russell Sage
Foundation.
Job Training Longitudinal Survey Research Advisory Patiel. 1985. Recommendations of theNational Job Training Longitudinal Survey Research Advisory Panel. Prepared for the Officeof Strategic Planning and Policy Development, Employment lnd Training Administration,U.S. Department of Labor. Washington, D.C.: U.S. Department of Labor.
Kelly, Jodie Sue. 1987. JTPA Recruitment Made (Much) Easier. Washington, D.C.: NationalAssociation of Counties.
243
3i;

National Commission for Employment Policy. 1985. Serving the "Mast in Need" through Fired-Price Contracts. Unpublished.
U.S. Department of Labor, Employment and Training Administration. 1991. Improving theQuality of Training Under JTPA. Washington, D.C.: U.S. Department of Labor, Employmentand Training Administration.
U.S. Department of Labor, Inspector General. 1991. Annual Report: Office of InspectorGenera4 U.S. Department of Labor. Washington, D.C.: U.S. Department of Labor, Officeof Inspector General.
U.S. General Accounting Office. 1989. The Job Training Parincrship Act: Services and Outcomesfor Participants with Differing Needs. GAO/HRD-89-52. Gaithersburg, Md.: U.S. GeneralAccounting Office.
U.S. General Accounting Office. 1990. The Job Training Partnership Act: Youth PanicipantCharacteristics., Services, and Outcomes. GAO/HRD-90-46BR. Gaithersburg, Md.: U.S.General Accounting Office.
U.S. General Accounting Office. 1991. The Job Training Partnership Act: Racial and GenderDisparities in Services. GAO/HRD-91-148. Gaithersburg, Md.: U.S. General AccountingOffice.
Westat. 1981. Continuous Longitudinal Manpower Survey Net Impact Report No. 1: Impact on1977 Earnings of New .FY 1976 CETA Enrollees in Selected Program Activities. Reportprepared for the U.S. Department of Labor under contract no. 23-24-75-07. Rockville, Md.:Westat.
244
3 )

SELECTED MDRC PUBLICATIONS
THE NATIONAL JTPA STUDYA study of 16 local programs under the Job Training Partnership Act (JTPA), the nation's jobtraining system for low-income individuals.
Implementing the National TM Study. 1990. Fred Doolittle, Linda Traeger.A Summary of the Design and Implementation of the National JTPA Study. Forthcoming, 1993. Fred
Doolittle.
PROGRAMS FOR YOUTH
The JOBSTART DemonstrationA test of a program combining education, training, support services, and job placement for verydisadvantaged young high school dropouts.
Implementing JOBSTART: A Demonstration for School Dropouts in the 17PA System. 1989. Patricia Auspos,George Cave, Fred Doolittle, Gregory Hoerz.
Assessing JOBSTART: Interim Impacts of a Program for School Dropouts. 1991. George Cave, FredDoolittle.
JOBSTART: Final Report on a Program for School Dropouts. Forthcoming, 1993. George Cave, FredDoolittle, Hans Bos, Cyril Toussaint.
The School-to-Work Transition ProjectA study of innovative programs that help students make the transition from school to work.
The School-to-Work Transition and Youth Apprenticeship: Lessons from the U.S. Experience. Forthcoming,1993. Thomas Bailey, Donna Merritt.
The Career Beginnings EvaluationAn evaluation of a program that seeks to increase college attendance and improve job quality amongdisadvantaged high school students.
Career Beginnings Impact Evaluation: Findings from a Program for Disadvantaged High School Students.1990. George Cave, Janet Quint.
The Youth Incentive Entitlement Pilot Projects (YIEPP) DemonstrationA test of a school-conditioned job guarantee for low-income youth.
Lessons from a lob Guarantee: The Youth Incentive Entitlement Pilot Projects. Monograph. 1984. Judith
Gueron.Impacts from the Youth Incentive Entitlement Pilot Projects: Participation, Work, and Schooling Over the Full
Program Period 1982. George Farkas, D. Alton Smith, Ernst Stromsdorfer, Gail Trask, RobertJewett
Linking School and Work for Disadvantaged Youths The YIEPP Demonstration: Final ImplementationReport. 1982. William Diaz, Joseph Ball, Carl Wolfhagen.
Post-Program Impacts of the Youth Incentive Entitlement Pilot Projects. 1984. George Farkas, Randall Olsen,Ernst Stromsdorfer, Linda Sharpe, Felicity Skidmore, D. Alton Smith, Sally Merrill.
245
3 '1

PROGRAMS FOR TEENAGE PARENTS ON WELFARE
The New Chance DemonstrationA test of a comprehensive program of services that seeks to improve the economic status andgeneral well-being of a group of highly disadvantaged young women and their children.
New Chance: Implementing a Comprehensive Program for Disadvantaged Young Mothers and Their Children.1991. Janet Quint, Barbara Fink, Sharon Rowser.
The LEAP EvaluationAn evaluation of Ohio's Learning, Earning, and Parenting (LEAP) Program, which uses financialincentives to encourage teenage parents on welfare to stay in or return to school.
LEAP: Implementing a Welfare Initiative to Improve School Attendance Among Teenage Parents. 1991. DanBloom, Hilary Kopp, David Long, Denise Polit.
LEAP: Operation of the Program and Impacts on School Attendance and Performance Forthcoming, 1993.Dan Bloom, Veronica Fellerath, David Long, Robert Wood.
Project RedirectionA test of a comprehensive program of services for pregnant and parenting teenagers.
The Challenge of Serving Teenage Mothers: Lessons from Project Redirection. Monograph. 1988. DenisePolit, Janet Quint, James Riccio.
WELFARE-TO-WORK PROGRAMS
From Welfare to Work (Russell Sage Foundation). Book. 1991. Judith M. Gueron, Edward Pauly. Asynthesis of research findings on the effectiveness of welfare-to-work programs. Chapter 1, which isthe summary of the book, is also published separately by MDRC.
Reforming Welfare with Work (Ford Foundation). Monograph. 1987. Judith M. Gueron. A review ofwelfare-to-work initiatives in five states.
Papers for Practitioners Series
Assessing JOBS Participants: Issues and Trade-offs. 1992. Patricia Auspos, Kay Sherwood. Lessons fromemployment and training programs for assessment in JOBS.
Linking Welfare and Education: A Study of New Programs in Five States. 1992. Edward Pauly, David Long,Karin Martinson. Key issues in providing education services to welfare recipients.
Improving Productivity in Local JOBS Programs. Forthcoming, 1993. Eugene Bardach. Lessons aboutmanaging JOBS programs by crcating 'high- expectations" environments for welfare recipients andstaff.
The JOBS EvaluationAn evaluation of welfare-to-work programs doe .rating under the Job Opportunities and Basic SkillsTraining (JOBS) provisions of the Family Support Act of 1988.
From Welfare to Work (Russell Sage Foundation). Book. 1991. Judith M. Gueron, Edward Pauly. Seedescription above.
The GAIN EvaluationAn evaluation of California's Greater Avenues for Independence (GAIN) Program, which iscurrently operating as the state's JOBS program and features upfront basic education as well as jobsearch and other activities.
246
r:3

GAIN: Planning and Early Implementation. 1987. John Wallace, David Long.GAIN: Child Care in a Welfare Employment Initiative 1989. Karin Martinson, James Riccio.GAIN: Early Implementation Erperiences and Lessons. 1989. James Riccio, Barbara Goldman, Gayle
Hamilton, Karin Martinson, Alan Orenstein.GAIN: Participation Patients in Four Counties. 1991. Stephen Freedman, James Riccio.GAIN: Program Strategies, Participation PatentS, and First-Year Impacts in Sir Counties. 1992. James Riccio,
Daniel Friedlander.GAIN: Second-Year Impacts in Six Counties. Forthcoming, 1993.
The Saturation Work Initiative Model (SWIM)A test of the feasibility and effectiveness of an ongoing participation requirement in a welfare-to-work program.
Final Report on the Saturation Worlc Initiative Model in San Diego. 1989. Gayle Hamilton, DanielFriedlander.
The Saturation Work Initiative Model in San Diego: A Five-Year Follow-up Study. Forthcoming, 1993. DanielFriedlander, Gayle Hamilton.
The Subgroup/Performance Indicator StudyA study of the impacts of selected welfare-to-work programs on subgroups of the AFDC caseload.
A Study of Paformance Measures and Subgroup Impacts in Three Welfare Employment Programs. 1987.Daniel Friedlander, David
Subgroup Impacts and Performance Indicators for Selected Welfare Employment Programs. 1988. DanielFriedlander.
THE PARENTS' FAIR SHARE DEMONSTRATIONA demonstration aimed al reducing child poverty by increasing the job-holding, earnings, and childsupport payments of unemployed, noncustodial parents (usually fathers) of children receiving publicassistance.
Caring and Paying. What Fathers and Mothers Say About Child Support. Monograph. 1992. FrankFurstenberg, Jr., Kay Sherwood, Mercer Sullivan.
A Case Study of Child Support Enforcement Processes. Working Paper. Forthcoming, 1993. Dan Bloom.
THE NATIONAL SUPPORTED WORK DEMONSTRATIONA test of a transitional work experience program for four disadvantaged groups.
Summary and Findings of the National Supported Work Demonstration. Book. 1980. Board of Directors,MDRC.
The Impact of Supported Work on Young School Dropouts. 1980. Rebecca Maynard.The Impact of Supported Work on Er-Addicts. 1981. Katherine Dickinson, Rebecca Maynard.The Impact of Supported Work on Er-Offenders. 1981. Irving Piliavin, Rosemary Gartner.The Impact of Supported Work on LongLTerm Recipients of AFDC Benefus. 1981. Stanley Masters, Rebecca
Maynard.The Supported Work Evaluation: Final Benefit-Cost Analysis. 1981. Peter Kemper, David Long, Craig
Thornton.
247

Manpower DemonstrationResearch CorporationThree Park AvenueNew York, New York 10016(212) 532-3.200.
.88 Kearny Street, Suite 1650San VranciscO, California 9-4108.(445) 8 1 3.8 0
BEST CIPV