Embed Size (px)
Citation preview
Tel: +961 1 780200 Fax: +961 1 780206 P.O. Box 113-6194
Hamra, Beirut 1103 2100 Lebanon
Email: [email protected]
Turkish-Arab Capital Markets Forum November 16, 2012
Mr. Walid HayeckHead of Asset Management
The National Investor
TURKISH-ARAB CAPITAL MARKETS FORUM NOVEMBER 2012
Prospects for Turkish/Arab PE and M&AThe Arab Angle
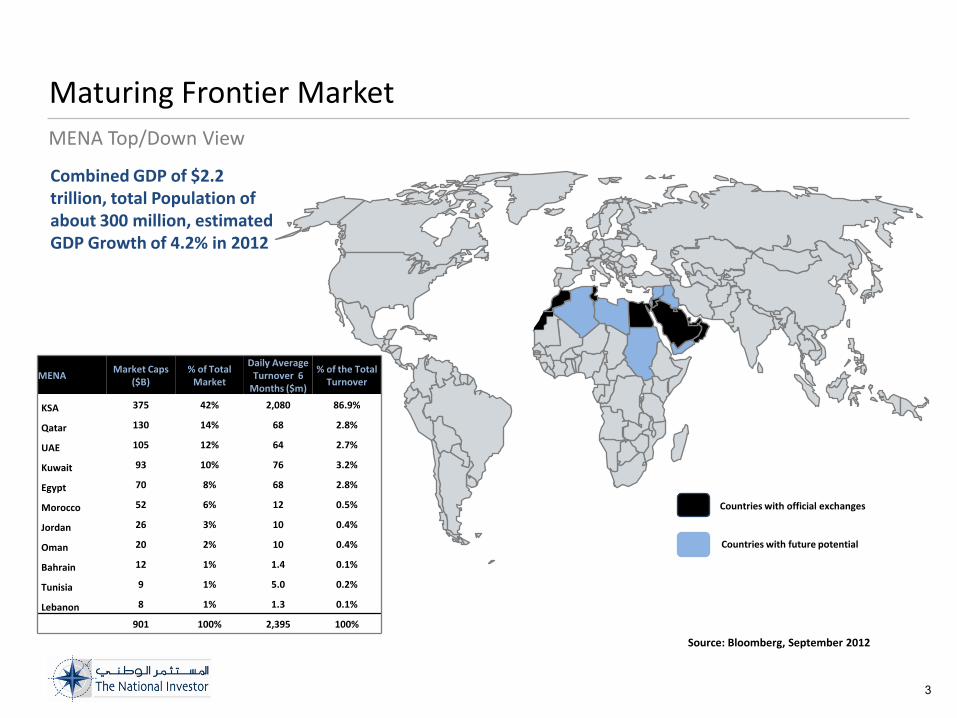
Maturing Frontier Market
Combined GDP of $2.2 trillion, total Population of about 300 million, estimated GDP Growth of 4.2% in 2012
MENA Top/Down View
Source: Bloomberg, September 2012
MENAMarket Caps
($B)% of Total
Market
Daily Average Turnover 6
Months ($m)
% of the Total Turnover
KSA 375 42% 2,080 86.9%
Qatar 130 14% 68 2.8%
UAE 105 12% 64 2.7%
Kuwait 93 10% 76 3.2%
Egypt 70 8% 68 2.8%
Morocco 52 6% 12 0.5%
Jordan 26 3% 10 0.4%
Oman 20 2% 10 0.4%
Bahrain 12 1% 1.4 0.1%
Tunisia 9 1% 5.0 0.2%
Lebanon 8 1% 1.3 0.1%
901 100% 2,395 100%
Countries with future potential
Countries with official exchanges
3
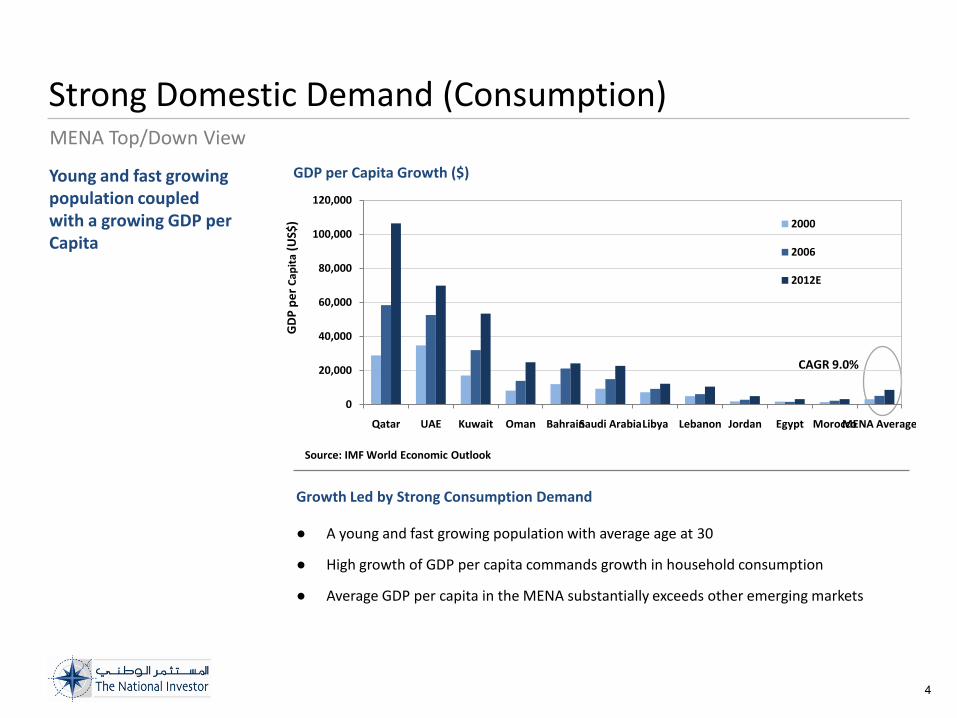
Strong Domestic Demand (Consumption)MENA Top/Down View
Young and fast growing population coupled with a growing GDP per Capita
CAGR 9.0%
Source: IMF World Economic Outlook
Growth Led by Strong Consumption Demand
● A young and fast growing population with average age at 30
● High growth of GDP per capita commands growth in household consumption
● Average GDP per capita in the MENA substantially exceeds other emerging markets
GDP per Capita Growth ($)
4
0
20,000
40,000
60,000
80,000
100,000
120,000
Qatar UAE Kuwait Oman BahrainSaudi ArabiaLibya Lebanon Jordan Egypt MoroccoMENA Average
GD
P p
er
Cap
ita
(US$
) 2000
2006
2012E
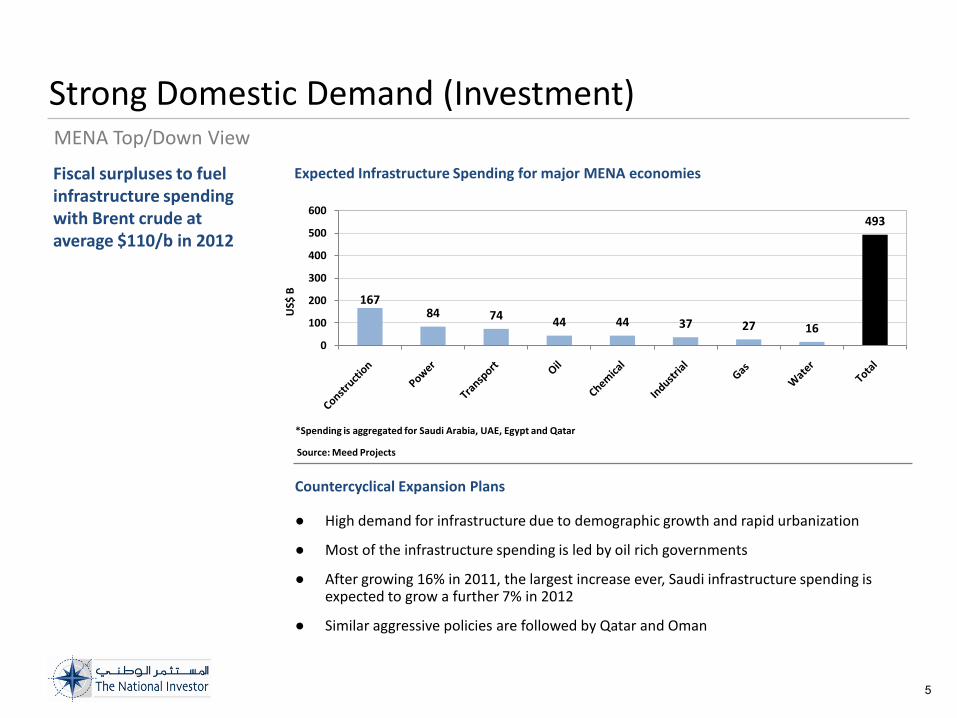
Strong Domestic Demand (Investment) MENA Top/Down View
Fiscal surpluses to fuel infrastructure spending with Brent crude at average $110/b in 2012
US$
B
Source: Meed Projects
Countercyclical Expansion Plans
● High demand for infrastructure due to demographic growth and rapid urbanization
● Most of the infrastructure spending is led by oil rich governments
● After growing 16% in 2011, the largest increase ever, Saudi infrastructure spending is expected to grow a further 7% in 2012
● Similar aggressive policies are followed by Qatar and Oman
Expected Infrastructure Spending for major MENA economies
5
16784 74
44 44 37 27 16
493
0
100
200
300
400
500
600
*Spending is aggregated for Saudi Arabia, UAE, Egypt and Qatar
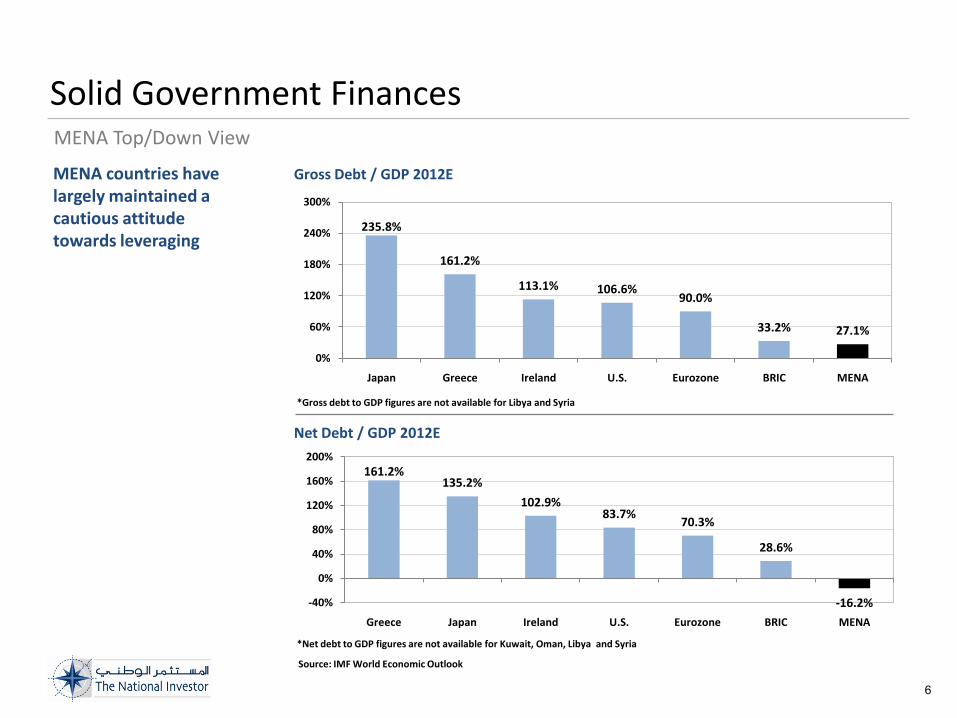
Solid Government Finances MENA Top/Down View
MENA countries have largely maintained a cautious attitude towards leveraging
Gross Debt / GDP 2012E
Net Debt / GDP 2012E
Source: IMF World Economic Outlook
*Gross debt to GDP figures are not available for Libya and Syria
6
235.8%
161.2%
113.1% 106.6%90.0%
33.2% 27.1%
0%
60%
120%
180%
240%
300%
Japan Greece Ireland U.S. Eurozone BRIC MENA
161.2%135.2%
102.9%83.7%
70.3%
28.6%
-16.2%-40%
0%
40%
80%
120%
160%
200%
Greece Japan Ireland U.S. Eurozone BRIC MENA
*Net debt to GDP figures are not available for Kuwait, Oman, Libya and Syria
Well Re-Capitalized Banking SystemMENA Top/Down View
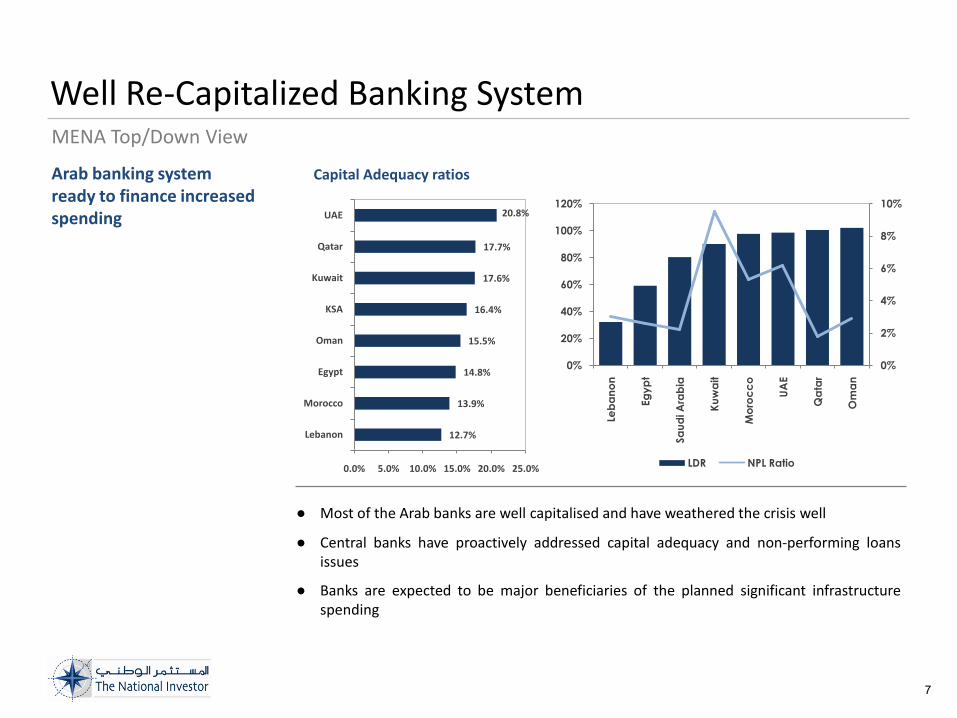
Arab banking system ready to finance increased spending
Capital Adequacy ratios
● Most of the Arab banks are well capitalised and have weathered the crisis well
● Central banks have proactively addressed capital adequacy and non-performing loansissues
● Banks are expected to be major beneficiaries of the planned significant infrastructurespending
7
12.7%
13.9%
14.8%
15.5%
16.4%
17.6%
17.7%
20.8%
0.0% 5.0% 10.0% 15.0% 20.0% 25.0%
Lebanon
Morocco
Egypt
Oman
KSA
Kuwait
Qatar
UAE
0%
2%
4%
6%
8%
10%
0%
20%
40%
60%
80%
100%
120%
Leb
an
on
Eg
yp
t
Sa
ud
i A
rab
ia
Ku
wa
it
Mo
roc
co
UA
E
Qa
tar
Om
an
LDR NPL Ratio
Possibility of a Re-Rating?MENA Top/Down View
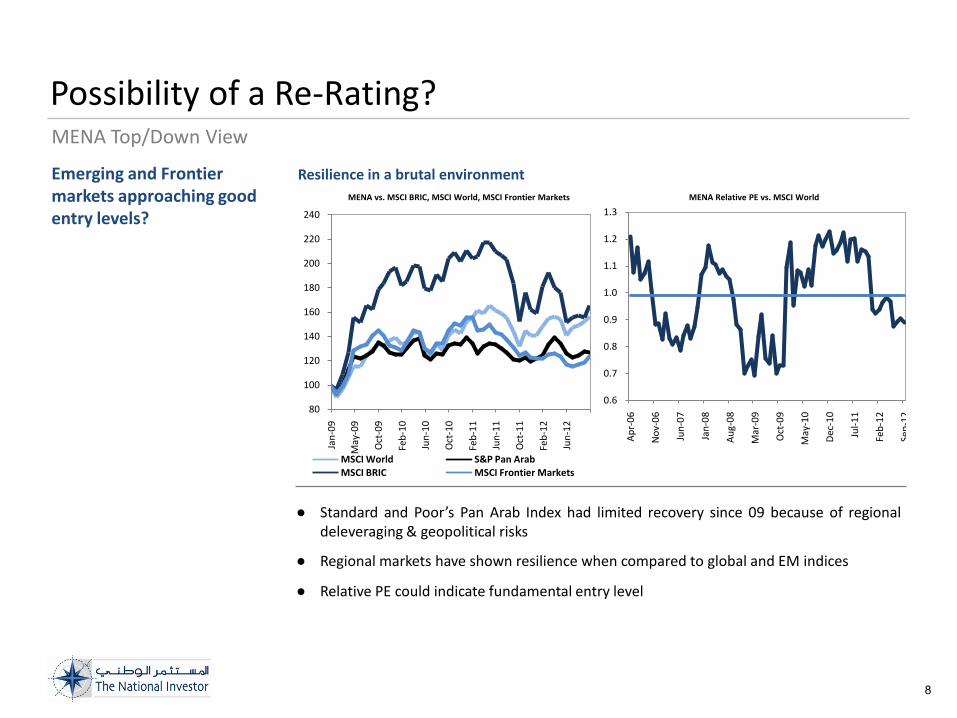
Emerging and Frontier markets approaching good entry levels?
MENA vs. MSCI BRIC, MSCI World, MSCI Frontier Markets
Resilience in a brutal environment
● Standard and Poor’s Pan Arab Index had limited recovery since 09 because of regionaldeleveraging & geopolitical risks
● Regional markets have shown resilience when compared to global and EM indices
● Relative PE could indicate fundamental entry level
MENA Relative PE vs. MSCI World
8
0.6
0.7
0.8
0.9
1.0
1.1
1.2
1.3
Ap
r-0
6
No
v-0
6
Jun
-07
Jan
-08
Au
g-0
8
Mar
-09
Oct
-09
May
-10
Dec
-10
Jul-
11
Feb
-12
Sep
-1280
100
120
140
160
180
200
220
240
Jan
-09
May
-09
Oct
-09
Feb
-10
Jun
-10
Oct
-10
Feb
-11
Jun
-11
Oct
-11
Feb
-12
Jun
-12
MSCI World S&P Pan ArabMSCI BRIC MSCI Frontier Markets
MENA Performance and Valuations MENA Top/Down View
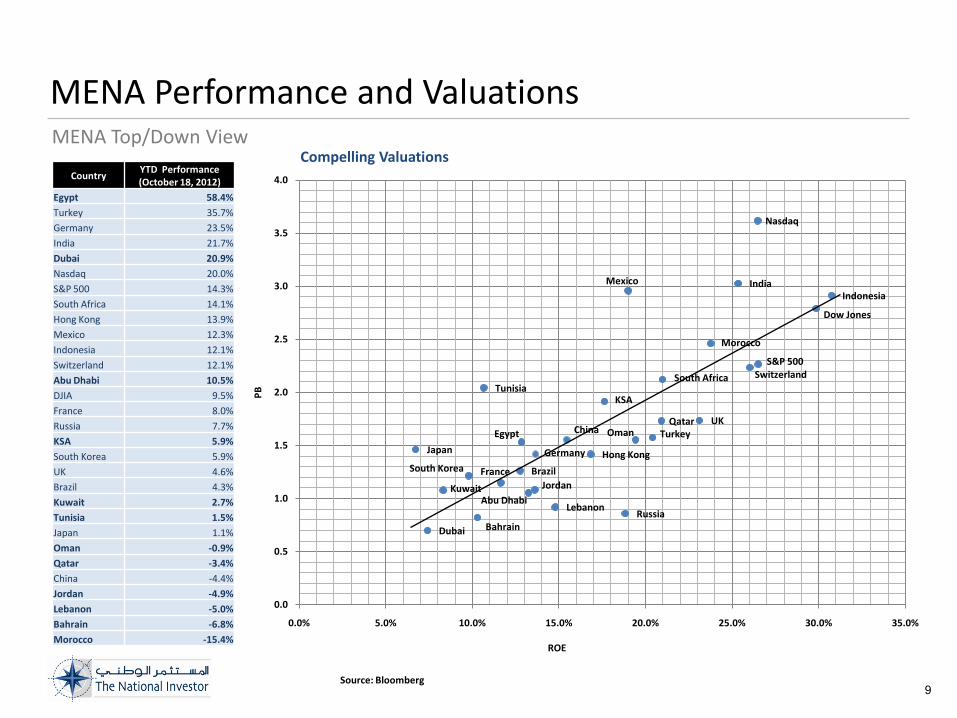
Compelling ValuationsCountry
YTD Performance (October 18, 2012)
Egypt 58.4%
Turkey 35.7%
Germany 23.5%
India 21.7%
Dubai 20.9%
Nasdaq 20.0%
S&P 500 14.3%
South Africa 14.1%
Hong Kong 13.9%
Mexico 12.3%
Indonesia 12.1%
Switzerland 12.1%
Abu Dhabi 10.5%
DJIA 9.5%
France 8.0%
Russia 7.7%
KSA 5.9%
South Korea 5.9%
UK 4.6%
Brazil 4.3%
Kuwait 2.7%
Tunisia 1.5%
Japan 1.1%
Oman -0.9%
Qatar -3.4%
China -4.4%
Jordan -4.9%
Lebanon -5.0%
Bahrain -6.8%
Morocco -15.4%
Source: Bloomberg9
Nasdaq
South Africa
Dow Jones
Qatar
Indonesia
UK
Morocco
KSA
S&P 500
Abu Dhabi
Tunisia
Switzerland
Turkey
Mexico
South Korea
Oman
Japan
Dubai
Lebanon
France
Kuwait
Bahrain
China
Jordan
Germany
India
Hong Kong
Russia
Brazil
Egypt
0.0
0.5
1.0
1.5
2.0
2.5
3.0
3.5
4.0
0.0% 5.0% 10.0% 15.0% 20.0% 25.0% 30.0% 35.0%
PB
ROE
Positive Prospects for PE Investing
● Despite political events the outlook for PE in MENA remains positive because of theregion’s robust macroeconomic fundamentals
● Long term economic growth looks sustained through hydrocarbons, demographicsand economic reforms
● Arab spring should accelerate reforms and encourage open market economy andcountercyclical measures
● Positive sentiment is largely driven by the growth prospects of the GCC, whichremained largely sheltered from the political turmoil
● Lower yield environment and lack of liquidity in the public markets should encourageallocation to regional PE as an asset class
● PE firms are focusing on sectors such as healthcare, education, consumer goods, oiland gas, which are likely to benefit from government spending and regulatorychanges. PE firms also seek to invest in industries such as railways, toll-ways, portsand utilities, which are set to attract billions in capital spending.
● Arab PE firms seek to expand outside the region in places like Turkey or as far as Indiaand Sub-Saharan Africa. Within the region, PE firms prefer North Africa, Saudi Arabiaand UAE
● Political uncertainties may offer new chances to far-sighted PE firms in areas such asSMEs, venture capital, turnaround and distressed situations
Strong fundamentals in spite of global crisis, while ‘Arab Spring’ should accelerate reform
Positive Outlook for PE Investing MENA Top/Down View
10
Challenges and Hurdles delaying the development of Private Equity
● As competition for capital intensifies, local policies, regulations and business practicesbecome increasingly important
● One of the biggest challenges for PE firms is to proceed with exits that satisfyinvestors due to the lack of liquidity in local stock markets and the limited appetiteamong trade buyers
● In addition, scarcity of investible companies and limitations on the ability of PE firmsto obtain controlling stakes could continue to hamper deal flow
Governments Should Lead the Way for the Development of the Industry
● Strengthen investors confidence through protecting shareholders rights (votingrights, transparency, timely and reliable enforcement of shareholder and creditordisputes)
● Converge towards sound and internationally recognized corporate governance anddisclosure standards
● Liberalize investment restrictions for local and regional institutional investors. Channelmore sovereign wealth and pension funds investments towards regional markets andinitiatives
● Improve access to public equity markets by strengthening local stock exchangesthrough additional reforms and regulations, and maybe consolidation
● Support creative new initiatives by providing government guarantees or subsidizedfinancing rates, or through the provision of seed capital
The magnitude of the development gaps require governments to do much more to promote PE
Need for LeadershipMENA Top/Down View
11

New Industry Dynamics Force PE Firms to Rethink their Modus Operandi
● A more difficult environment for PE firms and returns will improve only if fundmanagers adapt their models to the new MENA realities
● Institutional investors today prefer fund managers with local base operation togenerate better market intelligence, investigate new opportunities, conduct duediligence and maintain ongoing direct involvement
● Local managers are more culturally attuned and committed to the region and dobenefit from the critical sixth sense about what is going on, what are the good dealsand who are the good people to invest with and to bet on
● Extraordinary challenges require more hands-on portfolio monitoring to restructurecapital and management and adjust boom-time business models into moresustainable models
● Fund managers are to become more proactive in deal sourcing and selection ratherthan waiting for investment proposals to lend on their desks.
● A need to look for creative exits beyond public offerings that are not currentlyavailable (trade sale, management buyout, mezzanine funding with steady fixedincome return stream).
Relying on stronger local knowledge and focusing on SMEs
Adapting to New RealitiesMENA Top/Down View
12