Embed Size (px)
Citation preview
1
The National Economic, Environment and Development Studies
(NEEDS) for Climate Change Project
FINAL REPORT
Nadim Farajalla
Marcus Marktanner
Leila Dagher
Philippe Zgheib
Issam Fares Institute for Public Policy and International Affairs
American University of Beirut
June 2010
2
A) Overview ...........................................................................................4
a) Mitigation: Electric Power Sector..................................................6 b) Adaptation: Agriculture Sector ......................................................9
B) Key Findings on costs of implementing priority mitigation and adaptation measures ..................................................................................15
a) Cost of implementing priority mitigation measures ....................15 b) Cost of implementing priority adaptation measures ....................17
C) Key Findings on Financial and Policy instruments for addressing climate change ..........................................................................................21
a) Financial Instruments ...................................................................21 b) Policy Instruments........................................................................24
D) Institutional framework ...................................................................26 E) Lessons learned ...............................................................................27 F) References .......................................................................................29 Appendix...................................................................................................32

3
4
A) Overview
Climate change has become an accepted reality. Its impacts have been recorded and
documented throughout the world. The Centre for Research on the Epidemiology of
Disasters (CRED) in Belgium has recorded 39 climatologic disasters1 for Western
Asia since 1969. Twelve disasters were recorded in the year 2000 alone. The majority
of these disasters were droughts (16), followed by extreme temperatures (14), and
wildfires (9). People�s livelihood is mostly challenged by droughts, which have
affected more than 51 million people in Western Asia in the last 40 years (CRED,
2009). The damage associated with all climatologic events is estimated at more than
$1.4 billion. Most of these costs occurred after 1990. Lebanon has only one entry in
the CRED database, which is for 2007 under the wildfire category. Although the
record indicates that no persons had been affected and no damage occurred, existing
climate change models predict that the risk of climatologic disasters is increasing.
Estimates by Farajalla et al. (2009) indicate that Beirut�s minimum temperature has
increased by approximately 2.9oC over the last 125 years. Cline (2007) estimates for
the Western Asian region that by the year 2100 precipitation and agricultural
production will decrease by up to 15 and 25 percent, respectively. Preliminary results
from Lebanon�s Second National Communication (SNC) indicate that by 2036 the
maximum temperature in some parts of Lebanon could increase by as much as 1.8oC
while the minimum temperature would increase by 1.5oC. The same study estimates
that precipitation countrywide would decrease by 15% to 20%. Initial findings of the
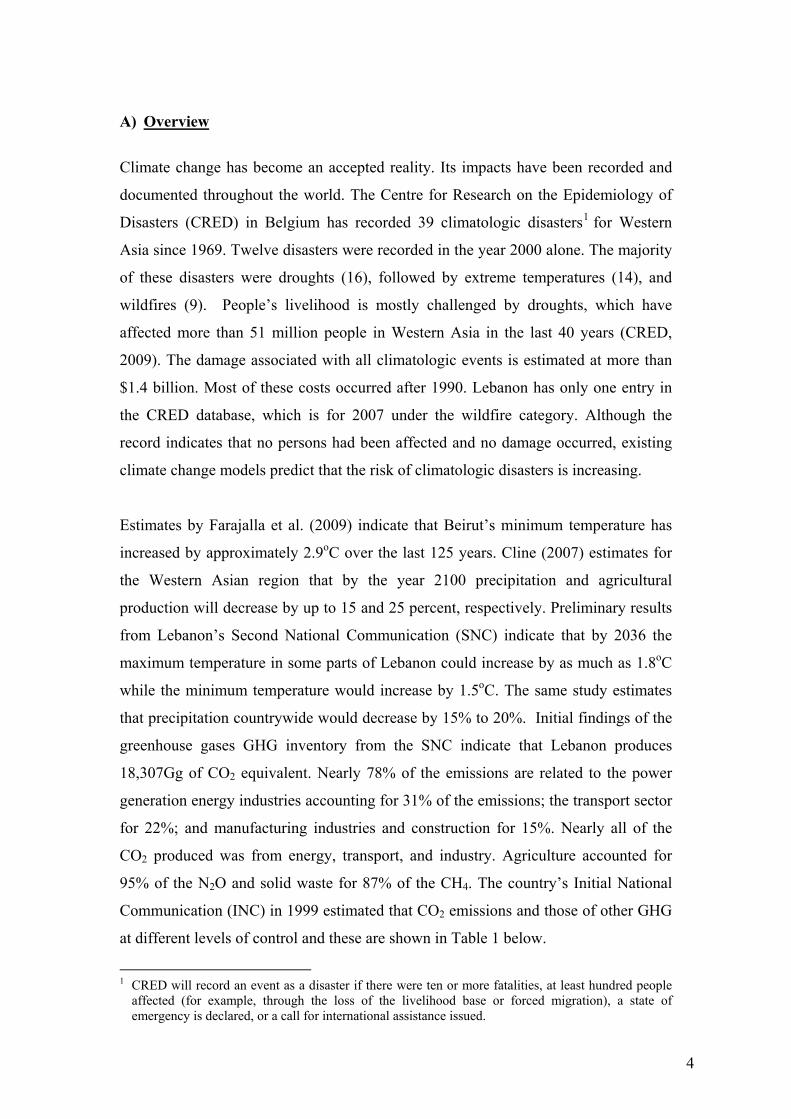
greenhouse gases GHG inventory from the SNC indicate that Lebanon produces
18,307Gg of CO2 equivalent. Nearly 78% of the emissions are related to the power
generation energy industries accounting for 31% of the emissions; the transport sector
for 22%; and manufacturing industries and construction for 15%. Nearly all of the
CO2 produced was from energy, transport, and industry. Agriculture accounted for
95% of the N2O and solid waste for 87% of the CH4. The country�s Initial National
Communication (INC) in 1999 estimated that CO2 emissions and those of other GHG
at different levels of control and these are shown in Table 1 below.
1 CRED will record an event as a disaster if there were ten or more fatalities, at least hundred people
affected (for example, through the loss of the livelihood base or forced migration), a state of emergency is declared, or a call for international assistance issued.
5
Table 1. Projections of Greenhouse Gases Emissions according to the INC
1994 � 2004 2005 - 2040
4% 6% 8% Carbon Dioxide 39644 741450 1200870 1952920 Carbon Monoxide 8.76 180 275 430 Nitrogen 117 2074 3343 5421 Sulfur 557 8459 14492 24362
Although these numbers are only estimates and different climate change models
arrive at different conclusions, there is little doubt that Lebanon will be affected by
climate change. The implications of climate change to a country like Lebanon are
often seen in their potential to destabilize the country internally and externally.
Externally, climate change may stir armed conflict over scarce water resources in the
region (Brown and Crawford 2009). Internally, it may lead to an increase in rural-
urban migration and social instability as livelihoods in rural communities deteriorate.
Lebanon has undertaken several steps in its efforts to combat climate change. It has
ratified the United Nations Framework Convention on Climate Change (UNFCCC) in
1994 and acceded to the Kyoto Protocol in 2006. Lebanon has also been actively
engaged in most of the climate change related meetings through the Ministry of
Environment. It issued its first national communication in 1999 and the preparation of
technology needs assessments report in 2002. In 2007, it commenced its second
national communication.
Several efforts have been carried out by the government of Lebanon and by non-
governmental organizations to study climate change and help develop adaptation and
mitigation efforts and programs. For example, concerted efforts are underway to
protect and preserve the country�s forests. The ministry of agriculture (MoAg) and the
ministry of environment (MoE) have various efforts aimed at reforestation,
afforestation, and conservation and management of protected areas including key
cedar forests such as the Ehden and Barouk forests. A study on the technology needs
assessments for Lebanon identified the following five sectors as major contributors to
greenhouse gas (GHG) emissions: (i) power, (ii) transport, (iii) industry, (iv) waste, and (v)
building/construction.
6
The Intergovernmental Panel on Climate Change (IPCC) in its Fourth Assessment
Report has emphasized that mitigation efforts in the next 15 to 20 years will have a
large impact on opportunities to achieve lower stabilization levels and thus have the
potential to minimize major climate change impacts (IPCC 2007).
This study focuses on two economic sectors that are directly impacted by climate
change: (i) electric power sector and (ii) the agricultural sector. The former represents
a sector in which mitigation measures are called for while the latter is a sector mainly
geared for adaptation.
a) Mitigation: Electric Power Sector
As is common in most developing countries, electricity generation, transmission, and
distribution in Lebanon is monopolized by a vertically-integrated public utility,
Electricite du Liban (EDL). Electricity generation is limited to two types of power
plants: thermal plants (2034 MW) and hydropower plants (273 MW), with a total
capacity of 2307 MW (ALMEE 2006). Thermal power plants run on diesel oil, fuel
oil, or natural gas depending on their turbine technology; steam turbines (1024 MW)
use fuel oil, gas turbines (140 MW) use diesel oil, and combined cycle gas turbines
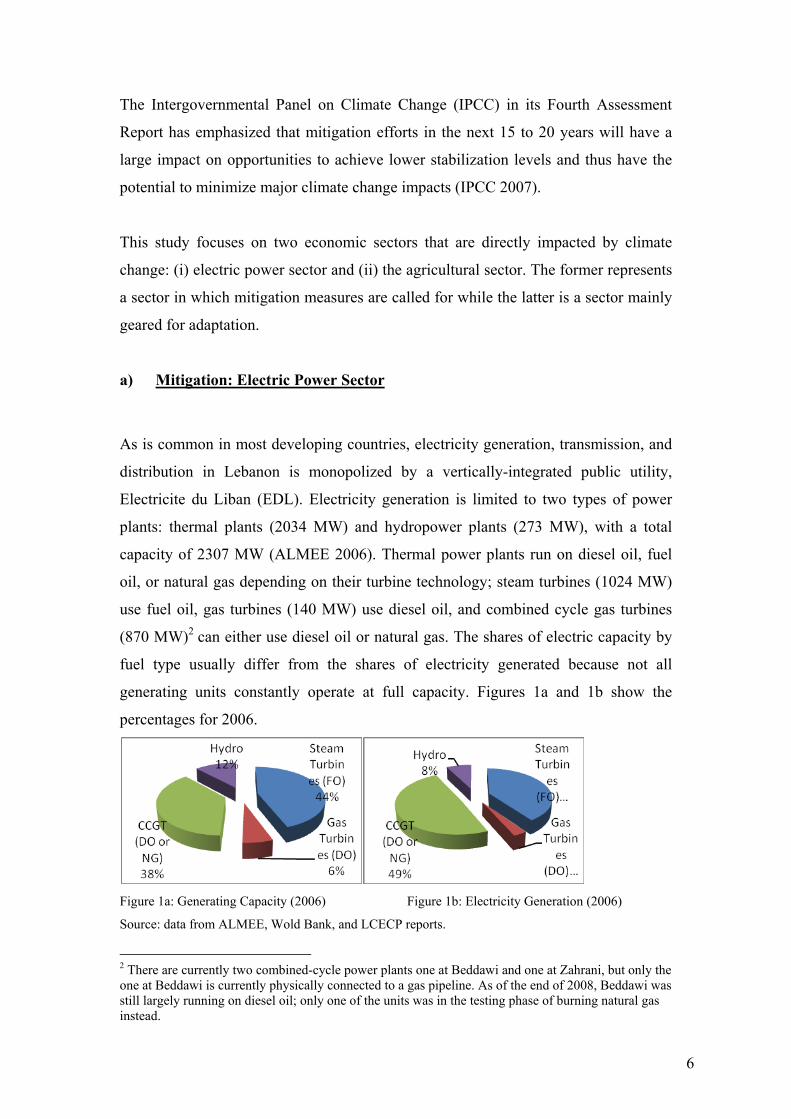
(870 MW)2 can either use diesel oil or natural gas. The shares of electric capacity by
fuel type usually differ from the shares of electricity generated because not all
generating units constantly operate at full capacity. Figures 1a and 1b show the
percentages for 2006.
Figure 1a: Generating Capacity (2006) Figure 1b: Electricity Generation (2006)
Source: data from ALMEE, Wold Bank, and LCECP reports.
2 There are currently two combined-cycle power plants one at Beddawi and one at Zahrani, but only the one at Beddawi is currently physically connected to a gas pipeline. As of the end of 2008, Beddawi was still largely running on diesel oil; only one of the units was in the testing phase of burning natural gas instead.
7
The choice of sector for our mitigation analysis is primarily based on the fact that the
electric power sector is the largest single source of CO2 emissions in Lebanon. In
2006, our base year3, total electricity produced was 9286 GWh and the resulting EDL
emissions amounted to 6.39 MtCO2, which represents approximately 48% of total
CO2 emissions (SNC, 2009). The power sector�s contribution to CO2 emissions has
grown from 40% in 2000 to 48% in 2006 (SNC 2009). It should be noted here that
according to the IPCC Guidelines, the national inventories of GHG define the power
sector as being strictly limited to main activity producers, i.e. EDL, and thus under the
sectoral approach the emissions from backup generators are not included under the
�energy industries� category. Hence, in this study the main focus is on emissions
resulting from electric power generation strictly by EDL
The financial needs for appropriate climate change mitigation will be analyzed under
two alternative scenarios; a reference or baseline scenario (BS) and a GHG emissions
mitigation scenario (MS). On one hand, the BS reflects the business-as-usual state of
affairs and thus describes the most likely evolution of the power sector in the absence
of any climate-change related policies. Under this scenario, it is expected that EDL
will expand its capacity between now and 2050, in step with the growth in electricity
demand. The basic assumption being that the respective shares of each of the fuels
used, namely fuel oil, diesel oil, and hydro will be preserved, i.e. fuel oil will continue
to constitute 40% of all fuel used for electricity generation, diesel oil 52%, and hydro
8% (see Figure 1b).
On the other hand, the mitigation scenario incorporates new specific policies
aimed at reducing GHG emissions. In the alternative scenario, the MS, it is assumed
that EDL completely satisfies the growth in electricity demand up to 2050 by the
introduction and expansion of renewable energy systems. A viable option would be to
install several wind power plants, wind being the most mature renewable energy
technology. Such a project has been under serious consideration during the last couple
3 Note that we chose to use 2006 as our base year because it is the most recent year for which a complete data set was available.
8
of years and some preliminary steps are being taken such as the development of a
wind atlas for Lebanon. Initial evidence from this initiative as well as evidence from
the existing wind speed database reveals several regions having wind potential.
Under the MS, the basic assumption is that the respective shares of each of the
fuels used, will change from 40% fuel oil, 52% diesel oil, and 8% hydro in 2006 to
26% fuel oil, 34% diesel oil, 5% hydro, and 35% wind in 2050. We have chosen the
growth in the share of wind energy such that it agrees with the national plan to have
12% renewable energy in 2020.
The predominant rates of annual electricity demand growth in the literature vary
between 3% and 5% (Schutz 1998, Chedid et al. 2001, Chedid and Ghajar 2004). For
this analysis, a growth rate of 3% will be used which falls at the lower end of the
range, and can hence be designated as a conservative growth estimate for Lebanon.
For this analysis, the Long range Energy Alternatives Planning System (LEAP) was
used, which is an accounting and scenario-based modelling platform developed by the
Stockholm Environment Institute (SEI, 2006). It is a user friendly, interactive, and
widely-used software tool for energy policy analysis and climate change mitigation
assessment. The United Nations recently announced that more than 85 countries have
chosen to use LEAP as part of their commitment to report to the U.N. Framework
Convention on Climate Change (LEAP 2009). Based on a bottom-up approach, the
main concept is an end-use driven scenario analysis with a business-as-usual scenario
and one or more alternative scenarios. It simulates alternative what-if energy futures
along with environmental emissions under a range of user-defined assumptions. The
built-in cost-benefit analysis tool can help rank and select between different energy-
efficient scenarios.
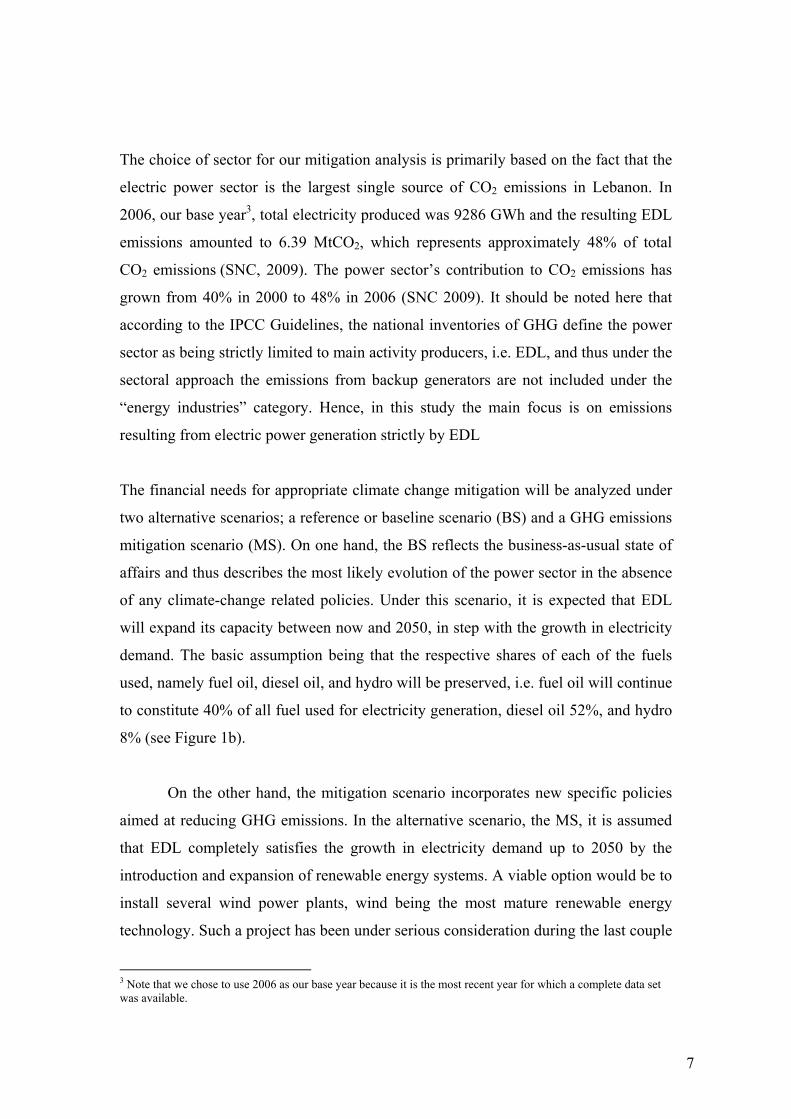
Under the business-as-usual scenario, the base year emissions of 6.39 MtCO2 are
expected to grow to 10.64 MtCO2 by 2020, and 25.8 MtCO2 by 2050. Under the
mitigation scenario the measures taken can reduce emissions by 1.19 MtCO2 in 2020,
and 9 MtCO2 in 2050, relative to the baseline case.
9
Figure 2. CO2 emissions from the electric power sector
b) Adaptation: Agriculture Sector
Agriculture contributes six to seven percent to GDP and employs 20-25 percent of the
labor force (Ministry of Agriculture, 2004). Like many other countries, Lebanon�s
policy makers have barely prioritized agricultural development (World Development
Report 2008). Many years of falling food prices caused the illusion that food insecurity
is a receding developmental problem. This illusion was considerably due to subsidies
to the agricultural sector in industrialized countries, which led to an excess supply of
basic food commodities being sold on world markets. The surge in bio-fuel,
commodity speculation, and dollar depreciation, more frequent climate change events,
however, have popped this illusion.
Agricultural underperformance in Lebanon is evidenced by the fact that relative to per
capita income and after controlling for regional fixed effects, cereal yield (kg per
hectare) and fertilizer consumption (100 grams of hectare per arable land) are below
their predicted values (see appendix #1). Specifically, the results indicate that cereal
10
yield and fertilizer consumption per ha are, respectively, 165 kg and 452 kg short of
their predicted values.
Lebanon is in a vulnerable food security position. Successive governments since the
early 1990s have allocated less than 3% of the national budget to the ministry of
agriculture. Although the prevalence rate of undernourishment at 3% is very low,
Lebanon�s food security bill is on the rise and with it the vulnerability to food price
shocks. In light of future food price insecurities and climate change effects, the food
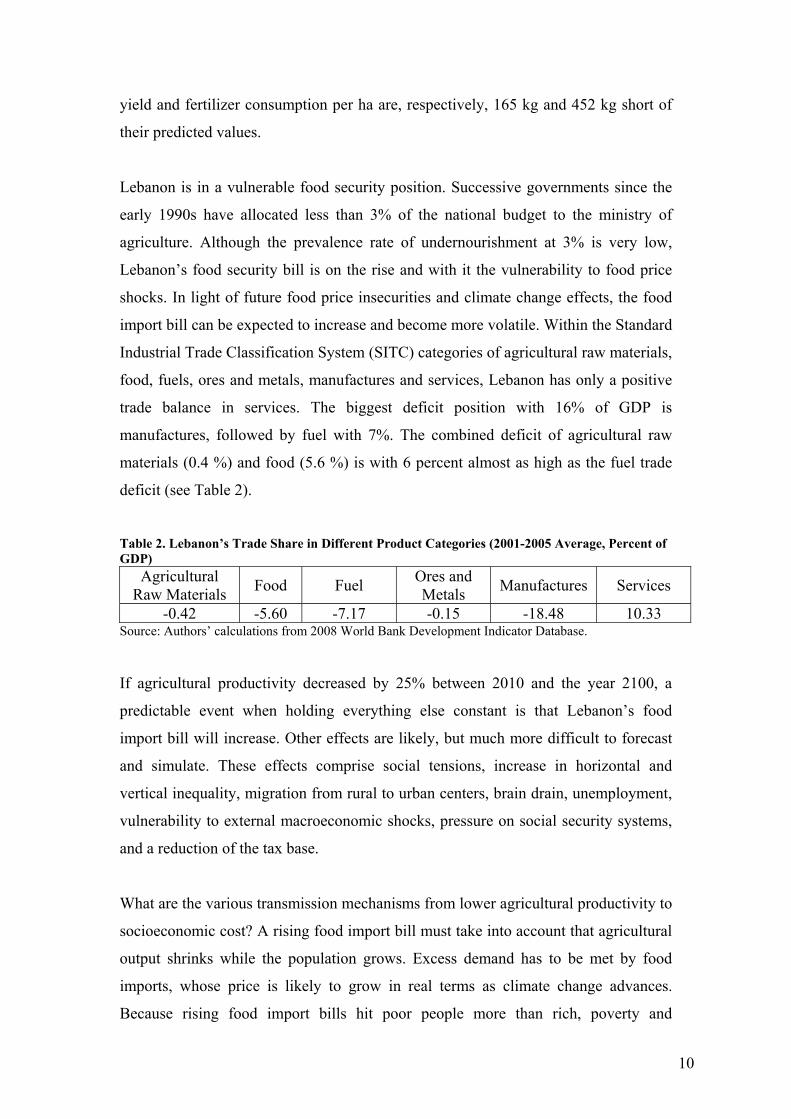
import bill can be expected to increase and become more volatile. Within the Standard
Industrial Trade Classification System (SITC) categories of agricultural raw materials,
food, fuels, ores and metals, manufactures and services, Lebanon has only a positive
trade balance in services. The biggest deficit position with 16% of GDP is
manufactures, followed by fuel with 7%. The combined deficit of agricultural raw
materials (0.4 %) and food (5.6 %) is with 6 percent almost as high as the fuel trade
deficit (see Table 2).
Table 2. Lebanon�s Trade Share in Different Product Categories (2001-2005 Average, Percent of GDP)
Agricultural Raw Materials Food Fuel Ores and
Metals Manufactures Services
-0.42 -5.60 -7.17 -0.15 -18.48 10.33 Source: Authors� calculations from 2008 World Bank Development Indicator Database.
If agricultural productivity decreased by 25% between 2010 and the year 2100, a
predictable event when holding everything else constant is that Lebanon�s food
import bill will increase. Other effects are likely, but much more difficult to forecast
and simulate. These effects comprise social tensions, increase in horizontal and
vertical inequality, migration from rural to urban centers, brain drain, unemployment,
vulnerability to external macroeconomic shocks, pressure on social security systems,
and a reduction of the tax base.
What are the various transmission mechanisms from lower agricultural productivity to
socioeconomic cost? A rising food import bill must take into account that agricultural
output shrinks while the population grows. Excess demand has to be met by food
imports, whose price is likely to grow in real terms as climate change advances.
Because rising food import bills hit poor people more than rich, poverty and
11
inequality of economic opportunities and pressure for redistributive measures will
increase.
In order to estimate the effects of climate change on Lebanon�s food import bill and
socioeconomic consequences, the following stylized scenario is simulated. The
simulation starts in 2010 and ends in 2100. It is assumed that in 2010, Lebanon is a 30
billion dollar economy [in $2005 Purchasing Power Parity (PPP)]. The size of the
population is rounded to 4 million. Per capita income in 2010 is hence $ 7,500.
Agriculture contributes six percent to GDP or $1.8 billion. If 20 percent of Lebanon�s
labor force of 1.5 million is employed in agriculture, average GDP per agricultural
worker is $6,000. Assuming that each agricultural worker supports three dependants,
the average household income is $1,500, which is close to the World Bank�s upper
poverty line of $4 per day and person (Laithy et al. 2008). Average GDP per non-
agricultural worker is $23,500.
Total expenditures on agricultural products are $ 3.6 billion, six percent or $ 1.8
billion coming from agriculture�s value added to GDP and another six percent or 1.8
billion coming from imports. Per capita food expenditures are thus $900. Each person
spends $450 on agricultural products domestically produced and $450 on imports. It
is assumed that these expenditures reflect mostly basic food purchases.
The transitional dynamics to the year 2100 are defined by the following assumptions.
The Lebanese economy grows at three and its population at one percent. Due to
climate change, basic staples are subject to a two-percent annual increase of real
prices. This scenario is then compared with an alternative one, which assumes that
agricultural productivity remains unchanged. With this exercise, we want to answer
the question: By how much does climate change increase the food import bill?
Appendix 2 describes the methodology underlying our system dynamic framework.
The results can be summarized as follows:
• The economic effect of climate change on Lebanon�s food import bill is
economically irrelevant.
12
• An increase of Lebanon�s food import bill is almost exclusively the result of
population growth and exogenous food price inflation.
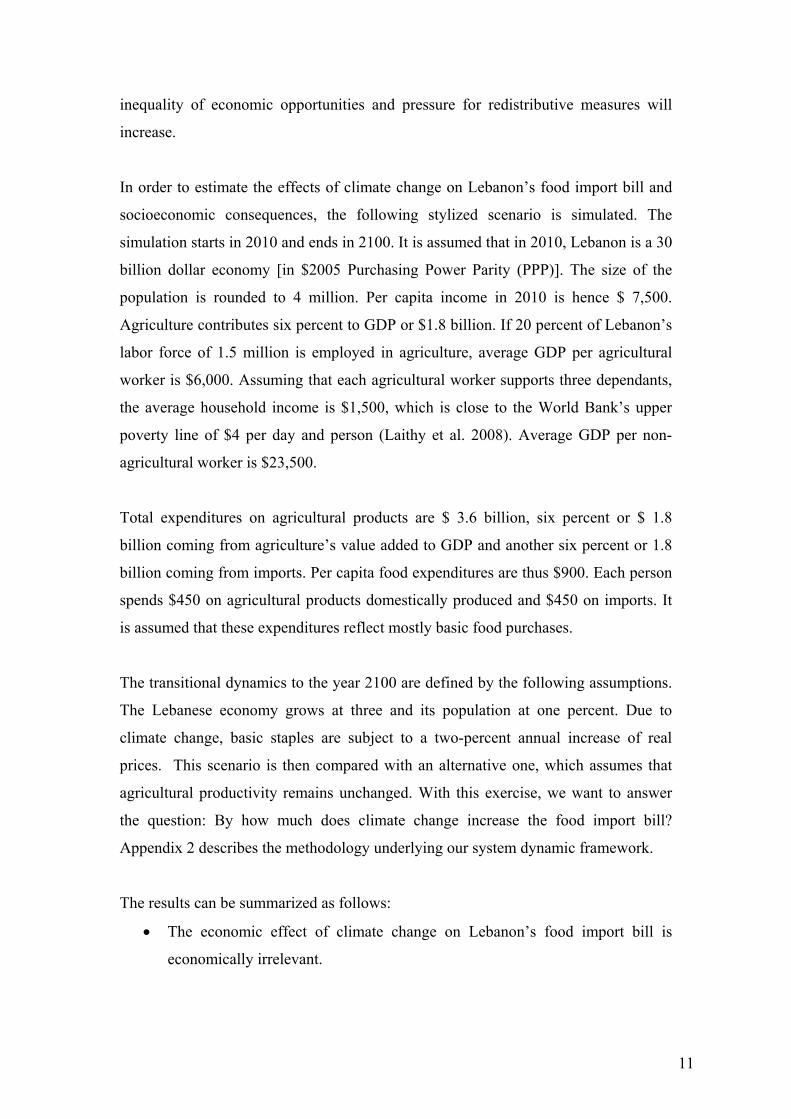
Table 3 summarizes the predicted variables for the various model parameters for the
year 2020 and 2050.
Table 3. Simulation Results � Climate Change and Food Security in Lebanon Year 2020 Snapshot Year 2050 Snapshot
Without Climate Change
With Climate Change
Climate Change Effect
Without Climate Change
With Climate Change
Climate Change Effect
GDP $40.3 bill. $40.3 bill. 0 $97.9 bill. $97.9 bill. 0
Population 4.4 mill. 4.4 mill. 0 6.0 mill. 6.0 mill. 0
GDP per capita $9,125 $9,125 0 $16,432 $16,432 0 Per capita food expenditure bill total $1,097 $1,097 0 $1,987 $1,987 0 Agriculture value added to GDP $1.8 bill. $1.74 bill. -$56.6 mill. $1.8 bill. $1.59 bill. -210 mill. Per capita food expenditure bill domestic
$407 $394 -$13 $302 $266 -$36
Per capita food expenditure bill import $690 $703 +$13 $1,685 $1,721 +$36 Total food expenditures as a percentage of GDP 12% 12% 0 12% 12% 0 Total food import bill as a percentage of GDP 7.6% 7.7% 0.1 10.3% 10.5% 0.2
Appendix 3 summarizes the simulations results visually in more detail.
The Cost of Climate Change to Rural Society
Available data suggests that families of agricultural workers are statistically just
slightly above the upper poverty line of $4 per person and day, assuming that every
agricultural worker supports three dependants. With the per capita value added of
agriculture to GDP to decrease due to climate change and population growth, the
question is again which factor contributes how much to the decrease of farming
communities� livelihood. Specifically, we would like to know how many agricultural
workers will fall below the poverty line of $6,000 ($2005 PPP - purchasing power
parity in 2005 USD value) per year, by how much, and how big the social safety net
will have to be in order to accommodate vulnerable families.
In order to answer these questions, the following assumptions were simulated:
13
• In 2010, the agricultural labor force is 300,000; on average, every worker
supports three dependants.
• The agricultural labor force is expected to grow by an annual rate of one
percent (given that current general population growth rate is around 0.7%).
• A GDP per agricultural worker of below $6,000 is considered vulnerable in
the sense that incomes prevent households from meeting all their basic needs.
• A sustainable agricultural labor force is defined as
PPP) ($2005 6,000PPP) ($2005 GDP toAdded Value eAgriculturLaborForce Agricult. Sust. =
• The vulnerable agricultural population is thus
Pop. Agric. Sust.Pop. Agricult.Pop. Agricult. Vulnerable −=
The answers to this question are again developed using a system-dynamic simulation
model (see Appendix 4). The simulation results illustrate that Lebanon�s farming
communities are vulnerable, but that their vulnerability is predominantly the result of
population growth in the absence of commercialized farming. The climate change
effect is negligible. Table 4 summarizes the simulation results for the year 2020 and
2050. Appendix 5 gives a detailed graphical summary of the �with climate change�
and �without climate change� simulation runs.
14
Table 4. Simulation Results � Climate Change and Food Security in Lebanon Year 2020 Snapshot Year 2050 Snapshot
Without Climate Change
With Climate Change
Climate Change Effect
Without Climate Change
With Climate Change
Climate Change Effect
Agricultural Labor Force 331,387 331,387 0 446,659 446,659 0 Value added per agricultural worker
$5,432 $5,261 -$171 $4,030 $3,546 -$484
Supported agricultural labor force
300,000 290,562 -9,438 300,000 263,993 -36,007
Vulnerable agricultural labor force
31,387 40,824 9,438 146,659 182,666 36,007
Subsistence income gap
$17.8 mill. $30.2 mill. $12.4 mill. $288.9 mill.
$448.2 mill.
$159.3 mill.
Vulnerable agricultural labor force as percent of total
9.5% 12.3% 2.8% 32.8% 40.9% 8.1%
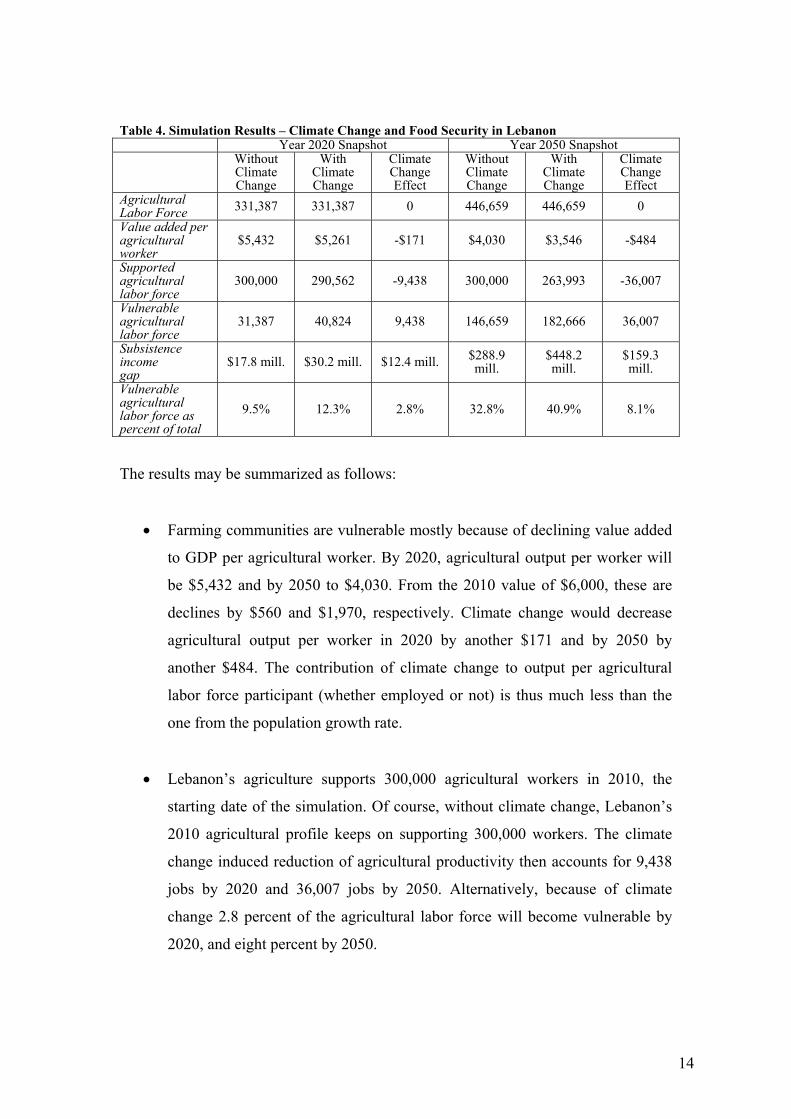
The results may be summarized as follows:
• Farming communities are vulnerable mostly because of declining value added
to GDP per agricultural worker. By 2020, agricultural output per worker will
be $5,432 and by 2050 to $4,030. From the 2010 value of $6,000, these are
declines by $560 and $1,970, respectively. Climate change would decrease
agricultural output per worker in 2020 by another $171 and by 2050 by
another $484. The contribution of climate change to output per agricultural
labor force participant (whether employed or not) is thus much less than the
one from the population growth rate.
• Lebanon�s agriculture supports 300,000 agricultural workers in 2010, the
starting date of the simulation. Of course, without climate change, Lebanon�s
2010 agricultural profile keeps on supporting 300,000 workers. The climate
change induced reduction of agricultural productivity then accounts for 9,438
jobs by 2020 and 36,007 jobs by 2050. Alternatively, because of climate
change 2.8 percent of the agricultural labor force will become vulnerable by
2020, and eight percent by 2050.
15
• If one takes the difference between agricultural GDP per worker in the labor
force and $6,000, which is necessary to prevent vulnerabilities in farming
communities, population growth will cause a subsistence income gap of $17.8
million by 2020. Climate change will add another $12.4 million. By the year
2050, population growth will account for a subsistence income gap of $289
million while climate change will account for another $159 million.
• Lastly, in 2020, 12.3 percent of the agricultural labor force will be vulnerable,
2.8 percent of which can be attributed to climate change. In 2050, 40.9 percent
of farming communities will be vulnerable, 8.1 percent of which climate
change accounts for.
B) Key Findings on costs of implementing priority mitigation and adaptation measures
The following sections describe costs of various measures in both targeted sectors in
adaptation and mitigation.
a) Cost of implementing priority mitigation measures
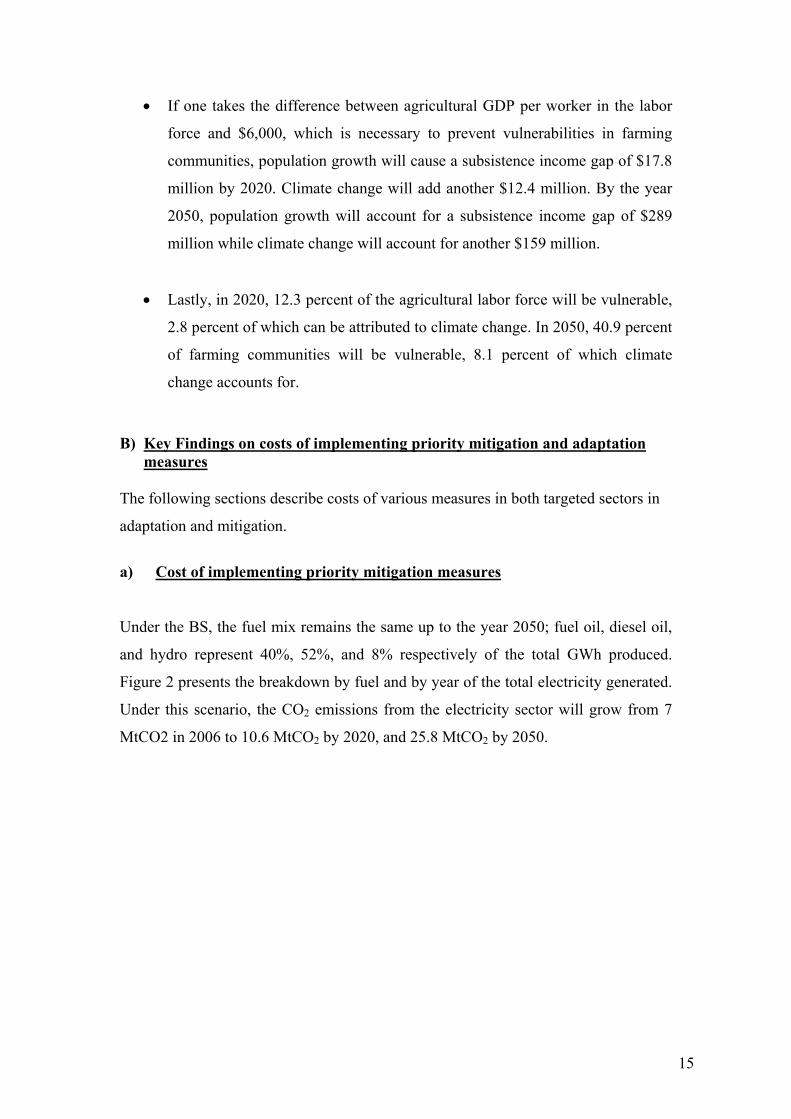
Under the BS, the fuel mix remains the same up to the year 2050; fuel oil, diesel oil,
and hydro represent 40%, 52%, and 8% respectively of the total GWh produced.
Figure 2 presents the breakdown by fuel and by year of the total electricity generated.
Under this scenario, the CO2 emissions from the electricity sector will grow from 7
MtCO2 in 2006 to 10.6 MtCO2 by 2020, and 25.8 MtCO2 by 2050.
16
Figure 1. Breakdown of electricity generation by fuel (BS)
Figure 2. Breakdown of electricity generation by fuel (MS)
Under the MS, the fuel mix changes such that wind provides 35% of the electricity
generated in 2050 and the remaining fuels� shares are 26%, 34%, and 5% for fuel oil,
17
diesel oil, and hydro respectively. As noted before, we have chosen the growth in the
share of wind energy such that it agrees with the national plan to have 12% renewable
energy in 2020. Figure 3 presents the breakdown by fuel and by year of the total
electricity generated. Under this scenario, the CO2 emissions from the electricity
sector will grow from 7 MtCO2 in 2006 to 9.5 MtCO2 in 2020, and 16.7 MtCO2 in
2050, which is 9 MtCO2 lower than the BS.
A cost-benefit analysis reveals that the mitigation scenario has a negative net present
value of 2,436 million USD compared to the baseline scenario. Hence, the analyzed
mitigation policy can be considered to be a no regrets policy as long as the
assumptions underlying the model hold (see Appendix 2). The mitigation benefit is
thus computed to be $270.6/tCO2. This is a very interesting finding confirming the
attractiveness of wind power in the short term and more so in the long term; the
calculations show that the extra capital costs for wind capacity versus traditional
steam turbines is outweighed by the fuel costs, even in year 1. This result has clear
policy implications and is of potential use for any future government legislation
regarding greenhouse gas mitigation in the power sector. The MS assumes a
substantial shift in the electricity generation mix in 2030, which is expected to pose
several challenges that will be discussed in the next sections.
b) Cost of implementing priority adaptation measures
Despite the fact that climate change poses a global threat, little attention is given to
the possibility that many countries may actually benefit from it either directly or
indirectly. Some countries may benefit directly from climate change through better
agricultural conditions or indirectly through making meaningful contributions to
climate change adaptation and mitigation research. Lebanon has the potential to
become part of the latter. Although Lebanon will be hit hard by climate change in
terms of decreased precipitation, greater water scarcity, rising temperatures, and a
reduction of the livelihoods for traditional farming communities, Lebanon has the
advantage that its agricultural base is too small for climate change to have a
meaningful impact on economic activity and food security. Simulations conducted for
this study clearly indicate that even if climate change had been unheard of, food
insecurity will be mainly of a Malthusian nature, meaning that population growth is
18
the biggest challenge to food security. Other food security threats are likely to come
from food price shocks on international markets. Lebanon�s agricultural sector is
mainly traditional small holder farming, with some economically viable niche
productions, such as the wine industry, poultry, etc. Even commercialized farming
would be unlikely to impact positively food security, mostly because water constraints
will build up under rising temperatures. Lebanon�s vegetative diversity with coastal,
inland, and mountainous terrains in combination with climate change, however, may
give it an advantage in developing climate change adaptation research hubs.
Developing such industries is largely cost neutral and has the potential to become a
high tech sector for Lebanon.
Lebanon�s agricultural sector is already too small in the first place for climate change
to have a substantial impact on food security or the livelihood of farming
communities. Although agriculture is a source of social costs, these costs are
predominantly triggered by population growth or an increased vulnerability to
exogenous shocks (which in turn may be the result of climate change). The question
now is: What is a good adaptation strategy if climate change is physically present but
does not cause major economic disruptions? We argue that in the Lebanese context,
climate change can give rise to the emergence of a comparative advantage in the
development of an agricultural climate change adaptation research hub. The
advantages of Lebanon are that agricultural climate change adaptation can be studied
in diverse micro-climatic settings. Lebanon has coastal, elevated, and inland
agriculture. There are several universities with a good track record in agricultural
research. Moreover, Lebanon has a well educated labor force, from which
biotechnology industries or start-up firms could benefit from.
How big is the potential capacity of a climate change adaptation research industry in
Lebanon? The best reference model to estimate its development potential is the
biotechnology sector. Detailed data about the global market size, sales, employment,
and industry outlook is scarce and inferences therefore difficult. Beuzekom and
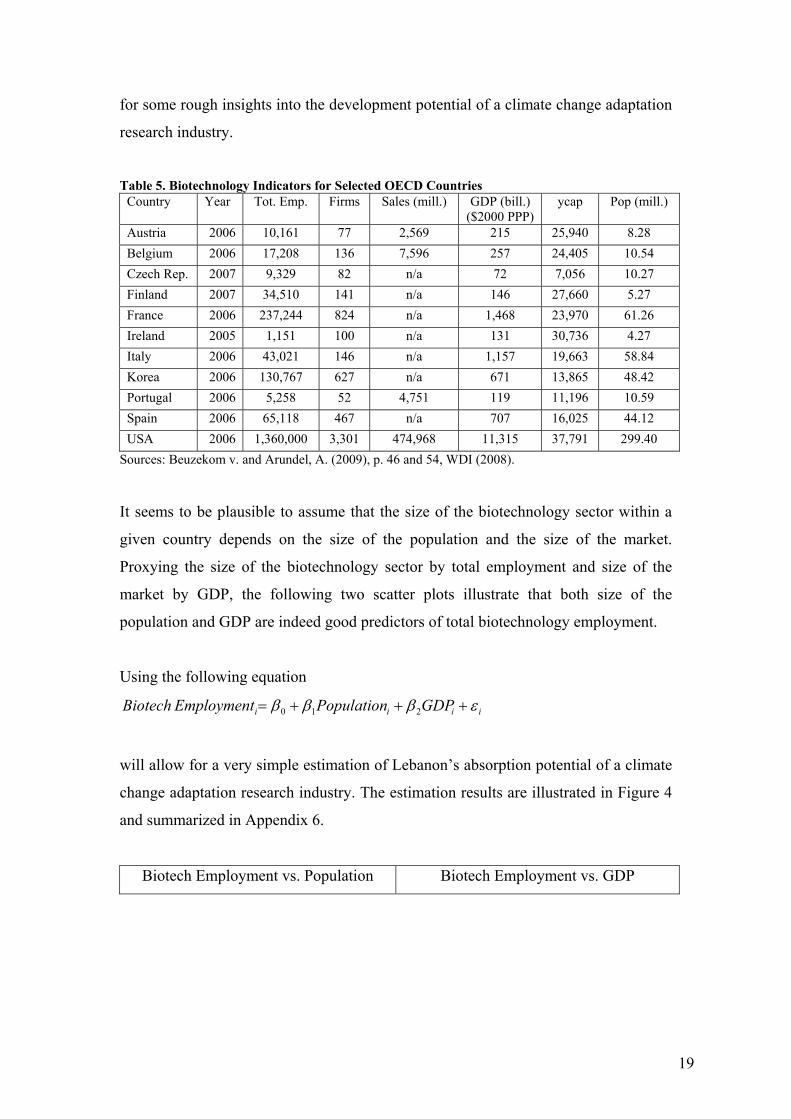
Arundel (2009), is a good starting point though. Table 5 summarizes some numbers
from their report, which although for a selected OECD countries only, may be used
19
for some rough insights into the development potential of a climate change adaptation
research industry.
Table 5. Biotechnology Indicators for Selected OECD Countries
Country Year Tot. Emp. Firms Sales (mill.) GDP (bill.) ($2000 PPP)
ycap Pop (mill.)
Austria 2006 10,161 77 2,569 215 25,940 8.28 Belgium 2006 17,208 136 7,596 257 24,405 10.54 Czech Rep. 2007 9,329 82 n/a 72 7,056 10.27 Finland 2007 34,510 141 n/a 146 27,660 5.27 France 2006 237,244 824 n/a 1,468 23,970 61.26 Ireland 2005 1,151 100 n/a 131 30,736 4.27 Italy 2006 43,021 146 n/a 1,157 19,663 58.84 Korea 2006 130,767 627 n/a 671 13,865 48.42 Portugal 2006 5,258 52 4,751 119 11,196 10.59 Spain 2006 65,118 467 n/a 707 16,025 44.12 USA 2006 1,360,000 3,301 474,968 11,315 37,791 299.40
Sources: Beuzekom v. and Arundel, A. (2009), p. 46 and 54, WDI (2008).
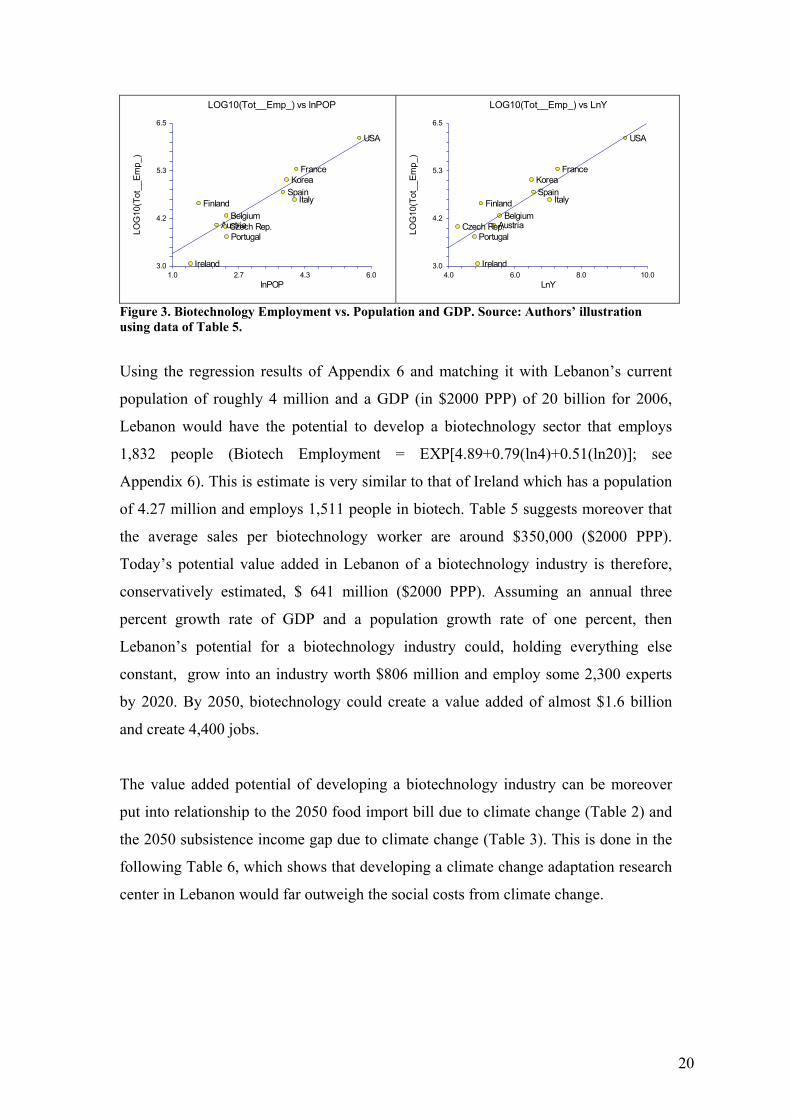
It seems to be plausible to assume that the size of the biotechnology sector within a
given country depends on the size of the population and the size of the market.
Proxying the size of the biotechnology sector by total employment and size of the
market by GDP, the following two scatter plots illustrate that both size of the
population and GDP are indeed good predictors of total biotechnology employment.
Using the following equation
iiii GDPPopulationEmployment Biotech εβββ +++= 210
will allow for a very simple estimation of Lebanon�s absorption potential of a climate
change adaptation research industry. The estimation results are illustrated in Figure 4
and summarized in Appendix 6.
Biotech Employment vs. Population Biotech Employment vs. GDP
20
3.0
4.2
5.3
6.5
1.0 2.7 4.3 6.0
AustriaBelgiumCzech Rep.
Finland
France
Ireland
Italy
Korea
Portugal
Spain
USA
LOG10(Tot__Emp_) vs lnPOP
lnPOP
LOG
10(T
ot__
Emp_
)
3.0
4.2
5.3
6.5
4.0 6.0 8.0 10.0
AustriaBelgium
Czech Rep.
Finland
France
Ireland
Italy
Korea
Portugal
Spain
USA
LOG10(Tot__Emp_) vs LnY
LnY
LOG
10(T
ot__
Emp_
)
Figure 3. Biotechnology Employment vs. Population and GDP. Source: Authors� illustration using data of Table 5.
Using the regression results of Appendix 6 and matching it with Lebanon�s current
population of roughly 4 million and a GDP (in $2000 PPP) of 20 billion for 2006,
Lebanon would have the potential to develop a biotechnology sector that employs
1,832 people (Biotech Employment = EXP[4.89+0.79(ln4)+0.51(ln20)]; see
Appendix 6). This is estimate is very similar to that of Ireland which has a population
of 4.27 million and employs 1,511 people in biotech. Table 5 suggests moreover that
the average sales per biotechnology worker are around $350,000 ($2000 PPP).
Today�s potential value added in Lebanon of a biotechnology industry is therefore,
conservatively estimated, $ 641 million ($2000 PPP). Assuming an annual three
percent growth rate of GDP and a population growth rate of one percent, then
Lebanon�s potential for a biotechnology industry could, holding everything else
constant, grow into an industry worth $806 million and employ some 2,300 experts
by 2020. By 2050, biotechnology could create a value added of almost $1.6 billion
and create 4,400 jobs.
The value added potential of developing a biotechnology industry can be moreover
put into relationship to the 2050 food import bill due to climate change (Table 2) and
the 2050 subsistence income gap due to climate change (Table 3). This is done in the
following Table 6, which shows that developing a climate change adaptation research
center in Lebanon would far outweigh the social costs from climate change.
21
Table 6. Value Added of Biotechnology vs. Social Cost from Climate Change
2020
(million)
2050
(million)
Food Import Bill due
to Climate Change* ~ 40.3* ~ 196*
Climate change induced subsistence
income gap among agricultural workers* ~12.4* ~159.3*
Total climate change induced social costs* ~57.2* ~355.3*
Value added potential of a Lebanese Biotechnology Sector+ ~806 ~1,568 * $2005 PPP + $2000 PPP. Source: Authors� estimates.
C) Key Findings on Financial and Policy instruments for addressing climate
change Implementing the discussed measures requires development of enabling financial and
policy instruments. The sections below list and briefly describe some of these
instruments for both mitigation and adaptation.
a) Financial Instruments
i) Mitigation
Instruments described herein focus on two financial aspects related to renewable wind energy: economic efficiency and business profitability. Economic efficiency
• Relate variability of economic growth with environmental degradation: economic externalities are inherent to economic growth. Environment related externalities can be assessed and value ranked in terms of correlation with growth.
• Relate potential benefits of energy use efficiency to new energy sources:
Application as well storage efficiencies of wind energy use represent business as well as consumer incentives for shifting to alternate new sources
• Assess start up costs of wind powered building codes: Construction costs per
unit or per area of finished space show economic value as well start up and hook up installations costs for new as well as for already existing buildings.
22
• Participate in regional fund for wind energy technology: Multi country regional strategy for wind energy production may result in economies of scale as well as economies of scope.
• Start institutional structure supporting integration of new practices in existing
economic modes. Urban zoning and semi private institutions accommodate transfer of new technology into existing energy consumption practices.
• Organize financial instruments at local, national and international levels:
Financial schedules for supporting development of wind stations are made available through financial institutions, domestic, regional and global.
Business profitability • Establish initial investment costs of wind farming: Calculations of capital
investments for joints stations, and start up costs for individual units allow clear guidelines for break even parameters as well as amortization schedules for long term operation.
• Provide sensitivity analysis on a range of scenarios based on cost benefit
ratios: Unfavorable conditions are compared with favorable scenarios to provide sensitivity of financial ratios for a range of market and reality conditions. Back up planning is possible in order to alleviate adverse circumstances. Also favorable financial scenarios allow for pursuit of desirable outcomes.
• Assess business rates of return and net present values on micro wind
production units: Wind energy production may be soon and fast entirely self supported. Business profitability considerations will show survival and self sufficiency in addition to overall economic gains.
• Assess annuity costs of operation and maintenance of wind energy production:
Business costs and operating budgets demonstrate feasibility of wind energy production on an annual budgeting basis.
Other financial instruments for the energy sector that could be utilized are:
• Internalize market economies for off-grid electric generators: illegal and private electric generators produce the most expensive form of power. After adding social cost of pollution, noise, and abuse of existing grids, such generators will lose all incentive for their users.
23
• Assess third party spill over costs for pollution control: Adding costs of pollution, and loss of ecological quality of life, make actual user rather than all of society pay for the actual costs of production.
• Motivate institutional upgrading with financial incentives: Differential rates of
productions and consumption fees support household use as well as industrial survivability of business users.
• Explore privatization options of the energy sector in Lebanon: EDL monster
operational deficits can be addressed on the grounds of organizational restructuring
ii) Adaptation
Financial instruments that will aid in turning Lebanon into a research hub on
adaptation are simple and somewhat limited. The key element is to increase the
government�s budget allocation to research. This should go hand-in-hand with
government incentives aimed at facilitating the launching and survivability of start-
ups. An important component in this would be:
• Substantially reduce or eliminate import tariffs on equipment required in the
biotech industry
• Provide tax incentives for biotech start-ups
• Provide widespread access to micro credit financing
Other agribusiness developments may help in providing the agricultural labor force
with an alternative employment or within same sector employment. Niche agriculture
is such a development whereby certain cultural practices such as growing grapes for
wine and winemaking, saffron cultivation, certain fruit tree production, seed
production etc. could benefit from some of the following financial instruments:
• Channel agricultural public expenditure into research and extension
• Enforce market economies for efficient utility of agriculture
24
• Empower cooperatives for business survival
b) Policy Instruments
i) Mitigation
Policy elements for implementing the renewable wind energy option may be
addressed at two scales: national scale or macro aggregation and a finer business scale
or micro aggregation
Macro aggregation: at country level
• Promote private public partnerships at national level. Mixed business arrangements provide a balance between economic efficiency and social equity
• Develop positive synergy between environment and economy: ecological
quality translates into economic value that is reflected in consumer demand for environmental friendliness
• Provide international negotiation framework for bilateral and/or multilateral
cooperation: Recipient and financial development partners can achieve more effective cooperation when grants are negotiated based on agreed criteria.
• Disseminate information at user level for public awareness on new energy
technologies: Transfer information on new wind energy from research and development mode to consumer advertising and marketing campaign.
• Centralize formatting of data collection and storage on wind technology
applications: Planning and industrial guidance are enhanced when information is made available in a directly applicable useful mode
Micro scoping: at business level
• Establish specialized research entity in wind energy production: business innovation translates technical research into economic value.
• Identify energy innovation funding from financial development partners by
energy source. Specific donor agenda is matched best when recipient needs are specific, and well defined
25
• Start balance scorecard for strategic planning of energy mitigation: strategic
management implies verifying that performance is coherent with pre set objectives. The score card is balanced through an exhaustive process at the business level.
• Implement logical framework for wind energy management: Financial
development partners can verify effectiveness of grants and support programs by pursuing logical framework of organizational management.
• Reach critical mass of expertise: Available know-how becomes consumer
friendly when enough expertise is translated into daily mechanisms of knowledge transfer.
• Establish competent authorities: Both public as well as private agencies of
competence contribute to total quality management.
• Train staff: Human resources remain key factor of success in implementation of new technology.
Other policy instruments available for the energy sector in general are:
• Secure reliability of data on energy consumption by user category: Uniform formatting of data allows user access as well long term planning
• Support development of wind atlas for aeolian energy production: National as
well regional wind patterns are historically consistent. Mediterranean currents can be documented appropriately and relied upon for wind energy production design and operation.
• Upgrade emissions regulations: Match regional and international standards of
air quality and environmental safety.
• Enhance implementations tools: Local implementation of ecologic standards as well energy regulations depends on institutionalized support of energy production and consumption
ii) Adaptation
Adaptation research hubs benefit tremendously from policies that protect intellectual
property rights and patents. The government should provide a business environment
in which these rights are protected. Moreover it is imperative that relevant existing
26
laws should be applied effectively and universally across the nation. Another
important element is the building of both human and institutional capacities in the
public sector involved in all aspects of adaptation research.
Other policies that could benefit the agricultural sector in general are:
• Reinforce marketing of harvests • Implement reliable metering of resources for agricultural production • Build institutional capacity • Capitalize on human resources • Integrate management of agricultural networks
D) Institutional framework Currently, there are two government-led programs aimed at reducing GHG emissions.
One is the �Lebanon cross-sectoral energy efficiency and removal of barriers to ESCO
operation� that targets GHG emission reduction resulting from inefficient end-use
energy consumption in all sectors of the economy. The other is �The climate change
project� designed to address GHG issues in Lebanon. The former effort is
implemented by the Ministry of Energy and Water and the latter is implemented by
the Ministry of Environment. Moreover, Lebanon can take advantage of some
international schemes such as the Clean Development Mechanism (CDM). In theory,
funding and implementation of renewable energy projects could be done under the
Kyoto Protocol�s clean development mechanism.
The Lebanese Center for Energy Conservation Project is working to set up a national
fund for energy efficiency and renewable energy and another fund for residential solar
water heaters. This fund could eventually be used for financing in part the wind
energy farms proposed in the mitigation scenario. Ideally, and similarly to many
developed countries, a renewable energy fee could be imposed on electricity
consumers by working it into the Lebanese electricity tariff. These funds could also be
used for financing wind energy farms.
27
The Lebanese Agricultural Research Institute (LARI) is currently the only
government funded agency involved in agricultural research that focuses on climate
change. LARI�s current administrative structure and geographic distribution are
suitable to carry on a more focused effort on adaptation research. Most universities
(public and private) with active agricultural research programs do have the
institutional and geographic distribution to allow support of biotech start-ups.
E) Lessons learned
The limited scope of the study presented has led to some understandings of the
challenges facing Lebanon in its attempt to reduce emissions and try to adapt to
climate change. Along with challenges there were apparent some opportunities that
might prove helpful and useful for Lebanon. The sections the follow describe some of
these.
Challenges
Public debt reached 163.5% of GDP in 2008 making Lebanon�s debt to GDP ratio the
third highest in the World (CIA World Factbook, 2009). Consequently, funding for
any large-scale project, such as a power plant is more difficult to achieve and will
need to be mostly funded by foreign sources. However, the state-controlled monopoly,
EDL, can be a major disincentive to foreign direct investment (Kagiannas et al., 2003)
and in fact there has been a lot of pressure by international lenders to privatize the
electricity sector.
Climate change induced adaptation needs are mostly exogenous. Climate change does
not account for an increase in Lebanon�s food import bill, but it will account for
greater food price shocks. The most important adaptation need (as opposed to
opportunities) is thus the development of fiscal capacity and economic diversification.
Unless Lebanon increases its tax base considerably, it will be ill prepared to provide
these social safety nets.
Whereas niche production and adaptation research hubs are adaptation opportunities,
the expansion of social safety nets is an adaptation necessity. Although the value
28
added of agriculture to GDP is quite small, it still employs a substantial percentage of
the work force. Climate change will challenge traditional farming communities�
livelihood, which government needs to be prepared for accordingly. The development
of unemployment insurances is one priority in this regard.
Opportunities
By examining the recently developed wind atlas one can discern several areas along
the mountain ranges that have average wind speeds higher than 5 m/s such as Akkar,
Marjeyoun, and others. In general, these areas that have high sustained wind speeds
have a very low population concentration and land is abundant at very cheap prices to
buy or lease for such projects (Dagher and Ruble 2009).
Expanding the supply of electricity by introducing renewable energy has several more
advantages in comparison to an expansion with conventional power plants. It will
help in reducing Lebanon�s dependency on fuel imports and thereby contribute to the
diversification of our energy mix. Second, if the introduction of renewable energy
takes the form of numerous distributed providers this would enhance the security of
supply in times of conflict which are all too common in this region, especially that
electric power facilities have been directly targeted in the last two decades (Dagher
and Ruble, 2009).
A priority that is also an opportunity is to facilitate vertical and horizontal mobility
through public investments in technological (internet, telecommunication) and
transportation (roads, public transportation) capacity. Such investments will
complement adaptation opportunities as well as they improve Lebanon�s business
climate. Infrastructure projects are moreover ideally pursued on a regional level.
29
F) References
Association Libanaise pour la Maitrise de L�Energie (ALMEE), 2006. L�Energie au
Liban.
Brown, O. and Crawford, A. (2009), Rising Temperatures, Rising Tensions. Climate
change and the risk of violent conflict in the Middle East. International Institute for
Sustainable Development, Winnipeg, Manitoba, Canada.
Centre for Research on the Epidemiology of Disasters � CRED, EM-DAT The
International Disaster Database (http://www.emdat.be/, accessed: October 30, 2009).
Chedid, R., Ghaddar, N., Chaaban, F., Chehab, S., Mattar, T., 2001. Assessment of
energy efficiency measures: the case of the Lebanese energy sector. International
Journal of Energy Research, 25 (4), 355-374.
Chedid, R., Ghajar, R., 2004. Assessment of energy efficiency options in the building
sector of Lebanon. Energy Policy, 32, 647-655.
CIA, The World Factbook, 2009. Accessed at
https://www.cia.gov/library/publications/the-world-factbook/geos/LE.html
Cline, W. (2007), Global Warming and Agriculture, Impact Estimates by Country,
Peterson Institute for International Economics, Washington, D.C., 2007.
Dagher, L. and Ruble I. Challenges for CO2 Mitigation in the Lebanese Electric
Power Sector. Energy Policy, 38, 912-918, 2010.
Farajalla, N.S., Haddad, J., and M. Mhanna, 2009 �Long-term Temperature Trends in
Beirut Lebanon.� International Journal of Climatology (Submitted September 2007).
30
International Poverty Center, Poverty, Growth and Income Distribution in Lebanon,
Country Study No. 13, January 2008.
IPCC 2007. Fourth Assessment Report, Climate Change 2007 Synthesis Report.
Kagiannas, A., Askounis, D., Anagnostopoulos, K., Psarras, J., 2003. Energy policy
assessment of the Euro-Mediterranean cooperation. Energy Conversion and
Management, 44, 2665-2686.
LEAP, 2009. Website accessed at
http://www.energycommunity.org/default.asp?action=47 on 11/08/09.
Ministere de l�Agriculture Libanaise, Strategie de Développement Agricole du Liban,
2004.
Lebanese Center for Energy Conservation Project (LCECP), 2008. Approach to
Greenhouse Gas emission reduction analysis.
Republic of Lebanon�s Initial National Communication to the UNFCCC, 2002.
Republic of Lebanon�s Second National Communication to the UNFCCC (SNC draft),
2009.
Schutz, G., 1998. Restructuring of the Lebanese electric power sector. Final Report.
Laithy, H., Abu Ismail, Kh. and K. Hamdan, 2008, Country Report: Poverty, Growth
and Income Distribution in Lebanon, UNDP, accessed at http://www.undp-
povertycentre.org/pub/IPCCountryStudy13.pdf in Ocotber 2009
Stockholm Environment Institute (SEI),Tellus Institute, 2006. LEAP:Long Range
Energy Alternative Planning System,User Guide for LEAP 2006.
http://www.energycommunity.org/documents/Leap2006UserGuideEnglish.pdf .
31
Van Beuzekom B, Arundel A. 2009. OECD Biotechnology Statistics 2009, 103 pp,
OECD, accessed at http://www.oecd.org/dataoecd/4/23/42833898.pdf. in October
2009
World Bank 2007, World Bank Development Report 2008, Agriculture for
Development, Washington, D.C.
World Bank Development Indicator Database 2008, CD-Rom, Washington, D.C.
World Bank, 2004. Republic of Lebanon, Hydrocarbon Strategy Study, Report No.
29579-LE.
World Bank, 2009. Lebanon social impact analysis � electricity and water sectors.

32
Appendix
33
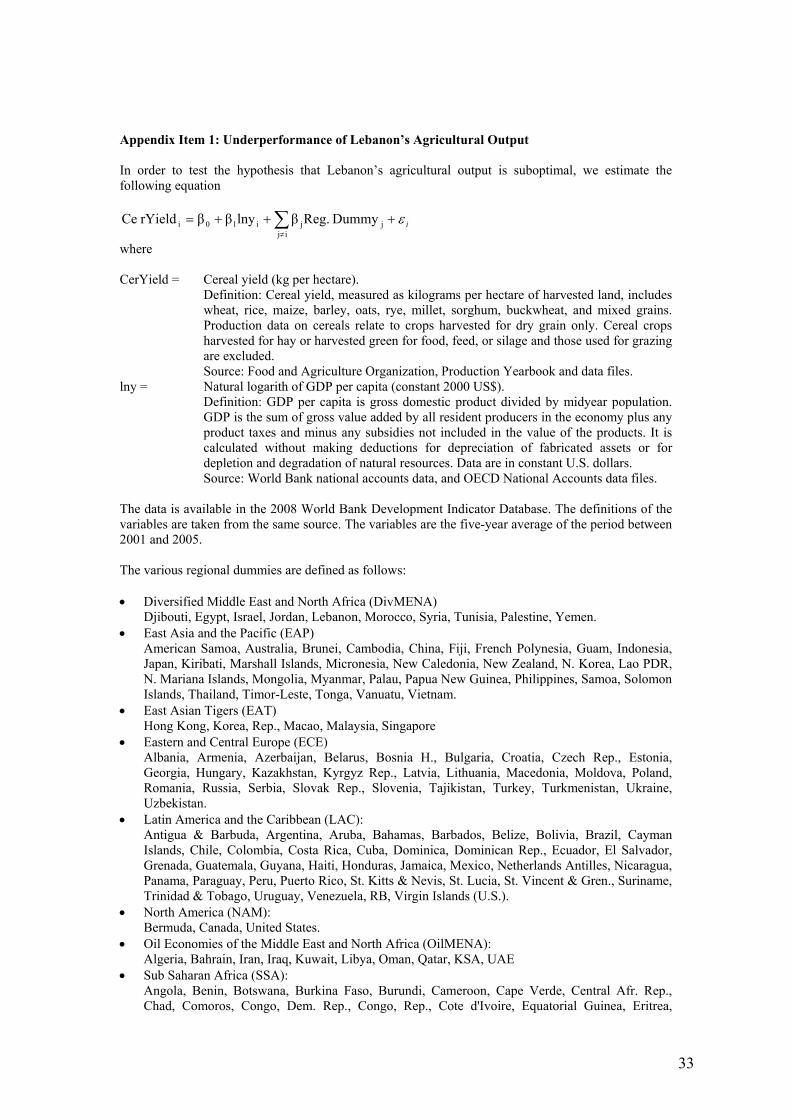
Appendix Item 1: Underperformance of Lebanon�s Agricultural Output In order to test the hypothesis that Lebanon�s agricultural output is suboptimal, we estimate the following equation
iε+++= ∑≠ij
jji10i Dummy Reg.βlnyββrYield Ce
where CerYield = Cereal yield (kg per hectare). Definition: Cereal yield, measured as kilograms per hectare of harvested land, includes
wheat, rice, maize, barley, oats, rye, millet, sorghum, buckwheat, and mixed grains. Production data on cereals relate to crops harvested for dry grain only. Cereal crops harvested for hay or harvested green for food, feed, or silage and those used for grazing are excluded.
Source: Food and Agriculture Organization, Production Yearbook and data files. lny = Natural logarith of GDP per capita (constant 2000 US$). Definition: GDP per capita is gross domestic product divided by midyear population.
GDP is the sum of gross value added by all resident producers in the economy plus any product taxes and minus any subsidies not included in the value of the products. It is calculated without making deductions for depreciation of fabricated assets or for depletion and degradation of natural resources. Data are in constant U.S. dollars.
Source: World Bank national accounts data, and OECD National Accounts data files. The data is available in the 2008 World Bank Development Indicator Database. The definitions of the variables are taken from the same source. The variables are the five-year average of the period between 2001 and 2005. The various regional dummies are defined as follows: • Diversified Middle East and North Africa (DivMENA)
Djibouti, Egypt, Israel, Jordan, Lebanon, Morocco, Syria, Tunisia, Palestine, Yemen. • East Asia and the Pacific (EAP)
American Samoa, Australia, Brunei, Cambodia, China, Fiji, French Polynesia, Guam, Indonesia, Japan, Kiribati, Marshall Islands, Micronesia, New Caledonia, New Zealand, N. Korea, Lao PDR, N. Mariana Islands, Mongolia, Myanmar, Palau, Papua New Guinea, Philippines, Samoa, Solomon Islands, Thailand, Timor-Leste, Tonga, Vanuatu, Vietnam.
• East Asian Tigers (EAT) Hong Kong, Korea, Rep., Macao, Malaysia, Singapore
• Eastern and Central Europe (ECE) Albania, Armenia, Azerbaijan, Belarus, Bosnia H., Bulgaria, Croatia, Czech Rep., Estonia, Georgia, Hungary, Kazakhstan, Kyrgyz Rep., Latvia, Lithuania, Macedonia, Moldova, Poland, Romania, Russia, Serbia, Slovak Rep., Slovenia, Tajikistan, Turkey, Turkmenistan, Ukraine, Uzbekistan.
• Latin America and the Caribbean (LAC): Antigua & Barbuda, Argentina, Aruba, Bahamas, Barbados, Belize, Bolivia, Brazil, Cayman Islands, Chile, Colombia, Costa Rica, Cuba, Dominica, Dominican Rep., Ecuador, El Salvador, Grenada, Guatemala, Guyana, Haiti, Honduras, Jamaica, Mexico, Netherlands Antilles, Nicaragua, Panama, Paraguay, Peru, Puerto Rico, St. Kitts & Nevis, St. Lucia, St. Vincent & Gren., Suriname, Trinidad & Tobago, Uruguay, Venezuela, RB, Virgin Islands (U.S.).
• North America (NAM): Bermuda, Canada, United States.
• Oil Economies of the Middle East and North Africa (OilMENA): Algeria, Bahrain, Iran, Iraq, Kuwait, Libya, Oman, Qatar, KSA, UAE
• Sub Saharan Africa (SSA): Angola, Benin, Botswana, Burkina Faso, Burundi, Cameroon, Cape Verde, Central Afr. Rep., Chad, Comoros, Congo, Dem. Rep., Congo, Rep., Cote d'Ivoire, Equatorial Guinea, Eritrea,
34
Ethiopia, Gabon, Gambia, The, Ghana, Guinea, Guinea-Bissau, Kenya, Lesotho, Liberia, Madagascar, Malawi, Mali, Mauritania, Mauritius, Mayotte, Mozambique, Namibia, Niger, Nigeria, Rwanda, Senegal, Seychelles, Sierra Leone, Somalia, South Africa, Sudan, Swaziland, São Tomé & Principe, Tanzania, Togo, Uganda, Zambia, Zimbabwe.
• South Asia (SA): Afghanistan, Bangladesh, Bhutan, India, Maldives, Nepal, Pakistan, Sri Lanka.
• Western Europe (WE): Andorra, Austria, Belgium, Channel Islands, Cyprus, Denmark, Faeroe Islands, Finland, France, Germany, Greece, Greenland, Iceland, Ireland, Isle of Man, Italy, Liechtenstein, Luxembourg, Malta, Monaco, Netherlands, Norway, Portugal, San Marino, Spain, Sweden, Switzerland, United Kingdom.
Table: OLS Regression Results �Suboptimal Cereal Yield Hypothesis�
DV=Cereal Yield Regression Coefficient
Standard Error t-stat p-value
Intercept 552.25 1,109.33 0.50 0.62 lny 473.86*** 106.53 4.45 0.00 (Region="DIVMENA") -1,774.80*** 575.06 -3.09 0.00 (Region="EAP") -745.52 585.88 -1.27 0.21 (Region="EAT") 2.32 977.30 0.00 1.00 (Region="ECE") -1,120.63** 476.13 -2.35 0.02 (Region="LAC") -1,714.62*** 434.50 -3.95 0.00 (Region="NAM") -974.21 969.83 -1.01 0.32 (Region="OCE") -1,428.94** 607.42 -2.35 0.02 (Region="OILMENA") -2,228.35*** 589.81 -3.78 0.00 (Region="SA") -421.76 688.32 -0.61 0.54 (Region="SSA") -2,122.86*** 557.77 -3.81 0.00 N 164 R2 0.51 *** = significant at 1% and ** = significant at 5%, * = significant at 10%. The results show that agricultural output is positively correlated with per capita income. This is most likely the consequence of a transition from traditional to commercialized agriculture in the process of economic development. Both the regional dummies for the diversified and oil economies of the Middle East and North Africa indicate a significantly negative cereal yield. Lebanon�s cereal yield is 2635.22. Its predicted value is 165.28 higher. The standard error of all residuals is 98.3. The negative residual of Lebanon is therefore significant at the 10% level. In order to test the hypothesis that Lebanon is possibly short of capital, proxied by use of fertilizers, we also estimated
iε+++= ∑≠ij
jji10i Dummy Reg.βlnyββFert
where Fert = Fertilizer consumption (100 grams per hectare of arable land)
Definition: Fertilizer consumption (100 grams per hectare of arable land) measures the quantity of plant nutrients used per unit of arable land. Fertilizer products cover nitrogenous, potash, and phosphate fertilizers (including ground rock phosphate). Traditional nutrients--animal and plant manures--are not included. The time reference for fertilizer consumption is the crop year (July through June). Arable land includes land defined by the FAO as land under temporary crops (double-cropped areas are counted once), temporary meadows for mowing or for pasture, land under market or kitchen gardens, and land temporarily fallow. Land abandoned as a result of shifting cultivation is excluded.
Source: Food and Agriculture Organization, Production Yearbook and data files.
35
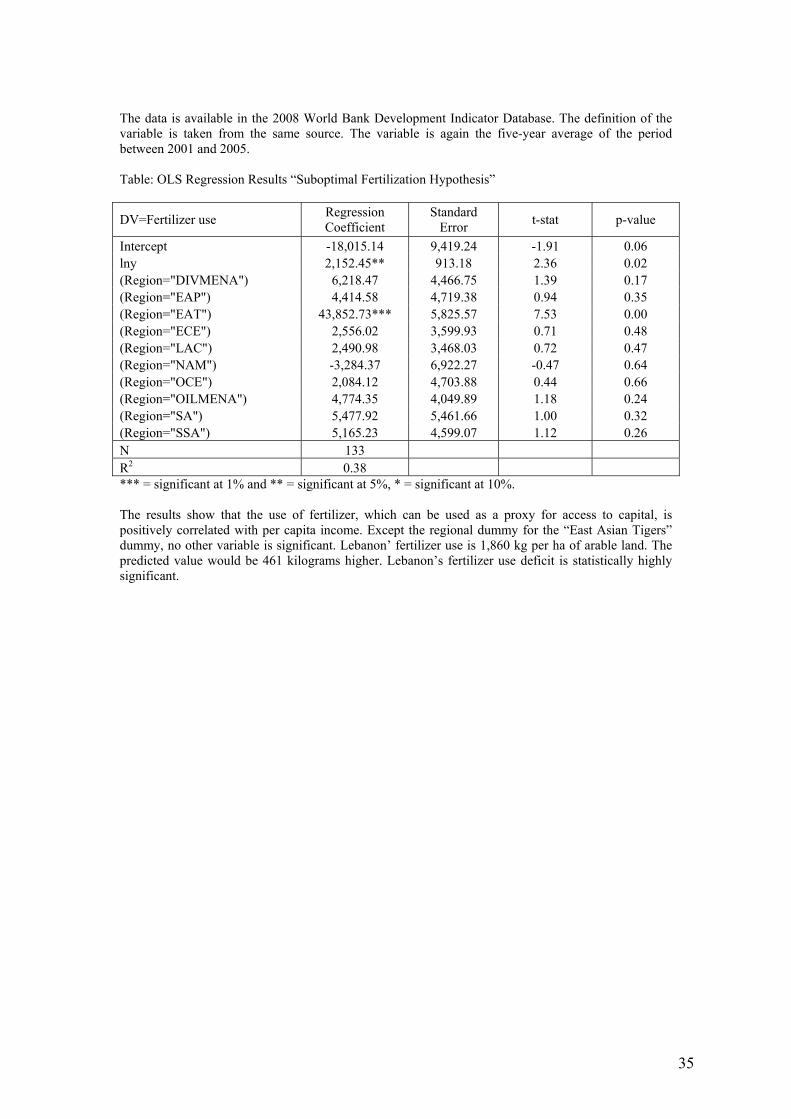
The data is available in the 2008 World Bank Development Indicator Database. The definition of the variable is taken from the same source. The variable is again the five-year average of the period between 2001 and 2005. Table: OLS Regression Results �Suboptimal Fertilization Hypothesis�
DV=Fertilizer use Regression Coefficient
Standard Error t-stat p-value
Intercept -18,015.14 9,419.24 -1.91 0.06 lny 2,152.45** 913.18 2.36 0.02 (Region="DIVMENA") 6,218.47 4,466.75 1.39 0.17 (Region="EAP") 4,414.58 4,719.38 0.94 0.35 (Region="EAT") 43,852.73*** 5,825.57 7.53 0.00 (Region="ECE") 2,556.02 3,599.93 0.71 0.48 (Region="LAC") 2,490.98 3,468.03 0.72 0.47 (Region="NAM") -3,284.37 6,922.27 -0.47 0.64 (Region="OCE") 2,084.12 4,703.88 0.44 0.66 (Region="OILMENA") 4,774.35 4,049.89 1.18 0.24 (Region="SA") 5,477.92 5,461.66 1.00 0.32 (Region="SSA") 5,165.23 4,599.07 1.12 0.26 N 133 R2 0.38 *** = significant at 1% and ** = significant at 5%, * = significant at 10%. The results show that the use of fertilizer, which can be used as a proxy for access to capital, is positively correlated with per capita income. Except the regional dummy for the �East Asian Tigers� dummy, no other variable is significant. Lebanon� fertilizer use is 1,860 kg per ha of arable land. The predicted value would be 461 kilograms higher. Lebanon�s fertilizer use deficit is statistically highly significant.
36
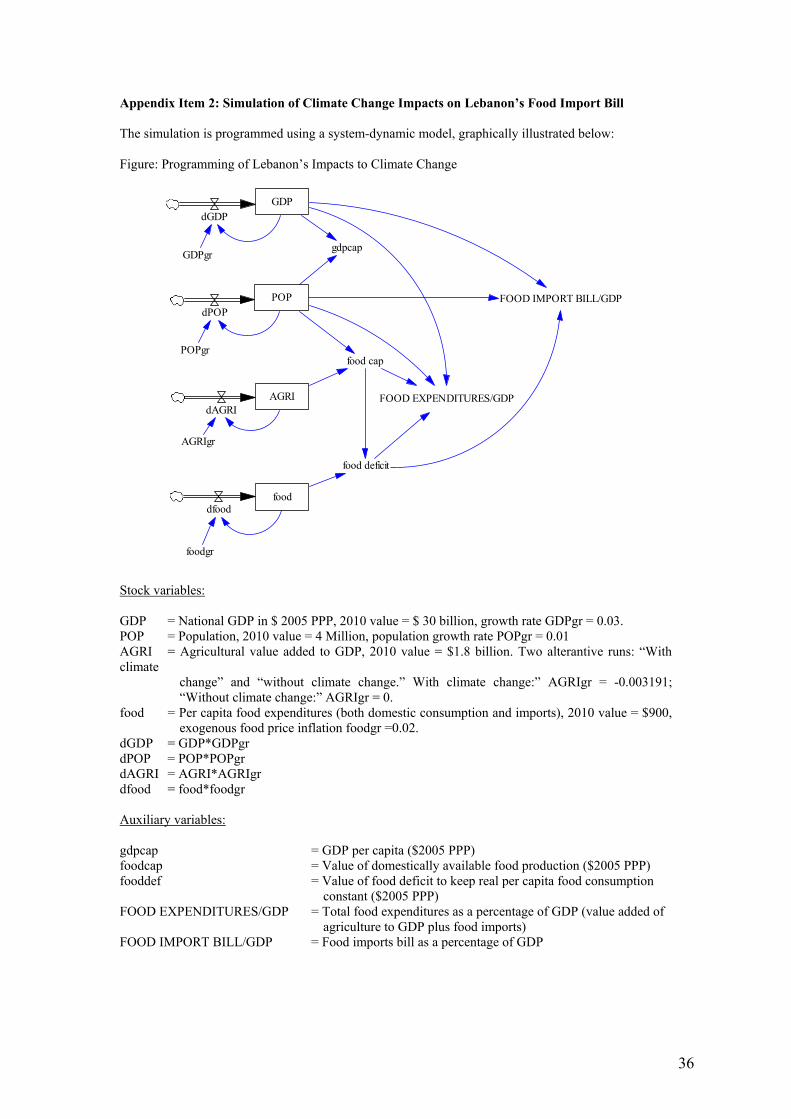
Appendix Item 2: Simulation of Climate Change Impacts on Lebanon�s Food Import Bill The simulation is programmed using a system-dynamic model, graphically illustrated below: Figure: Programming of Lebanon�s Impacts to Climate Change
GDP
POP
dGDP
dPOP
GDPgr
POPgr
AGRIdAGRI
AGRIgr
fooddfood
foodgr
food cap
gdpcap
food deficit
FOOD IMPORT BILL/GDP
FOOD EXPENDITURES/GDP
Stock variables: GDP = National GDP in $ 2005 PPP, 2010 value = $ 30 billion, growth rate GDPgr = 0.03. POP = Population, 2010 value = 4 Million, population growth rate POPgr = 0.01 AGRI = Agricultural value added to GDP, 2010 value = $1.8 billion. Two alterantive runs: �With climate
change� and �without climate change.� With climate change:� AGRIgr = -0.003191; �Without climate change:� AGRIgr = 0.
food = Per capita food expenditures (both domestic consumption and imports), 2010 value = $900, exogenous food price inflation foodgr =0.02.
dGDP = GDP*GDPgr dPOP = POP*POPgr dAGRI = AGRI*AGRIgr dfood = food*foodgr Auxiliary variables: gdpcap = GDP per capita ($2005 PPP) foodcap = Value of domestically available food production ($2005 PPP) fooddef = Value of food deficit to keep real per capita food consumption constant ($2005 PPP) FOOD EXPENDITURES/GDP = Total food expenditures as a percentage of GDP (value added of agriculture to GDP plus food imports) FOOD IMPORT BILL/GDP = Food imports bill as a percentage of GDP
37
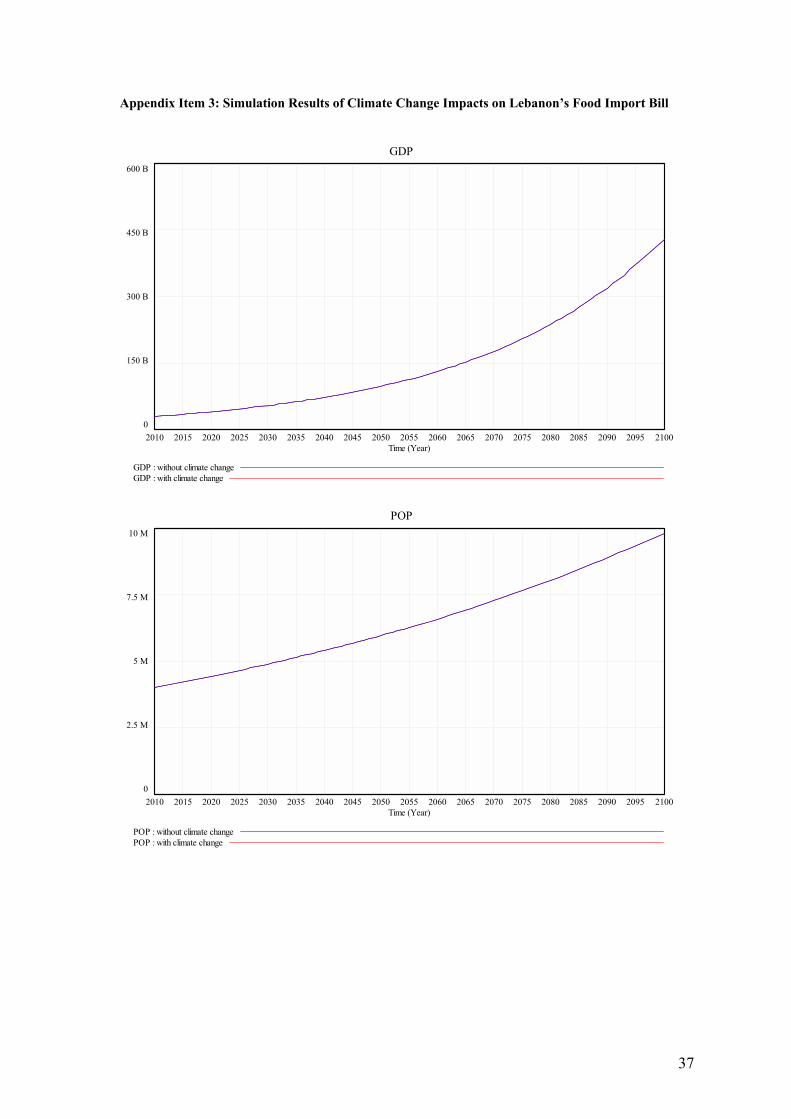
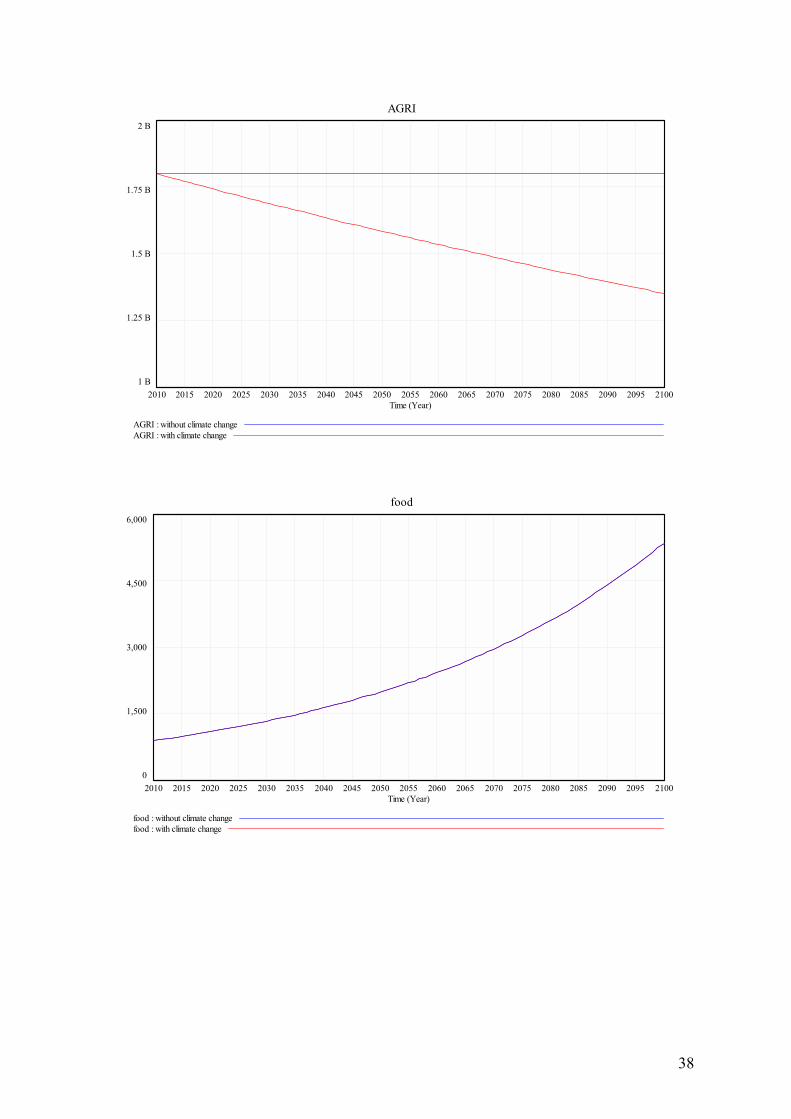
Appendix Item 3: Simulation Results of Climate Change Impacts on Lebanon�s Food Import Bill
GDP600 B
450 B
300 B
150 B
02010 2015 2020 2025 2030 2035 2040 2045 2050 2055 2060 2065 2070 2075 2080 2085 2090 2095 2100
Time (Year)
GDP : without climate changeGDP : with climate change
POP10 M
7.5 M
5 M
2.5 M
02010 2015 2020 2025 2030 2035 2040 2045 2050 2055 2060 2065 2070 2075 2080 2085 2090 2095 2100
Time (Year)
POP : without climate changePOP : with climate change
38
AGRI2 B
1.75 B
1.5 B
1.25 B
1 B2010 2015 2020 2025 2030 2035 2040 2045 2050 2055 2060 2065 2070 2075 2080 2085 2090 2095 2100
Time (Year)
AGRI : without climate changeAGRI : with climate change
food6,000
4,500
3,000
1,500
02010 2015 2020 2025 2030 2035 2040 2045 2050 2055 2060 2065 2070 2075 2080 2085 2090 2095 2100
Time (Year)
food : without climate changefood : with climate change
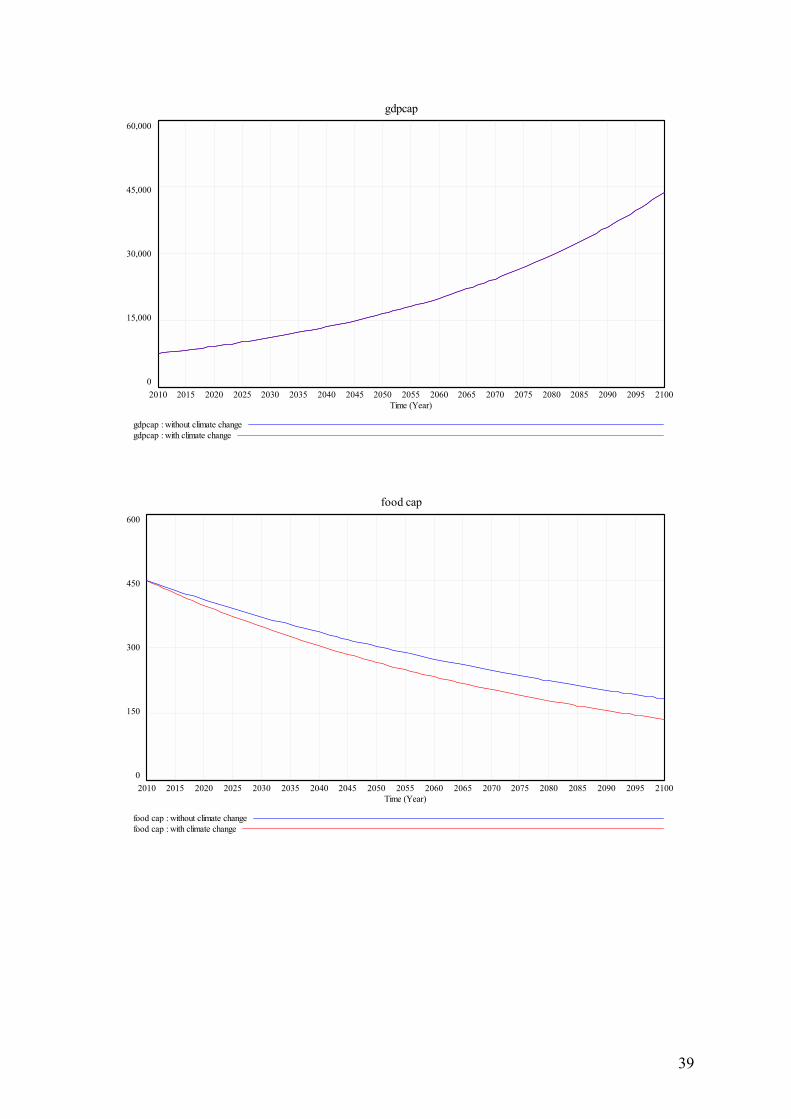
39
gdpcap60,000
45,000
30,000
15,000
02010 2015 2020 2025 2030 2035 2040 2045 2050 2055 2060 2065 2070 2075 2080 2085 2090 2095 2100
Time (Year)
gdpcap : without climate changegdpcap : with climate change
food cap600
450
300
150
02010 2015 2020 2025 2030 2035 2040 2045 2050 2055 2060 2065 2070 2075 2080 2085 2090 2095 2100
Time (Year)
food cap : without climate changefood cap : with climate change
40
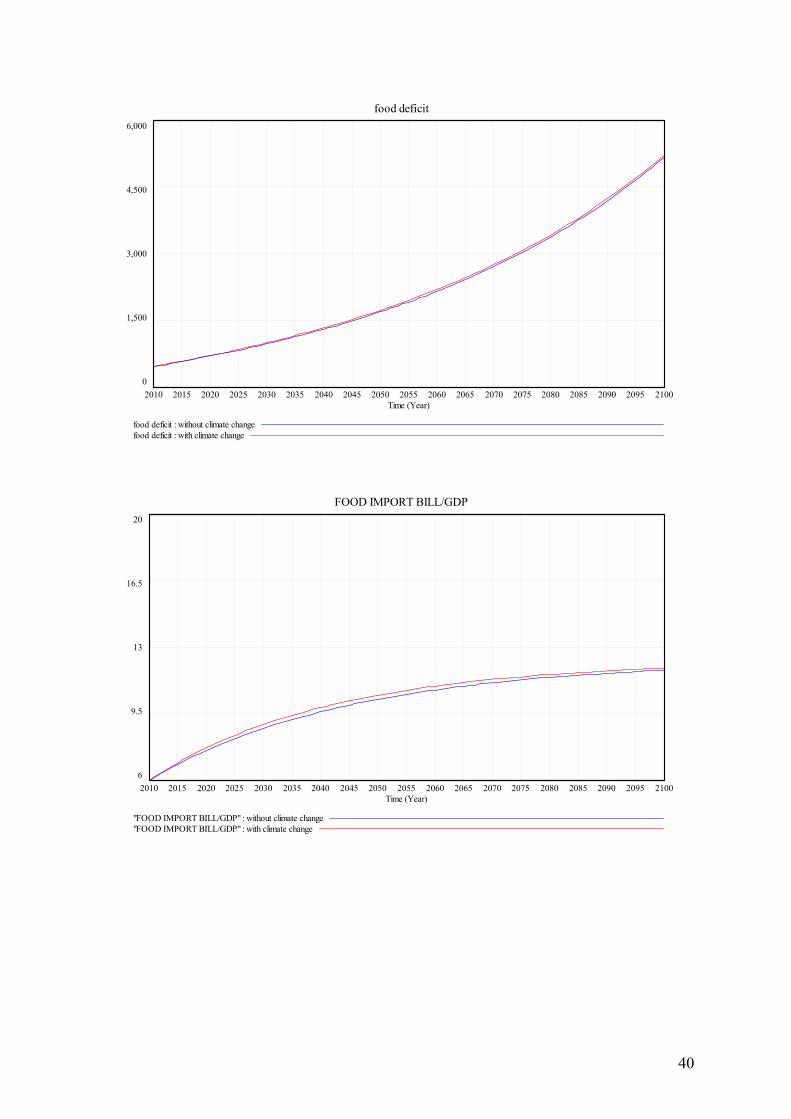
food deficit6,000
4,500
3,000
1,500
02010 2015 2020 2025 2030 2035 2040 2045 2050 2055 2060 2065 2070 2075 2080 2085 2090 2095 2100
Time (Year)
food deficit : without climate changefood deficit : with climate change
FOOD IMPORT BILL/GDP20
16.5
13
9.5
62010 2015 2020 2025 2030 2035 2040 2045 2050 2055 2060 2065 2070 2075 2080 2085 2090 2095 2100
Time (Year)
"FOOD IMPORT BILL/GDP" : without climate change"FOOD IMPORT BILL/GDP" : with climate change
41
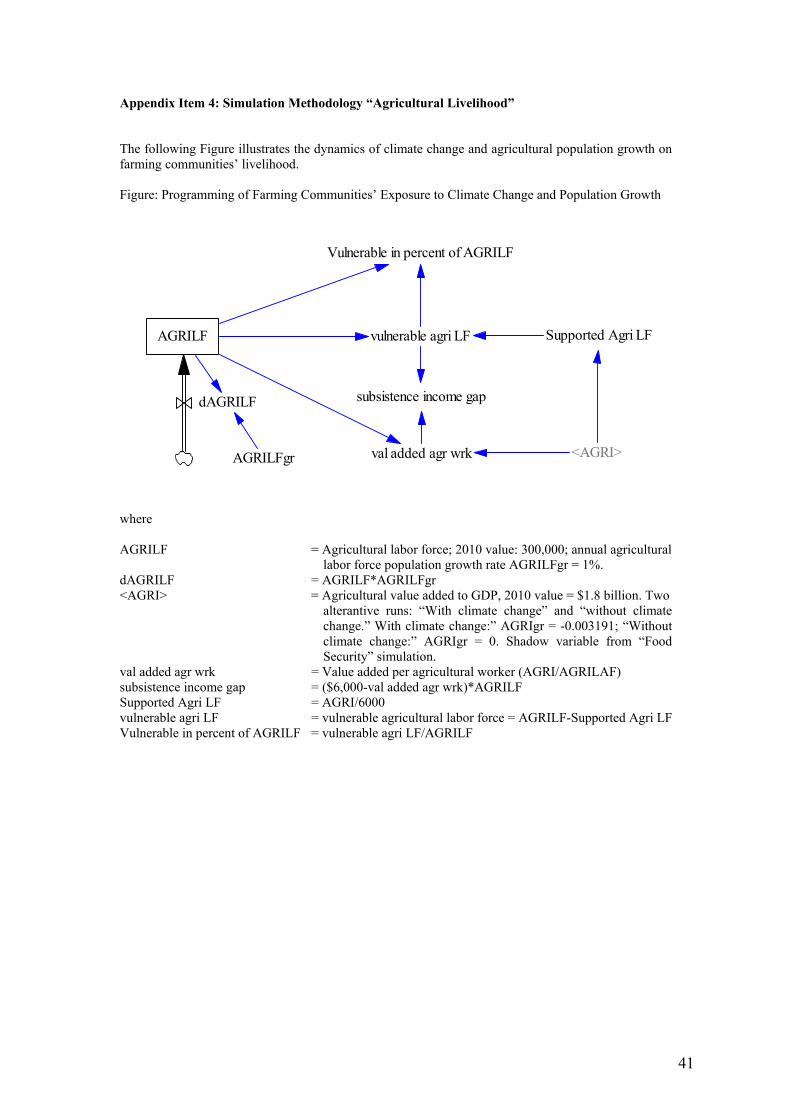
Appendix Item 4: Simulation Methodology �Agricultural Livelihood� The following Figure illustrates the dynamics of climate change and agricultural population growth on farming communities� livelihood. Figure: Programming of Farming Communities� Exposure to Climate Change and Population Growth
AGRILF
dAGRILF
AGRILFgr <AGRI>
Supported Agri LFvulnerable agri LF
val added agr wrk
subsistence income gap
Vulnerable in percent of AGRILF
where AGRILF = Agricultural labor force; 2010 value: 300,000; annual agricultural labor force population growth rate AGRILFgr = 1%. dAGRILF = AGRILF*AGRILFgr <AGRI> = Agricultural value added to GDP, 2010 value = $1.8 billion. Two
alterantive runs: �With climate change� and �without climate change.� With climate change:� AGRIgr = -0.003191; �Without climate change:� AGRIgr = 0. Shadow variable from �Food Security� simulation.
val added agr wrk = Value added per agricultural worker (AGRI/AGRILAF) subsistence income gap = ($6,000-val added agr wrk)*AGRILF Supported Agri LF = AGRI/6000 vulnerable agri LF = vulnerable agricultural labor force = AGRILF-Supported Agri LF Vulnerable in percent of AGRILF = vulnerable agri LF/AGRILF
42
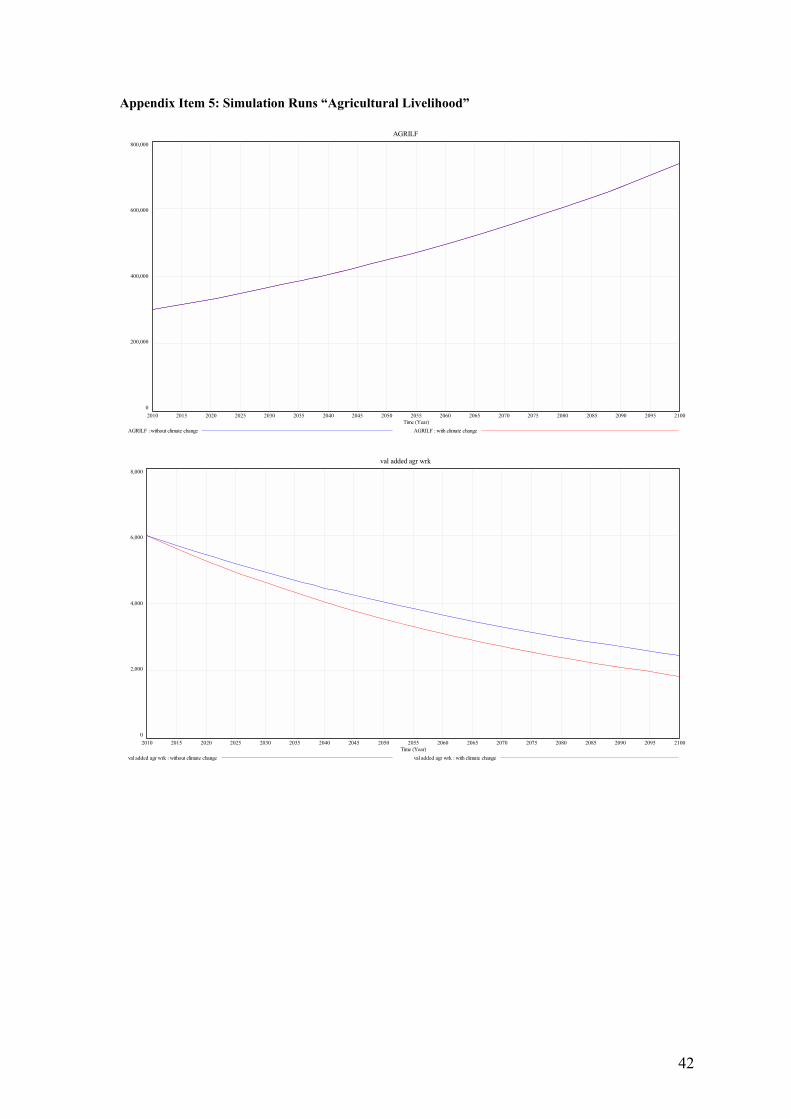
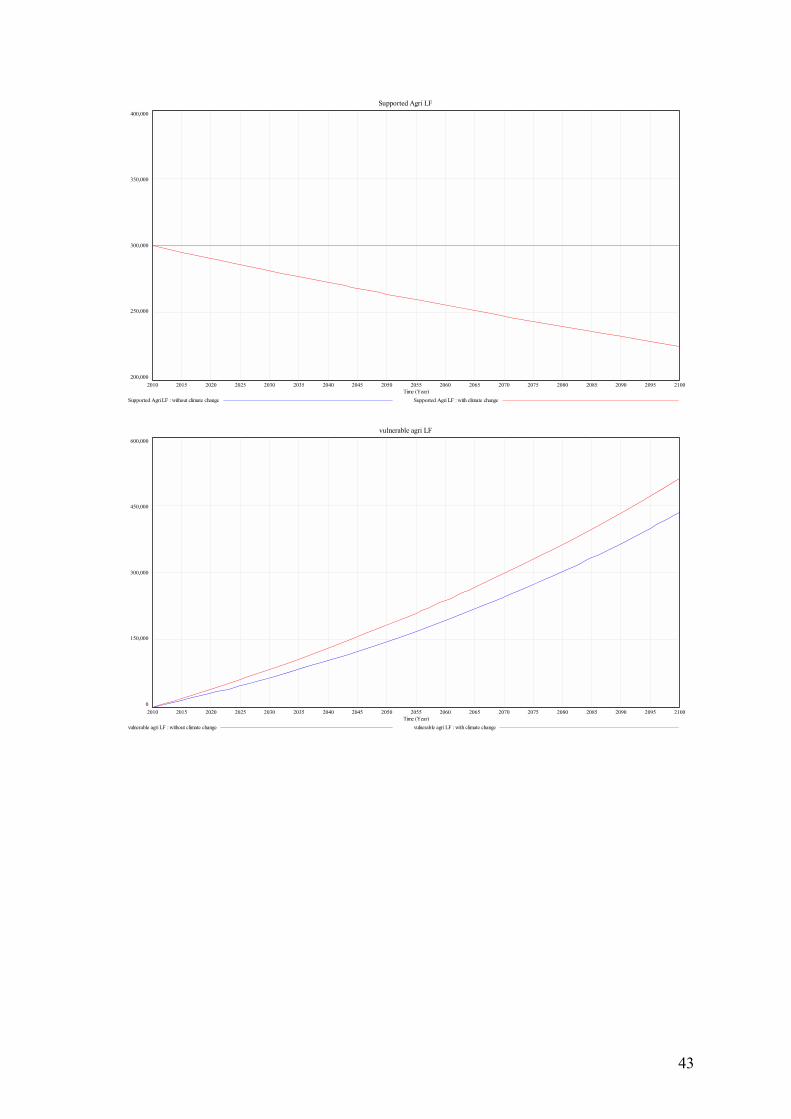
Appendix Item 5: Simulation Runs �Agricultural Livelihood�
AGRILF800,000
600,000
400,000
200,000
02010 2015 2020 2025 2030 2035 2040 2045 2050 2055 2060 2065 2070 2075 2080 2085 2090 2095 2100
Time (Year)AGRILF : without climate change AGRILF : with climate change
val added agr wrk
8,000
6,000
4,000
2,000
02010 2015 2020 2025 2030 2035 2040 2045 2050 2055 2060 2065 2070 2075 2080 2085 2090 2095 2100
Time (Year)val added agr wrk : without climate change val added agr wrk : with climate change
43
Supported Agri LF400,000
350,000
300,000
250,000
200,0002010 2015 2020 2025 2030 2035 2040 2045 2050 2055 2060 2065 2070 2075 2080 2085 2090 2095 2100
Time (Year)Supported Agri LF : without climate change Supported Agri LF : with climate change
vulnerable agri LF
600,000
450,000
300,000
150,000
02010 2015 2020 2025 2030 2035 2040 2045 2050 2055 2060 2065 2070 2075 2080 2085 2090 2095 2100
Time (Year)vulnerable agri LF : without climate change vulnerable agri LF : with climate change
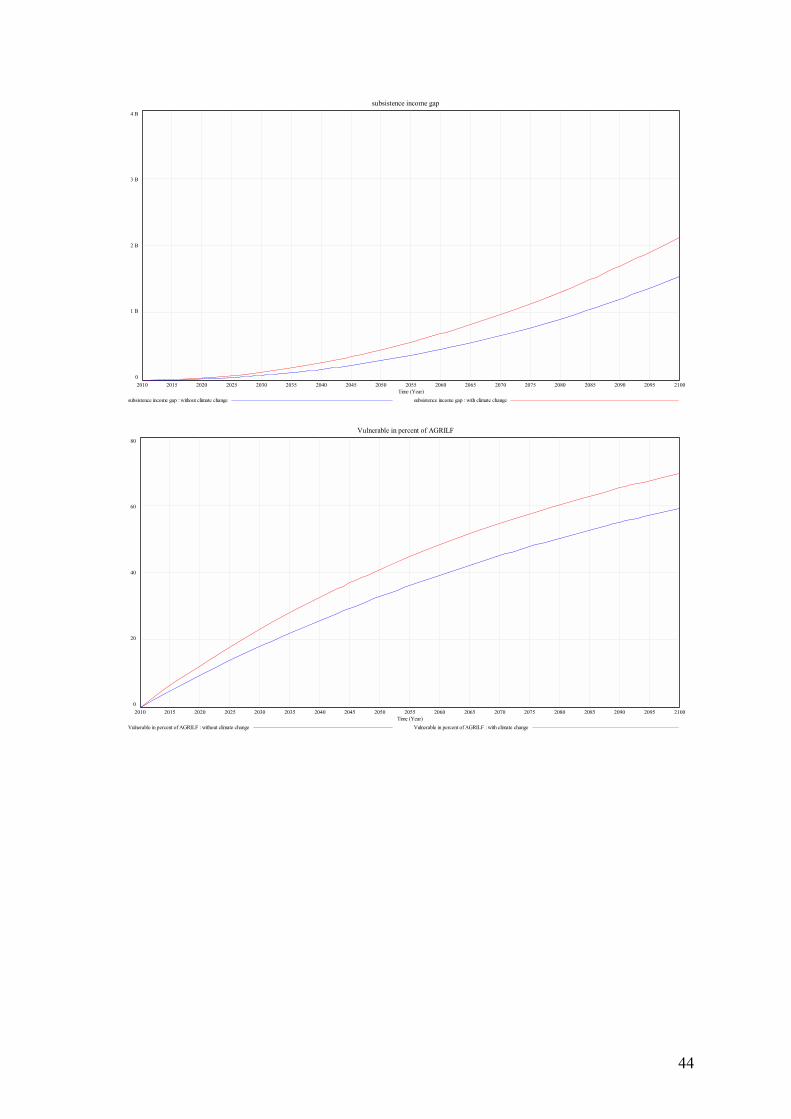
44
subsistence income gap4 B
3 B
2 B
1 B
02010 2015 2020 2025 2030 2035 2040 2045 2050 2055 2060 2065 2070 2075 2080 2085 2090 2095 2100
Time (Year)subsistence income gap : without climate change subsistence income gap : with climate change
Vulnerable in percent of AGRILF
80
60
40
20
02010 2015 2020 2025 2030 2035 2040 2045 2050 2055 2060 2065 2070 2075 2080 2085 2090 2095 2100
Time (Year)Vulnerable in percent of AGRILF : without climate change Vulnerable in percent of AGRILF : with climate change
45
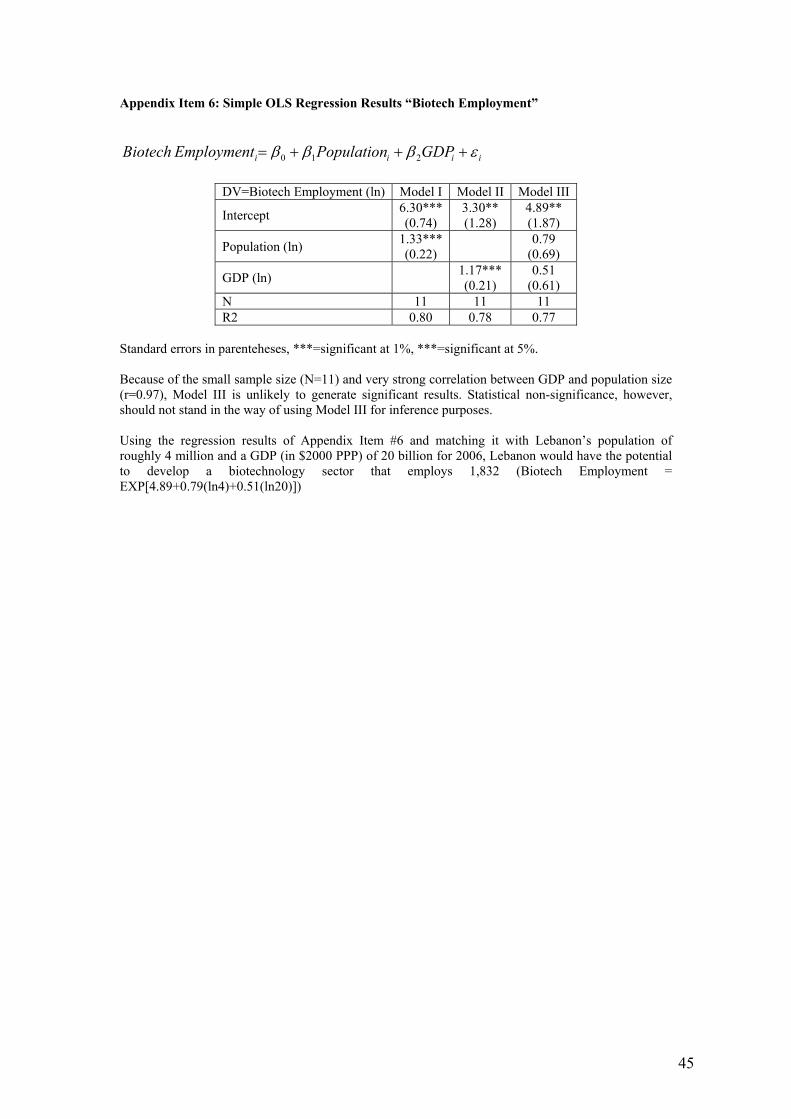
Appendix Item 6: Simple OLS Regression Results �Biotech Employment�
iiii GDPPopulationEmployment Biotech εβββ +++= 210
DV=Biotech Employment (ln) Model I Model II Model III
Intercept 6.30*** (0.74)
3.30** (1.28)
4.89** (1.87)
Population (ln) 1.33*** (0.22) 0.79
(0.69)
GDP (ln) 1.17*** (0.21)
0.51 (0.61)
N 11 11 11 R2 0.80 0.78 0.77
Standard errors in parenteheses, ***=significant at 1%, ***=significant at 5%. Because of the small sample size (N=11) and very strong correlation between GDP and population size (r=0.97), Model III is unlikely to generate significant results. Statistical non-significance, however, should not stand in the way of using Model III for inference purposes. Using the regression results of Appendix Item #6 and matching it with Lebanon�s population of roughly 4 million and a GDP (in $2000 PPP) of 20 billion for 2006, Lebanon would have the potential to develop a biotechnology sector that employs 1,832 (Biotech Employment = EXP[4.89+0.79(ln4)+0.51(ln20)])
![Level 5 Economics: Theory of the Firm [2] Economic Principles Economic Principles Economic Environment Economic Environment](https://img.pdfslide.us/doc/110x75/5519166655034638428b49a5/level-5-economics-theory-of-the-firm-2-economic-principles-economic-principles-economic-environment-economic-environment.jpg)


![Level 5 Economics: Theory of the Firm [3] Economic Principles Economic Principles Economic Environment Economic Environment Imperfect Competition Imperfect](https://img.pdfslide.us/doc/110x75/56649e755503460f94b76c5f/level-5-economics-theory-of-the-firm-3-economic-principles-economic-principles.jpg)