Embed Size (px)
Citation preview

The National Development Plan
State of the Nation Diagnostic
Overview and Data Report
March 2016

Disclaimer
This document is a working draft of the National Development Plan Secretariat and is not an official document of the NDP.
It as been shared to provide additional information and background details on the findings from the assessment of the State of the Nation. Any and all material shared in this PowerPoint is subject to change without notice.
This document may not be cited without the expressed permission of the Secretariat.
For addition information you may contact the Secretariat at 242 702 5500 or [email protected].
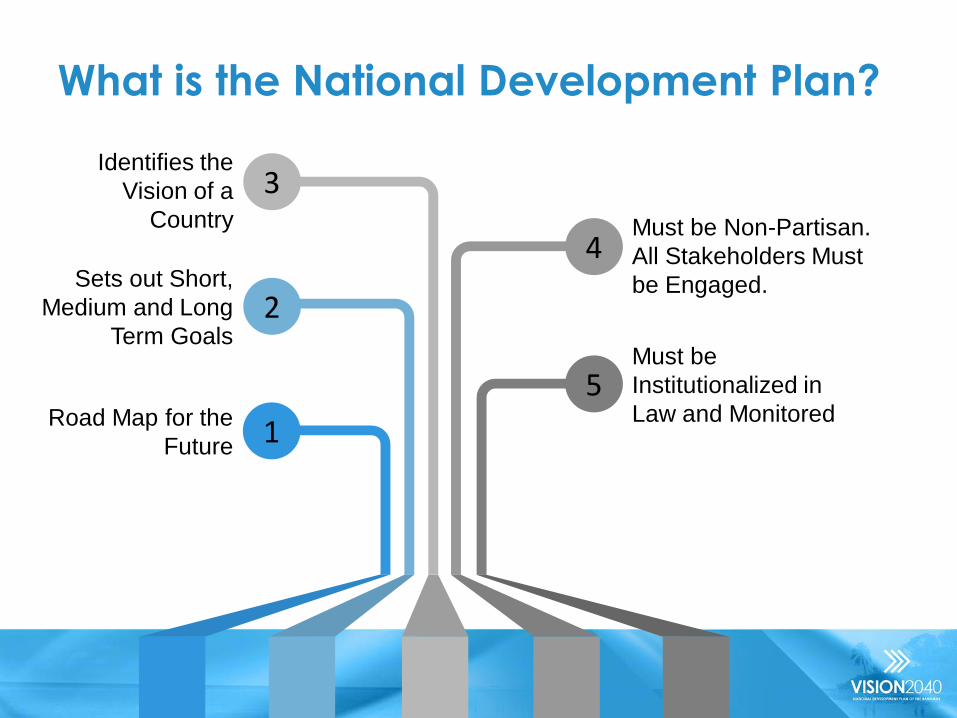
Road Map for the
Future
Sets out Short,
Medium and Long
Term Goals
Identifies the
Vision of a
Country
Must be
Institutionalized in
Law and Monitored
Must be Non-Partisan.
All Stakeholders Must
be Engaged.
5
1
2
3
4
What is the National Development Plan?

Why Does The Bahamas Need A National Development Plan? The
Bahamas has witnessed tremendous economic success over the years.
However, a change in the growth trajectory is required.
4
(Source: World Bank Development Indicators)
-
10,000.00
20,000.00
30,000.00
40,000.00
50,000.00
60,000.00
70,000.001
966
196
8
197
0
197
2
197
4
197
6
197
8
198
0
198
2
198
4
198
6
198
8
199
0
199
2
199
4
199
6
199
8
200
0
200
2
200
4
200
6
200
8
201
0
201
2
201
4
USD
Years
GDP Per Capita
Bahamas, The
Hong Kong
Ireland
Mauritius
Singapore
St. Kitts and Nevis

5
Planning for Growth and Prosperity: National Development Plans are widely used throughout the world to guide progress

A BOLD APPROACH TO DEVELOPMENT
PLANNING IN THE BAHAMAS
6
$450K
Concluding work on the SNR,
Nationwide Consultation
commenced and drafting
Vision 2040
Inclusive National
Development
$750K
Working towards ecosystem
valuation, consultation, education
and Master Plan
Pilot Project for Island
Development
$1.1M
Baseline data, Diagnostic, Action Plan
for the City of Nassau, Urban Lab
planned
Pilot Project for Urban
Development
National
Development
Plan
Sustainable
Nassau
Andros Master
Plan
Supported by new governance
arrangements (Centre of
Government - $50K) and IFMS
loan ($3M)

What are the Steps in the NDP Process?
State of the Nation Report (Diagnosis)
•Economy
•Governance
•Social Policy
•The Environment (built and natural)
Consultation
•Family Islands and NP
•Sectors
•Youth
Draft the Plan
•25 years, short, medium, long goals
•Vision, goals, strategies, action steps
•Monitoring Evaluation
1
2
3

Who Owns The NDP?
Bahamian
Society
•NDP Steering Committee •College of The Bahamas •Civil Society •Private Sector
NDP Partners
• NDP Secretariat Bahamas Government

9
The Economy
• Descriptive: what drives the Bahamian economy
• How are sectors performing?
• Defining The Bahamas’ competitive advantages
Governance •How can government work better?
•Public service effectiveness
•Public sector coordination
•Transparency, Accountability, Voice •Crime and justice
Environment (Built and Natural)
• Do we have the infrastructure needed to build a modern economy?
• Energy, transportation, ICT
• Are we protecting our natural environment?
• Are we ready for the effects of climate change?
Human Capital/ Social Policy
• Education, Training Labour
• Issues of poverty, gender, culture, other societal factors
• Health and healthcare, impacts on the future of the country
Assessing the State of the Nation – 4 Key Pillars

Phase 1: Identifying Our Strengths Human Capital: Significant improvements are underway
•Well funded education sector at 13% of total budget - among the highest percentage in the world
•Well trained teachers: 100% public teachers meet minimum requirements
•High primary enrollment rates; high literacy rates
•Growing investments in health care including access
•Modern hospitals and highly trained health professionals
•Multitude of government programmes aimed at supporting individuals and communities
•A strong sense of national pride
•Collective awareness of cultural traditions and Bahamian identity
Governance: Stable with strong traditions
•Stable democracy with a multi-party system, healthy elections and engaged citizens
•Scores very high by international standards on political, media and civil freedoms
•Some level of decentralization and local decision making on Family Islands
•Large, well trained, professional police force. High police per capita
• Independent judicial system
•Swift Justice programme successes
•Efforts underway to strengthen citizen security programmes
•Declining number of property crimes
The Environment
(Built and Natural): Our Core Assets
•Recent infrastructure improvements
•Roads of high quality against regional standards
• International airports,
•Water and Sewerage infrastucture
•Excellent deep water port (Freeport) with room for expansion – able to service superpanamex ships, and fourth largest oil terminal for transshipment in the world
•High Internet and cell phone penetration
•Electricity supplied to all major islands; BEC operates 29 generating plants in 25 Island locations
•Bountiful natural marine environment and a tropical climate
•Legislation and international protocols in place to help protect the environment
Economy: Gateway to the Americas
•Stable currency and effective monetary policy
•Location: next door to one of the largest markets in the world: the USA
•Natural resources: land and water resources associated with a tropical archipelago
•Significant foreign investment
•Low tax regime
•Recent infrastructure improvements including expanded and improved Lynden Pindling Airport on New Providence – supporting an increase in international and domestic airlift;
•Progressive action to restructure the financial sector towards more value added services
•Reliable banking system
•Market recognition in tourism and financial services

Phase 1: Facing Our Challenges
Human Capital:
Social progress slowdown
• Changing cultural values towards material gain, work and ethics
• At risk youth that do not have the support they need
• Community decay and ghettoisation
• High levels of criminal behaviour, particularly murder
• High levels of intergenerational and new poverty
• Many citizens unequipped to reach their full potential as a result of poor education and training outcomes
• High levels of “unwellness”
• Immigration challenges leading to social exclusion
Environment:
Highly vulnerable natural and built environment
• Archipelagic makeup increases the development challenge
• Communities with inadequate housing, sanitation and community infrastructure
• Lack of value placed on the natural environment combined with poor solid waste management
• Public infrastructure that does not support a modern economy or inclusive national development (energy, transportation, access for persons with disabilities)
• Lack of long-term infrastructure planning
• Complicated land tenure and registration processes
• Lack of integration of modern technology, GIS, ecosystem valuation, hazard planning, adaptation and mitigation services
• Lack of preparedness for inevitable climate change
Economy:
Highly vulnerable, undiversified and underperforming economy
• High costs of doing business inhibit private sector growth
• Complicated business environment, which affect both small and large businesses
• Economy which is dependent on one sector and one market
• Immature value chains across most sectors
• High debt burden which constrains the government’s ability to respond as required
• Low levels of competitiveness and productivity
• Low levels of household financial resilience, including personal financial planning
• Immature financial sector development
• Misunderstood economic policy
Governance:
Governance arrangements that do not support a modern
Bahamas
•Poor or absent strategic planning and coordination within government •Inadequate levels of accountability, monitoring and
evaluation which affect service delivery •Lack of a campaign finance framework •Lack of inclusive engagement at the local level
•Uneven performance of public service agencies
•Public service recruitment methods and code that does not meet the need of a modern public service
•High levels of crime which challenge government’s credibility
•Inadequate protections around certain human rights, including rights of migrants and gender equality
•Poor government communications, including mechanisms to incorporate citizen feedback

12
Phase 2 NDP: Community Engagement & Awareness Campaigns, Family Islands Visits

Understanding the Economy and Society of North Andros
13

Speaking with Residents in Town Hall Meetings in South Andros
14
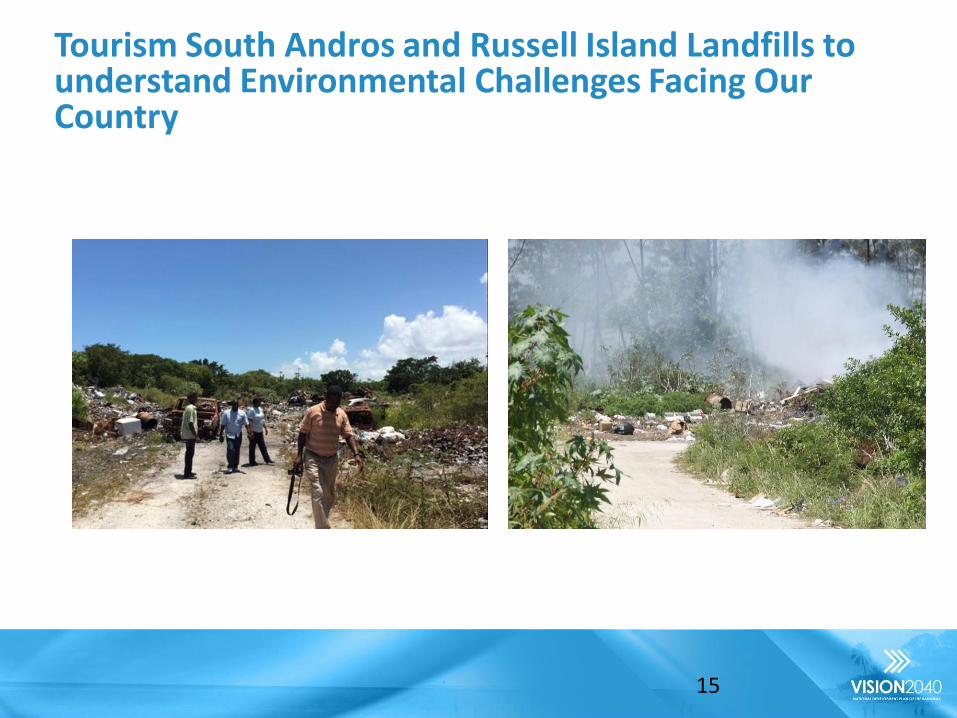
Tourism South Andros and Russell Island Landfills to understand Environmental Challenges Facing Our Country
15

Understanding the Salt Industry in
Inagua
16

Meeting with Residents in Spanish Wells, Eleuthera
17

Meeting with Residents in Governor’s Harbour
18

Meeting with Residents in Rock Sound, Eleuthera
19

Understanding the industries, tourism
product and challenges in Abaco

Meeting with Bahamians from all
walks of life

Understanding the Potential of
Bahamian Agriculture

Hearing from Residents from Diverse
Backgrounds

Ensuring that the NDP is an
Inclusive Process

Phase 3: Drafting of the National
Development Plan
National Vision
Goals: Governance Strategies Actions Indicator of Success Timelines Agency
Goals: Economy Strategies Actions Indicator of Success Timelines Agency
Goals:
Environment and Infrastructure
Strategies Actions Indicator of Success Timelines Agency
Goals: Human Development
Strategies Actions Indicator of Success Timelines Agency

KEYS TO SUCCESSFUL IMPLEMENTATION OF PROJECT
RISK:
MITIGANT ONE:
Ensuring Implementation of the Plan
MITIGANT TWO:
MITIGANT THREE:
CENTRE OF GOVERNMENT APPROACH TO THE PLANNING
• Development of a National Development Plan Bill
• Introduction of a planning and implementation monitoring tool and a governance mechanism to ensure that planning and execution occurs
WIDE CONSULTATION AND STAKEHOLDER APPROACH
Ensuring wide ownership and accountability
BUILD CAPACITY IN PLANNING AND ENSURE THAT THERE IS A
“STRATEGIC PLANNING SPACE” IN PUBLIC ADMINISTRATION
Project Risks
26

Other Projects Tangential to
the NDP Andros Master Plan

Andros Sustainable Development
Master Plan
• Measurement of the economic value of Andros’ ecosystem
services
• Drafting and assessment of viable development scenarios
• Development of a proposal for a physical development plan that
optimizes the economic value of Andros’ natural capital.
• Stakeholder driven

Iterative Stakeholder Engagement

Varied Engagement Formats
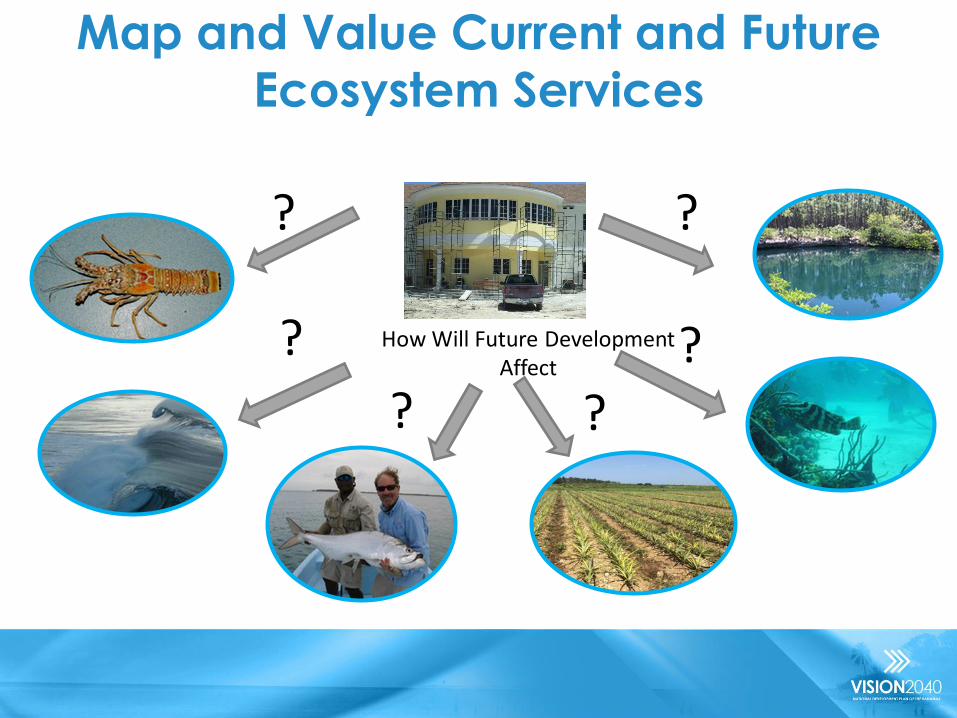
How Will Future Development Affect
?
?
?
?
? ?
Map and Value Current and Future
Ecosystem Services

Participatory Mapping
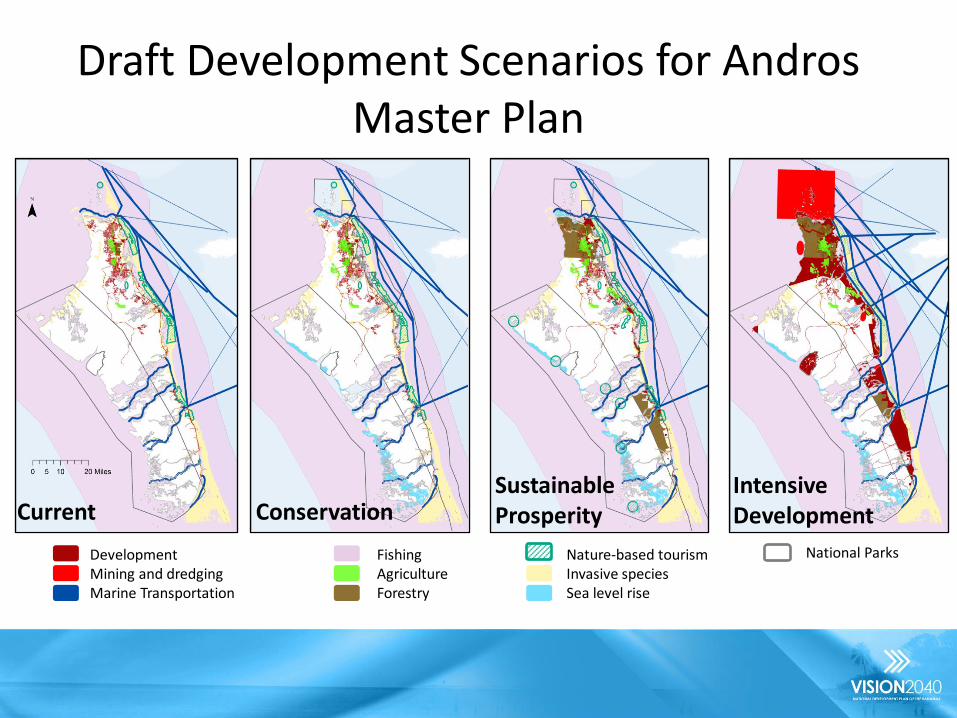
Draft Development Scenarios for Andros Master Plan
Development Mining and dredging Marine Transportation
The Current scenario represents the human activities occurring on Andros. These activities were identified by Androsians and other stakeholders in October, 2015.
Nature-based tourism Invasive species Sea level rise
Fishing Agriculture Forestry
Intensive Development Conservation
Sustainable Prosperity Current
National Parks
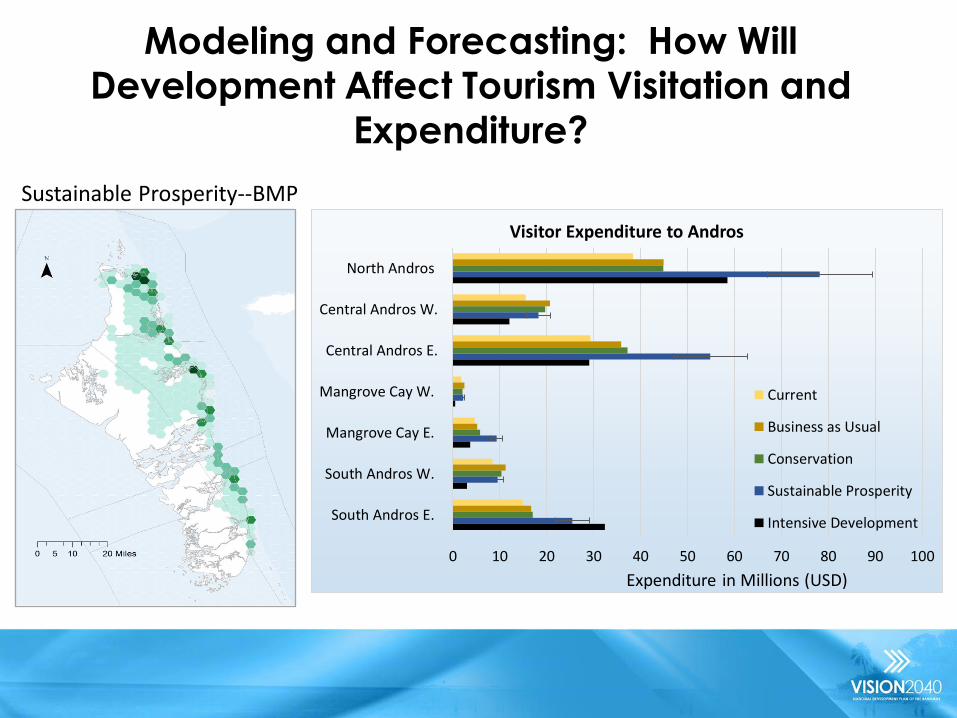
Modeling and Forecasting: How Will
Development Affect Tourism Visitation and Expenditure?
Sustainable Prosperity--BMP
0 10 20 30 40 50 60 70 80 90 100
North Andros
Central Andros W.
Central Andros E.
Mangrove Cay W.
Mangrove Cay E.
South Andros W.
South Andros E.
Expenditure in Millions (USD)
Visitor Expenditure to Andros
Current
Business as Usual
Conservation
Sustainable Prosperity
Intensive Development

Modeling and Forecasting: Future
Lobster Harvest Scenarios
0 2500000 5000000 7500000
Abacos
Acklins
Andros
Eluthera
Exumas
Inagua
Long Island
New Providence
N Bahama Bank
San Salvador
S Great Bahama Bank
W Bahama Bank
W Little Bahama Bank
Harvest (lbs whole)
Sou
rce
Nu
rse
ry H
abit
at R
egio
n
Lobster Harvest Attributable to Nursery Habitat
Current
Business as Usual
Conservation
Sustainable Prosperity (noBMP)
Sustainable Prosperity(BMP)
Intensive Development

Results and Potential Impacts
• Positive response and consistent stakeholder
engagement
• Preference for nature-based economy vs. mega
resort projects
• Strong desire for education, training and
capacity-building opportunities

Next Steps
• BRLI (French multinational) engaged by the IDB to produce master plan based on the Sustainable Prosperity scenario
• Master plan to be submitted by November 2016
• Additional $150k funding request has been made to the IDB for Natural Capital Project to remain engaged for duration of project
• Potential opportunities for Bahamians to be trained in use of NatCap’s open source software so similar modeling can be done for other islands in the future

What Are Some of the Risks/
Challenges?
Failure to get buy-in
Androsians skeptical of any actionable outcomes
Inadequate Data
Poor or nonexistent data collection and management by some agencies
Implementation
challenges
Failure to adopt preferred future development scenarios vs business as
usual

How Do We Limit these Risks
Risk Mitigation
Buy-in
• Highlight relevant achievements as part of long-term development planning (e.g. IDB/Audubon Society bird watching certification, IDB/BAIC Sponging Project, Caribbean Global Timber pilot phase
• Ongoing communication and engagement with stakeholders
Data • Emphasis on data collection and sharing by all
government agencies (NEMA, BNGIS, BAMSI, DMR, etc)
Implementation • Training, capacity building and engagement of COB and
high school students: GIS, data collection, ecotourism etc.

Final Product (Examples from Montego Bay, Jamaica Development Plan)
• Recommended priority investments, including
estimated costs and timelines
• Zoning recommendations
• Best management practices

Expected Outcomes from Andros Project
• Improve the understanding of the valuation of Andros’ natural and social resources
• Explore the various development scenarios for Andros and understand the trade offs • If I develop this, I lose this, etc
• Facilitate making a decision about a development path for Andros (North, Central, South)
• Understand the costs of development and infrastructure.
• It will provide a template for other island planning projects
41

What about Nassau?
A Model For Urban Planning

Sustainable Nassau Project: A Smart Approach to Urban Planning

44
Source: IDB http://www.iadb.org/en/topics/emerging-and-sustainable-cities/implementing-the-emerging-and-sustainable-cities-initiative-approach,7641.html
The Sustainable Nassau Project


• Effectively plan for an increasingly urbanized Nassau
‐ Sanitation, transportation, urban development and housing, citizen security
• Coordinate with other initiatives
‐ Historic Charlestown, Downtown initiative
• Improve the wellbeing of Nassauvians
47
Expected Outcomes Of
Sustainable Nassau Project

Centre of Government
National Development
Plan
Island Masterplans
Nassau Masterplan
48
AN INTEGRATED SYSTEM OF DEVELOPMENT FOR THE BAHAMAS

The Pillars of the NDP
The Data

Human and Social Capital
Pillar I
50

Pillar I: Human and Social Capital
51
• The population of the Bahamas is about 385,000 people. – It grew by nearly 16% between 2000 and 2012. – Just over 40 per cent of the population under the age of 24.
• Structures are in place to support human capital: – There is a functioning public health system with hospitals and clinics. – Education is compulsory for children (5-16), and free in the country’s 168 public schools. – There are also private schools, a soon to be National University and other tertiary and
vocational schools. – The Ministry of Social Services, the National Insurance Board and the Ministry of Labour
oversee the country’s social protection systems.
• Indicators such as the adult literacy rate are good, but other indicators show lackluster human capital outcomes: low vocational school graduation rate, a rise in poverty, violent crime, income inequity, poor educational outcomes and skills training.
• Employers often note difficulty in finding employees with the right skill set which is exacerbated by brain drain.

Demographics Matter
52
16% 12% 11% 10% 9%
28%
26% 21%
20% 18%
16% 22%
21%
17% 16%
29% 28%
34% 38%
38%
8% 7% 8% 10% 12%
3% 4% 5% 5% 6%
0%
10%
20%
30%
40%
50%
60%
70%
80%
90%
100%
1970 1980 1990 2000 2010
65+
50-64
25-49
15-24
5-14
0-4
Population of The Bahamas by Age Groupings, Dept of Statistics Large working age population with potential
for productive or unproductive
activities

Population is Aging, Dependency Ratios
Changing – A Source for Concern in the Future
53
15000 10000 5000 0 5000 10000 15000
UNDER 1 YEAR
5 - 9
15 - 19
25 - 29
35 - 39
45 - 49
55 - 59
65 - 69
75 - 79
85 AND OVER
20000 10000 0 10000 20000
UNDER 1 YEAR
5 - 9
15 - 19
25 - 29
35 - 39
45 - 49
55 - 59
65 - 69
75 - 79
85 AND OVER
15000 10000 5000 0 5000 10000 15000
UNDER 1 YEAR
5 - 9
15 - 19
25 - 29
35 - 39
45 - 49
55 - 59
65 - 69
75 - 79
85 AND OVER
20000 15000 10000 5000 0 5000 1000015000 20000
UNDER 1 YEAR
5 - 9
15 - 19
25 - 29
35 - 39
45 - 49
55 - 59
65 - 69
75 - 79
85 AND OVER
20000 10000 0 10000 20000
UNDER 1 YEAR
5 - 9
15 - 19
25 - 29
35 - 39
45 - 49
55 - 59
65 - 69
75 - 79
85 AND OVER
1970 1980 1990
2000 2010
Source: Dept of Statistics
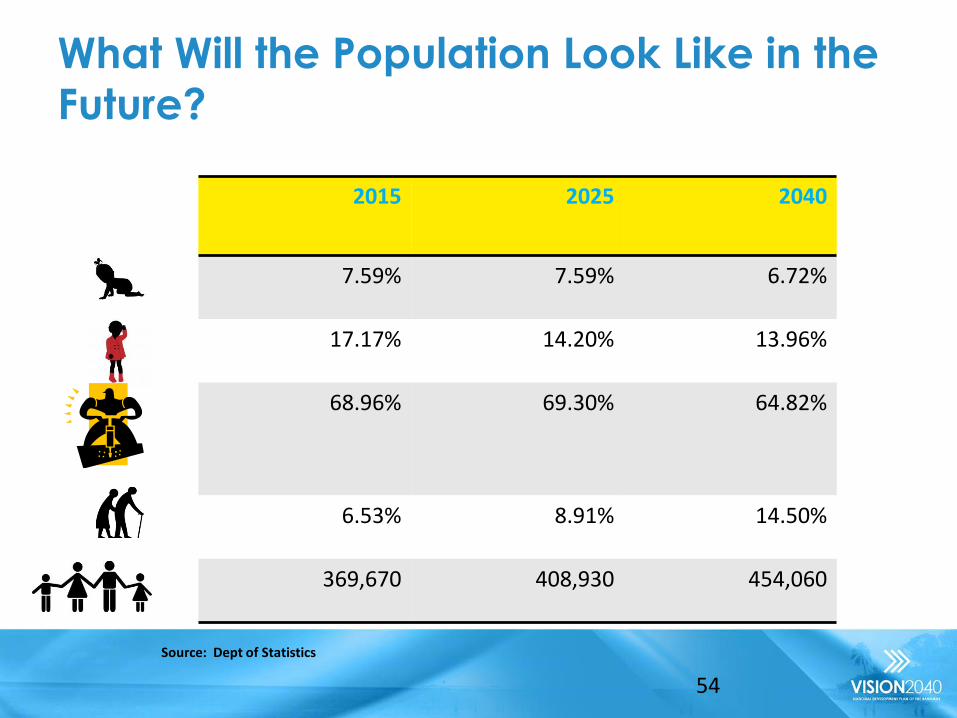
2015 2025 2040
7.59% 7.59% 6.72%
17.17% 14.20% 13.96%
68.96% 69.30% 64.82%
6.53% 8.91% 14.50%
369,670 408,930 454,060
What Will the Population Look Like in the
Future?
54
Source: Dept of Statistics
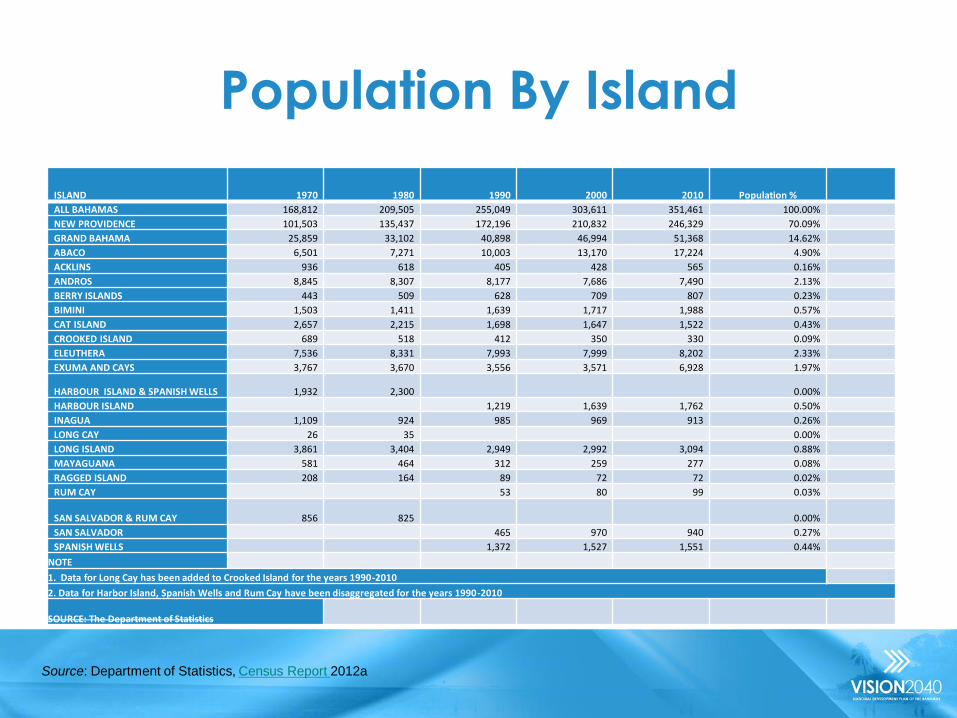
Population By Island
ISLAND 1970 1980 1990 2000 2010 Population %
ALL BAHAMAS 168,812 209,505 255,049 303,611 351,461 100.00%
NEW PROVIDENCE 101,503 135,437 172,196 210,832 246,329 70.09%
GRAND BAHAMA 25,859 33,102 40,898 46,994 51,368 14.62%
ABACO 6,501 7,271 10,003 13,170 17,224 4.90%
ACKLINS 936 618 405 428 565 0.16%
ANDROS 8,845 8,307 8,177 7,686 7,490 2.13%
BERRY ISLANDS 443 509 628 709 807 0.23%
BIMINI 1,503 1,411 1,639 1,717 1,988 0.57%
CAT ISLAND 2,657 2,215 1,698 1,647 1,522 0.43%
CROOKED ISLAND 689 518 412 350 330 0.09%
ELEUTHERA 7,536 8,331 7,993 7,999 8,202 2.33%
EXUMA AND CAYS 3,767 3,670 3,556 3,571 6,928 1.97%
HARBOUR ISLAND & SPANISH WELLS 1,932 2,300 0.00%
HARBOUR ISLAND 1,219 1,639 1,762 0.50%
INAGUA 1,109 924 985 969 913 0.26%
LONG CAY 26 35 0.00%
LONG ISLAND 3,861 3,404 2,949 2,992 3,094 0.88%
MAYAGUANA 581 464 312 259 277 0.08%
RAGGED ISLAND 208 164 89 72 72 0.02%
RUM CAY 53 80 99 0.03%
SAN SALVADOR & RUM CAY 856 825 0.00%
SAN SALVADOR 465 970 940 0.27%
SPANISH WELLS 1,372 1,527 1,551 0.44%
NOTE
1. Data for Long Cay has been added to Crooked Island for the years 1990-2010
2. Data for Harbor Island, Spanish Wells and Rum Cay have been disaggregated for the years 1990-2010
SOURCE: The Department of Statistics
Source: Department of Statistics, Census Report 2012a

Bahamas is Becoming More Diverse
56 Source: Dept of Statistics

Education Profile of Recent
Immigrants
Educational Attainment
All Recent Immigrants
Employed Immigrants
No. Percent No. Percent
Secondary 12,761 45.0 6,767 43.3
College/University 9,021 31.8 6,564 42.0
Primary 3,710 13.1 1,299 8.3
Post Secondary/Technical/Vocational 1,738 6.1 708 4.5
None/Pre-School/Kindergarten 1,135 4.0 305 1.9
Total 28,365 100.0 15,643 100.0
Source: Department of Statistics, Census Report 2012b

EDUCATION

Education is Critical to Develop Human Capital
59
Bi-Partisan Approach to Education - A Shared Vision for Education 2030
Minister of Education, Science and Technology, Hon. Jerome Fitzgerald initiated the formation of a Bi-Partisan Political Committee for “Shared Vision For Education 2030” in
2013. Members of the three main political parties: the Progressive Liberal Party (PLP), Free National Movement (FNM) and the Democratic National Alliance (DNA). Members include some of the former Ministers of Education who are committed to work as a team, combining resources to combat the issues and correlated problems of education.
As part of the initiative, the National Education Committee was launched to develop ideas and make recommendations from which a strategic plan will be built and policies created that will guide education in The Bahamas for the next 15 years. The Shared Vision For Education 2030 was dubbed as a “Bahamian Plan – A Plan for the direction that education will pursue in order to enable the advancement of the Bahamian People”.
The basic mandates of the Shared Vision For Education 2030 are to: 1. Ensure that every student leaves primary school fully; literate and numerate, 2. Ensure that all school leavers are able to transition effectively from school into higher
education, the labour market and society and, 3. Enhance the quality of the educational experience offered by providing teachers,
other educational professionals and support staff with a variety of relevant and effective professional development activities and other such support services.

Highly Trained Teachers
Indicators 2005/2006 2006/2007 2007/2008 2008/2009 2009/2010
Student/Teacher Ratio (Overall) 14.2 13.8 13.7 12.7 13.1
Student/Teacher Ratio (Primary) 16.7 14.5 15.3 13 14.4
Student/Teacher Ratio (Secondary) 13.1 12 12.7 12.3 12.2
Percentage Trained Teachers 87.8 n/a 89 84.8 89.8
Percentage Trained Teachers with at least a first degree
n/a n/a 69.3 65.8 75.2
Source: Ministry of Education, Education Statistics 2013-2014

Investment in Education Number and Types of Schools by Level
61
Number and Types of Schools in the Education System (2012) * 70 units comprised of 59 attached to primary schools, 11 attached to all-age schools
Type of School Grade Levels
Ages Number of Schools
Public Independent
*Preschool N/A 4 years 11 Not available
Primary 1-6 5-10 93 24
All-Age K-12 4-17 13 38
Junior High 7-9 11-13 9 3
Senior High 10-12 14-17 8 0
Secondary Schools
7-12 11-17 22 6
Special Schools 7 6
Alternative - 6 0
Total 169 77

Actual Expenditure on Education
• Source: Research and Planning Section, Ministry of Education, Science and Technology
Recurrent Budget, 249.7
Capital Budget, 15.5
0
50
100
150
200
250
300
350
FY01/02 FY02/03 FY03/04 FY04/05 FY05/06 FY06/07 FY07/08 FY08/09 FY09/10 FY10/11 FY11/12 FY12/13 FY13/14 FY14/15
Bah
$ (
in M
illio
ns)
Fiscal Years

Public Expenditure on Education as a Percentage of Public Spending and GDP,
2003/4 to 2014/15
15.7
12.7
2.6
4
3.32
1
1.5
2
2.5
3
3.5
4
4.5
8
10
12
14
16
18
20
FY03/04 FY04/05 FY05/06 FY06/07 FY07/08 FY08/09 FY09/10 FY10/11 FY11/12 FY12/13 FY13/14 FY14/15
% o
f G
DP
% o
f P
ub
lic S
pe
nd
ing
Public Expenditure on Education as a Percentage of Public Spending Expenditure on Education as a Percentage of GDP
Source: Research and Planning Section, Ministry of Education, Science and Technology

Need for Higher Pre-Primary Enrollment
Average Pre-Primary Enrolment (% Gross)
Average School enrolment, pre-primary (% gross)
1970-1979
1980-1989
1990-1999
2000-2009
2010-
Antigua and Barbuda 25.0% 30.0% 69.9% 85.2%
Bahamas, The 9.2% 24.4%
Bermuda 121.4% 148.6% 51.4% 47.6%
Barbados 28.2% 38.8% 74.6% 81.6% 80.5%
Canada 49.2% 56.5% 62.8% 68.7% 71.4%
Caribbean small states 49.1% 57.4% 68.0% 78.7% 75.8%
Cuba 54.6% 73.7% 92.3% 108.5% 102.7%
United Kingdom 34.2% 47.8% 61.6% 75.8% 84.0%
High income 54.2% 63.0% 68.9% 77.3% 85.3%
United States 45.1% 56.2% 64.2% 61.9% 73.2% Source: World Bank, 2015d.
[1] Gross Enrolment Ratio (GER) pre-primary. Total is the total enrolment in pre-primary education, regardless of age,
expressed as a percentage of the total population of official pre-primary education age. GER can exceed 100% due to the
inclusion of over-aged and under-aged students because of early or late school entrance and grade repetition. World Bank,
2015d.

60% of Pre-schoolers go to a Private
School; starting as young as 2 years
Total Pre-Primary Students by Age and Sex 2013
Sex Age
Total 2 3 4 5 6
M 19 635 1162 377 22 2215 F 15 650 1157 453 11 2286
Total 34 1285 2319 830 33 4501
Public Pre-Primary M 0 166 684 34 2 886 F 0 158 677 46 1 882
Total 0 324 1361 80 3 1768
Independent Pre-Primary M 19 469 478 343 20 1329 F 15 492 480 407 10 1404
Total 34 961 958 750 30 2733
Source: Ministry of Education, Education Statistics 2013-2014

Primary School Enrollment Rates are
high compared to global averages
102%
97%
108%
110%
80%
85%
90%
95%
100%
105%
110%
115%
120%
1970-1979 1980-1989 1990-1999 2000-2009 2010-
Bahamas, The Small states World High income: nonOECD Latin America & Caribbean (all income levels)
Source: World Bank, 2015e

Strong Improvement in the 2015 Primary School Results. Girls generally performed
better
0%
10%
20%
30%
40%
50%
60%
70%
2011 2012 2013 2014 2015
Grade 3 GLAT
Sex Female Total (A-C) Total (A-D)
0%
10%
20%
30%
40%
50%
60%
70%
80%
90%
2011 2012 2013 2014 2015
Grade 6 GLAT
Male Female Total (A-C) Total (A-D)
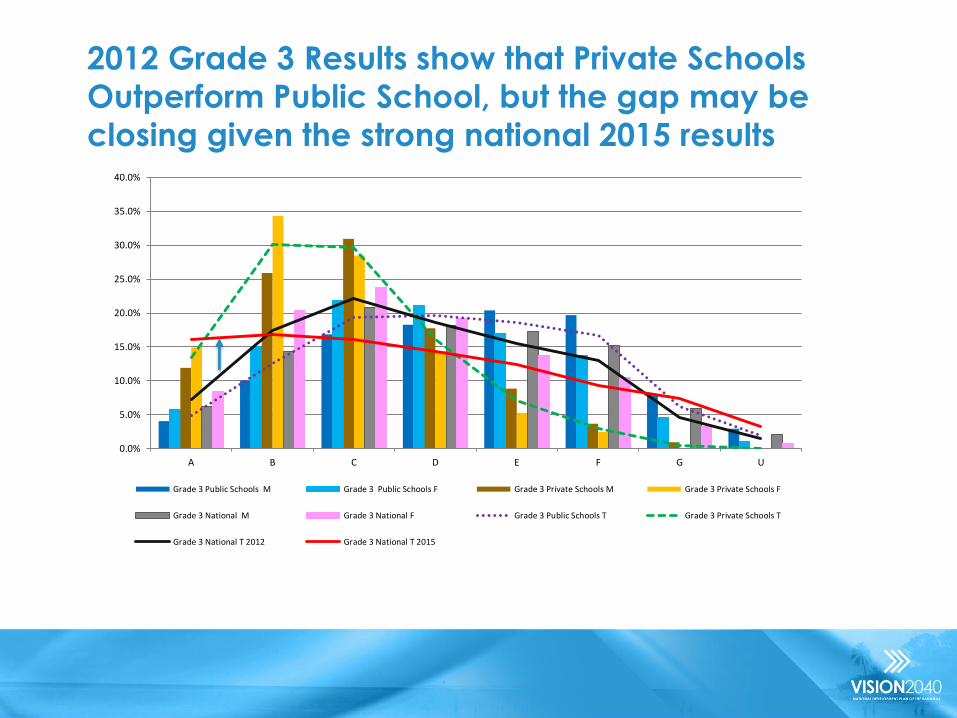
2012 Grade 3 Results show that Private Schools
Outperform Public School, but the gap may be
closing given the strong national 2015 results
0.0%
5.0%
10.0%
15.0%
20.0%
25.0%
30.0%
35.0%
40.0%
A B C D E F G U
Grade 3 Public Schools M Grade 3 Public Schools F Grade 3 Private Schools M Grade 3 Private Schools F
Grade 3 National M Grade 3 National F Grade 3 Public Schools T Grade 3 Private Schools T
Grade 3 National T 2012 Grade 3 National T 2015

Significant Improvements in English and
Math Results at the Grade 3 Level
2014 2015
0
200
400
600
800
1,000
1,200
1,400
A B C D E F G U
No
. of
Stu
den
ts
Grades
2014 GLAT G3
English Language F English Language M
Mathematics F Mathematics M
English Language Total Mathematics Total
0
200
400
600
800
1,000
1,200
A B C D E F G U
No
. of
Stu
den
ts
Grades
2015 GLAT G3
English Language F English Language M
Mathematics F Mathematics M
English Language Total Mathematics Total

2012 Grade 6 Results show that Private Schools Outperform Public School, but the gap may be
closing given the strong national 2015 results
0.0%
5.0%
10.0%
15.0%
20.0%
25.0%
30.0%
A B C D E F G U
Grade 6 Public Schools M Grade 6 Public Schools F Grade 6 Private Schools M
Grade 6 Private Schools F Grade 6 National M Grade 6 National F
Grade 6 Public Schools T Grade 6 Private Schools T Grade 6 National T 2012
Grade 6 National T 2015

Grade 6 GLAT Results Grade Distribution
for all Subjects 2014 and 15
0
500
1,000
1,500
2,000
2,500
0
100
200
300
400
500
600
700
800
A B C D E F G U
Tota
l M &
F s
tud
ents
Nu
mb
er o
f St
ud
ents
by
Sub
ject
2014 GLAT G6
English Language F English Language M Mathematics F Mathematics M Science F
Science M Social Studies F Social Studies M Total F Total M
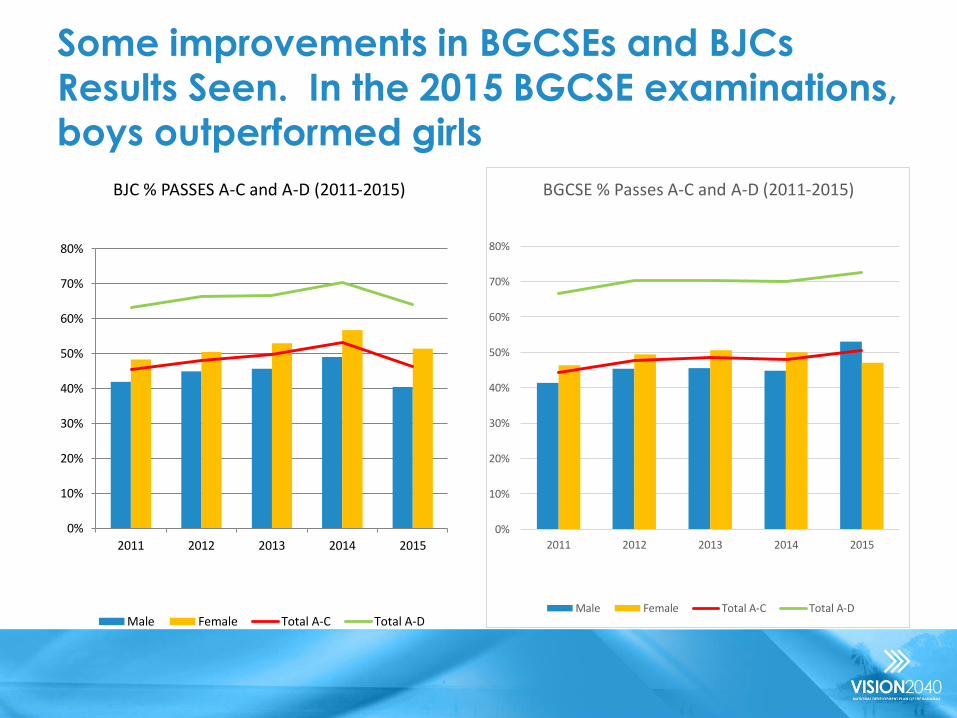
Some improvements in BGCSEs and BJCs Results Seen. In the 2015 BGCSE examinations,
boys outperformed girls
0%
10%
20%
30%
40%
50%
60%
70%
80%
2011 2012 2013 2014 2015
BJC % PASSES A-C and A-D (2011-2015)
Male Female Total A-C Total A-D
0%
10%
20%
30%
40%
50%
60%
70%
80%
2011 2012 2013 2014 2015
BGCSE % Passes A-C and A-D (2011-2015)
Male Female Total A-C Total A-D

2012 BJC Results with 2015 National
Line
0.0%
5.0%
10.0%
15.0%
20.0%
25.0%
30.0%
A B C D E F G U
BJC Public Schools M Public Schools F Private Schools M Private Schools F National M
National F Public Schools T Private Schools T National T 2012 National T 2015

2012 BGCSE Results with 2015
National Line
0.0%
5.0%
10.0%
15.0%
20.0%
25.0%
30.0%
35.0%
40.0%
A B C D E F G U
BGCSE Public Schools M Public Schools F Private Schools M Private Schools F
National M National F Public Schools T Private Schools T
National T 2012 National T 2015

Selected BGCSE Results (2005–14)
75
Subject 2005 2006 2007 2008 2009 2010 2011 2012 2013 2014
Art and Design B C+ C C+ C+ C+ C+ C B- C+ C+
Auto Mechanics D- D+ C- C- C C C C+ C- C-
Biology D- D- D- D- D- D- D- D- D- D-
Bookkeeping E E F+ E E- E- D- D E+ D
Carpentry/Joinery C+ C C+ C- B- C+ B- C C- C-
Chemistry C- C- C- C- C- C- C- C- C- C-
Clothing Construction C D+ D- D D D- D D+ D D+
Combined Science D D D+ D D D D+ C- D+ D+
Electrical Installation D+ C- C- D D+ D+ D- D+ D C-
English Language D D- D- D D D D D D D+
French D+ C- C- C- C- C- C- C C- C-
Literature D+ C- C- D+ C- C- C- C- C- C
Mathematics E E E E E- E- E- E+ E E
Music B- C+ C+ C+ C+ C C- C C+ B-
Physics C- C- C- C- C- C- C- C- C- C
Spanish C- C- C- C- C C- C C C C
Source: National Examination Confidential Report BGCSE 2014, MOEST

BJCs Average Grade By Subject 2012-14
Slight Improvements seen in English and Mathematics
Subjects
Years
Art
Cra
ft S
tud
y
Engl
ish
Lan
guag
e
Ge
ne
ral S
cie
nce
He
alth
Sci
en
ce
Fam
ily a
nd
Co
nsu
me
r Sc
ien
ce
Mat
he
mat
ics
Re
ligio
us
Stu
die
s
Soci
al S
tud
ies
Tech
nic
al D
raw
ing
2012 C C- D+ D- D+ C- D- D C- C+
2013 C C C- D D C- E+ D- C- C+
2014 C C C- D D C- D+ D C- C+

Gross Tertiary Enrollment Rates are Falling - Many
School Leavers are not Equipped for Higher Education
77

Government Expenditure on Education has been Growing – Impact on Results Unsure
78
Fiscal Years
Education Expenditure
As A Percentage of GDP, 2002- 2013
01-'02 02-'03 2.6% 03-'04 2.9% 04-'05 3.1% 05-'06 3.0% 06-'07 3.6% 07-'08 3.7% 08-'09 4% 09-'10 4% 10-'11 3% 11-'12 4% 12-'13 3%
Table: __ Average (Government expenditure on education, total (% of GDP)) Countries 1990-
1999
2000-2009
2010-
Bahamas, The 2.8%
Antigua and Barbuda 3.2% 3.0%
Barbados 5.4% 5.5% 5.7%
Ireland 4.8% 4.8% 6.3%
Jamaica 4.1% 5.2% 6.3%
Mauritius 3.5% 3.7% 3.6%
Panama 4.4% 4.3% 3.3%
Singapore 3.4% 3.1%
St. Kitts and Nevis 3.8% 4.2%
Switzerland 5.2% 5.4% 5.3%
Trinidad and Tobago 3.2% 3.1%
United Kingdom 4.7% 5.2% 6.1%
United States 4.9% 5.3% 5.3%
High income: nonOECD 4% 4%
LAC (all income levels) 4% 4% 4%
World 4% 4% 5%
Source: World Bank Development Indicators

HEALTH AND WELLNESS

Health and Wellness
• The country can be proud of the health system. – Infant mortality is declining and life expectancy is up.
– Improvements, however, are needed in service delivery and access.
• Additionally, efforts are underway to ensure universal access to health care. – Key strategic incentives include the National Health
Service Strategic Plan 2010-2020 and the introduction of the National Health Insurance and the National Prescription Plan.
•

The Bahamas has high per capita
health care expenditure
Location Health Expenditure Per Capita (PPP) Rank
United States of America $ 8,845.00 1
Canada $ 4,610.00 10
United Kingdom $ 3,235.00 22
Singapore $ 3,215.00 23
Bahamas $ 1,703.00 40
Trinidad and Tobago $ 1,633.00 43
Barbados $ 1,407.00 52
Antigua and Barbuda $ 1,125.00 66
Grenada $ 693.00 92
Source 10: Henry J. Kaiser Foundation, http://kff.org/global-indicator/health-expenditure-per-capita/

While a Lot of Money is Spent on Healthcare,
the Outcomes are Less than Desired
82
http://kff.org/global-indicator/health-expenditure-per-capita/
$11,805
$-
$2,000
$4,000
$6,000
$8,000
$10,000
$12,000
$14,000
$16,000
$18,000
Consumer Credit Medical('000s)
2010 IV
2011 IV
2012 IV
2013 Dec
2014 Sept
Source: Central Bank of The Bahamas
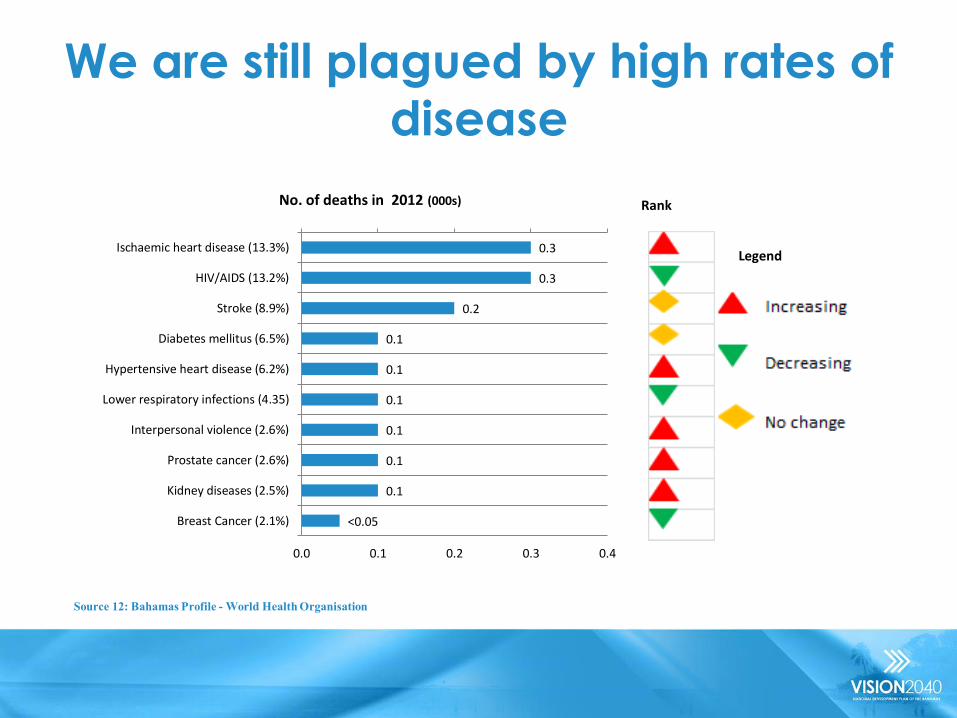
We are still plagued by high rates of
disease
0.3
0.3
0.2
0.1
0.1
0.1
0.1
0.1
0.1
<0.05
0.0 0.1 0.2 0.3 0.4
Ischaemic heart disease (13.3%)
HIV/AIDS (13.2%)
Stroke (8.9%)
Diabetes mellitus (6.5%)
Hypertensive heart disease (6.2%)
Lower respiratory infections (4.35)
Interpersonal violence (2.6%)
Prostate cancer (2.6%)
Kidney diseases (2.5%)
Breast Cancer (2.1%)
No. of deaths in 2012 (000s) Rank
Legend
Source 12: Bahamas Profile - World Health Organisation

Cardiovascular Diseases and Diabetes are the Chief Causes of Death in The Bahamas
84
Source: Bahamas Profile, WHO downloaded on 8th May, 2015 (http://www.who.int/gho/countries/bhs.pdf?ua=1)

We are not Reaping the Benefits of Our
Investment in Health
85 Extracted from Tandon et al (2000) WHO GPE Discussion Paper, No 30, “Measuring Overall Health System Performance for 191 Countries”
Bahamas ranked #94/191 (Green shaded)

Things are getting Better – Deaths from HIV/AIDS and
Communicable Diseases are Trending Downwards
Indicator 2009 2010 2011 2012 2013 2014
Mortality rate from communicable diseases*
93.6 73.8 75.1 65.8 62.0 63.4
Mortality rate from malignant neoplasms*
120.3 103.8 111.3 123.9 110.2 115.7
Mortality rate from external causes*
65.9 53.3 60.2 59.8 62.6 69.9
Mortality rate from diabetes mellitus*
38.5 34.0 32.3 29.8 27.5 26.2
Mortality rate from ischemic heart diseases*
43.3 38.2 51.5 60.9 50.2 56.2
Mortality rate from cerebrovascular diseases*
49.0 42.7 42.1 54.1 42.2 40.6
Tuberculosis incidence rate per 100,000
13.8 14.2 13.3 9.0 11.2 8.6
Malaria, reported cases 14 14 No data 1 6 6
AIDS incidence rate per 100,000 pop.
92.3 94.8 95.8 76.4 76.4 45.2
Proportion of low birthweight (<2,500 gm)
10.5 11.6 12.9 12.1 11.6 12.5

POVERTY

As a country we must face the issue of
Poverty
88
Poverty Rates and Percent of The Poor and Poverty Gap by Island group: 2001, 2013
2001 2013
Regions
Poverty Rate
Poverty Gap
Regions
Poverty Rate
Poverty Gap
New Providence & Grand Bahama 8.33 2.58 New Providence 12.58 3.32
Grand Bahama 9.69 1.45
Abaco, Eleuthera, & Andros 13.19 3.73 Abaco 20.32 5.75
Andros and Eleuthera 17.33 5.48
Exuma & Long Island 16.64 5 Exuma and Long Island 14.71 4.61
Other Family Islands 20.96 6.35 Other Family Islands 11.44 0.82

High Levels of Poverty Among the Youth
16.61
13.9
9.05
9.01
4.9
3.48
6.26
18.6 19.33
17.95
12.55
8.73 8.37
6.55
0
2
4
6
8
10
12
14
16
18
20
0-4 5-14 15-19 20-34 35-54 55-64 65 and older
Poverty Rates by Age Category
2001
2013

The Working Poor – 44.8% of the Poor are
Employed
90
Employment Status and Primary Employer Among Poor: 2001, 2013
Employment factor
2001 2013
% %
Employment status (15 years and older)
Employed 58.14 44.8
Unemployed 11.53 20.44
Outside labour force 30.34 34.75
Primary employer (15 years and older)
Government/Government corporation 15.73 8.62
Private enterprise 58.1 72.18
Private individual 15.2 4.74
Own account 10.97 14.47

Lower Education levels = Higher Poverty
91
Highest Levels of Education Competed and Highest Academic Exam Passed Poor and None Poor : 2001, 2013
Education level completed
2001 Education level completed
2013 Non-Poor Poor All Persons Non-Poor Poor All Persons
No Schooling 2.18 6.97 2.51 No Schooling 6.55 12.18 7.26 Preschool/Kindergarten 4.21 6.01 4.44 Primary School 11.43 21.8 12.16 Primary School 15.56 22.2 16.41 High School 65.45 68.6 65.67 High School 47.57 55.68 48.6 College /University 16.65 1.28 15.58 College/ University 18.71 1.1 16.46 Technical/Vocational 4.29 1.35 4.08 Technical/Vocational 6.93 1.71 6.27 Other 0.3 0 0.26 Not Stated 0.17 1.12 0.29 Qualification Non-Poor Poor All Persons Qualification Non-Poor Poor All Persons None 52.13 85.32 54.9 None 38.49 66.79 42.1 School Leaving certificate 6.83 4.21 6.61
School Leaving certificate 10.61 11.84 10.77
BJC, CXC Basix 15.36 7.37 14.69 BJC/PITMAN 1/ RSA/CXC 12.36 11.2 12.21
O Level, CXC General 12.39 2.33 11.55 GCE O Level/BGCSE/Pit 13.39 6.06 12.45 A level, Associate 4.51 0.41 4.16 GCE A Level / RSA 3/ 1.31 0.4 1.19 Degree or Certificate 6.16 0.78 5.47 Bachelor 3.61 0 3.31 Degree at Bachelor's 6.86 0.29 6.03 Other degree 5.17 0.37 4.77 Degree above Bachelor 2.87 0 2.5 Professional Certificate 1.29 0 1.12 Other Trade Certificate 6.36 1.25 5.71 Not Stated 0.31 1.38 0.45 SOURCE: The Department of Statistics

Single Parenthood and Poverty
0.00%
5.00%
10.00%
15.00%
20.00%
25.00%
10-14' 14-19' 20-25 25-29 30-34 35-39 40-44 45-49 50+ not stated
Single Married Widowed Divorced Not Stated
More than half of all births were to single mothers, with teenagers accounting for 13% of live births. A higher percentage of these single parent households were poor raising the spectre that the cycle of poverty will continue.

UNEMPLOYMENT

Unemployment Levels
Employment Unemployment Total Female Male Total Female Male
All Bahamas 74.4 71.0 78.1 15.7 17.3 14.1
Region
All Bahamas 84.6 83.1 86.0 15.4 16.9 14.0
New Providence 84.0 81.9 86.1 16.0 18.1 13.9
Grand Bahama 81.4 80.8 82.0 18.6 19.2 18.0
Family Islands 79.7 77.2 81.8 20.3 22.8 18.2
Employment by Region

Even with High Unemployment the Skills Gap Excludes
some of Job Seekers from Access to Available Jobs -
Inadequate Education is a Major Limitation
An inability to find suitably qualified labour was identified as a the single major obstacle to doing business in The Bahamas by firms of all sizes

Immigration Policy Should be In Line with Development Goals and National Needs
96
921
1,865
3,177
5,849
7,509
-
2,000
4,000
6,000
8,000
Misc Semi Skilled Professional Low Skill Technical
Cayman Work Permits Issued In 2013 (19K)
1,103
3,410 3,891
16,058
-
2,000
4,000
6,000
8,000
10,000
12,000
14,000
16,000
18,000
Misc Professional Technical Low Skills
Bahamas Work Permits Issued 2012-2014 (24K)

Governance
Pillar II
97

Bahamas has a number of Strong
Governance Institutions • Respected Constitution including key elements of Westminster
system
• Free elections with high voter turnout and peaceful transfers of power
• Independent judiciary
• Free media and civil society organizations
• Some important expressions of strategic direction are used (Party platforms, Speeches from the Throne, annual budgets, some major public policy papers)
• Most core elements of government machinery and processes are in place
• Budgetary management has improved, program-based budgeting & better procurement planned
• Basic financial reporting (income & expenditure) is full & timely, external audit robust & independent
• Anti-corruption legal regime meets Inter-American Convention Against Corruption standards
98
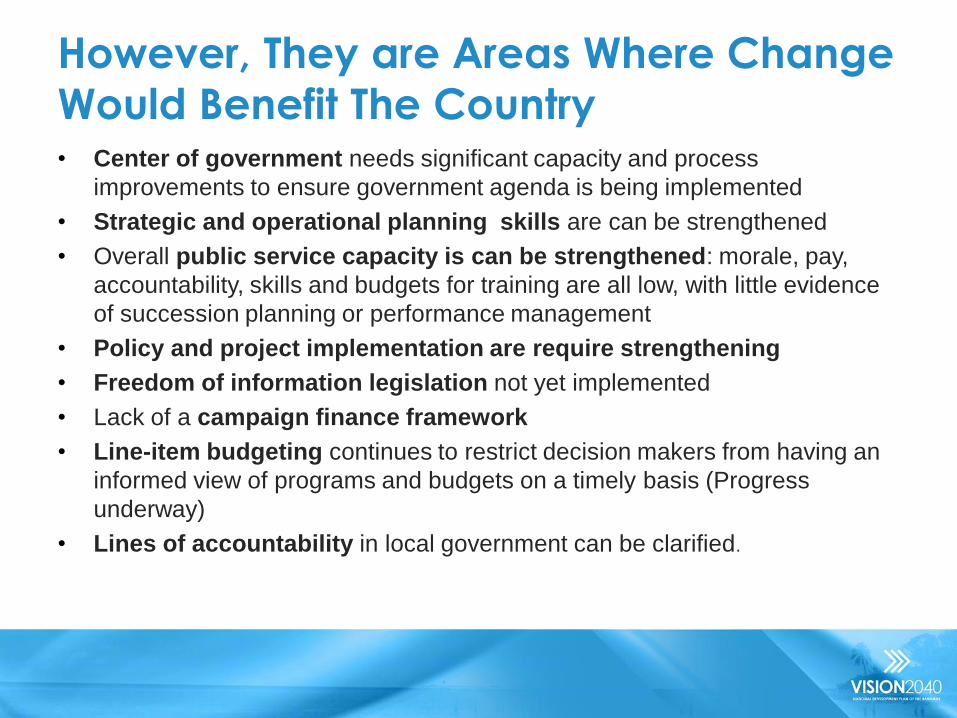
However, They are Areas Where Change
Would Benefit The Country
• Center of government needs significant capacity and process
improvements to ensure government agenda is being implemented
• Strategic and operational planning skills are can be strengthened
• Overall public service capacity is can be strengthened: morale, pay,
accountability, skills and budgets for training are all low, with little evidence
of succession planning or performance management
• Policy and project implementation are require strengthening
• Freedom of information legislation not yet implemented
• Lack of a campaign finance framework
• Line-item budgeting continues to restrict decision makers from having an
informed view of programs and budgets on a timely basis (Progress
underway)
• Lines of accountability in local government can be clarified.

Opportunities to Strengthen Governance
• Practice of engaging civil society is strengthening
• Public sector reform will provide a force multiplier for all initiatives of
Government:
– Strengthening of the Office of the PM to act as a coordinating unit for
government policy
– Investing in the Public Service including training for technical,
performance management and leadership skills
– Implementing strategic planning and results based programs
• Invest in the AG’s office and Freedom of Information legislation will
enhance the accountability of successive governments
• Ministerial reports will increase the level of transparency to citizens
• Addressing high profile policy issues (particularly crime) increases
the legitimacy of any Government
• Strengthen Roles and responsibilities of Government appointees to
Crown corporations
100

Potential Threats
• Where there is the absence of Accountability,
Transparency and Efficiency - leads to low levels of
trust among citizens
• High and growing public debt can limit government’s
ability to respond to emerging policy and program
needs
• Threats to Legitimacy from:
– Violent crimes and perceived lack of justice
– Social exclusion and a disparity between rich and
poor
– Jobs and education
– Eventually the effects of climate change
101

The Bahamas Scores High with Respect
to its Political and Civil Liberties
102
Freedom House Bahamas Political and Civil Liberties Ranking
Bahamas Score Available Points
Electoral Process 12 12
Political Pluralism and Participation 16 16
Functioning of Government 10 12
Political Rights Subtotal 38 40
Freedom of Expression and Belief 16 16
Organisational Rights 12 12
Rule of Law 15 16
Personal Autonomy and Individual Rights
15 16
Civil Liberties Subtotal 58 60
Freedom Score 96 100

There is a Healthy Tradition of Political
Engagement
103
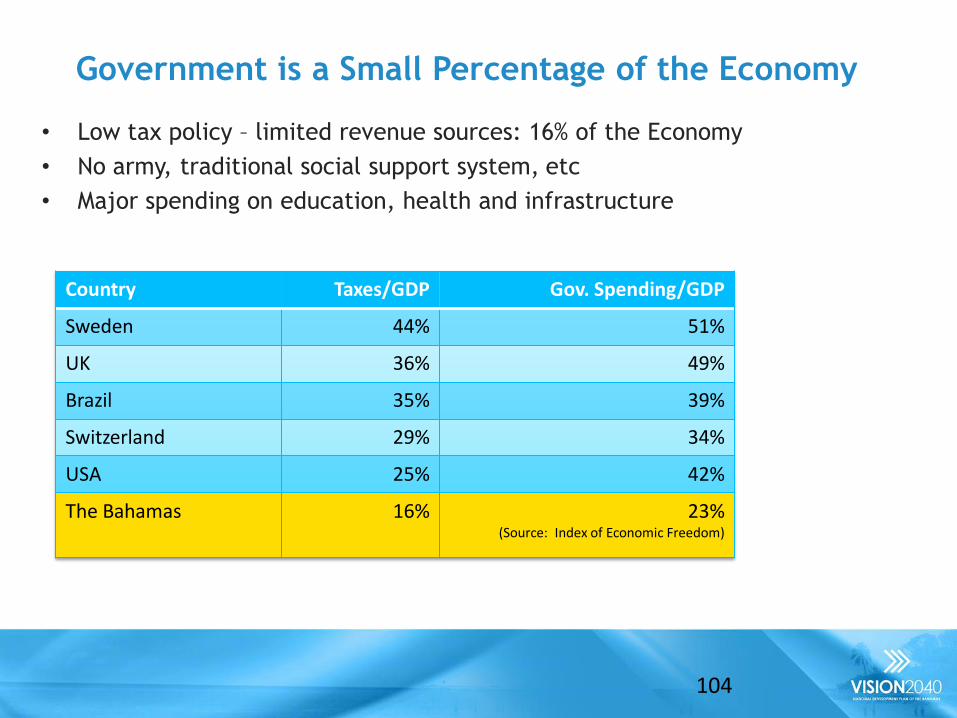
Government is a Small Percentage of the Economy
• Low tax policy – limited revenue sources: 16% of the Economy
• No army, traditional social support system, etc
• Major spending on education, health and infrastructure
Country Taxes/GDP Gov. Spending/GDP
Sweden 44% 51%
UK 36% 49%
Brazil 35% 39%
Switzerland 29% 34%
USA 25% 42%
The Bahamas 16% 23% (Source: Index of Economic Freedom)
104

The Public Service at 20% of the workforce is Right-Sized. It is similar to the size of Government in OECD countries – The Issue may be one of Composition
105
EMPLOYED PERSONS BY EMPLOYMENT STATUS: 2015
Employment Status Total
N %
Employee (Gov. or Gov. Corp)
36,510 19.9
Employee (Private Business)
118,770 64.8
Self Employed 27,525 15.0
Unpaid Family Worker 370 0.2
Not Stated 740 0.4
Total 183,319 100.0
28%
21% 23%
40%
72%
79% 77%
60%
0%
20%
40%
60%
80%
100%
Total (54) OCDE Countries(15)
DevelopingCountries (25)
Countries intransition(14)
Public
Private
In brackets the number of countries considered. Source: Survey on public sector employment statistics, Bureau of Statistics, ILO, October 1998.
Source: Department of Statistics
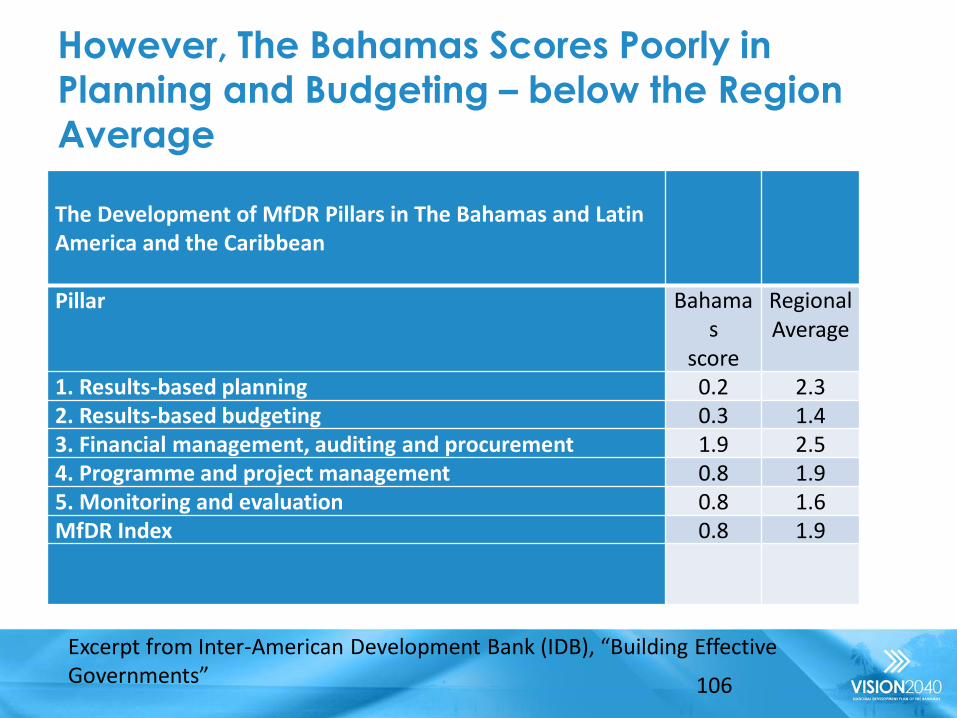
However, The Bahamas Scores Poorly in Planning and Budgeting – below the Region Average
106
Excerpt from Inter-American Development Bank (IDB), “Building Effective Governments”
The Development of MfDR Pillars in The Bahamas and Latin America and the Caribbean Pillar Bahama
s score
Regional Average
1. Results-based planning 0.2 2.3
2. Results-based budgeting 0.3 1.4
3. Financial management, auditing and procurement 1.9 2.5
4. Programme and project management 0.8 1.9
5. Monitoring and evaluation 0.8 1.6
MfDR Index 0.8 1.9
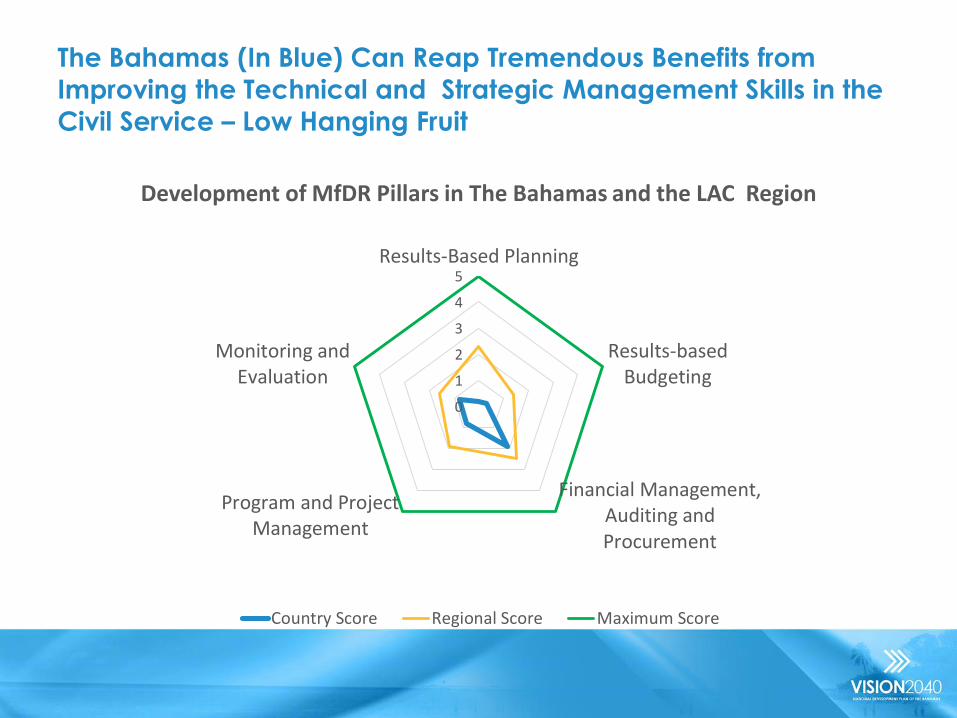
The Bahamas (In Blue) Can Reap Tremendous Benefits from
Improving the Technical and Strategic Management Skills in the
Civil Service – Low Hanging Fruit
0
1
2
3
4
5Results-Based Planning
Results-basedBudgeting
Financial Management,Auditing andProcurement
Program and ProjectManagement
Monitoring andEvaluation
Development of MfDR Pillars in The Bahamas and the LAC Region
Country Score Regional Score Maximum Score

An overview of the Public Service by Job Category
108
3,469
4,666 5,160
275
951
390 113 142 129
1,242
465 151 200
0
1000
2000
3000
4000
5000
6000
Number of Employees by Category
Managerial Positions
All Others
Managerial

The Composition of the Public Service Managerial
cadre compared to other Countries
0
5
10
15
20
25
30
BahamasCanada NewZealand
SouthAustralia
NewSouthWales
%ofPublicServiceinManagerialPosi on
109

Key Strategic Goal is the Strengthening of the
Centre of Government to Improve Effectiveness
110

Graft Index
Enterprise Surveys – Bahamas Country Profile http://www.enterprisesurveys.org/
CRIME AND CRIMINALITY

The High Level of Criminality limits the
Growth Potential
• Disaggregated crime data show that there have been continuous increases in the most violent crimes: murder, armed robbery and rape. The murder rate, for example, has more than doubled in the last 10 years. In 2013 the homicide rate was 31.5 per 100,000 people (higher than the average homicide rate for the Caribbean region: 20 per 100,000 inhabitants).
• In 2013, an important portion of murder victims were young (37% under age 25), males (87%), killed with a firearm (82%), due to unresolved conflicts (14%), domestic violence (14%), robbery (20%) and retaliation (33%).
• Armed robberies have increased by 54% in the last decade (from 663 in 2004 to 1022 in 2013) and robberies have increased 81% (from 199 in 2004 to 361 in 2013).
113 Source: Extracted from IDB

Things are Improving – Instances of
Crime (other than murder) Fell
114
Crime Statistics 2011-2014
2012 % chge 2013 % chge 2014 % chge Crimes Against Persons Murder 111 -13 119 7 123 3 Attempted Murder 19 58 15 -21 22 47 Manslaughter 1 0 4 300 3 -25 Rape 97 -9 105 8 75 -29 Attempted Rape 12 -57 22 83 12 -45 Unlawful Sexual Intercourse 167 -7 165 -1 111 -33 Armed Robbery 1,099 10 1,022 -7 920 -10 Robbery 361 -2 365 1 350 -4 Attempted Robbery 31 -28 30 -3 31 3 Sub-total 1,898 1,847 -3 1,647 Crime Against Property Burglary 309 -9 275 -11 188 -32 Housebreaking 2,875 -11 2,265 -21 1,756 -22 Shop-breaking 971 3 912 -6 785 -14 Stealing 1,909 -2 1,952 2 1,558 -20 Stealing from Vehicle 2,284 -8 2,465 8 2,066 -16 Stolen Vehicle 1,332 0 1,157 -13 879 -24 Sub-total 9,680 -7 9,026 4 7,232 Total 11,578 10,873 8,879
SOURCE:- Fielding "Crime and Criminal Justice in The Bahamas" RBPF statistics for 2013-2014; US Department of State "Crime and Safety Report" for 2011-2012

The Criminal Justice System is Strained
• Limited capacity of judicial institutions to address crime: Since 2008, The Bahamas has shown declining values for the World Governance Indicator (2012) related to the Rule of Law.
– The justice system’s inefficient management systems results in substantial backlog of cases. Preliminary inquiries or trials in the Supreme Court can last over a year leading to a large number of inmates awaiting trial (42% in 2013 according to the International Centre for Prison Studies).
– In 2013, the incarceration rate was 379 per 100,000. Overcrowding was attributed to the large number of petty criminals and the backlog in processing at the remand center.
– During the period of 2005-2009 only 5.1% of murder cases resulted in convictions. More recently, In 2013, 127 cases were tried resulting in 62 convictions, 54 not guilty verdicts and 25 dismissals.
– The Swift Justice program, within the Office of the Attorney General should be strengthened to address the long backlog, the efficiency of the Court Reporting Unit and access to justice in high crime areas.
115
Source: Extracted from IDB
Source: Extracted from IDB http://idbdocs.iadb.org/wsdocs/getdocument.aspx?docnum=39213074

However, 60% of Firms Believe that the Courts Are Fair, Impartial and Uncorrupted
0 10 20 30 40 50 60 70
The Bahamas
LAC
HI: Non OECD
Percent of Crime
Perceptions about the Courts

The SWIFT Justice Programme is Reaping
Benefits – Falling Service Times
0
50
100
150
200
250
300
350
Pre Oct 2012
Oct to April 2013
April 2013 to April
2014 2014
2015
344
198
127
78 80
VBI - Year To Date December 2015 Average Time to Service
Source: Office of The Attorney General

Matters Resolved Increased by 93.2%
between 2012 and 2015
0
50
100
150
200
250
2012 Annualized
2013 Actual
2014 Actual
2015 Actual
118 127
200
228
Source: Office of The Attorney General
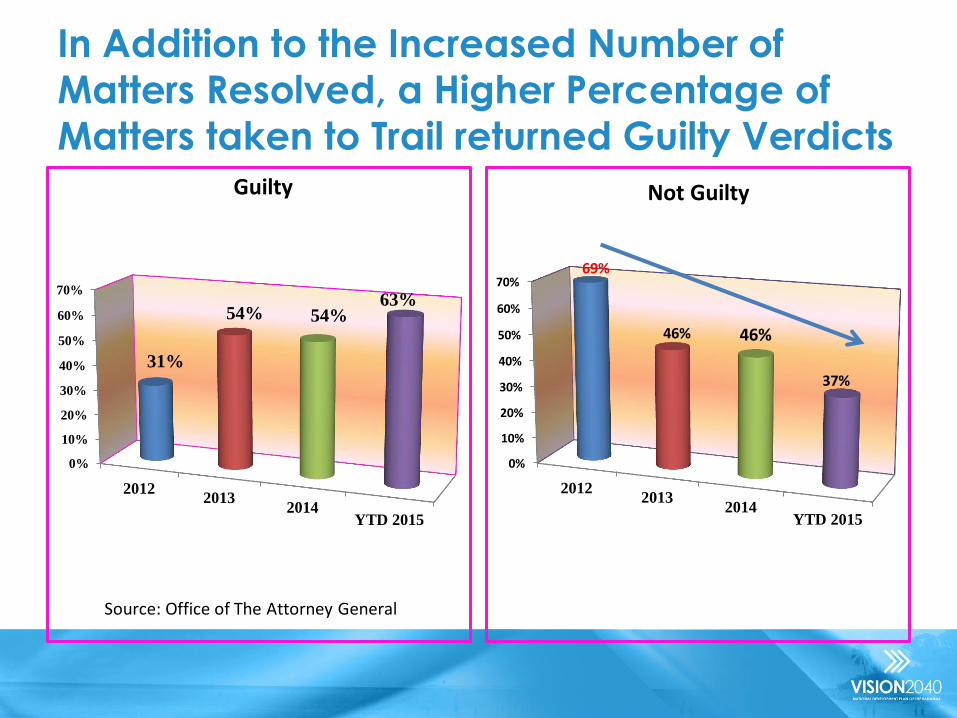
In Addition to the Increased Number of Matters Resolved, a Higher Percentage of
Matters taken to Trail returned Guilty Verdicts
0%
10%
20%
30%
40%
50%
60%
70%
20122013
2014YTD 2015
31%
54% 54% 63%
Guilty
Source: Office of The Attorney General
0%
10%
20%
30%
40%
50%
60%
70%
20122013
2014YTD 2015
69%
46% 46%
37%
Not Guilty

Trials Types Year to Date (December 2015)
Offence Offence Type Trials Guilty Not Guilty Mistrial Nolle
106 Armed Robbery 25 20 14 10
79
Armed Robbery - Attempted - Receiving - Burglary- Causing Harm
- Other Serious Offence 16 16 6 4 8
4 Arson
205 Murder - Attempted Murder -
Manslaughter - Abetment 58 42 27 7 13
22
Possession Of A Firearm - Possession Whilst Committing
Another Offence 5 1 7 2
45 Rape - Attempted Rape - Attempted Rape or Rape With Another Offence
16 15 5 5
6 Stealing - Fraud - Related 1 3
61 Unlawful Sexual Intercourse - Incest 20 12 6 9
528 Grand 141 109 65 11 47

The Breakdown of the Family, Poverty and
Drugs and the Main Causes of Crime
121
0
5
10
15
20
25
30
35
40
45
50Main Root Cause of Crime Percentages by Gender
Male Female
SOURCE:- Fielding "Crime and Criminal Justice in The Bahamas" ," National Crime Commission 1998. Survey of Crime in The Bahamas"

The Youth are Disproportionately
Affected by Crime
• Most homicide victims are in the 18-25 age group: 32% of murder victims in 2013; followed by the category of 26-35 year-olds with 30% of cases. (RBPF)
• In 2013, 54% of the prison population (sentenced and on remand) were between the ages of 14 and 30. This evidence suggests that interventions should target both youth and young adults. (Ministry of National Security (MNS)
• Small gangs are becoming an increasing concern in the country. Estimates of the number of youth involved in gangs range from 6,000 to 10,000. Many suburban communities are now experiencing increased gang-related crimes and violence. Around 50 different gangs have been identified as operating in the Bahamas varying in size, structure, membership and involvement with illegal activities.
122
Source: Extracted from IDB
Source: Extracted from IDB http://idbdocs.iadb.org/wsdocs/getdocument.aspx?docnum=39213074

While Most Crime Victims are Men, Violence
Against Women (VAW) is Also a Concern
• Both domestic violence and rape disproportionally affect women and are highly underreported. In 2013, 14% of all homicides were related to domestic violence.
• Non-Fatal domestic violence was responsible for 28% of all assaults reported to the police in 2010-2013 and reported rapes have increased 17% since 2004.
• Average rape rate over the last five years (2009-2013) as 28.2 per 100,000, which is above the high Caribbean regional average.
• Emergency Room data show that treated cases of rape were nearly 1.5 times higher than those registered with the police in 2013, suggesting that the problem is likely larger than what is captured by administrative data.
123 Source: Extracted from IDB http://idbdocs.iadb.org/wsdocs/getdocument.aspx?docnum=39213074

Unemployment and Youth At Risk
• Research and evidence show that a lack of attachment to school and the workplace during adolescence and adulthood contribute to the prevalence of youth violence.
• Youth unemployment (age 15-24) has doubled from 14.9% in 2001 to 32.3% in 2013 (three times larger than the rate of adult unemployment).
• Idle young people (not in employment, education, or training), are particularly vulnerable to continued labor detachment which may contribute to violent or antisocial behavior. Searching for jobs can be a discouraging process as more than 50% of youth remain unemployed for more than a year.
• The employability of youth hinges critically on the level of education and skills. Even though most students complete secondary education, only half of them graduate.
• Although there are not available measures of skill level of unemployed youth, most employers report difficulties in recruiting job candidates because of insufficient specific skills (66%), soft skills (24%) and numeracy skills (12%).
124 Source: Extracted from IDB http://idbdocs.iadb.org/wsdocs/getdocument.aspx?docnum=39213074
The Environment (Built and
Natural) Pillar III
125

Infrastructure and Environment: Key Issues • Power rates are among the highest in the region due to a number of factors:
– importing petroleum-based fuel to produce most of its electricity (cost + 11% of GDP,) – aging infrastructure leading to lost revenues (system losses,) – low bill payment rates, and – large staff complement compared to peer utilities in the region.
• The Bahamas is one of the top ten most vulnerable nations in the world to the impacts of climate
• Roads are generally in good condition. However, the road network in New Providence is hindered by a lack of room to expand, and traffic is often congested and chaotic.
• The lack of reliable public transit, including a school bus system, worsens the problem as people rely on their own vehicles.
• Archipelago nation leads to high per capita infrastructure costs (60 plus airports and 28 entry points as an example.)
• The water and sanitation infrastructure also faces significant problems. Years of inadequate maintenance have left the system with an extremely high water loss rate, currently about 56%.
126

Natural Environment: Strengths and Weaknesses
STRENGTHS
• Spectacular natural setting and climate that drives tourism and provides a unique lifestyle for citizens
• Plant, wildlife, and marine ecosystem that provides nourishment for citizens and supports tourism
• Signatories to a number of international treaties and domestic laws to protect ecosystem
• Strong disaster awareness and response protocols
• High levels of biodiversity including unique wildlife
• Rising awareness and action within government to protect the environment
• The advocacy role played by the BEST Commission
127
WEAKNESSES
• Large project development and urban living have led to degradation of the environment
• Lack of data collection processes to monitor the natural environment
• Enforcement of treaties and legislation
• Lack of an overall encompassing legislation (including land use planning and development guidelines) to ensure the protection of natural resources in the future generations
• The coming effects of climate change are not well understood by the public
• Fires from dump sites create air-borne health hazards

Natural Environment: Opportunities/ Threats
OPPORTUNITIES
• Access to international information and
funding to study, monitor, evaluate and
protect the natural environment
• Bahamas Agricultural and Marine Studies
Institute may become not only a national
success, but a regional success
• Improving and enforcing laws and policies to
protect the environment will also provide
benefits to human health and the economy
• Healthy levels of biodiversity may lead to
additional pharmaceutical research
• Undeveloped family islands continue to offer
FDI and eco-tourism opportunities
• Alternative energy technologies are
becoming more cost effective and safer for
the environment
THREATS • The Bahamas is listed as one of the top 10
nations to be affected by climate change (intensity of storms including hurricanes, rising seawater, uninhabitable land, migration, loss of certain species)
• Mitigating climate change will consume a greater share of the budget (infrastructure)
• Less than 20% of the population is connected to central sewage systems risking human health
• Non-lined dump sites create leachate contaminating water tables and land
• Continued coastal development (erosion and overuse of natural lands and marine)
• Importing of fuel including bunker C for electricity creates risks of leakage
128

STRENGHTS
• Significant built infrastructure given the population and archipelago
• New investments in water systems via IDB loan has already started to pay dividends for the WSC
• New public infrastructure in the form of roads and ports
• New and modern terminals at Airport has provided increased passenger capacity for the foreseeable future
• The Government is exploring options to address the shortcomings of electricity generation and distribution.
WEAKNESSES
• Power rates and the number of power outages remains a source of concern
• Connecting to a drinking water system is limited
• Water losses is at high levels and low utilization of sewage system
• Traffic congestion in Nassau is problematic
• Public transit requires a new governance model and investment
• Diversifying the economy may require public investments as well as FDI – Use of PPPs
• Solid waste management requires new regulations and investments
• There is limited capital planning and no consolidated database of infrastructure assets, condition, maintenance and priority
Infrastructure: Strengths and Weaknesses

OPPORTUNITIES
• Structural changes to the management and/or ownership of BEC provides an opportunity for an injection of capital and new processes
• International fuel prices are lower, providing some relief for ratepayers
• FDI and development bank interest in infrastructure will continue to be available as the world economy strengthens
• The development of a capital planning process within government enables decision makers to prioritize investments across ministries and sectors
• Enhanced maintenance regimes will enable an extension of the lifecycle of public infrastructure
• Public support for improvements to the landfill, BEC and public transit is high,
• Alternative energy technologies are becoming more cost effective
THREATS
• Public finances are not conducive to a large infrastructure renewal program.
• The cost to rehabilitate the transmission and distribution system and add new generation capacity is steep without private investors
• Climate change will likely lead to higher sea levels as well as severe storms and hurricanes. This will have a direct effect on infrastructure
Infrastructure: Opportunities and Threats
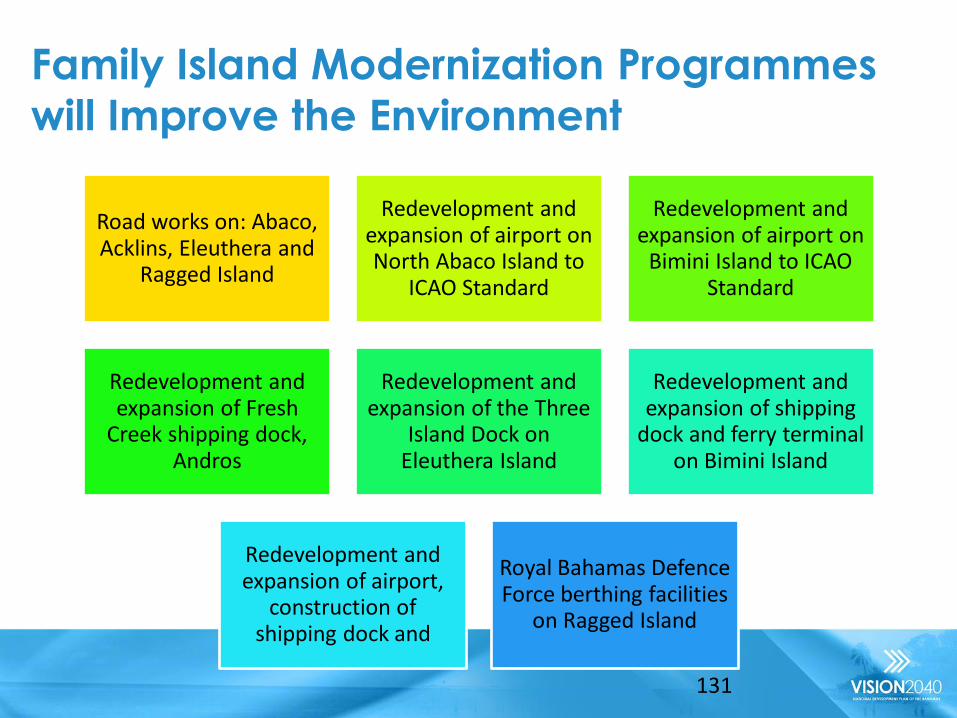
Family Island Modernization Programmes
will Improve the Environment
Road works on: Abaco, Acklins, Eleuthera and
Ragged Island
Redevelopment and expansion of airport on North Abaco Island to
ICAO Standard
Redevelopment and expansion of airport on
Bimini Island to ICAO Standard
Redevelopment and expansion of Fresh
Creek shipping dock, Andros
Redevelopment and expansion of the Three
Island Dock on Eleuthera Island
Redevelopment and expansion of shipping
dock and ferry terminal on Bimini Island
Redevelopment and expansion of airport,
construction of shipping dock and
Royal Bahamas Defence Force berthing facilities
on Ragged Island
131

New Providence and Family Island Transformation and Modernization Programmes
$210 million – public private partnership arrangement of
Bahamas Telecommunications Company (BTC): Cable and
Wireless and Bahamas Government
$400 million – Lynden Pindling International Airport Re-
development and Expansion Project
$290 million – New Providence Road Enhancement Project –
improvement and construction of 24.6 miles of roads in 19
corridors
$12 million – Nassau Straw Market and Urban Park –
to replace destroyed historical centre
$44.2 million – Nassau Harbour Dredging and Widening Project – to
accommodate larger cruise ships
$17 million – public private partnership arrangement of Arawak Port Development Company – construction of shipping/port facilities from
Downtown Nassau to Arawak Cay
$30 million – construction of Thomas
A. Robinson National Stadium
$72 million – Airport Gateway Project- construction of
expanded roadway
$52 million – construction of Critical Care Wing at the
Government-owned Princess Margaret Hospital
132

Infrastructure - Energy is a Key Driver of Growth
and Development – The Situation Today
• The commitment to bring electricity to every corner of The Bahamas
– unified tariff system
• Dependent on imported fossil fuels to meet energy needs.
– Dependent on global oil prices
– Continued price uncertainty given global trends
– Balance of payments impacts
• High cost of fuel per kilowatt-hour sold
– High energy costs results in
• Uncompetitive business environment
• Reduces disposable household income
• Serious impact of current technology on the environment
– The need for renewable sources given issues of Climate Change
The Energy Situation Today Cont’d
• Reliability also appears to be an issue
– forces many businesses and households to operate their own generators
• Management issues:
– High system losses,
– Maintenance issues
– High delinquency rates
• There are few energy conservation measures
– Power consumption can be reduced by as much as 25 per cent through more effective conservation and efficiency measures.
– Some progress in the business sector
– Needs national standards for efficiency

Improvement at BEC = Growth Potential
for The Bahamas
135
Compared to its peers in the Caribbean, BEC has:
Higher system losses 17% versus 10%
Higher energy costs 44c per kWh versus 33c
Lower generational load 60% versus 71%
Higher customer complaints 109 per 1000 customers versus 51 per 1000
BEC Fast Facts
438 MW 100,000 customers
Valued at approximately $500 – $520 million
29 generation stations

BEC Systems Losses and Staff
Efficiency
Extracted from IDB’s presentation at the Bahamas Energy Security Forum, December 2015

BEC Profitability
Source: Extracted from IDB’s presentation at the Bahamas Energy Security
Forum, December 2015
A Bold National Energy Policy to
Increase Energy Efficiency and Security
1. Ensure the security of energy supply through diversification of fuels;
2. Modernise the country’s energy infrastructure;
3. Utilisation of renewable energy sources such as solar, ocean energy, biofuels, waste-to-energy and wind;
4. Increased focus on energy conservation and efficiency;
5. Develop a comprehensive governance/regulatory framework to effectively support the advancement of the energy sector; and
6. Seek eco-efficiency in the manufacturing, agricultural and tourism sectors and government as leaders in energy conservation and the use of renewable energy .

The Discussion Needs be about the pathway to action
through an Evaluation of Priorities
Diversification of fuels
Comprehensive governance/regulatory framework to facilitate
the introduction of renewables and the
diversification of fuels
Modernizing the country’s
energy infrastructure;
Eco-efficiency and conservation and alternatives in the
manufacturing, agricultural and tourism
sectors
Cost
Imp
act
Development of renewable
energy sources
Energy conservation and efficiency

Access to Clean Safe Water Critical:
High Usage of Well Water which is
Vulnerable to Intrusion
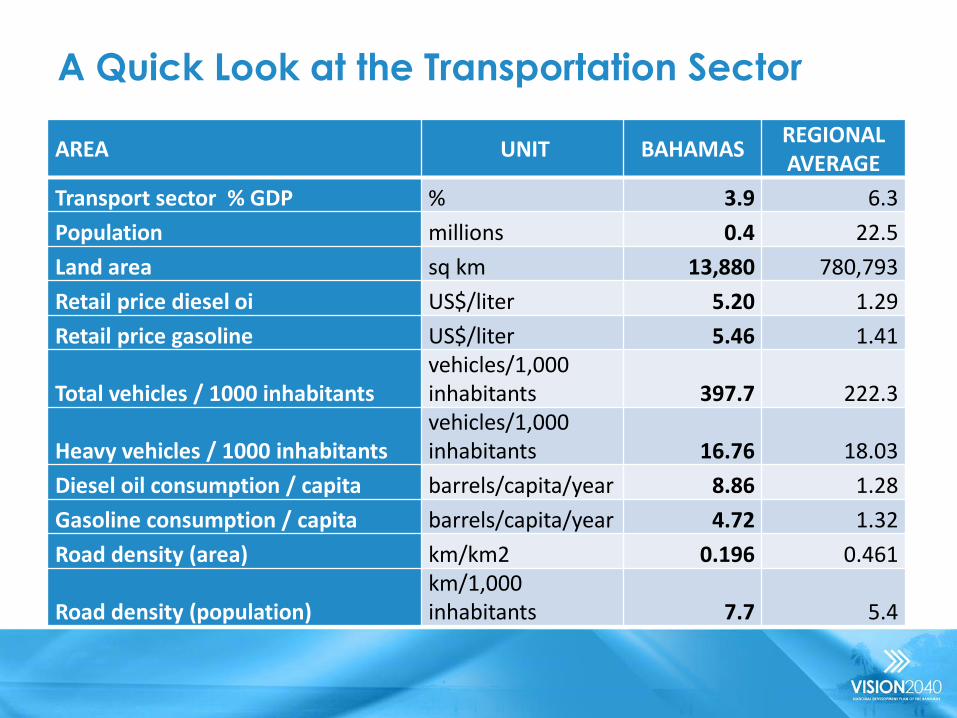
A Quick Look at the Transportation Sector
AREA UNIT BAHAMAS REGIONAL AVERAGE
Transport sector % GDP % 3.9 6.3
Population millions 0.4 22.5
Land area sq km 13,880 780,793
Retail price diesel oi US$/liter 5.20 1.29
Retail price gasoline US$/liter 5.46 1.41
Total vehicles / 1000 inhabitants vehicles/1,000 inhabitants 397.7 222.3
Heavy vehicles / 1000 inhabitants vehicles/1,000 inhabitants 16.76 18.03
Diesel oil consumption / capita barrels/capita/year 8.86 1.28
Gasoline consumption / capita barrels/capita/year 4.72 1.32
Road density (area) km/km2 0.196 0.461
Road density (population) km/1,000 inhabitants 7.7 5.4

Lots of Cars on the Roads…..In part
due to concerns over public transit
142

Internet Penetration is High
143
91.3%
57.1%
0.0%
20.0%
40.0%
60.0%
80.0%
100.0%
% Population (Pentration) % Facebook penetration

The Bahamas’ Ranking
(Broadband Prices)
Indicators Data for The Bahamas
Country Ranking
Broadband Internet prices (fixed) USD$ 29.99/Mbps PPP$ 26.37/Mbps
56th in the World 2nd in the Caribbean
Mobile post-paid broadband price, as a % of GNI p.c.
0.89 39th in the World 1st in the Caribbean
Mobile prepaid broadband price, as a % of GNI p.c.
1.11 53rd in the World 1st in the Caribbean
ICT Price Basket (IPB) – All Services 1.2 48th in the World 2nd in the Caribbean
Source: ITU, 2015. Measuring the Information Society Report.
[1] Includes fixed and mobile telephony.
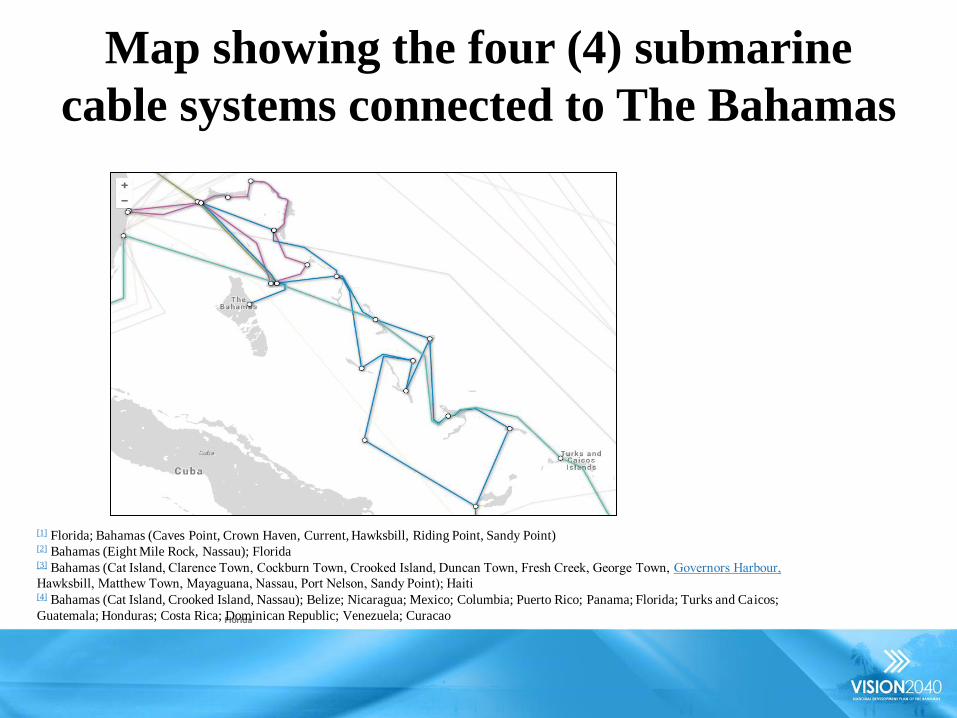
Map showing the four (4) submarine
cable systems connected to The Bahamas
Florida
[1] Florida; Bahamas (Caves Point, Crown Haven, Current, Hawksbill, Riding Point, Sandy Point) [2] Bahamas (Eight Mile Rock, Nassau); Florida [3] Bahamas (Cat Island, Clarence Town, Cockburn Town, Crooked Island, Duncan Town, Fresh Creek, George Town, Governors Harbour,
Hawksbill, Matthew Town, Mayaguana, Nassau, Port Nelson, Sandy Point); Haiti [4] Bahamas (Cat Island, Crooked Island, Nassau); Belize; Nicaragua; Mexico; Columbia; Puerto Rico; Panama; Florida; Turks and Caicos;
Guatemala; Honduras; Costa Rica; Dominican Republic; Venezuela; Curacao

The Economy
Pillar IV
146

Pillar IV: Economy • The Bahamas is one of the most advanced economies in the Caribbean
– tourism which is heavily reliant on the US Market; and
– financial services.
• The industrial sector, agriculture and fisheries and manufacturing only form a marginal part of the economy.
• The economy is susceptible to climate change and other natural disasters.
• The relatively small population is an inherent inhibitor of building a critical mass for businesses and growth strategies.
• The country’s tax base is narrow and largely dependant on tourism and trade: exacerbating the government’s capacity to fund essential services.
• Recent years has seen negative growth which has yielded critical socioeconomic consequences.
147

STRENGTHS
• Strategic Location: next to the USA
• Natural resources: land and water resources associated with a tropical archipelago
• Excellent deep water port (Freeport) with room for expansion – able to service superpanamex ships, and fourth largest oil terminal for transshipment in the world
• Recent foreign investment in tourism.
• Low Tax Regime
• Recent infrastructure improvements, including:
• Expanded and improved Lynden Pindling Airport;
• New roads on New Providence;
• New water pipes and fresh water production plants built
• Progressive action to restructure the financial sector;
• Market recognition in tourism and financial services
WEAKNESSES
• Vulnerable - suffering downturn, sluggish growth subject to external shocks)
• Large and widening trade deficit • High levels of unemployment and
poverty • Low levels of productivity • Dramatic rise in crime and violence • Poor educational attainment • Public sector fiscal positions (high
current deficits, growing debt, rising GDP to debt ratio
• Challenging geographic configuration • Relative high costs of living and high
costs of dong business • Infrastructure deficiencies (water
supply experiences high technical and commercial losses; poor reliability of electricity and high electricity costs
S W
The Economy: A SWOT Analysis
148

149
OPPORTUNITIES
• Recognized business opportunities: • Diversification within the
tourism sector based on product development
• Strengthening of the financial services sector
• New sectors (marine industries, logistics, agro-industries, call centres; bio farming the sea)
•New University – Expansion of the College of The Bahamas – skill upgrading programmes
•Development land available across the country
•Widening of Panama Canal (may lead to strengthening of transshipment and logistics activities in The Bahamas)
•Leveraging the skills and investments of the Bahamian diaspora
T O THREATS
•Capabilities of Government and governance issues (necessary improvements to transparency, accountability, government efficiencies and public sector reforms)
•Crime and security problems intensify
•Failure to continue to reform government finances
•Energy, transportation and utilities infrastructure not improved
•Climate Change adaptation not addressed
•Economic diversification/ strengthening not achieved
The Economy

High Human Development Index In
Spite of Falling GDP Per Capita
150
Source: Statistics from The World Bank, UNDP

An Economy Strongly Linked to the US with Growing
Levels of Government Debt as Government Seeks to
Reduce the Impact of the 2008 Crisis
151
Graph 1: Bahamas and United States GDP growth
correlation, by lustrum, 1961-2013
Source: Statistics from the World Bank

Widening Fiscal Deficit and Increased Debt Levels Challenge Government’s Ability to
Provide Services
-1.9%
-4.6% -4.5% -4.8% -5.8%
-6.9% -6.1%
-4.8%
17.6% 16.8% 17.2%
18.7% 18.7%
17.2% 18.4%
21.3% 19.5%
21.4% 21.7%
23.5% 24.6% 24.1% 24.4%
26.1%
-10.0%
-5.0%
0.0%
5.0%
10.0%
15.0%
20.0%
25.0%
30.0%
FY200708 FY2008/09 FY2009/10 FY2010/11 FY2011/12 FY2012/13 FY2013/14 FY2014/15
% o
f G
DP
Deficit % of GDP Revenue % of GDP Expenditure % of GDP

Low Savings Rate; Growth Funded
Mainly by FDI
Need to increase savings to fund investment in the economy
0
5
10
15
20
25
30
1996 2001 2006 2011
% o
f G
DP
Years Foreign direct investment, net inflows (% of GDP)
Gross domestic savings (% of GDP)
Linear (Gross domestic savings (% of GDP))

The Bahamas is very Successful at Attracting FDI but it is Not Utilized as Effectively as Possible
154

Recent Investments
$3.4 billion – BAHA MAR Hotel, Casino and Golf Resort project – largest single phase development in the western hemisphere, New Providence
$140 million – Albany Resort expansion project
- to include medical facilities
$200 million – Resorts World Bimini
Bay project, Bimini
$90 million – Club Med Hotel Resort,
San Salvador
$30 million – The Cove, Eleuthera
$1.4 billion – Bakers Bay Golf and Ocean Club
Sunwing Memories Grand
Bahama Beach and Casino Resort
$21 million – Norman’s Cay
Resort – Exuma
$40 million – February Point
Resort Estates – Exuma
$30 million – Leaf Cay Resort –
Exuma
$31 million – Fortune Island Hotel and
Community Resort – Crooked Island
$63 million – Stocking Island Resort – Exuma
155

Negative Total Factor Productivity Erodes
the Benefits of Capital and Labour Inputs
156 http://www.cepal.org/portofspain/publicaciones/xml/7/38247/lcarl244.pdf
Large and Negative

An second IMF study confirms these findings
Source: http://www.imf.org/external/pubs/ft/wp/2012/wp12235.pdf

Key Tourism Issues
• Big employer, largest driver
• One market reliance
• Concentrated ownership
• Concentrated on New Providence and PI
• Absence of quality value added services, value chains, tourism clusters (nascent development stages)
• Losing Market Share to regional rivals
158
Number of Tourists by Country Origin, 1980-2011
Source: Statistics from The Ministry of Tourism

Reduced Market Share of the Valuable Stop-Over Market – Increased Dominance of
Cruise Arrivals (lower value added)
159
0
500,000
1,000,000
1,500,000
2,000,000
2,500,000
3,000,000
3,500,000
4,000,000
4,500,000
5,000,000
1995 1996 1997 1998 1999 2000 2001 2002 2003 2004 2005 2006 2007 2008 2009 2010 2011 2012 2013
Stop Over Visitors
Cruise Visitors
How to stabilize and increase declining
stopover turnover ?
How to maximize rising cruise turnover ?

Need to Improve Links to Tourism: Eg. Tourism Cluster Map of Dominican Republic
Extracted from: http://www.isc.hbs.edu/resources/courses/moc-course-at-harvard/Documents/pdf/student-projects/Dominican%20Republic%20-%20Tourism%20Cluster_Final.pdf

Financial Services: A Major Contributor
to the Economy
• Second pillar, high pay – middle class
• Need better measures of indirect impacts, but
this sector should be large
• Since 2000 under heavy attack (OECD, FATF,
FSB, Global Forum, G20)
– Adjustments have been made
• Re-alignment of traditional private banking (back office work
has been lost)
• New markets, new products require new skills
– Client facing activities, funds
• Development focused immigration policy needed
161

The State of the Financial Services
Outcomes Adaptation Models Decision Time

Evolution of Attack on Offshore
Financial Services Mid
1990s Anti Money Laundering
Prudential
Early 2000’s
G20 and IMF Prudential Standards
Harmful Tax Competition
Uncooperative Jurisdictions
IMF definitions of Offshore and
Tax Havens
Mid/Late 2000s
TIEA Blacklists threat
Rise of the Global Forum
Post 2010
Base Erosion and Profit Shifting
Developed, Developing and
Tax Havens
Movements at OECD and UN
Focus on companies
Focus on FDI incentives, EPZs
Post 2015
FATCA Automatic Spontaneous Tax Examination
Cooperation

The number of banks has declined
Type of Company
Year
2008 2009 2010 2011 2012 2013
Public 131 124 118 116 113 109
Restricted 130 139 150 155 147 152
Non-Active 10 18 8 7 8 6
Total 271 281 276 278 268 267
Licenses Ceased
16 19 9 8 11 9

Rebalancing of financial services
activities
Source: IMF[1]
[1] Extracted from IMF, Bahamas FSAP, 2013 available at http://www.imf.org/external/pubs/ft/scr/2013/cr13101.pdf

The Non-Bank Sector is also impacted by Changes in the International Environment

Financial Services: Employment and
Average Salaries (1997-2013)
167
$56,388
$-
$10,000
$20,000
$30,000
$40,000
$50,000
$60,000
0
1,000
2,000
3,000
4,000
5,000
6,000
1977
1978
1979
1980
1981
1982
1983
1984
1985
1986
1987
1988
1989
1990
1991
1992
1993
1994
1995
1996
1997
1998
1999
2000
2001
2002
2003
2004
2005
2006
2007
2008
2009
2010
2011
2012
2013
Non-Bahamians Bahamians Total Employment Average Salary ($B)

Skills, Productivity, Service…A Problem Throughout The Bahamas, but Financial Services is highly skilled
Extracted from Fazio and Pinder (2012), In Pursuit of Employable Skills, IDB

Surprisingly low levels of foreign labour,
compared to other sectors
Extracted from Fazio and Pinder (2012), In Pursuit of Employable Skills, IDB

Financial Sector Requires Hard Skills for
its Employees, in addition to soft skills
Extracted from Fazio and Pinder (2012), In Pursuit of Employable Skills, IDB

Training is extremely important to the sector
Extracted from Fazio and Pinder (2012), In Pursuit of Employable Skills, IDB

Key to success in Financial Services:
• Ensuring the skills and personnel for the current environment
Choose The Bahamas because we provide you with a strong value proposition
• Knowing high growth markets, targeting them, attracting firms and high value personnel
Choose The Bahamas because we are a gateway to the world (Think Global Again)
• Government efficiency & effectiveness, energy, technology
Choose The Bahamas because we may it easy for you to do business here
• Attract the right type of firms, regulation, financial sector education, We sit at the table, monitor the OECD/UN like a hawk and know what’s coming next and advocate hard for our centre
Choose The Bahamas because we have a Diamond Reputation

• Hard reforms to the business environment are a priority – Small reforms can make a big difference
– Target top 50 by 2020, top 25 by 2030.
• Build new clusters by attracting more business and business opportunities
• Invest in the best infrastructure
• Continue to safeguard our reputation
• Understand our skill needs and aggressively address them
Specific Steps for Financial Services
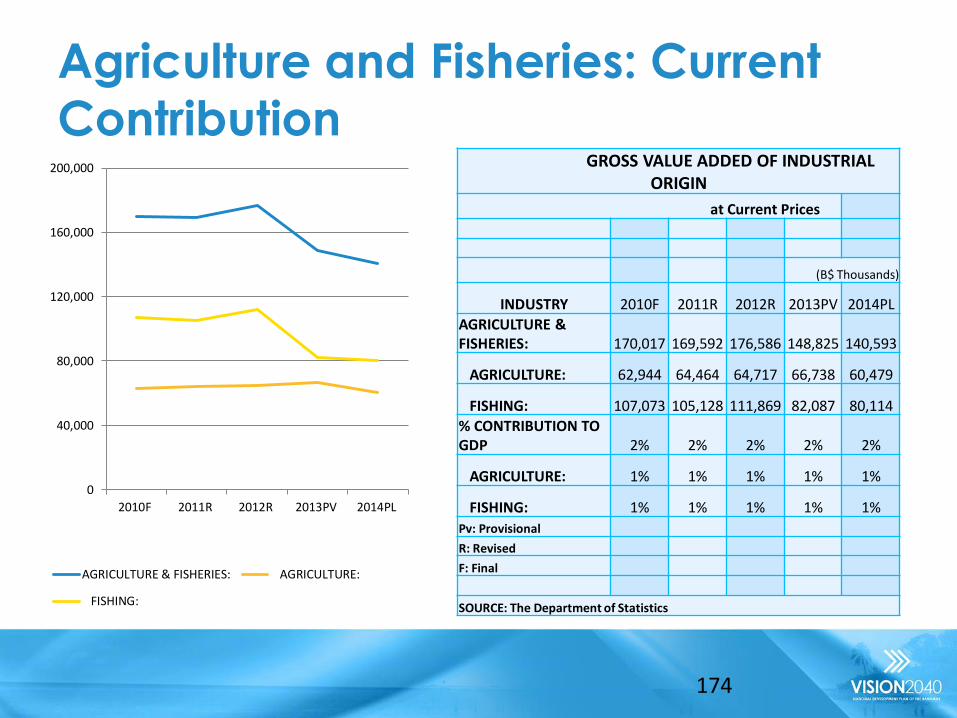
Agriculture and Fisheries: Current
Contribution
174
GROSS VALUE ADDED OF INDUSTRIAL ORIGIN
at Current Prices
(B$ Thousands)
INDUSTRY 2010F 2011R 2012R 2013PV 2014PL
AGRICULTURE & FISHERIES: 170,017 169,592 176,586 148,825 140,593
AGRICULTURE: 62,944 64,464 64,717 66,738 60,479
FISHING: 107,073 105,128 111,869 82,087 80,114
% CONTRIBUTION TO GDP 2% 2% 2% 2% 2%
AGRICULTURE: 1% 1% 1% 1% 1%
FISHING: 1% 1% 1% 1% 1%
Pv: Provisional
R: Revised
F: Final
SOURCE: The Department of Statistics
0
40,000
80,000
120,000
160,000
200,000
2010F 2011R 2012R 2013PV 2014PL
AGRICULTURE & FISHERIES: AGRICULTURE:
FISHING:

Agriculture and Fisheries: An Opportunity to Diversify the Economy and Broaden the Base
• Constraints
– Terrain and natural resources, crop quality & consistency
– Modern Skills, knowledge
– Absence of value added services
– Access to infrastructure
– Perceptions of the industry
– Illegal/unregulated fishing
– Lack of biological data for fish stock assessments
– Administrative human resources
– Regulation and policy development
– Invasive lion fish threatening ecosystem
175

On a practical level, farmers have
raised the following issues:
• The high costs associated with the transportation of agricultural goods from the Family Islands to New
Providence;
• Needed improvements to transportation infrastructure;
• Lack of effective marketing of local agriculture products;
• The high cost of formalization and registration of farms;
• Limited technical and extension services support (A recent Ministry of Agriculture and Marine Resources report notes that of the 200 staff at the Ministry, only 20 are professionally trained agricultural officers and most of these trained officers are located in New Providence);
• Lack of access to Crown Land on a leased basis and the timely transfer of land titles;
• Lack of credit products tailored to farmers (i.e., production credits);
• Needed modernization of packing houses, including exploring private public partnerships in their management;
• Standards and certifications; and
• The management of labour needs for farms and immigration processing.

The Contribution from Construction
is Also Falling
The Bahamas
Res. Com. &
Ind. Pub. Total
2004 2878 463 18 3359
2005 2846 435 16 3297
2006 1151 407 15 1573
2007 2695 361 14 3070
2008 2713 464 7 3184
2009 2009 385 22 2416
2010 1578 396 22 1996
2011 1528 385 35 1948
2012 1437 458 21 1916
2013 1055 355 19 1429
177
The Bahamas
Res. Com. &
Ind. Pub. Total
2004 354,224 178,017 8,176 540,417
2005 402,191 113,161 17,071 532,423
2006 579,856 217,578 6,457 803,891
2007 508,701 189,612 3,651 701,964
2008 514,043 289,715 3,015 806,773
2009 452,553 156,107 184,064 792,724
2010 320,232 182,763 71,724 574,719
2011 338,250 1,508,657 17,204 1,864,11
1
2012 306,933 373,228 35,745 715,906
2013 251,927 197,780 22,502 472,209
Number of Permits Value of Permits

International Trade
2009 2010 2011 2012 2013 2014
Imports 2,698.9
2,886.8
3,140.9
3,657.5
3,365.9
3,790.5
Exports 584.9
621.4
726.9
828.7
811.7
689.2
Balance of Trade
(2,114.0)
(2,265.4)
(2,414.0)
(2,828.8)
(2,554.2)
(3,101.3)
Source: Department of Statistics

Key Trading Partners
Country 2014
Imports Exports Balance
United States 3,007.0 569.9 (2,437.1)
Puerto Rico 243.9 - (243.9)
Barbados 96.9 0.8 (96.1)
Trinidad and Tobago 57.3 0.1 (57.2)
Japan 28.7 0.3 (28.4)
France 18.9 25.8 6.9
Ireland 1.0 25.1 24.1
Canada 20.1 14.3 (5.8)
Source: Department of Statistics
Key issues with International Trade
• The proximity and size of the U.S. market provide The Bahamas with a significant advantage, particularly when the U.S. economy is growing, as has been the norm over the last five decades. However, a move to diversify its trading relationship may open pockets of opportunities for small and/or niche firms in The Bahamas as well as provide alternative sources for inputs into the economy.
• The Bahamas would need to carefully plan any reduction in duties and tariffs so as to minimize transition costs for businesses that are benefiting from the current rates. Recognizing the need to move carefully, however, does not mean that such a reduction should not be started.
• The Bahamas should prioritize efforts aimed at making the country more attractive to business, particularly in ways that will help it diversify its trading partners.
• As The Bahamas expands its engagement within the international trading system, the government will need to create several new institutions, including a bureau of standards and quality, and a food safety agency.

WTO Accession
• The Bahamas is well advanced in the World Trade Organization (WTO) accession process.
• The legislative reforms necessary for WTO accession will be less difficult to achieve for The Bahamas than for many other acceding countries because it is party to the Economic Partnership Agreement (EPA), a trade agreement between CARICOM, the Dominican Republic, and the European Union.
• With respect to a reduction in tariffs on goods as required under both agreements, The Bahamas passed the Tariff Act, which includes all the tiers of EPA tariff reductions, in 2013.
• Ensuring consisting of WTO Services Rules and Bahamas Investment policy.
• Consideration of intellectual property and government procurement issues.

EPA Implementation
Implementing the EPA involves a number of initiatives aimed at fulfilling commitments made under the agreement. Key elements of this reform include:
• The Customs Management Act: This Act and its accompanying regulations was passed. Both are in line with EPA and WTO requirements.
• The Investment Bill: This bill was drafted and will set out the requirements for Mode 3 trade (physical commercial presence and investment) and Mode 4 trade (temporary presence of individuals). The manuals that will accompany passage of this bill will guide some of the operations of The Bahamas’ Investment Authority (Mode 3 manual) and Department of Immigration (Mode 4 manuals ).
• The Competition Law: The EPA requires the establishment of a competition authority.
• Intellectual Property: A suite of bills dealing with intellectual property issues has been drafted.

Stimulating High Growth Entrepreneurship: We Must Address the Following
• Human capital constraints: general deficiency in skills and a lack of needed training in addition to high wages and low productivity issues.
• Customs and trade regulations: need for customs modernisation and public institutional strengthening and reforms.
• Customs duty rates: 80% of Bahamian companies use foreign materials or supplies. Import duties are broadly considered a constraint to domestic private sector competitiveness.
•
• Practices of informal sector: unfair competition against unregistered companies in addition to those in their formal markets.
• Access to finance: proportion of firms using bank loans for working capital considered one of the lowest among comparator countries.
• Crime, theft and disorder: firms in The Bahamas indicated spending up to 1.6% of the value of their total sales on measures to secure and protect their business, compared to a regional average of 1.5%.
• Electricity: high costs alongside broadly unreliable supply.
• Corruption: based on an incidence of graft index (including expectation of giving a gift in order to receive certain services), The Bahamas’ score at 13.4 ranks high compared to region (6.6) and OECD countries (5.7).

Low Hanging Fruit: Easy Fixes that would have a Significant
Impact: - Doing Business Priorities Doing Business Priorities 2016
Registering Property (#183) – Process
Reform
Getting Credit (#133)- Institutional Reform
Starting a Business (#118)- Process
Reform
Getting electricity (#114) – Process
Reform
Protecting Minority Investors (#111)-
Legislative Reform
Trading Across Borders (#97) – Process Reform
Dealing with Construction Permits (#94)- Process Reform
Resolving Insolvency (#61) – Legislative
Reform
Enforcing Contracts (#60) – Process and Legislative Reform
Paying taxes (#24)- Continued Process
Improvement
Green outline indicates that there are improvements underway
Green outline indicates that there are improvements underway

The Issue of Land: The Challenges
• Overlapping claims and rights to land as a result of property disputes;
• Lack of a parcel-based cadastral map to determine geographical boundaries;
• Outdated policy for Crown Land divestment and administration which does not promote an efficient use of these lands; and
• Existence of commonage and generational property, particularly on the Family Islands. Due to the lack of clear legal title associated with this tenure system, occupants on the land do not have access to the economic value of the land and are unable to mortgage the land to make improvements.

Cross cutting issues
• Unemployment. By December 2015, the unemployment rate in The Bahamas was 12.1% , significantly lower than the November 2014 rate of 15.7%. Youth unemployment, which was estimated at 34% in 2014, remained high.
• Consumer and government financing crowding out private sector investment. High levels of delinquency combined with low levels of household savings and the lack of an operating credit information infrastructure has led to a conservative financial sector. In turn, productive investment activities are often unable to be funded with financial institutions opting for consumer and government financing.
• Poverty. Poverty in The Bahamas has deepened from a rate of 9.3% in 2001 to 12.8% in 2013.

Cross cutting issues, cont’d
• Crime and violence. Deteriorating economic conditions and rising unemployment have contributed to the gravely intensified incidents of crime, in particular violent crime, in The Bahamas. In addition to its devastating social impact on communities, rising crime levels constitute a critical threat to the economy, domestic and foreign sectors. It is particularly harmful to tourism, the economy’s principal driver, which is influenced by even the perception of crime.
• Constraints due to deficiencies in skills and educational attainment. Domestic sector diversification and the capacity to develop and sustain production in high value added goods and services is constrained by a mismatch in the supply of skills – education levels below what is required and a lack of sector specific specialised skills –with the demands of businesses.
• Inequitable and uneven development across the islands of The Bahamas. High per capita costs for a small population dispersed over several islands has made ensuring universal access to basic public services – education, health, water and electricity – particularly costly. As a consequence, the pattern of social and economic development varies significantly across the Islands.
The National Development Plan
A Working Proposal

Strawman Vision 2040
With heads held high, looking towards the year 2040, the people of The Bahamas will honor the culture and traditions of this great nation. We will be a united people, grounded in spiritual values and working together to achieve our individual and common dreams.
The Bahamas will be a prosperous nation, providing a sustainable livelihood for our people and successfully competing in the global market place. The core of our growth shall come from our unique natural resources, the strength of our businesses, our political stability and the ingenuity and creativity of our citizens. Bahamians will be active participants and owners in the development of the wealth of this nation through agriculture, industry, technology and the provision of services.
The Bahamian people, equally on our family islands and urban areas, will be healthy, well-educated and safe. We will support strong families, our children, our youth, our elderly and those with special needs and foster an environment which unlocks and values the innate potential of our citizens.
Our environment will be cherished and protected and used in a wise and responsible way to enhance our development for generations to come.

A Vision for Each Pillar
Governance The people of The Bahamas desire a country
that is safe and well governed
Economy The people of The Bahamas desire a strong,
competitive, vibrant and diversified economy
Environment and
Infrastructure
The people of The Bahamas desire a natural
environment and infrastructure which promote
a healthy, resilient, beautiful and modern
society
Human
Development
The people of The Bahamas desire a country
where the innate potential of each person is
nurtured, developed, protected and allowed to
flourish
National Goals: Governance
1. The Bahamas will have a Modern, Open and Accountable Government that Serves All Bahamians
2. The Bahamas will have Well Governed Public institutions throughout the entire country
3. The Bahamas will have a law abiding society where rules are respected
4. The Bahamas will have safe neighbourhoods with minimal crime, backstopped by dependable policing and courts

National Goals: Human Development
1. The Bahamas will have a modern, sustainable & universally accessible health care system that is wellness focused and delivers continuously improving outcomes.
2. The Bahamas will have a best in class, comprehensive and effective education system
3. Bahamian youth will be safe, healthy, well fed and clothed, attending school and finding and creating employment.
4. The Bahamas will be a nation free of poverty and discrimination (including gender, nationality and disabilities)

National Goals: Environment and Infrastructure
1. The Bahamas will have an effective interconnected transportation system that enables the free flow of people and goods
2. The Bahamas will have modern infrastructure in New Providence and the family islands built to withstand the effects of climate change
3. The Bahamas will have a pristine marine, air and land environment that supports the Bahamian economy and way of life for generations

National Goals: Economy 1. The Bahamas will have a healthy macro economic
environment that supports growth and stability
2. The Bahamas will have a competitive business environment for economic success that support business development, innovation, wealth creation, entrepreneurship and job growth
3. The Bahamas will have a diversified and resilient economy that provides opportunities for all Bahamians
4. The Bahamas will have a fair and effective labour regime

Thank you
195