Embed Size (px)
Citation preview
An Impact BriefJanuary 2019
The Narwhal List 2019Another year of progress in Canada’s tech community
The Narwhal List 2019 | Impact Centre | University of Toronto 2
Contents
The Narwhal List 3Measuring Progress 4The Narwhal List 2019 6The Year in Review 9Becoming World-Class 11Methodology 16About the Impact Centre 17
The Narwhal List 2019 | Impact Centre | University of Toronto 3
2018 was another remarkable year for Canadian Narwhals. In brief:
• 17 new companies joined the list last year, replacing others that no longer qualify for the list.
• Compared to the year before, we almost doubled the number of firms on track to become Unicorns in the near future.
• The list had a strong cohort of 25 technology companies that raised, on average, $40 million, and two healthcare companies, each averaging $100 million in new capital.
• The average financial velocity in the technology sector increased from 9.4 to 12.8. • Entry to the Narwhal List is becoming more exclusive: the minimum financial velocity
for entry is now 6.7 (compared to 4.7 in 2017). • Although none of the firms on last year’s list went public in 2018, none were sold—a
hopeful sign of retention in Canada.
What is highly disappointing though is that Canada has yet to produce a Unicorn since Kik Interactive became one in August of 2015. That’s over three years without producing a Unicorn when we should be producing between two and five a year. In fact since Kik became a Unicorn, 19 US companies were founded and became Unicorns.
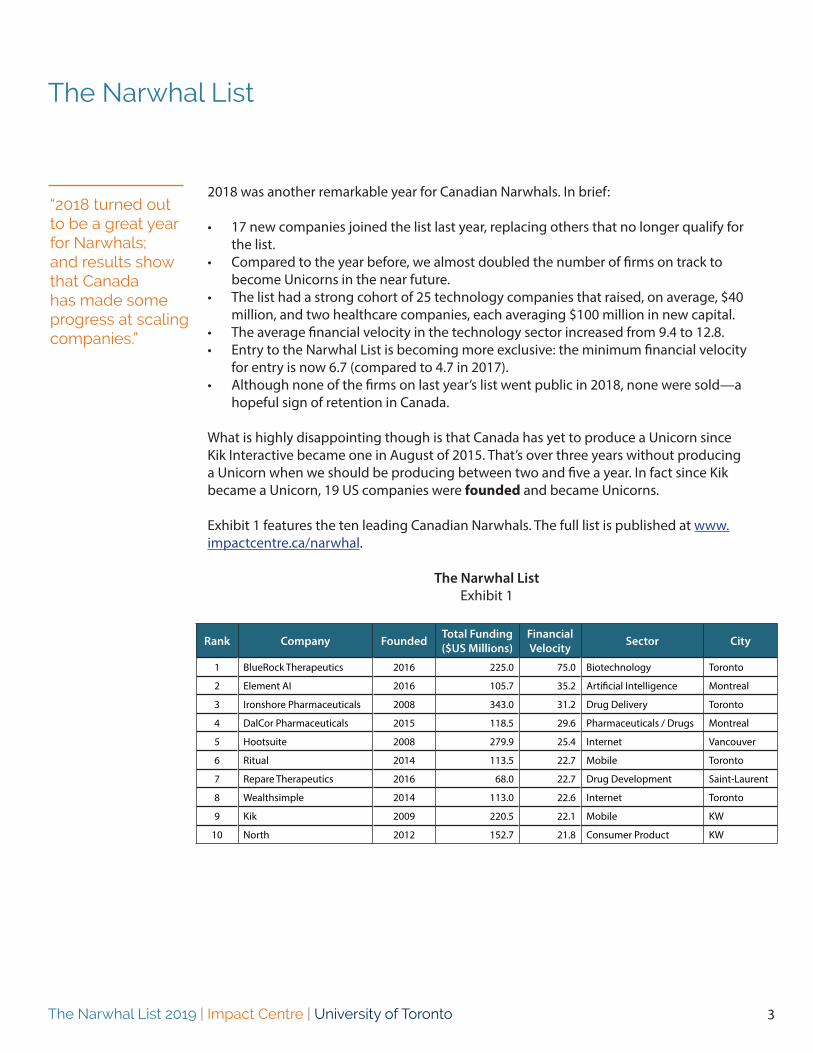
Exhibit 1 features the ten leading Canadian Narwhals. The full list is published at www.impactcentre.ca/narwhal.
The Narwhal ListExhibit 1
Rank Company Founded Total Funding($US Millions)
Financial Velocity Sector City
1 BlueRock Therapeutics 2016 225.0 75.0 Biotechnology Toronto
2 Element AI 2016 105.7 35.2 Artificial Intelligence Montreal
3 Ironshore Pharmaceuticals 2008 343.0 31.2 Drug Delivery Toronto
4 DalCor Pharmaceuticals 2015 118.5 29.6 Pharmaceuticals / Drugs Montreal
5 Hootsuite 2008 279.9 25.4 Internet Vancouver
6 Ritual 2014 113.5 22.7 Mobile Toronto
7 Repare Therapeutics 2016 68.0 22.7 Drug Development Saint-Laurent
8 Wealthsimple 2014 113.0 22.6 Internet Toronto
9 Kik 2009 220.5 22.1 Mobile KW
10 North 2012 152.7 21.8 Consumer Product KW
The Narwhal List
“2018 turned out to be a great year for Narwhals; and results show that Canada has made some progress at scaling companies.”
The Narwhal List 2019 | Impact Centre | University of Toronto 4
Measuring Progress
Background
The Impact Centre’s Narwhal List identifies a set of young Canadian companies that have the potential to become successful on the world stage. It also points to possible financial pathways to turn these companies into Unicorns, which are closer to reaching public financial markets. The transition to the Unicorn scale and possibly public listings may give our firms the ability to compete on their own merits and have the currency necessary in public stock to fund acquisitions throughout the world that will lead to even greater scale.
Canada has a number of reputable lists that rank technology firms. The oldest is the Branham300. Generated by the Branham Group Inc., this listing is useful to gain a perspective on the comparative revenues of Canadian firms. Another well-known list is Deloitte’s Technology Fast 50™, which ranks Canadian technology firms according to their percentage revenue growth rates. The Technology Fast 50™ program rewards firms in their earliest years, when extraordinary growth rates are possible from a revenue base of C$50,000 (the minimum revenue to qualify as an applicant).
The Narwhal List sheds light on the ability of firms to scale up and reach world-class status. The ranking system is derived from publicly available information and tracks all firms in the country with data in the public domain—not just those that elect to participate by revealing private revenue data. The Narwhal List also enables businesses to benchmark themselves against other Canadian firms, Unicorns, and the competition. Since the Narwhal List includes all private firms with fundraising activity, it is also a useful indicator for how Canada as a whole is faring in business incubation and growth.
The 2019 Narwhal List
The current report builds on our effort started two years ago: we provide here our annual update identifying private Canadian companies with the potential to scale to world-class status. Movements on the list can also tell us whether Canada is making progress at creating a cohort of high-potential companies.
In our first Impact Brief in 2017 (The Narwhal List, released March 2017), we identified an approach to measuring the progress of product focussed technology companies through the use of “financial velocity.” This concept enables companies to think easily and quickly about growth. If you have a large market that is ready and willing to purchase your innovation, then your growth is limited only by the capital you have on hand to fuel that growth.
The amount of “fuel” required increases as a business grows; thus, a scaling company requires more and more capital to sustain operations. In most cases, larger companies are more profitable than smaller ones and consequently accumulate retained earnings, which fuels their capital.
The Narwhal List 2019 | Impact Centre | University of Toronto 5
Financial velocity measures the speed at which a company acquires and consumes capital to fuel its growth. It is defined simply as the amount of capital a company has raised divided by the number of years it has been in existence:
financial velocity = capital raised / years in existence
Velocity is measured over time and is expressed in millions of US dollars per year.It provides a simple and elegant tool to enable entrepreneurs and investors to gauge the financial attractiveness of young and capital-intensive firms.
Achieving a high financial velocity means a company is raising more and more money over time. It is possible for a firm to have a high velocity in its first year if it raises a significant amount of funding. In each year of its existence, it must raise more and more money to maintain that high velocity.
However, if a business does not raise any money—or raises too little—in any given year, its velocity will decrease; and this may be a sign of stagnant or declining growth. Companies can graduate from the list when they get sold or have an Initial Public Offering. Financial velocity is also handy when comparing firms founded in different years.
We must note that firms can also acquire capital while not managing to grow their revenue. Although a firm may show strong growth using our proxy metrics, if it does not manage to successfully add revenue, the business will eventually not be able to raise additional capital. Thus, in the long run, any issues with using this metric in cases where firms are unable to secure revenue will resolve themselves naturally as such businesses drop in ranking or disappear entirely from the Narwhal List. Financial velocity is a “leading” metric as increases in capital usually come before increases in revenue.
The Narwhal List 2019 | Impact Centre | University of Toronto 6
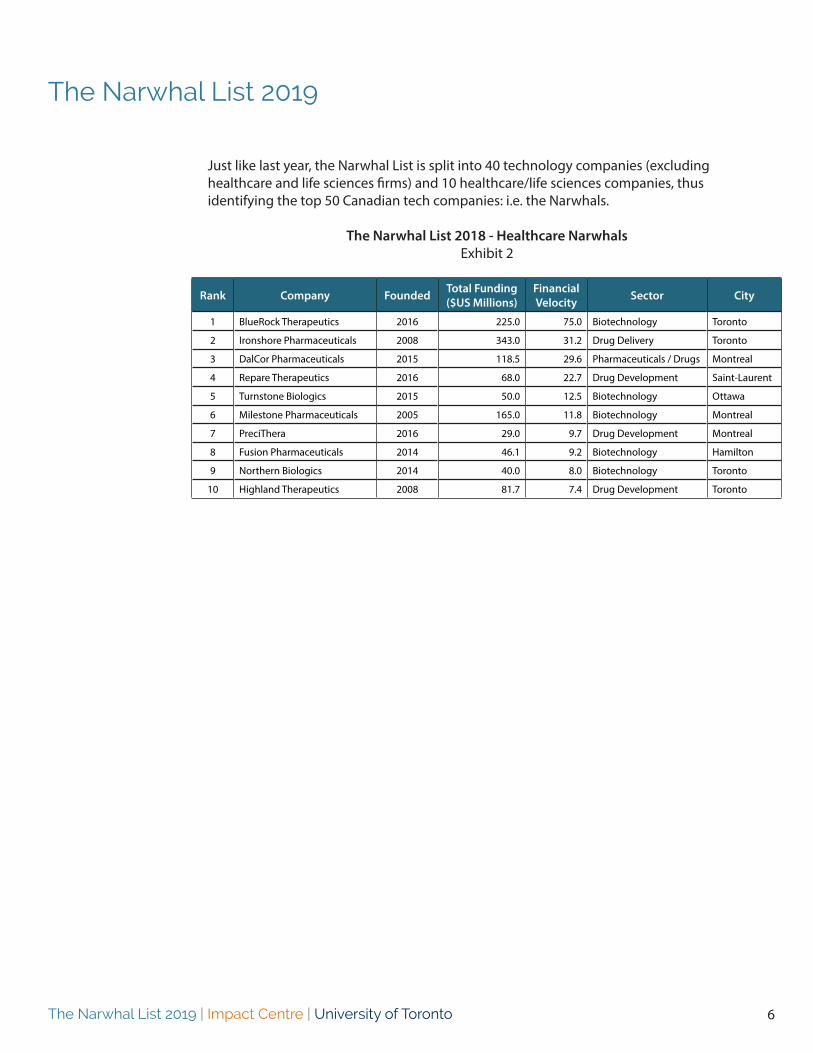
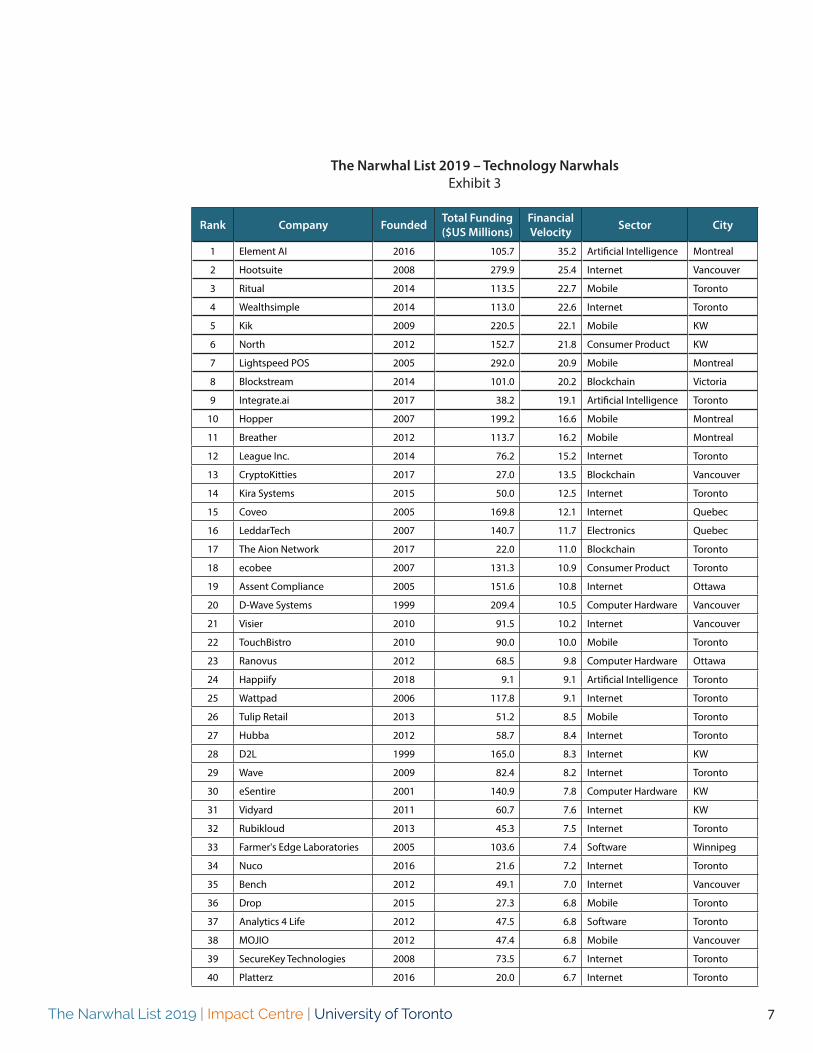
Just like last year, the Narwhal List is split into 40 technology companies (excluding healthcare and life sciences firms) and 10 healthcare/life sciences companies, thus identifying the top 50 Canadian tech companies: i.e. the Narwhals.
The Narwhal List 2018 - Healthcare Narwhals Exhibit 2
The Narwhal List 2019
Rank Company Founded Total Funding($US Millions)
Financial Velocity Sector City
1 BlueRock Therapeutics 2016 225.0 75.0 Biotechnology Toronto
2 Ironshore Pharmaceuticals 2008 343.0 31.2 Drug Delivery Toronto
3 DalCor Pharmaceuticals 2015 118.5 29.6 Pharmaceuticals / Drugs Montreal
4 Repare Therapeutics 2016 68.0 22.7 Drug Development Saint-Laurent
5 Turnstone Biologics 2015 50.0 12.5 Biotechnology Ottawa
6 Milestone Pharmaceuticals 2005 165.0 11.8 Biotechnology Montreal
7 PreciThera 2016 29.0 9.7 Drug Development Montreal
8 Fusion Pharmaceuticals 2014 46.1 9.2 Biotechnology Hamilton
9 Northern Biologics 2014 40.0 8.0 Biotechnology Toronto
10 Highland Therapeutics 2008 81.7 7.4 Drug Development Toronto
The Narwhal List 2019 | Impact Centre | University of Toronto 7
The Narwhal List 2019 – Technology Narwhals Exhibit 3
Rank Company Founded Total Funding($US Millions)
Financial Velocity Sector City
1 Element AI 2016 105.7 35.2 Artificial Intelligence Montreal
2 Hootsuite 2008 279.9 25.4 Internet Vancouver
3 Ritual 2014 113.5 22.7 Mobile Toronto
4 Wealthsimple 2014 113.0 22.6 Internet Toronto
5 Kik 2009 220.5 22.1 Mobile KW
6 North 2012 152.7 21.8 Consumer Product KW
7 Lightspeed POS 2005 292.0 20.9 Mobile Montreal
8 Blockstream 2014 101.0 20.2 Blockchain Victoria
9 Integrate.ai 2017 38.2 19.1 Artificial Intelligence Toronto
10 Hopper 2007 199.2 16.6 Mobile Montreal
11 Breather 2012 113.7 16.2 Mobile Montreal
12 League Inc. 2014 76.2 15.2 Internet Toronto
13 CryptoKitties 2017 27.0 13.5 Blockchain Vancouver
14 Kira Systems 2015 50.0 12.5 Internet Toronto
15 Coveo 2005 169.8 12.1 Internet Quebec
16 LeddarTech 2007 140.7 11.7 Electronics Quebec
17 The Aion Network 2017 22.0 11.0 Blockchain Toronto
18 ecobee 2007 131.3 10.9 Consumer Product Toronto
19 Assent Compliance 2005 151.6 10.8 Internet Ottawa
20 D-Wave Systems 1999 209.4 10.5 Computer Hardware Vancouver
21 Visier 2010 91.5 10.2 Internet Vancouver
22 TouchBistro 2010 90.0 10.0 Mobile Toronto
23 Ranovus 2012 68.5 9.8 Computer Hardware Ottawa
24 Happiify 2018 9.1 9.1 Artificial Intelligence Toronto
25 Wattpad 2006 117.8 9.1 Internet Toronto
26 Tulip Retail 2013 51.2 8.5 Mobile Toronto
27 Hubba 2012 58.7 8.4 Internet Toronto
28 D2L 1999 165.0 8.3 Internet KW
29 Wave 2009 82.4 8.2 Internet Toronto
30 eSentire 2001 140.9 7.8 Computer Hardware KW
31 Vidyard 2011 60.7 7.6 Internet KW
32 Rubikloud 2013 45.3 7.5 Internet Toronto
33 Farmer's Edge Laboratories 2005 103.6 7.4 Software Winnipeg
34 Nuco 2016 21.6 7.2 Internet Toronto
35 Bench 2012 49.1 7.0 Internet Vancouver
36 Drop 2015 27.3 6.8 Mobile Toronto
37 Analytics 4 Life 2012 47.5 6.8 Software Toronto
38 MOJIO 2012 47.4 6.8 Mobile Vancouver
39 SecureKey Technologies 2008 73.5 6.7 Internet Toronto
40 Platterz 2016 20.0 6.7 Internet Toronto
The Narwhal List 2019 | Impact Centre | University of Toronto 8
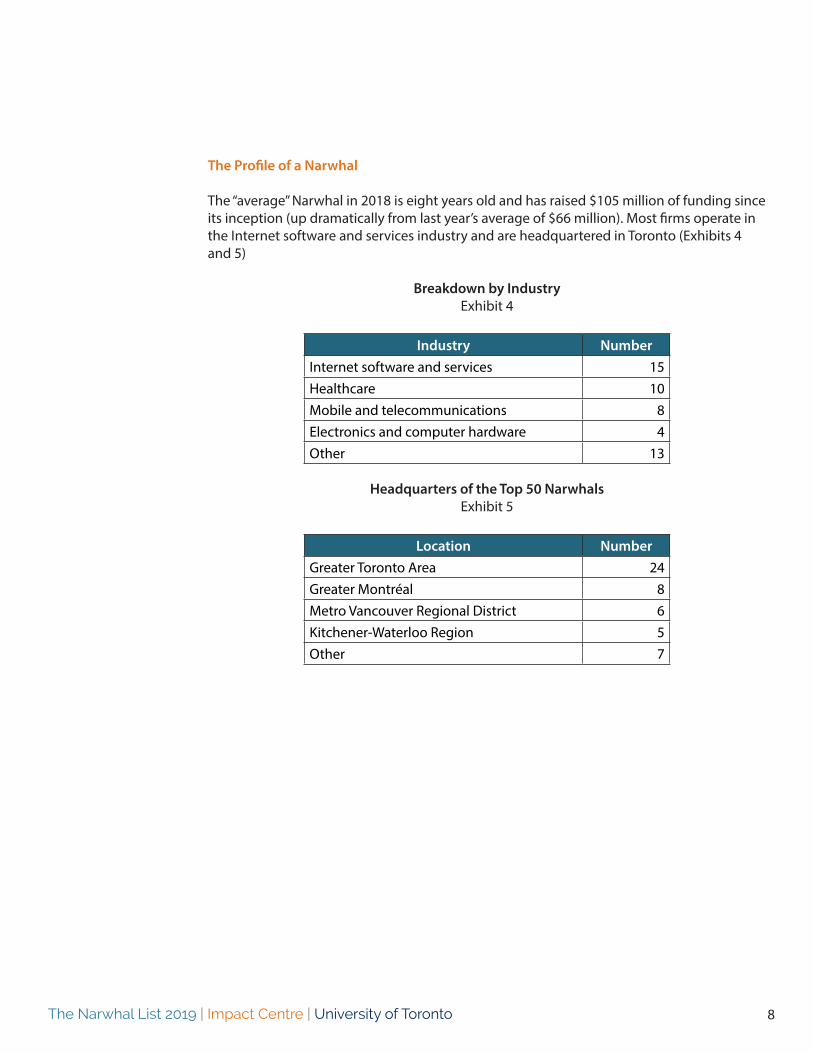
The Profile of a Narwhal
The “average” Narwhal in 2018 is eight years old and has raised $105 million of funding since its inception (up dramatically from last year’s average of $66 million). Most firms operate in the Internet software and services industry and are headquartered in Toronto (Exhibits 4 and 5)
Breakdown by IndustryExhibit 4
Industry NumberInternet software and services 15Healthcare 10Mobile and telecommunications 8Electronics and computer hardware 4Other 13
Headquarters of the Top 50 NarwhalsExhibit 5
Location NumberGreater Toronto Area 24Greater Montréal 8Metro Vancouver Regional District 6Kitchener-Waterloo Region 5Other 7
The Narwhal List 2019 | Impact Centre | University of Toronto 9
2018 turned out to be a great year for Narwhals; and results show that Canada has made some progress at scaling companies.
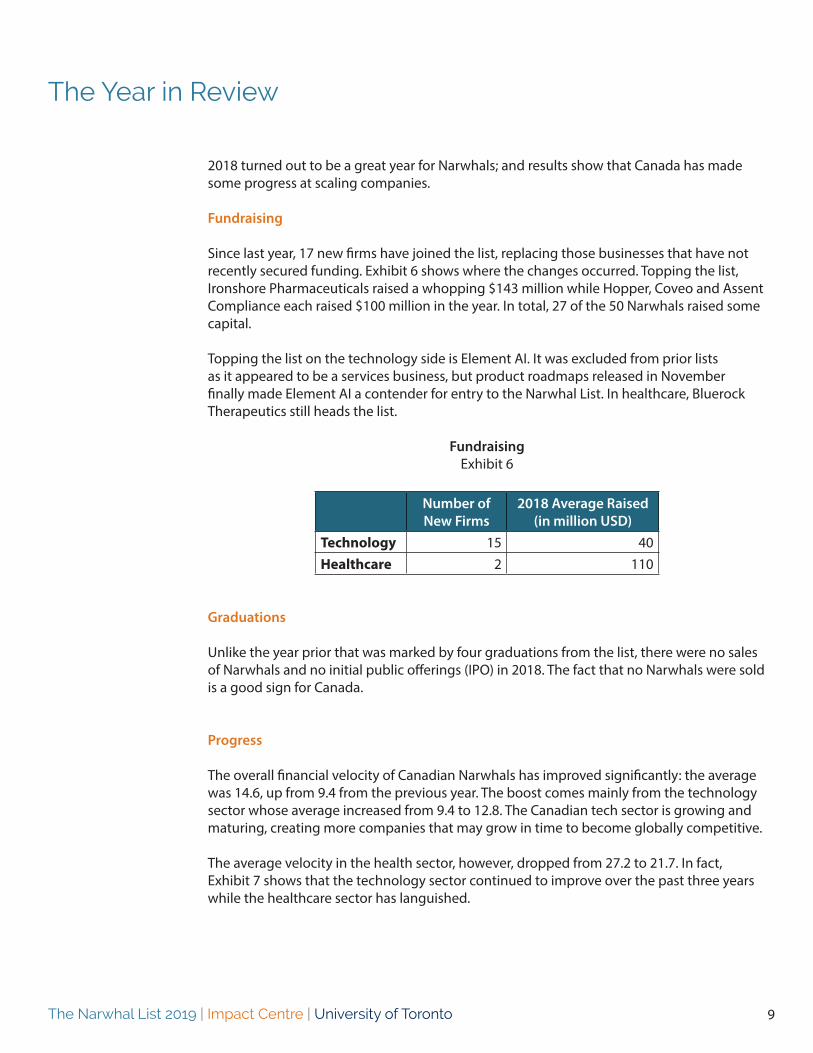
Fundraising
Since last year, 17 new firms have joined the list, replacing those businesses that have not recently secured funding. Exhibit 6 shows where the changes occurred. Topping the list, Ironshore Pharmaceuticals raised a whopping $143 million while Hopper, Coveo and Assent Compliance each raised $100 million in the year. In total, 27 of the 50 Narwhals raised some capital.
Topping the list on the technology side is Element AI. It was excluded from prior lists as it appeared to be a services business, but product roadmaps released in November finally made Element AI a contender for entry to the Narwhal List. In healthcare, Bluerock Therapeutics still heads the list.
FundraisingExhibit 6
Number of New Firms
2018 Average Raised(in million USD)
Technology 15 40Healthcare 2 110
Graduations
Unlike the year prior that was marked by four graduations from the list, there were no sales of Narwhals and no initial public offerings (IPO) in 2018. The fact that no Narwhals were sold is a good sign for Canada.
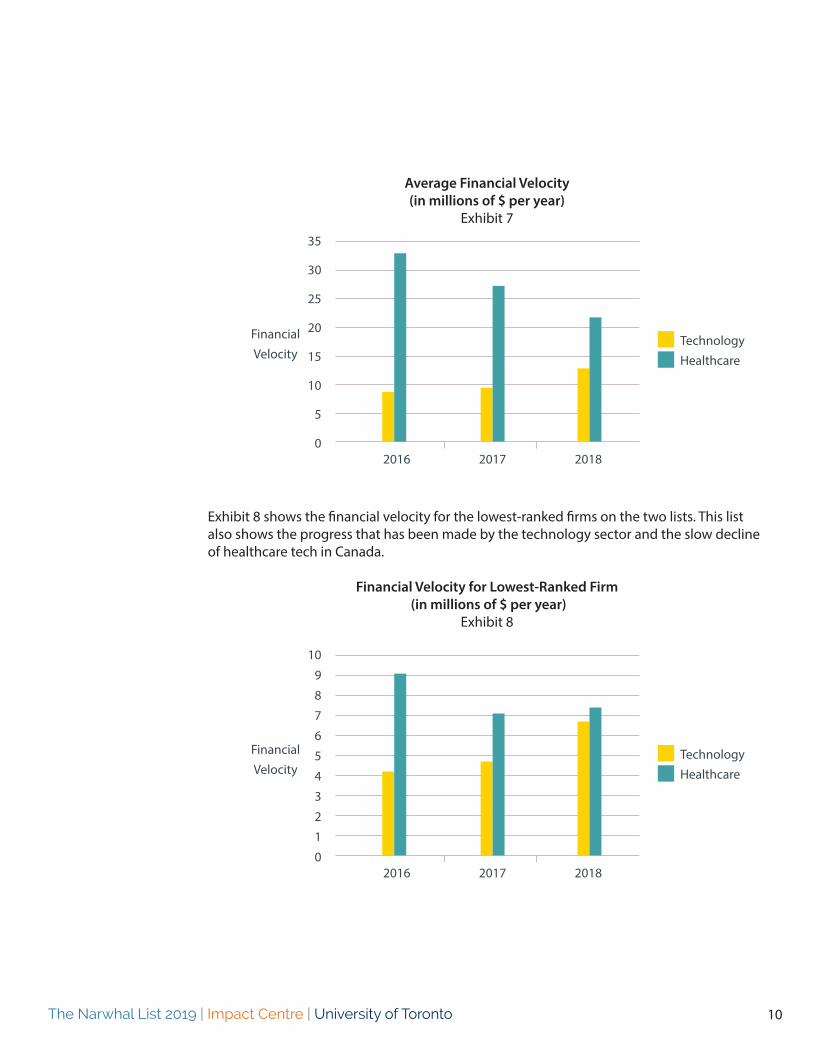
Progress
The overall financial velocity of Canadian Narwhals has improved significantly: the average was 14.6, up from 9.4 from the previous year. The boost comes mainly from the technology sector whose average increased from 9.4 to 12.8. The Canadian tech sector is growing and maturing, creating more companies that may grow in time to become globally competitive.
The average velocity in the health sector, however, dropped from 27.2 to 21.7. In fact, Exhibit 7 shows that the technology sector continued to improve over the past three years while the healthcare sector has languished.
The Year in Review
The Narwhal List 2019 | Impact Centre | University of Toronto 10
Average Financial Velocity(in millions of $ per year)
Exhibit 7
Exhibit 8 shows the financial velocity for the lowest-ranked firms on the two lists. This list also shows the progress that has been made by the technology sector and the slow decline of healthcare tech in Canada.
Financial Velocity for Lowest-Ranked Firm (in millions of $ per year)
Exhibit 8
35
30
25
20
15
10
5
0
TechnologyHealthcare
FinancialVelocity
2016 2017 2018
10
9
8
7
6
5
4
3
2
1
0
TechnologyHealthcare
2016 2017 2018
FinancialVelocity
The Narwhal List 2019 | Impact Centre | University of Toronto 11
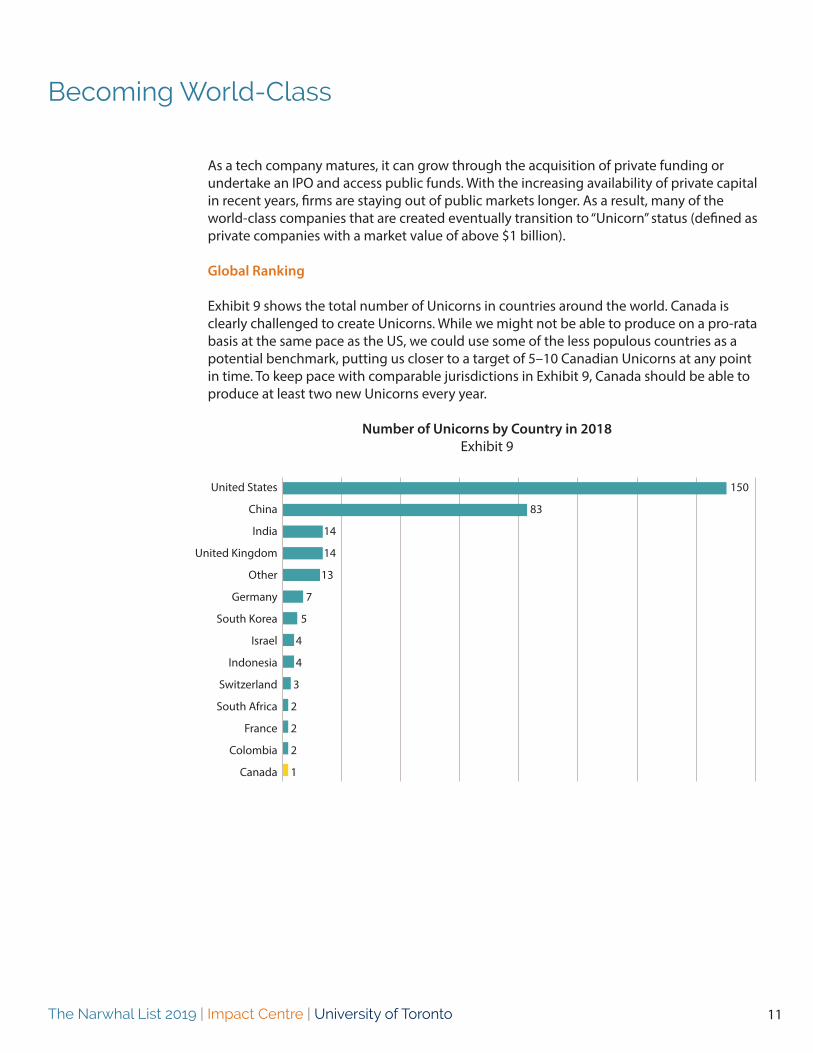
As a tech company matures, it can grow through the acquisition of private funding or undertake an IPO and access public funds. With the increasing availability of private capital in recent years, firms are staying out of public markets longer. As a result, many of the world-class companies that are created eventually transition to “Unicorn” status (defined as private companies with a market value of above $1 billion).
Global Ranking
Exhibit 9 shows the total number of Unicorns in countries around the world. Canada is clearly challenged to create Unicorns. While we might not be able to produce on a pro-rata basis at the same pace as the US, we could use some of the less populous countries as a potential benchmark, putting us closer to a target of 5–10 Canadian Unicorns at any point in time. To keep pace with comparable jurisdictions in Exhibit 9, Canada should be able to produce at least two new Unicorns every year.
Number of Unicorns by Country in 2018Exhibit 9
Becoming World-Class
United States
China
India
United Kingdom
Other
Germany
South Korea
Israel
Indonesia
Switzerland
South Africa
France
Colombia
Canada
150
83
14
14
13
7
5
4
4
3
2
2
2
1
The Narwhal List 2019 | Impact Centre | University of Toronto 12
What is highly disappointing though is that Canada has yet to produce a Unicorn since Kik Interactive became one in August of 2015. That’s over three years without producing a Unicorn when we should be producing between two and five a year. In fact since Kik became a Unicorn, 19 US companies were founded and became Unicorns.
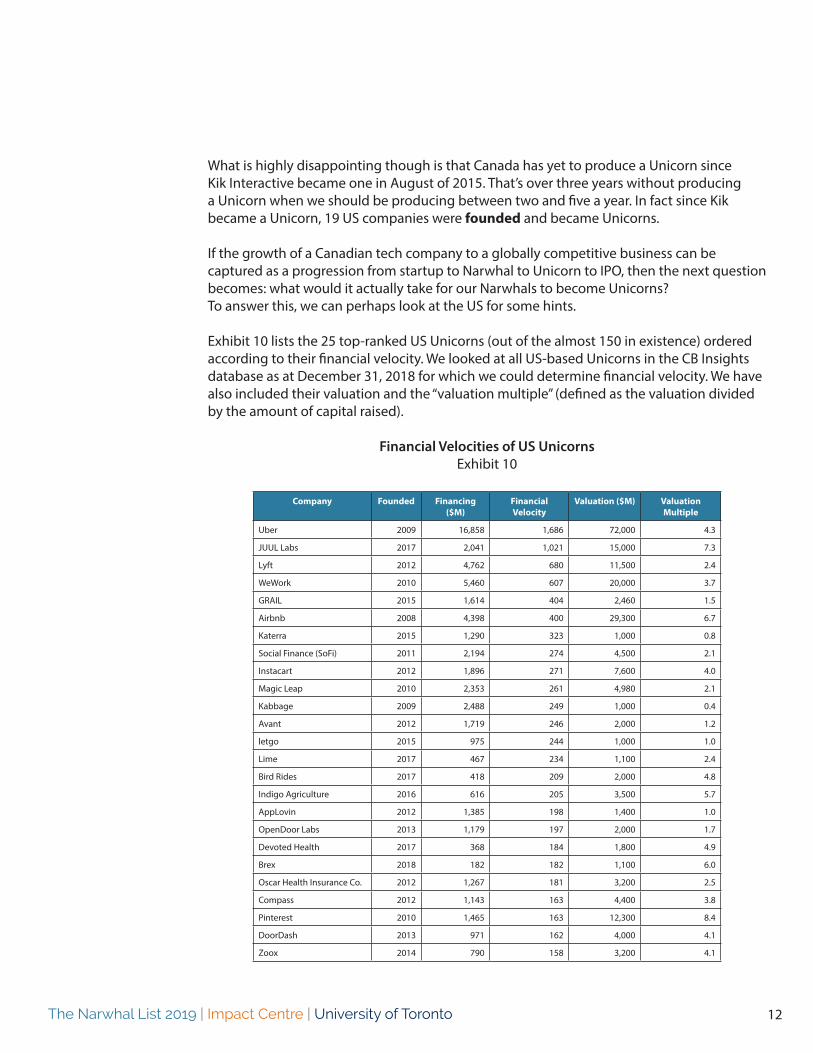
If the growth of a Canadian tech company to a globally competitive business can be captured as a progression from startup to Narwhal to Unicorn to IPO, then the next question becomes: what would it actually take for our Narwhals to become Unicorns?To answer this, we can perhaps look at the US for some hints.
Exhibit 10 lists the 25 top-ranked US Unicorns (out of the almost 150 in existence) ordered according to their financial velocity. We looked at all US-based Unicorns in the CB Insights database as at December 31, 2018 for which we could determine financial velocity. We have also included their valuation and the “valuation multiple” (defined as the valuation divided by the amount of capital raised).
Financial Velocities of US UnicornsExhibit 10
Company Founded Financing ($M)
Financial Velocity
Valuation ($M) Valuation Multiple
Uber 2009 16,858 1,686 72,000 4.3
JUUL Labs 2017 2,041 1,021 15,000 7.3
Lyft 2012 4,762 680 11,500 2.4
WeWork 2010 5,460 607 20,000 3.7
GRAIL 2015 1,614 404 2,460 1.5
Airbnb 2008 4,398 400 29,300 6.7
Katerra 2015 1,290 323 1,000 0.8
Social Finance (SoFi) 2011 2,194 274 4,500 2.1
Instacart 2012 1,896 271 7,600 4.0
Magic Leap 2010 2,353 261 4,980 2.1
Kabbage 2009 2,488 249 1,000 0.4
Avant 2012 1,719 246 2,000 1.2
letgo 2015 975 244 1,000 1.0
Lime 2017 467 234 1,100 2.4
Bird Rides 2017 418 209 2,000 4.8
Indigo Agriculture 2016 616 205 3,500 5.7
AppLovin 2012 1,385 198 1,400 1.0
OpenDoor Labs 2013 1,179 197 2,000 1.7
Devoted Health 2017 368 184 1,800 4.9
Brex 2018 182 182 1,100 6.0
Oscar Health Insurance Co. 2012 1,267 181 3,200 2.5
Compass 2012 1,143 163 4,400 3.8
Pinterest 2010 1,465 163 12,300 8.4
DoorDash 2013 971 162 4,000 4.1
Zoox 2014 790 158 3,200 4.1
The Narwhal List 2019 | Impact Centre | University of Toronto 13
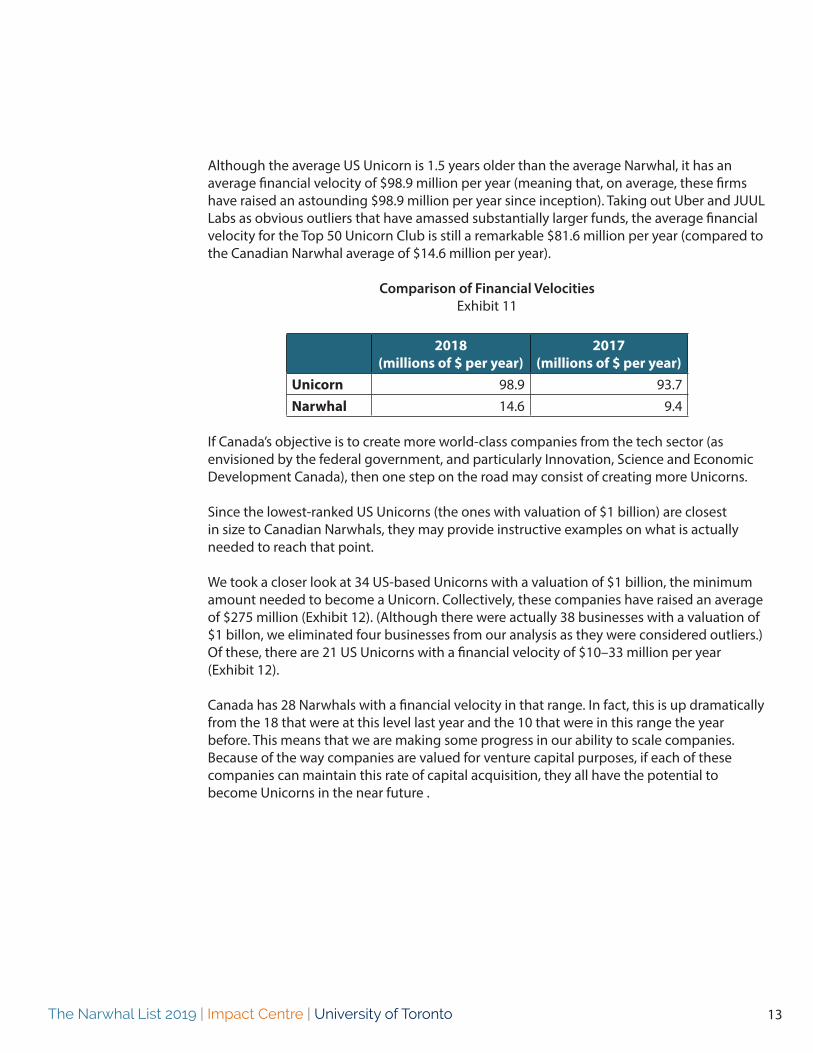
Although the average US Unicorn is 1.5 years older than the average Narwhal, it has an average financial velocity of $98.9 million per year (meaning that, on average, these firms have raised an astounding $98.9 million per year since inception). Taking out Uber and JUUL Labs as obvious outliers that have amassed substantially larger funds, the average financial velocity for the Top 50 Unicorn Club is still a remarkable $81.6 million per year (compared to the Canadian Narwhal average of $14.6 million per year).
Comparison of Financial VelocitiesExhibit 11
2018 (millions of $ per year)
2017 (millions of $ per year)
Unicorn 98.9 93.7Narwhal 14.6 9.4
If Canada’s objective is to create more world-class companies from the tech sector (as envisioned by the federal government, and particularly Innovation, Science and Economic Development Canada), then one step on the road may consist of creating more Unicorns.
Since the lowest-ranked US Unicorns (the ones with valuation of $1 billion) are closest in size to Canadian Narwhals, they may provide instructive examples on what is actually needed to reach that point.
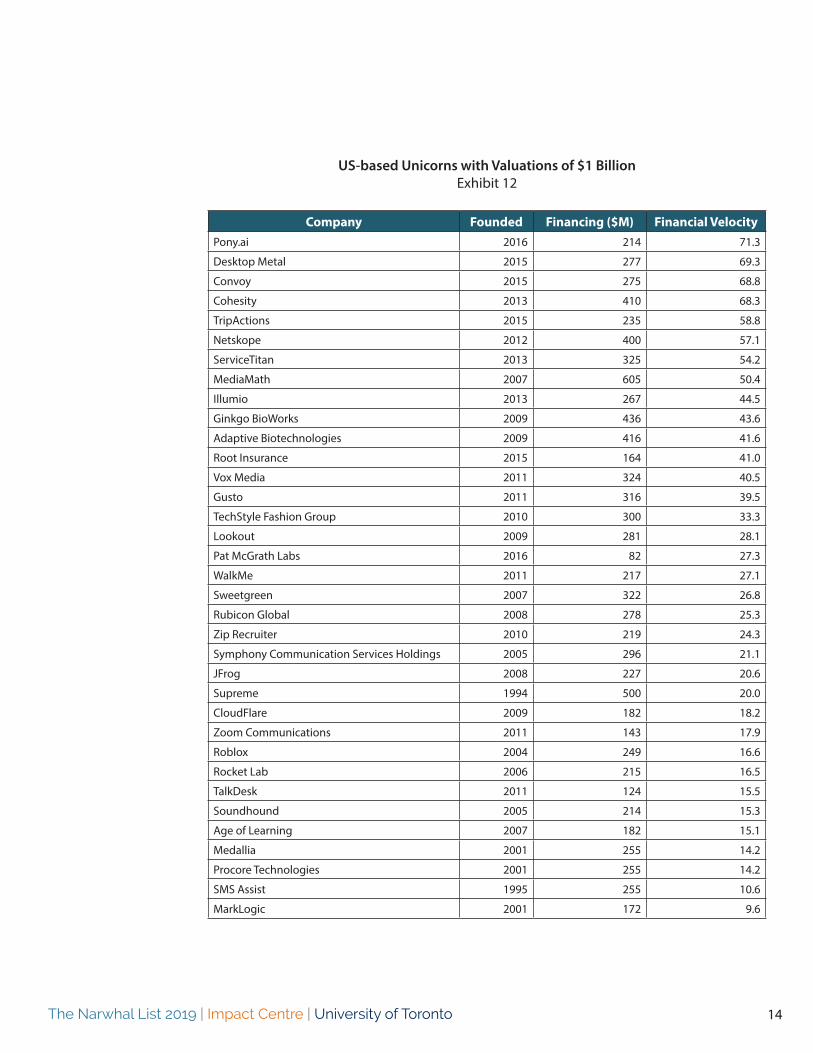
We took a closer look at 34 US-based Unicorns with a valuation of $1 billion, the minimum amount needed to become a Unicorn. Collectively, these companies have raised an average of $275 million (Exhibit 12). (Although there were actually 38 businesses with a valuation of $1 billon, we eliminated four businesses from our analysis as they were considered outliers.) Of these, there are 21 US Unicorns with a financial velocity of $10–33 million per year (Exhibit 12).
Canada has 28 Narwhals with a financial velocity in that range. In fact, this is up dramatically from the 18 that were at this level last year and the 10 that were in this range the year before. This means that we are making some progress in our ability to scale companies. Because of the way companies are valued for venture capital purposes, if each of these companies can maintain this rate of capital acquisition, they all have the potential to become Unicorns in the near future .
The Narwhal List 2019 | Impact Centre | University of Toronto 14
US-based Unicorns with Valuations of $1 BillionExhibit 12
Company Founded Financing ($M) Financial VelocityPony.ai 2016 214 71.3
Desktop Metal 2015 277 69.3
Convoy 2015 275 68.8
Cohesity 2013 410 68.3
TripActions 2015 235 58.8
Netskope 2012 400 57.1
ServiceTitan 2013 325 54.2
MediaMath 2007 605 50.4
Illumio 2013 267 44.5
Ginkgo BioWorks 2009 436 43.6
Adaptive Biotechnologies 2009 416 41.6
Root Insurance 2015 164 41.0
Vox Media 2011 324 40.5
Gusto 2011 316 39.5
TechStyle Fashion Group 2010 300 33.3
Lookout 2009 281 28.1
Pat McGrath Labs 2016 82 27.3
WalkMe 2011 217 27.1
Sweetgreen 2007 322 26.8
Rubicon Global 2008 278 25.3
Zip Recruiter 2010 219 24.3
Symphony Communication Services Holdings 2005 296 21.1
JFrog 2008 227 20.6
Supreme 1994 500 20.0
CloudFlare 2009 182 18.2
Zoom Communications 2011 143 17.9
Roblox 2004 249 16.6
Rocket Lab 2006 215 16.5
TalkDesk 2011 124 15.5
Soundhound 2005 214 15.3
Age of Learning 2007 182 15.1
Medallia 2001 255 14.2
Procore Technologies 2001 255 14.2
SMS Assist 1995 255 10.6
MarkLogic 2001 172 9.6
The Narwhal List 2019 | Impact Centre | University of Toronto 15
These results point to a sense of cautious optimism in Canada’s technology space. Although we have made significant progress and have continued to leverage our investments in startups and incubation, our analysis suggests that we have significant work ahead of us. For example, while the 28 Canadian firms with a financial velocity of $10-33 million per year have raised, on average, $140 million in 2018 (up from $105 million in 2017), the smallest American Unicorns have accumulated nearly double that amount in the same timespan: $275 million per firm in 2018, (up from $202 million in 2017).
Based on these numbers, one can argue that to turn 28 Narwhals into Unicorns, they must raise another $135 million (on average) at valuations that would qualify them for entry into the Unicorn Club. The sheer difference in scale between investments available to technology firms in Canada and the US is a stark reminder that we have to be significantly smarter about how we nurture and invest in Canadian technology companies.
Even as Canadian Unicorns continue to grow and eventually go public, the challenge is not to lose sight of the whole pipeline. We have to continue to produce a steady stream of startups that can grow and have all the supports necessary to become members of the exclusive Narwhal List and Unicorn Club.
The Narwhal List 2019 | Impact Centre | University of Toronto 16
This study looked at the fundraising patterns of over 1,000 private VC-funded Canadian technology product businesses listed on the CB Insights’ database as at December 31, 2018. It also looked at an equivalent number of companies identified by Crunchbase. All amounts are stated in US dollars. Additionally, we examined the results of those companies identified by CB Insights as Unicorns.
The data were only collected from public sources and may therefore be incomplete. Despite our best efforts, we may have omitted a company that belongs on the Narwhal List or may have included one that does not fit. All efforts were made to check the veracity of the data. Please note that all readers are encouraged to report errors or omissions. If we have made a mistake in reporting any company statistics or have inadvertently left off a company, please contact us and we will be pleased to update the list in a subsequent release.
This study was not intended to be academically rigorous; nor was it intended to be all-encompassing about the topic of financial velocity and business potential. It was designed only to add to the conversation on innovation and highlight areas worthy of future research by looking at data available from publicly available sources. We plan to continue exploring and developing research on the subject in future Impact Briefs.
Methodology
The Narwhal List 2019 | Impact Centre | University of Toronto 17
About the Impact Centre
We generate impact through industry projects and partnerships, entrepreneurial companies, training and research.
We bridge the gap between the university and industry to accelerate the development of new or improved products and services based on physical technologies. We work with graduate students and researchers to help them commercialize their discoveries. We provide undergraduate education and training for students at all levels to ease their transition into future careers.
The Impact Centre conducts research on all aspects of innovation, from ideation and commercialization to government policy and broader themes such as the connection between science and international development. We study how companies of all sizes navigate the complex path between a discovery and its market and how their collective innovations add up to create a larger socioeconomic impact.
Our objective is to understand how we can improve our ability to create world-class technology companies, how governments, companies, and academia can identify and adopt best practices in technology commercialization.
Science to Society
Impact Briefs
Charles PlantAuthorSenior [email protected]@cplant
Emina VeletanlicEditorManager, Strategic [email protected]@EminaVeletanlic
James Li
Harim Ulfig
Leo Mui
Contributors
Read our collection of Impact Briefs: www.impactbriefs.ca

The Narwhal List 2019 | Impact Centre | University of Toronto 18
Impact CentreSuite 411 - 112 College StreetToronto, OntarioCanada M5G 1L6
Tel: [email protected]