Embed Size (px)
Citation preview

The Narragansett Electric Company d/b/a National Grid INVESTIGATION AS TO THE PROPRIETY OF PROPOSED TARIFF CHANGES Appendices and Workpapers of: Power Sector Transformation Panel Book 3 of 3 REDACTED November 27, 2017 Submitted to: Rhode Island Public Utilities Commission RIPUC Docket No. 4770 Submitted by:

W
orkpaper 3.1

THE NARRAGANSETT ELECTRIC COMPANY d/b/a NATIONAL GRID RIPUC Docket No. 4770
Witness: Sheridan
Workpaper 3.1,
Modern Grid Costs
Rhode Island Only Deployment Scenario
1
THE NARRAGANSETT ELECTRIC COMPANY d/b/a NATIONAL GRID RIPUC Docket No. 4770
Workpaper 3.1 - Modern Grid Costs for Rhode Island Only Deployment Scenario
Page 1 of 15
WORKPAPER 3.1 – MODERN GRID COSTS FOR RHODE ISLAND ONLY DEPLOYMENT
SCENARIO
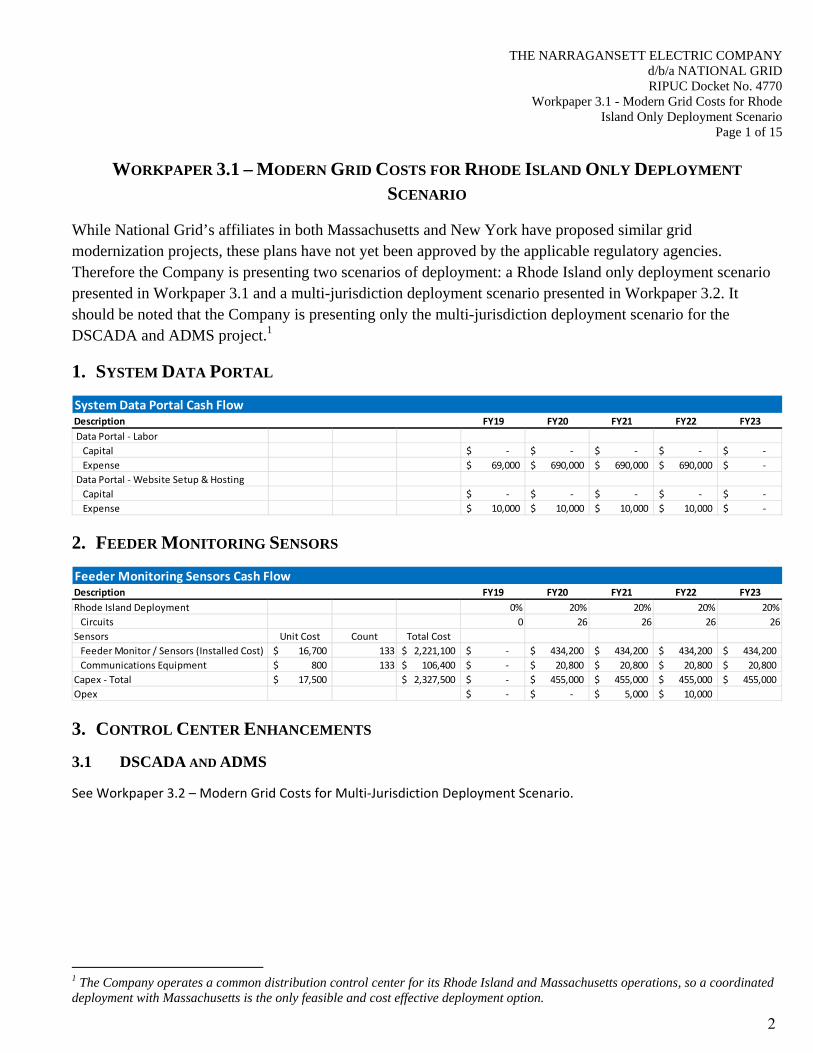
While National Grid’s affiliates in both Massachusetts and New York have proposed similar grid modernization projects, these plans have not yet been approved by the applicable regulatory agencies. Therefore the Company is presenting two scenarios of deployment: a Rhode Island only deployment scenario presented in Workpaper 3.1 and a multi-jurisdiction deployment scenario presented in Workpaper 3.2. It should be noted that the Company is presenting only the multi-jurisdiction deployment scenario for the DSCADA and ADMS project.1
1. SYSTEM DATA PORTAL
2. FEEDER MONITORING SENSORS
3. CONTROL CENTER ENHANCEMENTS
3.1 DSCADA AND ADMS
See Workpaper 3.2 – Modern Grid Costs for Multi‐Jurisdiction Deployment Scenario.
1 The Company operates a common distribution control center for its Rhode Island and Massachusetts operations, so a coordinated deployment with Massachusetts is the only feasible and cost effective deployment option.
System Data Portal Cash FlowDescription FY19 FY20 FY21 FY22 FY23
Data Portal ‐ Labor
Capital ‐$ ‐$ ‐$ ‐$ ‐$
Expense 69,000$ 690,000$ 690,000$ 690,000$ ‐$
Data Portal ‐ Website Setup & Hosting
Capital ‐$ ‐$ ‐$ ‐$ ‐$
Expense 10,000$ 10,000$ 10,000$ 10,000$ ‐$
Feeder Monitoring Sensors Cash FlowDescription FY19 FY20 FY21 FY22 FY23
Rhode Island Deployment 0% 20% 20% 20% 20%
Circuits 0 26 26 26 26
Sensors Unit Cost Count Total Cost
Feeder Monitor / Sensors (Installed Cost) 16,700$ 133 2,221,100$ ‐$ 434,200$ 434,200$ 434,200$ 434,200$
Communications Equipment 800$ 133 106,400$ ‐$ 20,800$ 20,800$ 20,800$ 20,800$
Capex ‐ Total 17,500$ 2,327,500$ ‐$ 455,000$ 455,000$ 455,000$ 455,000$
Opex ‐$ ‐$ 5,000$ 10,000$
2

THE NARRAGANSETT ELECTRIC COMPANY d/b/a NATIONAL GRID RIPUC Docket No. 4770
Workpaper 3.1 - Modern Grid Costs for Rhode Island Only Deployment Scenario
Page 2 of 15
3.2 REMOTE TERMINAL UNIT (RTU) SEPARATION
3.3 GIS DATA ENHANCEMENT (IS)
RTU Separation Cash FlowDescription FY19 FY20 FY21 FY22 FY23
Rhode Island Deployment 0% 33% 56% 11% 0%
RTU Separation Unit Cost Count Total Cost
New RTU 374,000$ 3 1,122,000$ ‐$ 373,626$ 623,832$ 124,542$ ‐$
RTU Reconfiguration 10,000$ 59 590,000$ ‐$ 196,470$ 328,040$ 65,490$ ‐$
Capex ‐ Total 1,712,000$ ‐$ 570,096$ 951,872$ 190,032$ ‐$
Opex ‐$ 60,000$ 60,000$ 60,000$ ‐$
GIS Data Enchancement Cash Flow ($M)
Yr 1 Yr 2 Yr 3 Yr 4 Yr 5
Description Category Type FY 19 FY 20 FY 21 FY 22 FY 23
512.01 Cost of Internal Resources Opex Labor 2.44$ ‐$ ‐$ ‐$ ‐$
512.02 Cost of Project Management Opex Labor 0.61$ ‐$ ‐$ ‐$ ‐$
Total 3.05$ ‐$ ‐$ ‐$ ‐$
GIS Data Enchancement Calculations
Description / Calculation Type Category Value ($M)
Number of Internal Resources 11
x Months in a year 12
x Working Days per month 21
x Working Hours per day 8
x FTE Internal Hourly IS Rate 100.00$
x Implementation Duration 1.0
512.01 = Cost of Internal Resources Labor Opex 2.22$
Cost of Internal Resources 2.22$
x Project Management Percentage 25%
512.02 = Cost of Project Management Labor Opex 0.55$
3

THE NARRAGANSETT ELECTRIC COMPANY d/b/a NATIONAL GRID RIPUC Docket No. 4770
Workpaper 3.1 - Modern Grid Costs for Rhode Island Only Deployment Scenario
Page 3 of 15
3.4 GIS DATA ENHANCEMENT (NON-IS)
GIS Data Enhancment (Non‐IS) Cash Flow ($M)Description FY19 FY20 FY21 FY22 FY23
Rhode Island Deployment 0% 0% 33% 33% 33%
Capex ‐ Total ‐$ ‐$ ‐$ ‐$ ‐$
Opex ‐$ ‐$ 1.03$ 1.03$ 1.03$
GIS Data Enhancement (Non‐IS) Calculations
Project Element Description RI Estimate
DG
This effort will focus on the DG data model and functionality in GIS to ensure that
the system will be capable of supplying the information required by DSIP
investments. Beyond the system review and development, full population of DG
locations and attributes will be completed.
$32,778
General Data Collection
This effort is focused on improving data quality of existing data through leveraging
issues found during model builds, operating knowledge and known areas of
concern. The intent of this effort is to eliminate errors related to network
topology, attribute level inconsistencies and to apply additional system
validations to drive improved data quality moving forward.
$1,060,102
New Attributes
Will be made available and where it will be stored will be developed and
migration or creation of this data will be completed. Additionally, validations and
cross system keys will be established to drive quality and synchronization.
$454,365
Networks
To address known needs related to modelling downtown GIS networks this effort
would focus on creating an underground focused data model, population of
available data (including potential field checks) and integration of inspections
with GIS for enhancing data quality moving forward.
$845,169
Secondary
GIS currently does not fully model secondary systems. This effort would be a
multi‐year effort to fully populate the system. Additional considerations will be
updating connect model export techniques to get the data to downstream
systems, including ADMS.
$481,865
Substation Modelling
Substation assets are kept in the Cascade system but only peripherally modelled
in GIS. This effort would interface these systems – creating a GIS substation data
model that incorporates network connectivity considerations between
Transmission and Distribution to provide data that will be used to inform ADMS
and load flow planning models
$93,737
Connected Model Export
This effort will seek to replace or enhance current capabilities utilized to export
information from GIS to downstream systems including CYME, OMS and ADMS.
The current process is highly customized but very use specific and does not meet
emerging and future needs.
$114,751
Opex ‐ Total $3,082,767
4

THE NARRAGANSETT ELECTRIC COMPANY d/b/a NATIONAL GRID RIPUC Docket No. 4770
Workpaper 3.1 - Modern Grid Costs for Rhode Island Only Deployment Scenario
Page 4 of 15
4. OPERATIONAL DATA MANAGEMENT
4.1 ENTERPRISE SERVICE BUS (ESB)
ESB Cash Flow ($M)
Yr 1 Yr 2 Yr 3 Yr 4 Yr 5
# Description Category Type FY 19 FY 20 FY 21 FY 22 FY 23
514.01 CAPEX Distribution ESB DB & RAC Software Capex NonLabor ‐$ 1.55$ ‐$ ‐$ ‐$
514.02 RTB Distribution ESB DB & RAC Software RTB NonLabor ‐$ ‐$ 0.08$ 0.08$ ‐$
514.03 Refresh Distribution ESB DB & RAC Software Capex NonLabor ‐$ ‐$ ‐$ ‐$ ‐$
514.04 CAPEX Distribution ESB MiddleWare Capex NonLabor ‐$ ‐$ 3.48$ ‐$ ‐$
514.05 RTB Distribution ESB MiddleWare RTB NonLabor ‐$ ‐$ ‐$ 0.18$ ‐$
514.06 Refresh Distribution ESB MiddleWare Capex NonLabor ‐$ ‐$ ‐$ ‐$ ‐$
514.07 CAPEX Distribution ESB SW/MW Installation Capex Labor ‐$ 1.71$ 1.71$ ‐$ ‐$
514.08 OPEX Distribution ESB SW/MW Installation Opex Labor ‐$ 0.28$ 0.28$ ‐$ ‐$
514.09 RTB Distribution ESB SW/MW Support RTB Labor ‐$ ‐$ 0.30$ 0.60$ ‐$
514.10 Refresh Distribution ESB SW/MW Capex Labor ‐$ ‐$ ‐$ ‐$ ‐$
514.11 RTB Cloud & Managed Services RTB NonLabor ‐$ 0.16$ 0.16$ 0.16$ ‐$
514.12 CAPEX Comprehensive Integration Services Capex Labor ‐$ 2.24$ 3.73$ 1.49$ ‐$
514.13 OPEX Comprehensive Integration Services Opex Labor ‐$ 0.36$ 0.60$ 0.24$ ‐$
514.14 RTB Comprehensive Integration Services RTB Labor ‐$ ‐$ 0.53$ 0.79$ ‐$
Total ‐$ 6.30$ 10.87$ 3.54$ ‐$
5

THE NARRAGANSETT ELECTRIC COMPANY d/b/a NATIONAL GRID RIPUC Docket No. 4770
Workpaper 3.1 - Modern Grid Costs for Rhode Island Only Deployment Scenario
Page 5 of 15
ESB Calculations
Description/Calculation Category Type Value ($M)
DB & RAC Total License Cost before May'17 1,191,754$
514.01 = CAPEX Distribution ESB DB & RAC Software Capex NonLabor 1.19$
DB & RAC Annual S&M 79,054$
514.02 = RTB Distribution ESB DB & RAC Software RTB NonLabor 0.08$
DB & RAC Total License Cost before May'17 1,191,754$
x ESB refresh cost reduction 50%
514.03 = Refresh Distribution ESB DB & RAC Software Capex NonLabor 0.60$
MW Total License Cost before Nov'17 2,674,031$
514.04 = CAPEX Distribution ESB MiddleWare Capex NonLabor 2.67$
MW Annual S&M 177,378$
514.05 = RTB Distribution ESB MiddleWare RTB NonLabor 0.18$
MW Total License Cost before Nov'17 2,674,031$
x ESB refresh cost reduction 50%
514.06 = Refresh Distribution ESB MiddleWare Capex NonLabor 1.34$
Total Labor CAPEX Cost Estimate 2,856,000$
514.07 = CAPEX Distribution ESB SW/MW Installation Capex Labor 2.86$
Total Labor OPEX Cost Estimate 504,000$
514.08 = OPEX Distribution ESB SW/MW Installation Opex Labor 0.50$
RTB Labor Costs 600,000$
514.09 = RTB Distribution ESB SW/MW Support RTB Labor 0.60$
CAPEX Distribution ESB SW/MW Installation 2.86$
+ OPEX Distribution ESB SW/MW Installation 0.50$
x ESB refresh cost reduction 50%
514.10 = Refresh Distribution ESB SW/MW Capex Labor 1.68$
Monthly Cloud Costs w/Managed Service included 13,486$
x Months in a year 12
514.11 = RTB Cloud & Managed Services RTB NonLabor 0.16$
6

THE NARRAGANSETT ELECTRIC COMPANY d/b/a NATIONAL GRID RIPUC Docket No. 4770
Workpaper 3.1 - Modern Grid Costs for Rhode Island Only Deployment Scenario
Page 6 of 15
4.2 DATA MANAGEMENT AND ANALYTICS
ESB Calculations
Description/Calculation Category Type Value ($M)
Total Hours for Large Integrations 11520
+
Total Hours for Medium Integrations 18640
+
Total Hours for Small Integrations 32880
= Total Hours for ALL Integrations 63040
Total External Costs 6.05$
+
Total Internal Costs 1.26$
= Total ESB Costs 7.31$
Total ESB Costs 7.31$
x CAPEX Allocations 85%
514.12 = CAPEX Comprehensive Integration Services Capex Labor 6.22$
Total ESB Costs 7.31$
x OPEX Allocations 15%
514.13 = OPEX Comprehensive Integration Services Opex Labor 1.10$
Total ESB Costs 7.31$
x System Maintenance Costs % 10%
= Total YOY System Maintenance Cost 0.73$
+ Platform Support from ESB/CIM 0.22$
514.14 = RTB Comprehensive Integration Services RTB Labor 0.95$
Data Lake Cloud Hosting Cash Flow ($M)
Yr ‐1 Yr ‐2 Yr ‐3 Yr ‐4 Yr ‐5
# Description Category Type
FY19 FY20 FY21 FY22 FY23
517.01 CAPEX Development Data Lake Opex NonLabor ‐$ 0.02$ 0.02$ 0.02$ 0.02$
517.02 CAPEX QA Data Lake Opex NonLabor ‐$ 0.04$ 0.04$ 0.04$ 0.04$
517.03 CAPEX Production Data Lake Opex NonLabor ‐$ 0.14$ 0.33$ 0.51$ 0.60$
517.04 CAPEX Dashboard Environment Opex NonLabor ‐$ 0.32$ 0.32$ 0.32$ 0.32$
517.05 RTB Platform Maintenance & Support RTB Labor ‐$ ‐$ 0.50$ 0.75$ 0.75$
517.06 CAPEX Platform Setup Capex Labor ‐$ 1.39$ ‐$ ‐$ ‐$
517.07 OPEX Platform Design Opex Labor ‐$ 0.32$ ‐$ ‐$ ‐$
Total ‐$ 2.24$ 1.21$ 1.64$ 1.73$
7
THE NARRAGANSETT ELECTRIC COMPANY d/b/a NATIONAL GRID RIPUC Docket No. 4770
Workpaper 3.1 - Modern Grid Costs for Rhode Island Only Deployment Scenario
Page 7 of 15
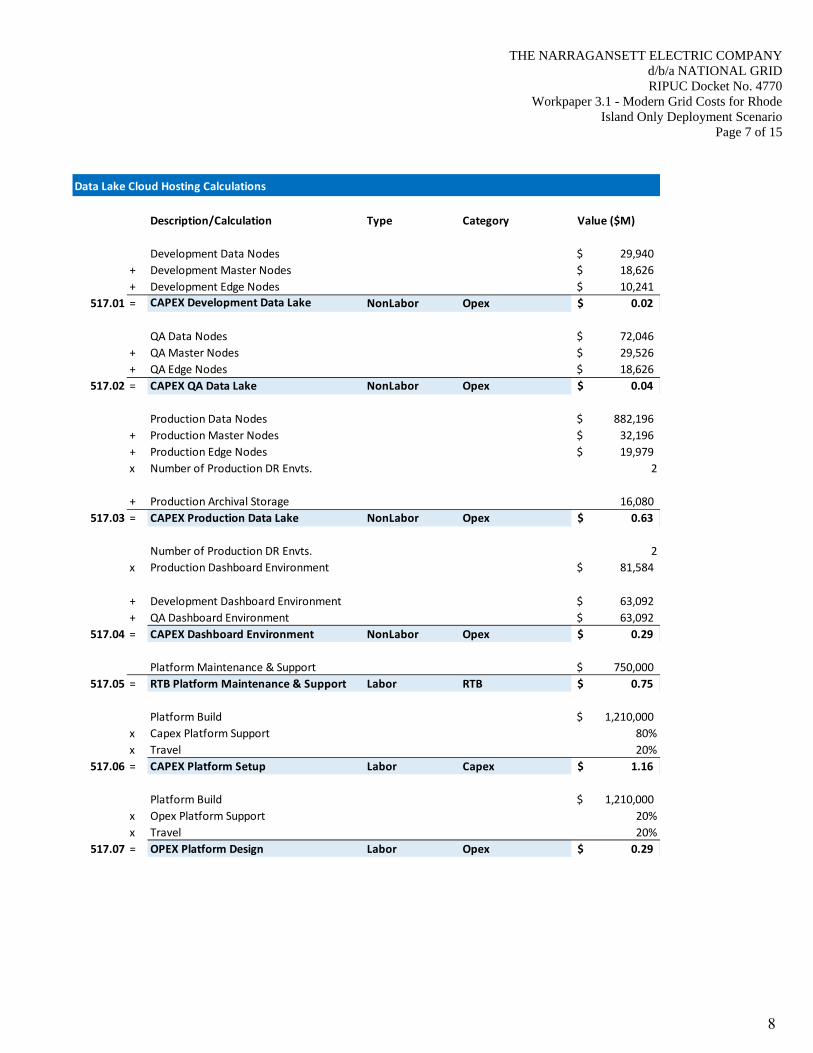
Data Lake Cloud Hosting Calculations
Description/Calculation Type Category Value ($M)
Development Data Nodes 29,940$
+ Development Master Nodes 18,626$
+ Development Edge Nodes 10,241$
517.01 = CAPEX Development Data Lake NonLabor Opex 0.02$
QA Data Nodes 72,046$
+ QA Master Nodes 29,526$
+ QA Edge Nodes 18,626$
517.02 = CAPEX QA Data Lake NonLabor Opex 0.04$
Production Data Nodes 882,196$
+ Production Master Nodes 32,196$
+ Production Edge Nodes 19,979$
x Number of Production DR Envts. 2
+ Production Archival Storage 16,080
517.03 = CAPEX Production Data Lake NonLabor Opex 0.63$
Number of Production DR Envts. 2
x Production Dashboard Environment 81,584$
+ Development Dashboard Environment 63,092$
+ QA Dashboard Environment 63,092$
517.04 = CAPEX Dashboard Environment NonLabor Opex 0.29$
Platform Maintenance & Support 750,000$
517.05 = RTB Platform Maintenance & Support Labor RTB 0.75$
Platform Build 1,210,000$
x Capex Platform Support 80%
x Travel 20%
517.06 = CAPEX Platform Setup Labor Capex 1.16$
Platform Build 1,210,000$
x Opex Platform Support 20%
x Travel 20%
517.07 = OPEX Platform Design Labor Opex 0.29$
8

THE NARRAGANSETT ELECTRIC COMPANY d/b/a NATIONAL GRID RIPUC Docket No. 4770
Workpaper 3.1 - Modern Grid Costs for Rhode Island Only Deployment Scenario
Page 8 of 15
PI Historian Cash Flow ($M)
Yr ‐ 1 Yr ‐ 2 Yr ‐ 3 Yr ‐ 4 Yr ‐ 5
# Description Category Type FY19 FY20 FY21 FY22 FY23
515.02 OPEX PI Historian EA License Opex NonLabor ‐$ ‐$ 2.00$ 2.00$ ‐$
515.04 CAPEX Server Costing Capex NonLabor ‐$ 0.08$ ‐$ ‐$ ‐$ 515.05 CAPEX Hardware Installation Cost Capex NonLabor ‐$ 0.05$ ‐$ ‐$ ‐$
515.06 RTB Hardware Support Cost RTB Labor ‐$ 0.03$ 0.03$ 0.03$ 0.03$
515.07 RTB Backup Storage Cost ‐ PI Servers RTB NonLabor ‐$ 0.02$ 0.02$ 0.02$ 0.02$
515.08 CAPEX Application Installation Cost Capex Labor ‐$ 0.32$ ‐$ ‐$ ‐$
515.09 RTB Application Maintenance & Support RTB Labor ‐$ ‐$ ‐$ ‐$ ‐$
Total ‐$ 0.50$ 2.05$ 2.05$ 0.05$
PI Historian Calculations
Description/Calculation Type Category Value ($M)
PI EA License Cost Opex 2,000,000$
515.02 = OPEX PI Historian EA License NonLabor Opex 2.00$
Total Number of Servers 8
x Hardware Cost per Server 10,000$
515.04 = CAPEX Server Costing NonLabor Capex 0.08$
Installation Cost per Server (CSC) 6,364$
x Total Number of Servers 8
515.05 = CAPEX Hardware Installation Cost NonLabor Capex 0.05$
Annual Server Support Cost (CSC Gold Support) 3,673$
x Total Number of Servers 8
515.06 = RTB Hardware Support Cost Labor RTB 0.03$
Cost per GB 0
x Number of Storage Backups (CSC) 2
x PI Storage (GBs) 3,000$
x Months in a year 12
x Servers that require storage backup (PI) 2
515.07 = RTB Backup Storage Cost ‐ PI Servers NonLabor RTB 0.02$
Development Hours 2665
x FTE Internal Hourly IS Rate 100$
Total Development Hours 0.27$
+ Travel 20%
515.08 = CAPEX Application Installation Cost Labor Capex 0.32$
PI Historian (Maintenance & Support) FTE 1
x Months in a year 12
x Working Days per Month 21
x Working Hours per Day 8
x FTE Internal Hourly IS Rate 100$
515.09 = RTB Application Maintenance & Support Labor RTB 0.20$
9
THE NARRAGANSETT ELECTRIC COMPANY d/b/a NATIONAL GRID RIPUC Docket No. 4770
Workpaper 3.1 - Modern Grid Costs for Rhode Island Only Deployment Scenario
Page 9 of 15
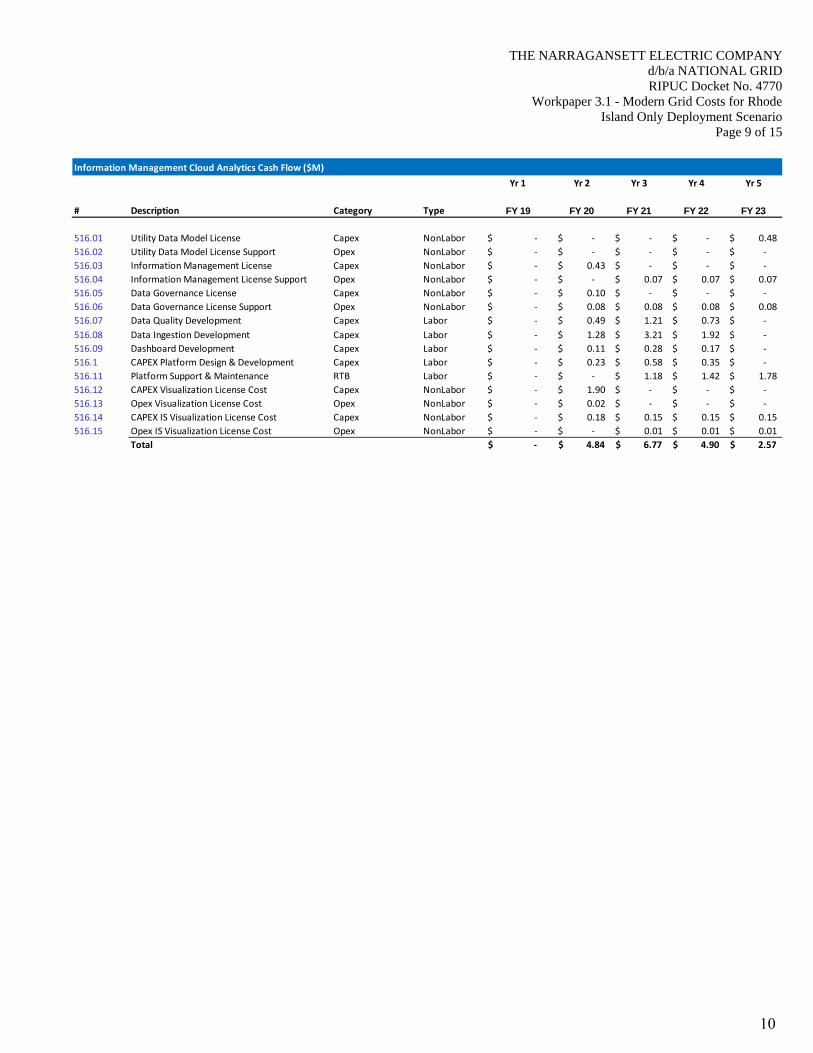
Information Management Cloud Analytics Cash Flow ($M)
Yr 1 Yr 2 Yr 3 Yr 4 Yr 5
# Description Category Type FY 19 FY 20 FY 21 FY 22 FY 23
516.01 Utility Data Model License Capex NonLabor ‐$ ‐$ ‐$ ‐$ 0.48$
516.02 Utility Data Model License Support Opex NonLabor ‐$ ‐$ ‐$ ‐$ ‐$
516.03 Information Management License Capex NonLabor ‐$ 0.43$ ‐$ ‐$ ‐$
516.04 Information Management License Support Opex NonLabor ‐$ ‐$ 0.07$ 0.07$ 0.07$
516.05 Data Governance License Capex NonLabor ‐$ 0.10$ ‐$ ‐$ ‐$
516.06 Data Governance License Support Opex NonLabor ‐$ 0.08$ 0.08$ 0.08$ 0.08$
516.07 Data Quality Development Capex Labor ‐$ 0.49$ 1.21$ 0.73$ ‐$
516.08 Data Ingestion Development Capex Labor ‐$ 1.28$ 3.21$ 1.92$ ‐$
516.09 Dashboard Development Capex Labor ‐$ 0.11$ 0.28$ 0.17$ ‐$
516.1 CAPEX Platform Design & Development Capex Labor ‐$ 0.23$ 0.58$ 0.35$ ‐$
516.11 Platform Support & Maintenance RTB Labor ‐$ ‐$ 1.18$ 1.42$ 1.78$
516.12 CAPEX Visualization License Cost Capex NonLabor ‐$ 1.90$ ‐$ ‐$ ‐$
516.13 Opex Visualization License Cost Opex NonLabor ‐$ 0.02$ ‐$ ‐$ ‐$
516.14 CAPEX IS Visualization License Cost Capex NonLabor ‐$ 0.18$ 0.15$ 0.15$ 0.15$
516.15 Opex IS Visualization License Cost Opex NonLabor ‐$ ‐$ 0.01$ 0.01$ 0.01$
Total ‐$ 4.84$ 6.77$ 4.90$ 2.57$
10

THE NARRAGANSETT ELECTRIC COMPANY d/b/a NATIONAL GRID RIPUC Docket No. 4770
Workpaper 3.1 - Modern Grid Costs for Rhode Island Only Deployment Scenario
Page 10 of 15
Information Management Cloud Analytics Calculations
Description/Calculation Category Type Value
Utility Data Model License 366,746.48$
516.01 = Utility Data Model License Capex NonLabor 0.37$
Utility Data Model License Support 73,349.30$
516.02 = Utility Data Model License Support Opex NonLabor 0.07$
Information Management License 331,457.37$
516.03 = Information Management License Capex NonLabor 0.33$
Information Management License Support 66,291.47$
516.04 = Information Management License Support Opex NonLabor 0.07$
Data Governance License 77,142.00$
516.05 = Data Governance License Capex NonLabor 0.08$
Data Governance License Support 77,142.00$
516.06 = Data Governance License Support Opex NonLabor 0.08$
Data Quality Dev Hours 16857
x FTE External (subcontractor; non‐specialist) Hourly IS Rate 100$
x Travel 20%
516.07 = Data Quality Development Capex Labor 2.02$
ETL Dev Hours 44547
x FTE External (subcontractor; non‐specialist) Hourly IS Rate 100$
x Travel 20%
516.08 = Data Ingestion Development Capex Labor 5.35$
Dashboard Dev Hours 3851
x FTE External (subcontractor; non‐specialist) Hourly IS Rate 100$
x Travel 20%
516.09 = Dashboard Development Capex Labor 0.46$
Platform Development Effort 1,198,000$
x Capex Allocation 80%
516.10 = CAPEX Platform Design & Development Capex Labor 0.96$
11

THE NARRAGANSETT ELECTRIC COMPANY d/b/a NATIONAL GRID RIPUC Docket No. 4770
Workpaper 3.1 - Modern Grid Costs for Rhode Island Only Deployment Scenario
Page 11 of 15
5. TELECOMMUNICATIONS
Information Management Cloud Analytics Calculations
Description/Calculation Category Type Value
Platform Development Effort 1,198,000$
x Opex Allocation 20%
516.16 = OPEX Platform Design & Development Opex Labor 0.24$
Platform Support & Maintenance 1,782,000$
516.11 = Platform Support & Maintenance RTB Labor 1.78$
Visualization License ‐ Business 7,934,000$
NY Cost Factor 18%
516.12 = CAPEX Visualization License Cost Capex NonLabor 1.46$
Visualization License Maintenance ‐ Business 115,000$
NY Cost Factor 18%
516.13 = Opex Visualization License Cost Opex NonLabor 0.02$
Tableau Desktop License 1,999$
+ Tableau Server License 1,000$
+ Alteryx Designer License 5,195$
x Number of Licenses 10
+
Alteryx Server License 58,500$
x Number of Alteryx Servers 1
516.14 = CAPEX IS Visualization License Cost Capex NonLabor 0.14$
Tableau Desktop License 1,999$
+ Tableau Server License 1,000$
x Number of Licenses 10
x Tableau Server Maintenace Cost 25%
516.15 = Opex IS Visualization License Cost Opex NonLabor 0.01$
Telecom Non‐Inflated Cash Flow ($M)
Yr 1 Yr 2 Yr 3 Yr 4 Yr 5
# Description Category Type FY 19 FY 20 FY 21 FY 22 FY 23
513.08 CAPEX Corporate Backbone Expansion Capex NonLabor ‐$ 0.06$ 0.03$ 0.03$ ‐$
513.09 RTB Corpate Backbone Expansion RTB NonLabor ‐$ ‐$ 0.18$ 0.27$ 0.36$
513.10 CAPEX IT/OT Backbone Expansion Capex NonLabor ‐$ 0.15$ 0.07$ 0.07$ ‐$
513.11 RTB IT/OT Backbone Expansion RTB NonLabor ‐$ ‐$ 1.62$ 2.43$ 3.24$
513.12 CAPEX IT/OT Mesh Network Backhaul Capex NonLabor ‐$ 0.10$ 0.05$ 0.05$ ‐$
513.13 RTB IT/OT Mesh Network Backhaul RTB NonLabor ‐$ ‐$ 0.15$ 0.23$ 0.30$
Total ‐$ 0.30$ 2.10$ 3.08$ 3.90$
12

THE NARRAGANSETT ELECTRIC COMPANY d/b/a NATIONAL GRID RIPUC Docket No. 4770
Workpaper 3.1 - Modern Grid Costs for Rhode Island Only Deployment Scenario
Page 12 of 15
Telecom Calculations
Description/Calculation Category Type Value ($M)
SCI Implementation Cost 60,000$
+
Data Center Bandwidth Increase Cost 16,500$
x Number of circuits 2
513.08 = CAPEX Corporate Backbone Expansion Capex NonLabor 0.09$
Monthly SCI Service Cost 4,000$
x 0 0
+
Monthly Data Center Bandwidth Increase 15,000$
x Months in a year 12
x Number of circuits 2
513.09 = RTB Corpate Backbone Expansion RTB NonLabor 0.36$
POPs Bandwidth Implementation cost 30,000$
x Number of Locations (POPs) 6
+
CSC Data Center Bandwidth cost 22,500$
x Number of connections 2
513.10 = CAPEX IT/OT Backbone Expansion Capex NonLabor 0.23$
Monthly cost of POP bandwidth 35,000$
x Months in a year 12
x Number of Locations (POPs) 6
+
Monthly cost of CSC bandwidth 30,000$
x Months in a year 12
x Number of connections 2
513.11 = RTB IT/OT Backbone Expansion RTB NonLabor 3.24$
Wireless gateway planning and configuration 50,000$
+
Stand up of wireless gateway 75,000$
x Number of gateways 1
+
Set up of CSC bandwidth and VRFs 25,000$
x Number of data center links 1
513.12 = CAPEX IT/OT Mesh Network Backhaul Capex NonLabor 0.15$
Monthly cost of wireless gateway 20,000$
x Months in a year 12
x Number of gateways 1
+
Monthly cost of CSC data center link increase 5,000$
x Months in a year 12
x Number of data center links 1
513.13 = RTB IT/OT Mesh Network Backhaul RTB NonLabor 0.30$
13
THE NARRAGANSETT ELECTRIC COMPANY d/b/a NATIONAL GRID RIPUC Docket No. 4770
Workpaper 3.1 - Modern Grid Costs for Rhode Island Only Deployment Scenario
Page 13 of 15
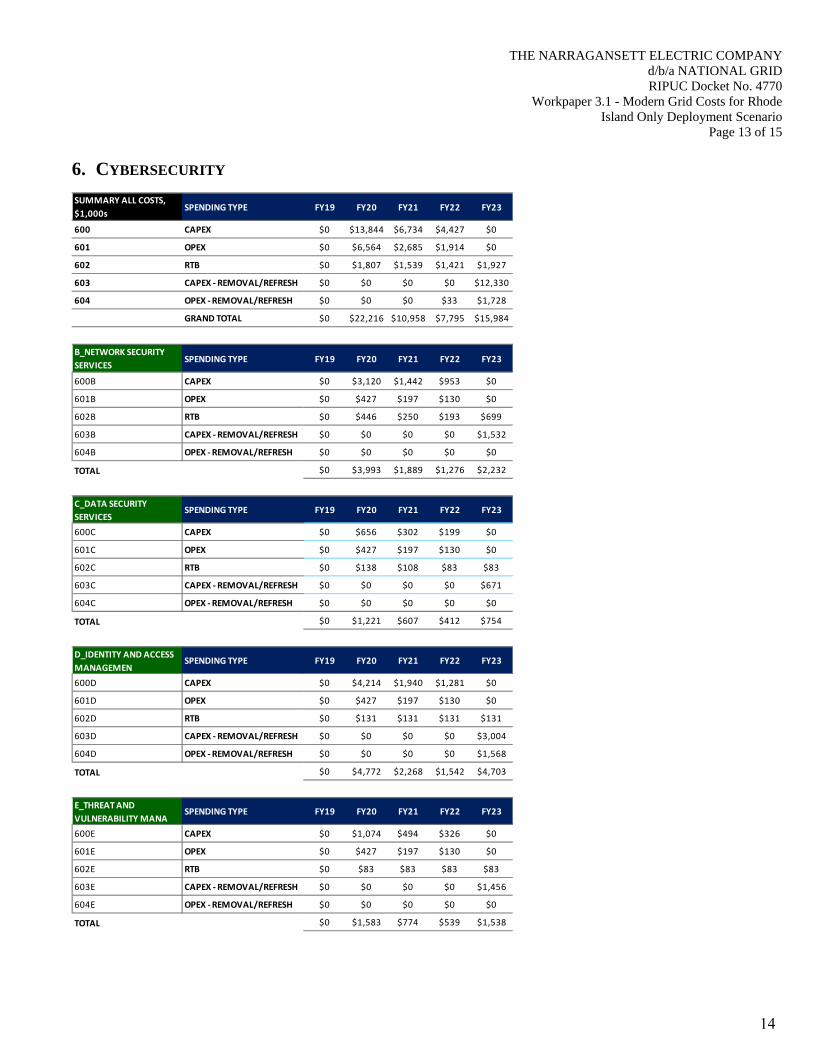
6. CYBERSECURITY
SUMMARY ALL COSTS,
$1,000sSPENDING TYPE FY19 FY20 FY21 FY22 FY23
600 CAPEX $0 $13,844 $6,734 $4,427 $0
601 OPEX $0 $6,564 $2,685 $1,914 $0
602 RTB $0 $1,807 $1,539 $1,421 $1,927
603 CAPEX ‐ REMOVAL/REFRESH $0 $0 $0 $0 $12,330
604 OPEX ‐ REMOVAL/REFRESH $0 $0 $0 $33 $1,728
GRAND TOTAL $0 $22,216 $10,958 $7,795 $15,984
B_NETWORK SECURITY
SERVICESSPENDING TYPE FY19 FY20 FY21 FY22 FY23
600B CAPEX $0 $3,120 $1,442 $953 $0
601B OPEX $0 $427 $197 $130 $0
602B RTB $0 $446 $250 $193 $699
603B CAPEX ‐ REMOVAL/REFRESH $0 $0 $0 $0 $1,532
604B OPEX ‐ REMOVAL/REFRESH $0 $0 $0 $0 $0
TOTAL $0 $3,993 $1,889 $1,276 $2,232
C_DATA SECURITY
SERVICESSPENDING TYPE FY19 FY20 FY21 FY22 FY23
600C CAPEX $0 $656 $302 $199 $0
601C OPEX $0 $427 $197 $130 $0
602C RTB $0 $138 $108 $83 $83
603C CAPEX ‐ REMOVAL/REFRESH $0 $0 $0 $0 $671
604C OPEX ‐ REMOVAL/REFRESH $0 $0 $0 $0 $0
TOTAL $0 $1,221 $607 $412 $754
D_IDENTITY AND ACCESS
MANAGEMENSPENDING TYPE FY19 FY20 FY21 FY22 FY23
600D CAPEX $0 $4,214 $1,940 $1,281 $0
601D OPEX $0 $427 $197 $130 $0
602D RTB $0 $131 $131 $131 $131
603D CAPEX ‐ REMOVAL/REFRESH $0 $0 $0 $0 $3,004
604D OPEX ‐ REMOVAL/REFRESH $0 $0 $0 $0 $1,568
TOTAL $0 $4,772 $2,268 $1,542 $4,703
E_THREAT AND
VULNERABILITY MANASPENDING TYPE FY19 FY20 FY21 FY22 FY23
600E CAPEX $0 $1,074 $494 $326 $0
601E OPEX $0 $427 $197 $130 $0
602E RTB $0 $83 $83 $83 $83
603E CAPEX ‐ REMOVAL/REFRESH $0 $0 $0 $0 $1,456
604E OPEX ‐ REMOVAL/REFRESH $0 $0 $0 $0 $0
TOTAL $0 $1,583 $774 $539 $1,538
14

THE NARRAGANSETT ELECTRIC COMPANY d/b/a NATIONAL GRID RIPUC Docket No. 4770
Workpaper 3.1 - Modern Grid Costs for Rhode Island Only Deployment Scenario
Page 14 of 15
F_SECURITY OPERATIONS
CENTER SESPENDING TYPE FY19 FY20 FY21 FY22 FY23
600F CAPEX $0 $1,277 $588 $388 $0
601F OPEX $0 $427 $197 $130 $0
602F RTB $0 $89 $89 $89 $89
603F CAPEX ‐ REMOVAL/REFRESH $0 $0 $0 $0 $624
604F OPEX ‐ REMOVAL/REFRESH $0 $0 $0 $7 $7
TOTAL $0 $1,793 $873 $614 $719
G_HOST & ENDPOINT
SECURITY SERVSPENDING TYPE FY19 FY20 FY21 FY22 FY23
600G CAPEX $0 $523 $250 $170 $0
601G OPEX $0 $441 $210 $130 $0
602G RTB $0 $83 $83 $83 $83
603G CAPEX ‐ REMOVAL/REFRESH $0 $0 $0 $0 $483
604G OPEX ‐ REMOVAL/REFRESH $0 $0 $0 $0 $0
TOTAL $0 $1,047 $543 $383 $566
H_SECURITY POLICY
MANAGEMENT SESPENDING TYPE FY19 FY20 FY21 FY22 FY23
600H CAPEX $0 $523 $250 $170 $0
601H OPEX $0 $441 $210 $130 $0
602H RTB $0 $83 $83 $83 $83
603H CAPEX ‐ REMOVAL/REFRESH $0 $0 $0 $0 $483
604H OPEX ‐ REMOVAL/REFRESH $0 $0 $0 $0 $0
TOTAL $0 $1,047 $543 $383 $566
I_CRYPTOGRAPHY
SERVICESSPENDING TYPE FY19 FY20 FY21 FY22 FY23
600I CAPEX $0 $510 $235 $155 $0
601I OPEX $0 $427 $197 $130 $0
602I RTB $0 $162 $119 $83 $83
603I CAPEX ‐ REMOVAL/REFRESH $0 $0 $0 $0 $503
604I OPEX ‐ REMOVAL/REFRESH $0 $0 $0 $26 $153
TOTAL $0 $1,099 $551 $394 $740
J_CHANGE &
CONFIGURATION
MANAGE
SPENDING TYPE FY19 FY20 FY21 FY22 FY23
600J CAPEX $0 $257 $118 $78 $0
601J OPEX $0 $427 $197 $130 $0
602J RTB $0 $83 $83 $83 $83
603J CAPEX ‐ REMOVAL/REFRESH $0 $0 $0 $0 $454
604J OPEX ‐ REMOVAL/REFRESH $0 $0 $0 $0 $0
TOTAL $0 $767 $398 $291 $537
15

THE NARRAGANSETT ELECTRIC COMPANY d/b/a NATIONAL GRID RIPUC Docket No. 4770
Workpaper 3.1 - Modern Grid Costs for Rhode Island Only Deployment Scenario
Page 15 of 15
K_SECURITY AWARENESS
& TRAININGSPENDING TYPE FY19 FY20 FY21 FY22 FY23
600K CAPEX $0 $0 $0 $0 $0
601K OPEX $0 $449 $152 $152 $0
602K RTB $0 $177 $177 $177 $177
603K CAPEX ‐ REMOVAL/REFRESH $0 $0 $0 $0 $0
604K OPEX ‐ REMOVAL/REFRESH $0 $0 $0 $0 $0
TOTAL $0 $626 $329 $329 $177
L_APPLICATION SECURITY
SERVICESSPENDING TYPE FY19 FY20 FY21 FY22 FY23
600L CAPEX $0 $969 $446 $295 $0
601L OPEX $0 $633 $91 $29 $0
602L RTB $0 $83 $83 $83 $83
603L CAPEX ‐ REMOVAL/REFRESH $0 $0 $0 $0 $1,063
604L OPEX ‐ REMOVAL/REFRESH $0 $0 $0 $0 $0
TOTAL $0 $1,686 $620 $407 $1,146
M_THIRD PARTY
ASSURANCE MANAGEMSPENDING TYPE FY19 FY20 FY21 FY22 FY23
600M CAPEX $0 $0 $0 $0 $0
601M OPEX $0 $753 $0 $565 $0
602M RTB $0 $83 $83 $83 $83
603M CAPEX ‐ REMOVAL/REFRESH $0 $0 $0 $0 $0
604M OPEX ‐ REMOVAL/REFRESH $0 $0 $0 $0 $0
TOTAL $0 $836 $83 $648 $83
N_REMOTE ACCESS
SERVICESSPENDING TYPE FY19 FY20 FY21 FY22 FY23
600N CAPEX $0 $720 $668 $411 $0
601N OPEX $0 $295 $458 $0 $0
602N RTB $0 $83 $83 $83 $83
603N CAPEX ‐ REMOVAL/REFRESH $0 $0 $0 $0 $2,057
604N OPEX ‐ REMOVAL/REFRESH $0 $0 $0 $0 $0
TOTAL $0 $1,097 $1,210 $494 $2,140
O_PRIVACY SERVICES SPENDING TYPE FY19 FY20 FY21 FY22 FY23
600O CAPEX $0 $0 $0 $0 $0
601O OPEX $0 $565 $188 $0 $0
602O RTB $0 $83 $83 $83 $83
603O CAPEX ‐ REMOVAL/REFRESH $0 $0 $0 $0 $0
604O OPEX ‐ REMOVAL/REFRESH $0 $0 $0 $0 $0
TOTAL $0 $648 $271 $83 $83
16

Workpaper 3.2

THE NARRAGANSETT ELECTRIC COMPANY d/b/a NATIONAL GRID RIPUC Docket No. 4770
Witness: Sheridan
Workpaper 3.2
Modern Grid Costs for Multi-Jurisdiction Deployment Scenario
17

THE NARRAGANSETT ELECTRIC COMPANY d/b/a NATIONAL GRID RIPUC Docket No. 4770
Workpaper 3.2 - Modern Grid Costs for Multi-Jurisdiction Deployment Scenario
Page 1 of 17
1
WORKPAPER 3.2 – MODERN GRID COSTS FOR MULTI-JURISDICTION DEPLOYMENT SCENARIO
While National Grid’s affiliates in both Massachusetts and New York have proposed similar grid modernization projects, these plans have not yet been approved by the applicable regulatory agencies. Therefore the Company is presenting two scenarios of deployment: a Rhode Island only deployment scenario presented in Workpaper 3.1 and a multi-jurisdiction deployment scenario presented in Workpaper 3.2. As can be seen in Table 1.1, many of the proposed Grid Modernization projects support multiple operating companies and significant cost synergies can be realized if these investments are coordinated across the operating companies.
Table 1.1: Grid Modernization Multi-Jurisdiction Deployment Cost Allocations
Total multi-jurisdiction project cost calculations are presented below. The Rhode Island portion of these costs can be obtained by multiplying these total multi-jurisdiction costs by the relevant Rhode Island Allocation factor presented in Table 1.1 above.
1. SYSTEM DATA PORTAL
No cost synergies can be realized for this project, so multi-jurisdiction deployment is not proposed. See Workpaper 3.1 – Modern Grid Costs for Rhode Island Only Deployment Scenario for project cost details.
2. FEEDER MONITORING SENSORS
No cost synergies can be realized for this project, so multi-jurisdiction deployment is not proposed. See Workpaper 3.1 – Modern Grid Costs for Rhode Island Only Deployment Scenario for project cost details.
New York Massachusetts Rhode Island
System Data Portal* x 512,318 100%Feeder Monitoring Sensors* x 512,318 100%Control Center Enhancements*
DSCADA & ADMS x 1,372,573 512,318 27%
RTU Separation x 512,318 100%GIS Data Enhancement (IS) x x 1,718,053 1,372,573 512,318 14%
GIS Data Enhancement (BR) x 512,318 100%Operational Data Management
Enterprise Service Bus x x 2,357,546 790,721 25%
Data Lake x x 2,357,546 790,721 25%
PI Historian x x 2,357,546 790,721 25%
Advanced Analytics x x 2,357,546 790,721 25%
Telecommunications x x 2,357,546 790,721 25%
Cybersecurity x x 2,357,546 790,721 25%
*Impacts electric customers only
National Grid Customers ImpactedRI AllocationGrid Modernization Project
RI-Only Scenario
Multi-Jursidiction
Scenario
18

THE NARRAGANSETT ELECTRIC COMPANY d/b/a NATIONAL GRID RIPUC Docket No. 4770
Workpaper 3.2 - Modern Grid Costs for Multi-Jurisdiction Deployment Scenario
Page 2 of 17
2
3. CONTROL CENTER ENHANCEMENTS
3.1 DSCADA AND ADMS
DSCADA and ADMS Cash Flow ($M)
Yr 1 Yr 2 Yr 3 Yr 4 Yr 5
# Description Category Type FY 19 FY 20 FY 21 FY 22 FY 23
509.01 Total Cost of IS Resources Labor Capex ‐$ 4.14$ 6.89$ 2.76$ ‐$
509.02 Total Cost of Business Resources Labor Capex ‐$ 1.77$ 2.95$ 1.18$ ‐$
509.03 Data Readiness Labor Capex ‐$ 0.09$ 0.15$ 0.06$ ‐$
509.04 Change Management Cost Labor Capex ‐$ ‐$ 0.10$ 0.15$ ‐$
509.05 Training Resources Labor Opex ‐$ ‐$ 0.33$ 0.49$ ‐$
509.06 Requirements Development (IS) Labor Opex 0.32$ ‐$ ‐$ ‐$ ‐$
509.07 Vendor Implementation Services Labor Capex ‐$ 1.44$ 1.08$ 1.08$ ‐$
509.08 Vendor Costs: Hardware and Software NonLabor Capex ‐$ 1.79$ 1.34$ 1.34$ ‐$
509.12 Requirements Development (Business) Labor Opex 1.28$ ‐$ ‐$ ‐$ ‐$ Total 1.60$ 9.23$ 12.85$ 7.06$ ‐$
19

THE NARRAGANSETT ELECTRIC COMPANY d/b/a NATIONAL GRID RIPUC Docket No. 4770
Workpaper 3.2 - Modern Grid Costs for Multi-Jurisdiction Deployment Scenario
Page 3 of 17
3
DSCADA and ADMS Calculations
Description / Calculation Type Category Value
Number of Internal IS Resources 4
x FTE Internal Hourly IS Rate 100$
x Months in a year 12
x Working Days per month 21
x Working Hours per day 8
x Implementation Duration 3
= Cost of IS Internal Resources 2.42$
Number of External IS Resources 5
x FTE External Daily IS Rate 250$
Months in a year 12
Working Days per month 21
x Working Hours per day 8
x Implementation Duration 3
= Cost of IS External Resources 7.56$
Cost of IS External Resources 7.56$
x Travel 20%
= Travel Costs for IS External Resources 1.51$
Cost of IS Internal Resources 2.42$
+ Travel Costs for IS External Resources 1.51$
+ Cost of IS External Resources 7.56$
509.01 = Total Cost of IS Resources Labor Capex 11.49$
Number of Internal Business Resources 5
x Months in a year 12
x Working Days per month 21
x Working Hours per day 8x FTE Internal Hourly IS Rate 100
x Implementation Duration 3
= Cost of Internal Business Resources 3.02$
Number of External Business Resources 1
x FTE External Daily IS Rate 250$
x Months in a year 12
x Working Days per month 21
x Working Hours per day 8
x Implementation Duration 3
= Cost of Business SI Resources 1.51$
Cost of Business SI Resources 1.51$
x Travel 20%
= Travel Costs for External Business Resources 0.30$
Cost of Internal Business Resources 3.02$
+ Cost of Business SI Resources 1.51$
+ Travel Costs for External Business Resources 0.30$
+ Travel for Internal Business Resources 0.08$
509.02 = Total Cost of Business Resources Labor Capex 4.92$
20

THE NARRAGANSETT ELECTRIC COMPANY d/b/a NATIONAL GRID RIPUC Docket No. 4770
Workpaper 3.2 - Modern Grid Costs for Multi-Jurisdiction Deployment Scenario
Page 4 of 17
4
3.2 REMOTE TERMINAL UNIT (RTU) SEPARATION
No cost synergies can be realized for this project, so multi-jurisdiction deployment is not proposed. See Workpaper 3.1 – Modern Grid Costs for Rhode Island Only Deployment Scenario for project cost details.
DSCADA and ADMS Calculations
Description / Calculation Type Category Value (Total in $M)
Number of Field Devices 1248
x Data Readiness effort per Device 2.0
x Average Loaded Internal Hourly Rate 100$
509.03 = Data Readiness Labor Capex 0.25$
Change Management Cost 208,000.00
509.04 = Change Management Cost Labor Capex 0.21$
Training 749,000.00$
509.05 = Training Resources Labor Opex 0.75$
IS Resources Allocation 20%
Requirements Development 1,450,000.00$
509.06 = Requirements Development (IS) Labor Opex 0.29$
Vendor Implementation Services 3,000,000.00$
509.07 = Vendor Implementation Services Labor Capex 3.00$
Hardware Costs 3,120,000.00$
= Technology: Hardware 3.12$
+ 12‐month Warranty license fees 0.32$
509.08 = Vendor Costs: Hardware and Software NonLabor Capex 3.44$
Business Resources Allocation 80%
Requirements Development 1,450,000.00$
509.12 = Requirements Development (Business) Labor Opex 1.16$
21

3
3
NW
G
3.3 GIS D
3.4 GIS D
No cost syneWorkpaper 3
GIS Data Enchanc
512.01
512.02
DATA ENHA
DATA ENHA
ergies can be3.1 – Modern
cement Calculatio
Description /
Number of In
x Months in a y
x Working Day
x Working Hou
x FTE Internal
x Implementat
= Cost of Inter
Cost of Inter
x Project Mana
= Cost of Proje
ANCEMENT (I
ANCEMENT (N
e realized forn Grid Costs
ons
/ Calculation
nternal Resources
year
ys per month
urs per day
l Hourly IS Rate
tion Duration
rnal Resources
rnal Resources
agement Percenta
ect Management
IS)
NON-IS)
r this projects for Rhode I
s
age
t
5
t, so multi-juIsland Only
THE
urisdiction dDeploymen
Type
Labor
Labor
E NARRAGAN
Workpaper 3.2Ju
deployment int Scenario fo
Category
Opex
Opex
NSETT ELECTd/b/a NRIPUC
2 - Modern Griurisdiction Dep
is not proposor project co
Value ($M)
$
$
$
$
TRIC COMPANATIONAL GRC Docket No. 4id Costs for Mployment Scen
Page 5 o
sed. See ost details.
11
12
21
8
100.00
1.0
2.22
2.22
25%
0.55
ANY RID
4770 ulti-
nario of 17
22
THE NARRAGANSETT ELECTRIC COMPANY d/b/a NATIONAL GRID RIPUC Docket No. 4770
Workpaper 3.2 - Modern Grid Costs for Multi-Jurisdiction Deployment Scenario
Page 6 of 17
6
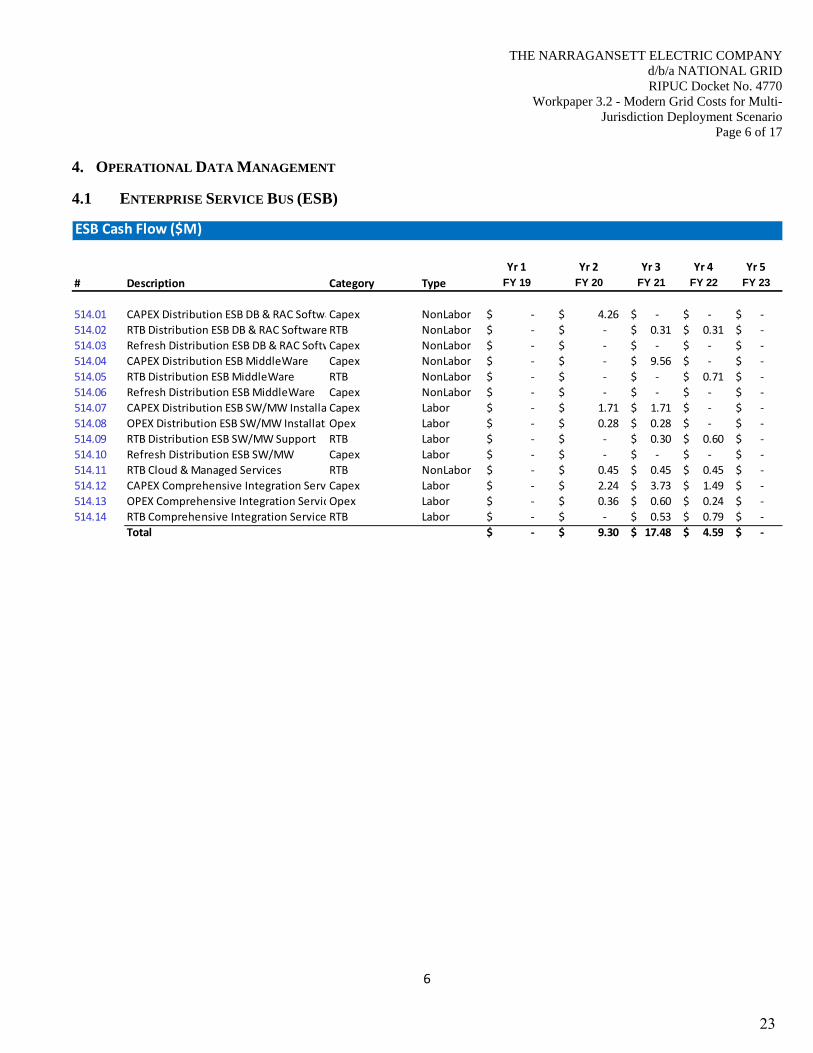
4. OPERATIONAL DATA MANAGEMENT
4.1 ENTERPRISE SERVICE BUS (ESB)
ESB Cash Flow ($M)
Yr 1 Yr 2 Yr 3 Yr 4 Yr 5
# Description Category Type FY 19 FY 20 FY 21 FY 22 FY 23
514.01 CAPEX Distribution ESB DB & RAC SoftwaCapex NonLabor ‐$ 4.26$ ‐$ ‐$ ‐$
514.02 RTB Distribution ESB DB & RAC Software RTB NonLabor ‐$ ‐$ 0.31$ 0.31$ ‐$
514.03 Refresh Distribution ESB DB & RAC SoftwCapex NonLabor ‐$ ‐$ ‐$ ‐$ ‐$
514.04 CAPEX Distribution ESB MiddleWare Capex NonLabor ‐$ ‐$ 9.56$ ‐$ ‐$
514.05 RTB Distribution ESB MiddleWare RTB NonLabor ‐$ ‐$ ‐$ 0.71$ ‐$
514.06 Refresh Distribution ESB MiddleWare Capex NonLabor ‐$ ‐$ ‐$ ‐$ ‐$
514.07 CAPEX Distribution ESB SW/MW Installa Capex Labor ‐$ 1.71$ 1.71$ ‐$ ‐$
514.08 OPEX Distribution ESB SW/MW InstallatiOpex Labor ‐$ 0.28$ 0.28$ ‐$ ‐$
514.09 RTB Distribution ESB SW/MW Support RTB Labor ‐$ ‐$ 0.30$ 0.60$ ‐$
514.10 Refresh Distribution ESB SW/MW Capex Labor ‐$ ‐$ ‐$ ‐$ ‐$
514.11 RTB Cloud & Managed Services RTB NonLabor ‐$ 0.45$ 0.45$ 0.45$ ‐$
514.12 CAPEX Comprehensive Integration ServiCapex Labor ‐$ 2.24$ 3.73$ 1.49$ ‐$
514.13 OPEX Comprehensive Integration ServicOpex Labor ‐$ 0.36$ 0.60$ 0.24$ ‐$
514.14 RTB Comprehensive Integration Service RTB Labor ‐$ ‐$ 0.53$ 0.79$ ‐$
Total ‐$ 9.30$ 17.48$ 4.59$ ‐$
23

THE NARRAGANSETT ELECTRIC COMPANY d/b/a NATIONAL GRID RIPUC Docket No. 4770
Workpaper 3.2 - Modern Grid Costs for Multi-Jurisdiction Deployment Scenario
Page 7 of 17
7
ESB Calculations
Description/Calculation Category Type Value ($M)
DB & RAC Total License Cost before May'17 3,278,674$
514.01 = CAPEX Distribution ESB DB & RAC Software Capex NonLabor 3.28$
DB & RAC Annual S&M 314,753$
514.02 = RTB Distribution ESB DB & RAC Software RTB NonLabor 0.31$
DB & RAC Total License Cost before May'17 3,278,674$
x ESB refresh cost reduction 50%
514.03 = Refresh Distribution ESB DB & RAC Software Capex NonLabor 1.64$
MW Total License Cost before Nov'17 7,356,614$
514.04 = CAPEX Distribution ESB MiddleWare Capex NonLabor 7.36$
MW Annual S&M 706,235$
514.05 = RTB Distribution ESB MiddleWare RTB NonLabor 0.71$
MW Total License Cost before Nov'17 7,356,614$
x ESB refresh cost reduction 50%
514.06 = Refresh Distribution ESB MiddleWare Capex NonLabor 3.68$
Total Labor CAPEX Cost Estimate 2,856,000$
514.07 = CAPEX Distribution ESB SW/MW Installation Capex Labor 2.86$
Total Labor OPEX Cost Estimate 504,000$
514.08 = OPEX Distribution ESB SW/MW Installation Opex Labor 0.50$
RTB Labor Costs 600,000$
514.09 = RTB Distribution ESB SW/MW Support RTB Labor 0.60$
CAPEX Distribution ESB SW/MW Installation 2.86$
+ OPEX Distribution ESB SW/MW Installation 0.50$
x ESB refresh cost reduction 50%
514.10 = Refresh Distribution ESB SW/MW Capex Labor 1.68$
Monthly Cloud Costs w/Managed Service included 37,103$
x Months in a year 12
514.11 = RTB Cloud & Managed Services RTB NonLabor 0.45$
24

THE NARRAGANSETT ELECTRIC COMPANY d/b/a NATIONAL GRID RIPUC Docket No. 4770
Workpaper 3.2 - Modern Grid Costs for Multi-Jurisdiction Deployment Scenario
Page 8 of 17
8
4.2 DATA MANAGEMENT AND ANALYTICS
ESB Calculations
Description/Calculation Category Type Value ($M)
Total Hours for Large Integrations 11520
+
Total Hours for Medium Integrations 18640
+
Total Hours for Small Integrations 32880
= Total Hours for ALL Integrations 63040
Total External Costs 6.05$
+
Total Internal Costs 1.26$
= Total ESB Costs 7.31$
Total ESB Costs 7.31$
x CAPEX Allocations 85%
514.12 = CAPEX Comprehensive Integration Services Capex Labor 6.22$
Total ESB Costs 7.31$
x OPEX Allocations 15%
514.13 = OPEX Comprehensive Integration Services Opex Labor 1.10$
Total ESB Costs 7.31$
x System Maintenance Costs % 10%
= Total YOY System Maintenance Cost 0.73$
+ Platform Support from ESB/CIM 0.22$
514.14 = RTB Comprehensive Integration Services RTB Labor 0.95$
Cloud Hosting Cash Flow ($M)
Yr ‐1 Yr ‐2 Yr ‐3 Yr ‐4 Yr ‐5
# Description Category Type
FY19 FY20 FY21 FY22 FY23
517.01 CAPEX Development Data Lake Opex NonLabor ‐$ 0.09$ 0.09$ 0.09$ 0.09$
517.02 CAPEX QA Data Lake Opex NonLabor ‐$ 0.18$ 0.18$ 0.18$ 0.18$
517.03 CAPEX Production Data Lake Opex NonLabor ‐$ 0.55$ 1.30$ 2.02$ 2.38$
517.04 CAPEX Dashboard Environment Opex NonLabor ‐$ 0.32$ 0.32$ 0.32$ 0.32$
517.05 RTB Platform Maintenance & Support RTB Labor ‐$ ‐$ 0.50$ 0.75$ 0.75$
517.06 CAPEX Platform Setup Capex Labor ‐$ 1.39$ ‐$ ‐$ ‐$
517.07 OPEX Platform Design Opex Labor ‐$ 0.32$ ‐$ ‐$ ‐$
Total ‐$ 2.85$ 2.39$ 3.35$ 3.71$
25

THE NARRAGANSETT ELECTRIC COMPANY d/b/a NATIONAL GRID RIPUC Docket No. 4770
Workpaper 3.2 - Modern Grid Costs for Multi-Jurisdiction Deployment Scenario
Page 9 of 17
9
Data Lake Cloud Hosting Calculations
Description/Calculation Type Category Value ($M)
Development Data Nodes 29,940$
+ Development Master Nodes 18,626$
+ Development Edge Nodes 10,241$
517.01 = CAPEX Development Data Lake NonLabor Opex 0.08$
QA Data Nodes 72,046$
+ QA Master Nodes 29,526$
+ QA Edge Nodes 18,626$
517.02 = CAPEX QA Data Lake NonLabor Opex 0.16$
Production Data Nodes 882,196$
+ Production Master Nodes 32,196$
+ Production Edge Nodes 19,979$
x Number of Production DR Envts. 2
+ Production Archival Storage 16,080
517.03 = CAPEX Production Data Lake NonLabor Opex 2.52$
Number of Production DR Envts. 2
x Production Dashboard Environment 81,584$
+ Development Dashboard Environment 63,092$
+ QA Dashboard Environment 63,092$
517.04 = CAPEX Dashboard Environment NonLabor Opex 0.29$
Platform Maintenance & Support 750,000$
517.05 = RTB Platform Maintenance & Support Labor RTB 0.75$
Platform Build 1,210,000$
x Capex Platform Support 80%
x Travel 20%
517.06 = CAPEX Platform Setup Labor Capex 1.16$
Platform Build 1,210,000$
x Opex Platform Support 20%
x Travel 20%
517.07 = OPEX Platform Design Labor Opex 0.29$
26

10
THE
E NARRAGAN
Workpaper 3.2Ju
NSETT ELECTd/b/a NRIPUC
2 - Modern Griurisdiction Dep
TRIC COMPANATIONAL GRC Docket No. 4id Costs for Mployment Scen
Page 10 o
ANY RID
4770 ulti-
nario of 17
27

THE NARRAGANSETT ELECTRIC COMPANY d/b/a NATIONAL GRID RIPUC Docket No. 4770
Workpaper 3.2 - Modern Grid Costs for Multi-Jurisdiction Deployment Scenario
Page 11 of 17
11
Information Management Cloud Analytics Cash Flow ($M)
Yr 1 Yr 2 Yr 3 Yr 4 Yr 5
# Description Category Type FY 19 FY 20 FY 21 FY 22 FY 23
516.01 Utility Data Model License Capex NonLabor ‐$ ‐$ ‐$ ‐$ 1.90$
516.02 Utility Data Model License Support Opex NonLabor ‐$ ‐$ ‐$ ‐$ ‐$
516.03 Information Management License Capex NonLabor ‐$ 1.72$ ‐$ ‐$ ‐$
516.04 Information Management License Support Opex NonLabor ‐$ ‐$ 0.29$ 0.29$ 0.29$
516.05 Data Governance License Capex NonLabor ‐$ 0.40$ ‐$ ‐$ ‐$
516.06 Data Governance License Support Opex NonLabor ‐$ 0.34$ 0.34$ 0.34$ 0.34$
516.07 Data Quality Development Capex Labor ‐$ 0.49$ 1.21$ 0.73$ ‐$
516.08 Data Ingestion Development Capex Labor ‐$ 1.28$ 3.21$ 1.92$ ‐$
516.09 Dashboard Development Capex Labor ‐$ 0.11$ 0.28$ 0.17$ ‐$
516.1 CAPEX Platform Design & Development Capex Labor ‐$ 0.23$ 0.58$ 0.35$ ‐$
516.11 Platform Support & Maintenance RTB Labor ‐$ ‐$ 1.18$ 1.42$ 1.78$
516.12 CAPEX Visualization License Cost Capex NonLabor ‐$ 7.58$ ‐$ ‐$ ‐$
516.13 Opex Visualization License Cost Opex NonLabor ‐$ 0.09$ ‐$ ‐$ ‐$
516.14 CAPEX IS Visualization License Cost Capex NonLabor ‐$ 0.73$ 0.58$ 0.58$ 0.58$
516.15 Opex IS Visualization License Cost Opex NonLabor ‐$ ‐$ 0.03$ 0.03$ 0.03$
Total ‐$ 12.96$ 7.70$ 5.83$ 4.92$
28

THE NARRAGANSETT ELECTRIC COMPANY d/b/a NATIONAL GRID RIPUC Docket No. 4770
Workpaper 3.2 - Modern Grid Costs for Multi-Jurisdiction Deployment Scenario
Page 12 of 17
12
Information Management Cloud Analytics Calculations
Description/Calculation Category Type Value ($M)
Utility Data Model License 1,460,206.48$
516.01 = Utility Data Model License Capex NonLabor 1.46$
Utility Data Model License Support 292,041.30$
516.02 = Utility Data Model License Support Opex NonLabor 0.29$
Information Management License 1,319,702.37$
516.03 = Information Management License Capex NonLabor 1.32$
Information Management License Support 263,940.47$
516.04 = Information Management License Support Opex NonLabor 0.26$
Data Governance License 307,142.00$
516.05 = Data Governance License Capex NonLabor 0.31$
Data Governance License Support 307,142.00$
516.06 = Data Governance License Support Opex NonLabor 0.31$
Data Quality Dev Hours 16857
x FTE External (subcontractor; non‐specialist) Hourly IS Rate 100$
x Travel 20%
516.07 = Data Quality Development Capex Labor 2.02$
ETL Dev Hours 44547
x FTE External (subcontractor; non‐specialist) Hourly IS Rate 100$
x Travel 20%
516.08 = Data Ingestion Development Capex Labor 5.35$
Dashboard Dev Hours 3851
x FTE External (subcontractor; non‐specialist) Hourly IS Rate 100$
x Travel 20%
516.09 = Dashboard Development Capex Labor 0.46$
Platform Development Effort 1,198,000$
x Capex Allocation 80%
516.10 = CAPEX Platform Design & Development Capex Labor 0.96$
29

THE NARRAGANSETT ELECTRIC COMPANY d/b/a NATIONAL GRID RIPUC Docket No. 4770
Workpaper 3.2 - Modern Grid Costs for Multi-Jurisdiction Deployment Scenario
Page 13 of 17
13
5. TELECOMMUNICATIONS
Information Management Cloud Analytics Calculations
Description/Calculation Category Type Value ($M)
Platform Development Effort 1,198,000$
x Opex Allocation 20%
516.16 = OPEX Platform Design & Development Opex Labor 0.24$
Platform Support & Maintenance 1,782,000$
516.11 = Platform Support & Maintenance RTB Labor 1.78$
Visualization License ‐ Business 7,934,000$
NY Cost Factor 73%
516.12 = CAPEX Visualization License Cost Capex NonLabor 5.83$
Visualization License Maintenance ‐ Business 115,000$
NY Cost Factor 73%
516.13 = Opex Visualization License Cost Opex NonLabor 0.08$
Tableau Desktop License 1,999$
+ Tableau Server License 1,000$
+ Alteryx Designer License 5,195$
x Number of Licenses 40
+
Alteryx Server License 58,500$
x Number of Alteryx Servers 4
516.14 = CAPEX IS Visualization License Cost Capex NonLabor 0.56$
Tableau Desktop License 1,999$
+ Tableau Server License 1,000$
x Number of Licenses 40
x Tableau Server Maintenace Cost 25%
516.15 = Opex IS Visualization License Cost Opex NonLabor 0.03$
Telecom Non‐Inflated Cash Flow ($M)
Yr 1 Yr 2 Yr 3 Yr 4 Yr 5
# Description Category Type FY 19 FY 20 FY 21 FY 22 FY 23
513.08 CAPEX Corporate Backbone Expansion Capex NonLabor ‐$ 0.10$ 0.05$ 0.05$ ‐$
513.09 RTB Corpate Backbone Expansion RTB NonLabor ‐$ ‐$ 0.54$ 0.81$ 1.08$
513.10 CAPEX IT/OT Backbone Expansion Capex NonLabor ‐$ 0.15$ 0.07$ 0.07$ ‐$
513.11 RTB IT/OT Backbone Expansion RTB NonLabor ‐$ ‐$ 1.62$ 2.43$ 3.24$
513.12 CAPEX IT/OT Mesh Network Backhaul Capex NonLabor ‐$ 0.23$ 0.11$ 0.11$ ‐$
513.13 RTB IT/OT Mesh Network Backhaul RTB NonLabor ‐$ ‐$ 0.45$ 0.68$ 0.90$
Total ‐$ 0.48$ 2.85$ 4.15$ 5.22$
30

THE NARRAGANSETT ELECTRIC COMPANY d/b/a NATIONAL GRID RIPUC Docket No. 4770
Workpaper 3.2 - Modern Grid Costs for Multi-Jurisdiction Deployment Scenario
Page 14 of 17
14
Telecom Calculations
Description/Calculation Category Type Value ($M)
SCI Implementation Cost 60,000$
+
Data Center Bandwidth Increase Cost 16,500$
x Number of circuits 6
513.08 = CAPEX Corporate Backbone Expansion Capex NonLabor 0.16$
Monthly SCI Service Cost 4,000$
x 0 0
+
Monthly Data Center Bandwidth Increase 15,000$
x Months in a year 12
x Number of circuits 6
513.09 = RTB Corpate Backbone Expansion RTB NonLabor 1.08$
POPs Bandwidth Implementation cost 30,000$
x Number of Locations (POPs) 6
+
CSC Data Center Bandwidth cost 22,500$
x Number of connections 2
513.10 = CAPEX IT/OT Backbone Expansion Capex NonLabor 0.23$
Monthly cost of POP bandwidth 35,000$
x Months in a year 12
x Number of Locations (POPs) 6
+
Monthly cost of CSC bandwidth 30,000$
x Months in a year 12
x Number of connections 2
513.11 = RTB IT/OT Backbone Expansion RTB NonLabor 3.24$
Wireless gateway planning and configuration 50,000$
+
Stand up of wireless gateway 75,000$
x Number of gateways 3
+
Set up of CSC bandwidth and VRFs 25,000$
x Number of data center links 3
513.12 = CAPEX IT/OT Mesh Network Backhaul Capex NonLabor 0.35$
Monthly cost of wireless gateway 20,000$
x Months in a year 12
x Number of gateways 3
+
Monthly cost of CSC data center link increase 5,000$
x Months in a year 12
x Number of data center links 3
513.13 = RTB IT/OT Mesh Network Backhaul RTB NonLabor 0.90$
31

THE NARRAGANSETT ELECTRIC COMPANY d/b/a NATIONAL GRID RIPUC Docket No. 4770
Workpaper 3.2 - Modern Grid Costs for Multi-Jurisdiction Deployment Scenario
Page 15 of 17
15
6. CYBERSECURITY
SUMMARY ALL COSTS,
$1,000sSPENDING TYPE FY19 FY20 FY21 FY22 FY23
600 CAPEX $0 $15,758 $7,667 $5,077 $0
601 OPEX $0 $6,647 $2,768 $1,914 $0
602 RTB $0 $2,993 $2,163 $1,882 $3,909
603 CAPEX ‐ REMOVAL/REFRESH $0 $0 $0 $0 $12,910
604 OPEX ‐ REMOVAL/REFRESH $0 $0 $0 $33 $1,728
GRAND TOTAL $0 $25,398 $12,598 $8,906 $18,547
B_NETWORK SECURITY
SERVICESSPENDING TYPE FY18 FY19 FY20 FY21 FY22
600B CAPEX $0 $4,802 $2,216 $1,464 $0
601B OPEX $0 $427 $197 $130 $0
602B RTB $0 $1,488 $730 $510 $2,538
603B CAPEX ‐ REMOVAL/REFRESH $0 $0 $0 $0 $1,603
604B OPEX ‐ REMOVAL/REFRESH $0 $0 $0 $0 $0
TOTAL $0 $6,716 $3,142 $2,103 $4,140
C_DATA SECURITY
SERVICESSPENDING TYPE FY18 FY19 FY20 FY21 FY22
600C CAPEX $0 $699 $322 $212 $0
601C OPEX $0 $427 $197 $130 $0
602C RTB $0 $138 $108 $83 $83
603C CAPEX ‐ REMOVAL/REFRESH $0 $0 $0 $0 $747
604C OPEX ‐ REMOVAL/REFRESH $0 $0 $0 $0 $0
TOTAL $0 $1,264 $626 $425 $830
D_IDENTITY AND ACCESS
MANAGEMENSPENDING TYPE FY18 FY19 FY20 FY21 FY22
600D CAPEX $0 $4,214 $1,940 $1,281 $0
601D OPEX $0 $427 $197 $130 $0
602D RTB $0 $276 $276 $276 $276
603D CAPEX ‐ REMOVAL/REFRESH $0 $0 $0 $0 $3,004
604D OPEX ‐ REMOVAL/REFRESH $0 $0 $0 $0 $1,568
TOTAL $0 $4,917 $2,412 $1,687 $4,848
E_THREAT AND
VULNERABILITY MANASPENDING TYPE FY18 FY19 FY20 FY21 FY22
600E CAPEX $0 $1,074 $494 $326 $0
601E OPEX $0 $427 $197 $130 $0
602E RTB $0 $83 $83 $83 $83
603E CAPEX ‐ REMOVAL/REFRESH $0 $0 $0 $0 $1,456
604E OPEX ‐ REMOVAL/REFRESH $0 $0 $0 $0 $0
TOTAL $0 $1,583 $774 $539 $1,538
32

THE NARRAGANSETT ELECTRIC COMPANY d/b/a NATIONAL GRID RIPUC Docket No. 4770
Workpaper 3.2 - Modern Grid Costs for Multi-Jurisdiction Deployment Scenario
Page 16 of 17
16
F_SECURITY OPERATIONS
CENTER SESPENDING TYPE FY18 FY19 FY20 FY21 FY22
600F CAPEX $0 $1,326 $610 $403 $0
601F OPEX $0 $427 $197 $130 $0
602F RTB $0 $89 $89 $89 $89
603F CAPEX ‐ REMOVAL/REFRESH $0 $0 $0 $0 $656
604F OPEX ‐ REMOVAL/REFRESH $0 $0 $0 $7 $7
TOTAL $0 $1,842 $896 $628 $752
G_HOST & ENDPOINT
SECURITY SERVSPENDING TYPE FY18 FY19 FY20 FY21 FY22
600G CAPEX $0 $572 $298 $219 $0
601G OPEX $0 $482 $251 $130 $0
602G RTB $0 $83 $83 $83 $83
603G CAPEX ‐ REMOVAL/REFRESH $0 $0 $0 $0 $531
604G OPEX ‐ REMOVAL/REFRESH $0 $0 $0 $0 $0
TOTAL $0 $1,136 $632 $432 $614
H_SECURITY POLICY
MANAGEMENT SESPENDING TYPE FY18 FY19 FY20 FY21 FY22
600H CAPEX $0 $572 $298 $219 $0
601H OPEX $0 $482 $251 $130 $0
602H RTB $0 $83 $83 $83 $83
603H CAPEX ‐ REMOVAL/REFRESH $0 $0 $0 $0 $531
604H OPEX ‐ REMOVAL/REFRESH $0 $0 $0 $0 $0
TOTAL $0 $1,136 $632 $432 $614
I_CRYPTOGRAPHY
SERVICESSPENDING TYPE FY18 FY19 FY20 FY21 FY22
600I CAPEX $0 $510 $235 $155 $0
601I OPEX $0 $427 $197 $130 $0
602I RTB $0 $162 $119 $83 $83
603I CAPEX ‐ REMOVAL/REFRESH $0 $0 $0 $0 $730
604I OPEX ‐ REMOVAL/REFRESH $0 $0 $0 $26 $153
TOTAL $0 $1,099 $551 $394 $966
J_CHANGE &
CONFIGURATION
MANAGE
SPENDING TYPE FY18 FY19 FY20 FY21 FY22
600J CAPEX $0 $302 $139 $92 $0
601J OPEX $0 $427 $197 $130 $0
602J RTB $0 $83 $83 $83 $83
603J CAPEX ‐ REMOVAL/REFRESH $0 $0 $0 $0 $532
604J OPEX ‐ REMOVAL/REFRESH $0 $0 $0 $0 $0
TOTAL $0 $811 $418 $304 $615
33

THE NARRAGANSETT ELECTRIC COMPANY d/b/a NATIONAL GRID RIPUC Docket No. 4770
Workpaper 3.2 - Modern Grid Costs for Multi-Jurisdiction Deployment Scenario
Page 17 of 17
17
K_SECURITY AWARENESS
& TRAININGSPENDING TYPE FY18 FY19 FY20 FY21 FY22
600K CAPEX $0 $0 $0 $0 $0
601K OPEX $0 $449 $152 $152 $0
602K RTB $0 $177 $177 $177 $177
603K CAPEX ‐ REMOVAL/REFRESH $0 $0 $0 $0 $0
604K OPEX ‐ REMOVAL/REFRESH $0 $0 $0 $0 $0
TOTAL $0 $626 $329 $329 $177
L_APPLICATION SECURITY
SERVICESSPENDING TYPE FY18 FY19 FY20 FY21 FY22
600L CAPEX $0 $969 $446 $295 $0
601L OPEX $0 $633 $91 $29 $0
602L RTB $0 $83 $83 $83 $83
603L CAPEX ‐ REMOVAL/REFRESH $0 $0 $0 $0 $1,063
604L OPEX ‐ REMOVAL/REFRESH $0 $0 $0 $0 $0
TOTAL $0 $1,686 $620 $407 $1,146
M_THIRD PARTY
ASSURANCE MANAGEMSPENDING TYPE FY18 FY19 FY20 FY21 FY22
600M CAPEX $0 $0 $0 $0 $0
601M OPEX $0 $753 $0 $565 $0
602M RTB $0 $83 $83 $83 $83
603M CAPEX ‐ REMOVAL/REFRESH $0 $0 $0 $0 $0
604M OPEX ‐ REMOVAL/REFRESH $0 $0 $0 $0 $0
TOTAL $0 $836 $83 $648 $83
N_REMOTE ACCESS
SERVICESSPENDING TYPE FY18 FY19 FY20 FY21 FY22
600N CAPEX $0 $720 $668 $411 $0
601N OPEX $0 $295 $458 $0 $0
602N RTB $0 $83 $83 $83 $83
603N CAPEX ‐ REMOVAL/REFRESH $0 $0 $0 $0 $2,057
604N OPEX ‐ REMOVAL/REFRESH $0 $0 $0 $0 $0
TOTAL $0 $1,097 $1,210 $494 $2,140
O_PRIVACY SERVICES SPENDING TYPE FY18 FY19 FY20 FY21 FY22
600O CAPEX $0 $0 $0 $0 $0
601O OPEX $0 $565 $188 $0 $0
602O RTB $0 $83 $83 $83 $83
603O CAPEX ‐ REMOVAL/REFRESH $0 $0 $0 $0 $0
604O OPEX ‐ REMOVAL/REFRESH $0 $0 $0 $0 $0
TOTAL $0 $648 $271 $83 $83
34

W
orkpaper 4.1

THE NARRAGANSETT ELECTRIC COMPANY d/b/a NATIONAL GRID RIPUC Docket No. 4770
Witnesses: Leana, Sheridan, Nouel Roughan
Workpaper 4.1,
AMF Costs
REDACTED
35

AM
F C
osts
and
Ben
efits
(in m
illio
ns)
TH
E N
AR
RA
GA
NS
ET
T E
LE
CT
RIC
CO
MP
AN
Yd/
b/a
NA
TIO
NA
L G
RID
RIP
UC
Doc
ket N
o. 4
770
Wor
kpap
er 4
.1 -
AM
F C
osts
, RE
DA
CT
ED
Pag
e 1
of 9
#D
escr
ipti
on
Cat
ego
ryG
rou
pN
PV
FY
20
FY
21
FY
22
FY
23
- F
Y 3
9
BE
NE
FIT
S (
CO
MB
INE
D)
2B
enef
it fr
om e
limin
ated
AM
R m
eter
rea
ders
Ope
xA
MR
Met
er R
eadi
ng$1
3.51
-$
-$
0.46
$
30
.98
$
3
Ben
efit
from
elim
inat
ed A
MR
met
er r
eade
r ve
hicl
e co
sts
Ope
xA
MR
Met
er R
eadi
ng$1
.23
-$
-$
0.04
$
2.
81$
4
CO
2 be
nefit
from
elim
inat
ed A
MR
veh
icle
em
issi
ons
Em
issi
ons
AM
R M
eter
Rea
ding
(C
O2)
$0.0
2-
$
-
$
0.
00$
0.04
$
5B
enef
it fr
om r
educ
tion
of m
eter
inve
stig
atio
nsO
pex
Met
er In
vest
igat
ion
$6.2
0-
$
-
$
0.
21$
14.2
1$
6B
enef
it fr
om r
emot
e m
eter
ing
capa
bilit
ies
Ope
xR
emot
e C
onne
ct a
nd D
isco
nnec
t$2
6.90
-$
-$
0.92
$
61
.66
$
9
Ben
efit
from
impr
ovem
ent i
n ba
d de
bt w
rite-
offs
Ope
xR
educ
tion
in W
rite-
offs
$0.0
0-
$
-
$
-
$
18
.89
$
11
Ben
efit
from
miti
gatio
n / r
educ
tion
of d
amag
e cl
aim
sO
pex
Red
uctio
n in
Dam
age
Cla
ims
$2.6
1-
$
-
$
-
$
6.
13$
13
Ben
efit
from
red
uctio
n of
AM
R th
eft /
und
erm
eter
ing
Ope
xR
educ
tion
in T
heft
of S
ervi
ce$0
.00
-$
-$
1.22
$
80
.02
$
14
Ben
efit
from
VV
O/A
MF
inte
grat
ion
Ope
xV
olt-
VA
R O
ptim
izat
ion
$13.
73-
$
-
$
-
$
36
.88
$
15C
O2
bene
fit fr
om V
VO
/AM
F in
tegr
atio
nLo
sses
Vol
t-V
AR
Opt
imiz
atio
n (C
O2)
$5.4
6-
$
-
$
0.
14$
12.4
8$
16B
enef
it fr
om E
nerg
y In
sigh
ts/H
igh
usag
e al
erts
Rev
enue
Ene
rgy
Insi
ghts
/Hig
h U
sage
Ale
rts
$22.
02-
$
0.
55$
1.80
$
48
.88
$
17
CO
2 be
nefit
from
Ene
rgy
Insi
ghts
/Hig
h us
age
aler
tsLo
sses
Ene
rgy
Insi
ghts
/Hig
h U
sage
Ale
rts
(CO
2)$7
.88
-$
0.36
$
1.
05$
14.3
6$
18C
O2
bene
fit fr
om r
educ
tion
of m
eter
inve
stig
atio
nsE
mis
sion
sM
eter
Inve
stig
atio
n (C
O2)
$0.0
1-
$
-
$
0.
00$
0.03
$
19C
O2
bene
fit fr
om r
emot
e m
eter
ing
capa
bilit
ies
Em
issi
ons
Rem
ote
Con
nect
and
Dis
conn
ect (
CO
2)$0
.17
-$
-$
0.01
$
0.
35$
20O
utag
e M
anag
emen
t ope
ratio
nal b
enef
itO
pex
Sto
rm O
MS
Ben
efit
$1.8
8-
$
-
$
-
$
4.
42$
25B
enef
it fr
om E
lect
ric V
ehic
le T
VP
Ope
xE
lect
ric V
ehic
le P
ricin
g$2
4.81
-$
-$
-$
68.6
6$
26Lo
w-E
nd R
ed. &
Opt
-In
bene
fit fr
om C
ritic
al P
eak
Pric
ing
(CP
P)
peak
sha
ving
Ope
xT
ime
Var
ying
Pric
ing
$4.5
9-
$
-
$
-
$
12
.75
$
27
Low
-End
Red
. & O
pt-I
n be
nefit
from
Avo
ided
Ene
rgy
due
to T
ime-
of-U
se P
rogr
amO
pex
Tim
e V
aryi
ng P
ricin
g$3
.84
-$
-$
-$
10.6
5$
28Lo
w-E
nd R
ed. &
Opt
-In
CO
2 sa
ving
s fr
om A
void
ed E
nerg
y du
e to
Tim
e-of
-Use
Pro
gram
Em
issi
ons
Tim
e V
aryi
ng P
ricin
g (C
O2)
$2.8
6-
$
-
$
-
$
7.
59$
30B
enef
it fr
om E
lect
rom
echa
nica
l met
er A
ccur
acy
Ope
xE
lect
rom
echa
nica
l Met
er$0
.00
-$
2.08
$
4.
38$
20.8
9$
100
Avo
ided
Ele
ctric
AM
R E
quip
men
t Met
er R
epla
cem
ent
Cap
exC
apita
l $3
2.00
0.86
$
0.
89$
16.1
0$
30
.97
$
10
2A
void
ed A
MF
ele
ctric
met
er in
stal
latio
n co
st -
Cap
ex p
ortio
nC
apex
Cap
ital
$20.
600.
55$
0.57
$
10
.30
$
20.1
5$
105
Avo
ided
AM
F d
emon
stra
tion
perio
d co
stO
pex
Ope
ratio
ns &
Mai
nten
ance
$1.0
71.
16$
-$
-$
-$
123
Avo
ided
cos
t fro
m c
all c
ente
r an
d A
MO
, im
plem
enta
tion
Ope
xO
pera
tions
& M
aint
enan
ce$2
.44
-$
1.08
$
1.
87$
-$
124
Avo
ided
AM
F In
tern
al P
roje
ct M
anag
emen
t Lea
ders
hip
Sta
ff -
Cap
ex p
ortio
nC
apex
Cap
ital
$0.7
2-
$
0.
42$
0.44
$
-
$
12
6A
void
ed A
MF
ele
ctric
met
er in
stal
latio
n co
st -
CO
R p
ortio
nC
OR
Cap
ital
$0.6
40.
02$
0.02
$
0.
32$
0.62
$
128
Avo
ided
AM
F E
xter
nal P
roje
ct M
anag
emen
t lab
or c
ost -
Ope
x po
rtio
nO
pex
Ope
ratio
ns &
Mai
nten
ance
$0.0
0-
$
-
$
-
$
-
$
12
9A
void
ed A
MF
Inte
rnal
Pro
ject
Man
agem
ent L
eade
rshi
p S
taff
- O
pex
port
ion
Ope
xO
pera
tions
& M
aint
enan
ce$0
.38
0.41
$
-
$
-
$
-
$
13
4A
void
ed A
MF
inve
ntor
y eq
uipm
ent c
ost
Cap
exC
apita
l $0
.80
0.02
$
0.
02$
0.40
$
0.
77$
203
Avo
ided
CM
S D
eplo
ymen
t Cen
ter,
Fac
ility
cos
tC
apex
Cap
ital
$1.3
5-
$
1.
06$
0.54
$
-
$
20
4A
void
ed C
MS
Bac
k O
ffice
& C
leric
al c
ost
Cap
exC
apita
l $1
.86
-$
1.46
$
0.
75$
-$
205
Avo
ided
Ser
vice
Rep
rese
ntat
ive
Too
ls /
Uni
form
cos
tC
apex
Cap
ital
$0.1
9-
$
0.
16$
0.06
$
-
$
20
6A
void
ed In
stal
led
met
er Q
ualit
y A
ssur
ance
/ Q
ualit
y C
heck
cos
tC
apex
Cap
ital
$0.6
1-
$
0.
48$
0.25
$
-
$
20
7A
void
ed C
MS
Dep
loym
ent C
oord
inat
ion
Labo
r co
stC
apex
Cap
ital
$0.8
2-
$
0.
64$
0.33
$
-
$
20
8A
void
ed C
MS
Fie
ld In
stal
ler
Initi
al T
rain
ing
Cap
exC
apita
l $0
.78
0.43
$
0.
44$
-$
-$
209
Avo
ided
CM
S C
ellu
lar
Com
mun
icat
ion
cost
Cap
exC
apita
l $0
.06
-$
0.04
$
0.
02$
-$
210
Avo
ided
Han
dhel
d D
evic
es c
ost
Cap
exC
apita
l $0
.05
-$
0.06
$
-
$
-
$
302
Avo
ided
MD
S S
yste
m D
evel
opm
ent T
estin
gC
apex
Cap
ital
$0.0
60.
05$
0.02
$
-
$
-
$
400
Avo
ided
Cus
tom
er E
ngag
emen
t Pla
n C
ost
Ope
xO
pera
tions
& M
aint
enan
ce$2
.07
0.23
$
0.
85$
0.50
$
1.
16$
540
Avo
ided
FC
S C
osts
Ope
xF
CS
Met
er R
eadi
ng$0
.28
-$
-$
0.01
$
0.
66$
54
1A
void
ed In
terv
al M
eter
Rea
ding
Cos
tsO
pex
Inte
rval
Met
er R
eadi
ng$0
.02
-$
0.00
$
0.
00$
0.03
$
To
tal B
enef
it20
4.52
$
3.73
$
11
.18
$
42.1
2$
50
7.02
$
THE NARRAGANSETT ELECTRIC COMPANY d/b/a NATIONAL GRID RIPUC Docket No. 4770 Workpaper 4.1 - AMF Costs, REDACTED Page 1 of 9
36

AM
F C
osts
and
Ben
efits
(in m
illio
ns)
TH
E N
AR
RA
GA
NS
ET
T E
LE
CT
RIC
CO
MP
AN
Yd/
b/a
NA
TIO
NA
L G
RID
RIP
UC
Doc
ket N
o. 4
770
Wor
kpap
er 4
.1 -
AM
F C
osts
, RE
DA
CT
ED
Pag
e 2
of 9
#D
escr
ipti
on
Cat
ego
ryG
rou
pN
PV
FY
20
FY
21
FY
22
FY
23
- F
Y 3
9
CO
ST
S (
CO
MB
INE
D)
100
AM
F e
lect
ric m
eter
equ
ipm
ent c
ost
Cap
exA
MF
Ele
ctric
Met
er E
quip
men
t and
Inst
alla
tion
$50.
50-
$
20
.03
$
41.2
1$
-
$
10
2A
MF
ele
ctric
met
er in
stal
latio
n co
st -
Cap
ex p
ortio
nC
apex
AM
F E
lect
ric M
eter
Equ
ipm
ent a
nd In
stal
latio
n$2
3.35
-$
9.25
$
19
.08
$
-$
104
AM
F fa
iled
met
er e
quip
men
t rep
lace
men
t cos
tC
apex
Equ
ipm
ent a
nd In
stal
latio
n R
efre
sh C
ost
$0.8
9-
$
0.
03$
0.09
$
1.
86$
10
5A
MF
dem
onst
ratio
n pe
riod
cost
Ope
xA
MF
Ele
ctric
Met
er E
quip
men
t and
Inst
alla
tion
$1.4
31.
54$
-$
-$
-$
110
AM
F n
etw
ork
engi
neer
ing,
des
ign,
con
trac
ting
cost
Cap
exN
etw
ork
Equ
ipm
ent a
nd In
stal
latio
n$0
.10
0.10
$
-
$
-
$
-
$
11
1N
etw
ork
com
mun
icat
ions
equ
ipm
ent c
ost,
Ele
ctric
Met
ers
Cap
exN
etw
ork
Equ
ipm
ent a
nd In
stal
latio
n$1
.29
-$
0.51
$
1.
05$
-$
112
Net
wor
k co
mm
unic
atio
ns e
quip
men
t cos
t, G
as M
eter
sC
apex
Net
wor
k E
quip
men
t and
Inst
alla
tion
$0.1
8-
$
0.
07$
0.15
$
-
$
11
3N
etw
ork
com
mun
icat
ions
inst
alla
tion
cost
, Ele
ctric
Met
ers
Cap
exN
etw
ork
Equ
ipm
ent a
nd In
stal
latio
n$0
.10
-$
0.04
$
0.
09$
-$
114
Net
wor
k co
mm
unic
atio
ns in
stal
latio
n co
st, G
as M
eter
sC
apex
Net
wor
k E
quip
men
t and
Inst
alla
tion
$0.0
1-
$
0.
01$
0.01
$
-
$
11
5N
etw
ork
com
mun
icat
ions
LT
E b
ackh
aul c
ost,
Ele
ctric
Met
ers
Ope
xB
ackh
aul
$0.9
5-
$
0.
03$
0.09
$
2.
00$
11
6N
etw
ork
com
mun
icat
ions
LT
E b
ackh
aul c
ost,
Gas
Met
ers
Ope
xB
ackh
aul
$0.1
1-
$
0.
00$
0.00
$
0.
25$
11
7A
MF
met
er c
ellu
lar
serv
ice
cost
, Ele
ctric
Met
ers
Ope
xE
quip
men
t and
Inst
alla
tion
Ref
resh
Cos
t$1
.55
-$
0.05
$
0.
15$
3.25
$
118
Net
wor
k co
mm
unic
atio
ns e
quip
men
t cos
t upg
rade
Cap
exN
etw
ork
Equ
ipm
ent a
nd In
stal
latio
n$1
.14
-$
-$
-$
2.35
$
119
AM
F c
omm
unic
atio
ns fa
iled
equi
pmen
t rep
lace
men
t cos
tC
apex
Equ
ipm
ent a
nd In
stal
latio
n R
efre
sh C
ost
$0.1
9-
$
-
$
0.
01$
0.42
$
120
AM
F c
omm
unic
atio
ns e
quip
men
t O&
M c
ost (
outs
ide
war
rant
y)O
pex
Equ
ipm
ent a
nd In
stal
latio
n R
efre
sh C
ost
$0.3
6-
$
-
$
-
$
0.
85$
12
1A
MF
Ext
erna
l Pro
ject
Man
agem
ent l
abor
cos
t - C
apex
por
tion
Cap
exP
roje
ct M
anag
emen
t$1
.75
-$
2.02
$
-
$
-
$
12
3C
ost f
rom
cal
l cen
ter
and
AM
O, i
mpl
emen
tatio
nO
pex
Pro
ject
Man
agem
ent
$4.8
7-
$
2.
15$
3.74
$
-
$
12
4A
MF
Inte
rnal
Pro
ject
Man
agem
ent L
eade
rshi
p S
taff
- C
apex
por
tion
Cap
exP
roje
ct M
anag
emen
t$0
.72
-$
0.42
$
0.
44$
-$
125
AM
F In
tern
al P
roje
ct M
anag
emen
t Bus
ines
s S
uppo
rt -
Cap
ex p
ortio
nC
apex
Pro
ject
Man
agem
ent
$2.4
21.
28$
1.42
$
-
$
-
$
12
6A
MF
ele
ctric
met
er in
stal
latio
n co
st -
CO
R p
ortio
nC
OR
AM
F E
lect
ric M
eter
Equ
ipm
ent a
nd In
stal
latio
n$0
.72
-$
0.29
$
0.
59$
-$
128
AM
F E
xter
nal P
roje
ct M
anag
emen
t lab
or c
ost -
Ope
x po
rtio
nO
pex
Pro
ject
Man
agem
ent
$1.8
31.
97$
-$
-$
-$
129
AM
F In
tern
al P
roje
ct M
anag
emen
t Lea
ders
hip
Sta
ff -
Ope
x po
rtio
nO
pex
Pro
ject
Man
agem
ent
$0.3
80.
41$
-$
-$
-$
130
AM
F In
tern
al P
roje
ct M
anag
emen
t Bus
ines
s S
uppo
rt-
Ope
x po
rtio
nO
pex
Pro
ject
Man
agem
ent
$1.2
81.
38$
-$
-$
-$
134
AM
F in
vent
ory
equi
pmen
t cos
tC
apex
AM
F In
vent
ory
$1.2
6-
$
0.
50$
1.03
$
-
$
13
5P
rofe
ssio
nal S
ervi
ces
- F
ield
Dep
loym
ent S
uppo
rt W
orks
trea
m c
ost
Cap
exC
omm
unic
atio
n N
etw
ork
Inst
alla
tion
Man
agem
ent
$3.2
1-
$
0.
42$
2.00
$
1.
65$
13
6P
rofe
ssio
nal S
ervi
ces
- F
ield
Dep
loym
ent S
uppo
rt W
orks
trea
m T
rave
l Exp
ense
s co
stO
pex
Com
mun
icat
ion
Net
wor
k In
stal
latio
n M
anag
eme
nt$0
.48
-$
0.06
$
0.
30$
0.25
$
201
Bac
k-O
ffice
Rev
enue
Ass
uran
ce A
naly
st c
ost
Ope
xO
ngoi
ng B
usin
ess
Man
agem
ent
$0.0
0-
$
-
$
-
$
-
$
20
2C
ost o
f the
ft in
vest
igat
ions
Ope
xO
ngoi
ng B
usin
ess
Man
agem
ent
$0.0
0-
$
-
$
-
$
-
$
20
3C
MS
Dep
loym
ent C
ente
r, F
acili
ty c
ost
Cap
exS
uppo
rt In
fras
truc
ture
$1.3
5-
$
1.
06$
0.54
$
-
$
20
4C
MS
Bac
k O
ffice
& C
leric
al c
ost
Cap
exS
uppo
rt In
fras
truc
ture
$1.8
6-
$
1.
46$
0.75
$
-
$
20
5S
ervi
ce R
epre
sent
ativ
e T
ools
/ U
nifo
rm c
ost
Cap
exS
uppo
rt In
fras
truc
ture
$0.1
9-
$
0.
16$
0.06
$
-
$
20
6In
stal
led
met
er Q
ualit
y A
ssur
ance
/ Q
ualit
y C
heck
cos
tC
apex
Sup
port
Infr
astr
uctu
re$0
.61
-$
0.48
$
0.
25$
-$
207
CM
S D
eplo
ymen
t Coo
rdin
atio
n La
bor
cost
Cap
exS
uppo
rt In
fras
truc
ture
$0.8
2-
$
0.
64$
0.33
$
-
$
20
8C
MS
Fie
ld In
stal
ler
Initi
al T
rain
ing
Cap
exS
uppo
rt In
fras
truc
ture
$0.7
80.
43$
0.44
$
-
$
-
$
20
9C
MS
Cel
lula
r C
omm
unic
atio
n co
stC
apex
Sup
port
Infr
astr
uctu
re$0
.06
-$
0.04
$
0.
02$
-$
210
Han
dhel
d D
evic
es c
ost
Cap
exS
uppo
rt In
fras
truc
ture
$0.0
5-
$
0.
06$
-$
-$
300
AM
F A
dditi
onal
Met
er D
ata
Ser
vice
s la
bor
cost
Ope
xO
ngoi
ng B
usin
ess
Man
agem
ent
$4.1
8-
$
0.
34$
0.70
$
7.
84$
30
1B
illin
g S
yste
m D
evel
opm
ent T
estin
gO
pex
Ong
oing
Bus
ines
s M
anag
emen
t$2
.09
-$
0.17
$
0.
35$
3.92
$
302
MD
S S
yste
m D
evel
opm
ent T
estin
gC
apex
Sup
port
Infr
astr
uctu
re$0
.61
0.49
$
0.
17$
-$
-$
400
Cus
tom
er E
ngag
emen
t Pla
n C
ost
Ope
xC
usto
mer
Eng
agem
ent C
ost
$8.3
00.
93$
3.39
$
2.
00$
4.62
$
501
CS
S E
nhan
cem
ents
Cap
ex C
ost
Cap
exC
usto
mer
Ser
vice
Sys
tem
$7.4
05.
36$
2.79
$
-
$
-
$
50
2P
rofe
ssio
nal S
ervi
ces
- H
ead
End
/MD
M S
olut
ion
Pro
gram
Man
agem
ent c
ost
Ope
xA
MF
Hea
d-en
d an
d M
eter
Dat
a M
anag
emen
t Sys
tem
s*$2
.20
0.28
$
1.
29$
1.03
$
-
$
50
3E
nerg
y M
onito
ring
Por
tal O
pex
Cos
tO
pex
Cus
tom
er E
ngag
emen
t Pro
duct
s an
d S
ervi
ces
$1.3
90.
12$
0.03
$
-
$
2.
94$
50
4G
reen
But
ton
Con
nect
Cap
ex C
ost
Cap
exC
usto
mer
Eng
agem
ent P
rodu
cts
and
Ser
vice
s$2
.79
2.27
$
0.
78$
-$
-$
513
Tel
ecom
Cap
ex c
ost
Cap
exIS
Infr
astr
uctu
re$0
.10
0.05
$
0.
03$
0.03
$
-
$
51
4E
SB
Cap
ex c
ost
Cap
exIS
Infr
astr
uctu
re$7
.51
1.81
$
3.
01$
0.52
$
5.
71$
51
6In
form
atio
n M
anag
emen
t Cap
ex c
ost
Cap
exIS
Infr
astr
uctu
re$2
.44
0.84
$
0.
99$
0.62
$
0.
64$
51
7D
ata
Lake
Cap
ex c
ost
Cap
exIS
Infr
astr
uctu
re$0
.23
0.24
$
-
$
-
$
-
$
51
8P
rofe
ssio
nal S
ervi
ces
- H
ead
End
/MD
M S
yste
ms
Impl
emen
tatio
n W
orks
trea
m c
ost
Ope
xA
MF
Hea
d-en
d an
d M
eter
Dat
a M
anag
emen
t Sys
tem
s*$
5.11
4.81
$
0.
73$
-$
-$
519
Saa
S S
etup
Fee
s -
One
Tim
e S
etup
(V
ersi
on u
pgra
de a
nd s
cale
-up
exis
ting
syst
em)
cost
Ope
xA
MF
Hea
d-en
d an
d M
eter
Dat
a M
anag
emen
t S
yste
ms*
$0.1
90.
20$
-$
-$
-$
THE NARRAGANSETT ELECTRIC COMPANY d/b/a NATIONAL GRID RIPUC Docket No. 4770 Workpaper 4.1 - AMF Costs, REDACTED Page 2 of 9
37

AM
F C
osts
and
Ben
efits
(in m
illio
ns)
TH
E N
AR
RA
GA
NS
ET
T E
LE
CT
RIC
CO
MP
AN
Yd/
b/a
NA
TIO
NA
L G
RID
RIP
UC
Doc
ket N
o. 4
770
Wor
kpap
er 4
.1 -
AM
F C
osts
, RE
DA
CT
ED
Pag
e 3
of 9
#D
escr
ipti
on
Cat
ego
ryG
rou
pN
PV
FY
20
FY
21
FY
22
FY
23
- F
Y 3
9
CO
ST
S (
CO
MB
INE
D)
520
Saa
S F
ees
- H
eade
nd S
oftw
are
(OW
OC
CM
, OW
OC
PM
, IE
E M
DM
, IoT
FN
D, F
DM
) co
stO
pex
AM
F H
ead-
end
and
Met
er D
ata
Man
agem
ent S
yste
ms*
$51.
98-
$
1.
44$
3.97
$
11
4.06
$
52
1P
rofe
ssio
nal S
ervi
ces
- S
yste
m a
nd M
eter
Firm
war
e U
pgra
de c
ost
Ope
xA
MF
Hea
d-en
d an
d M
eter
Dat
a M
anag
emen
t Sys
tem
s*$0
.59
-$
-$
-$
1.05
$
522
Tel
ecom
Ope
x co
stO
pex
IS In
fras
truc
ture
$0.0
0-
$
-
$
-
$
-
$
52
3T
elec
om R
TB
Cos
tO
pex
IS In
fras
truc
ture
$6.6
5-
$
0.
11$
0.41
$
14
.33
$
52
4E
SB
Ope
x co
stO
pex
IS In
fras
truc
ture
$0.5
20.
21$
0.30
$
0.
08$
-$
525
ES
B R
TB
Cos
tO
pex
IS In
fras
truc
ture
$6.3
10.
00$
0.11
$
0.
48$
13.4
3$
526
Dat
a La
ke O
pex
cost
Ope
xIS
Infr
astr
uctu
re$2
.14
0.15
$
0.
13$
0.16
$
4.
00$
52
7P
rofe
ssio
nal S
ervi
ces
- H
ead
End
/MD
M S
olut
ion
Pro
gram
Man
agem
ent T
rave
l Exp
ense
s c o
Ope
xA
MF
Hea
d-en
d an
d M
eter
Dat
a M
anag
emen
t Sys
tem
s*$0
.33
0.04
$
0.
19$
0.15
$
-
$
52
8P
rofe
ssio
nal S
ervi
ces
- H
ead
End
/MD
M S
yste
ms
Impl
emen
tatio
n W
orks
trea
m T
rave
l Exp
e nO
pex
AM
F H
ead-
end
and
Met
er D
ata
Man
agem
ent S
yste
ms*
$0.7
70.
72$
0.11
$
-
$
-
$
52
9G
reen
But
ton
Con
nect
Ope
x C
ost
Ope
xC
usto
mer
Eng
agem
ent P
rodu
cts
and
Ser
vice
s$0
.82
0.55
$
0.
35$
-$
-$
530
Info
rmat
ion
Man
agem
ent O
pex
cost
Ope
xIS
Infr
astr
uctu
re$0
.47
0.02
$
0.
03$
0.03
$
0.
92$
53
1In
form
atio
n M
anag
emen
t RT
B C
ost
Ope
xIS
Infr
astr
uctu
re$3
.07
-$
0.06
$
0.
20$
6.56
$
532
Ene
rgy
Mon
itorin
g P
orta
l RT
B C
ost
Ope
xC
usto
mer
Eng
agem
ent P
rodu
cts
and
Ser
vice
s$0
.41
-$
0.01
$
0.
03$
0.86
$
533
CS
S E
nhan
cem
ents
Ope
x C
ost
Ope
xC
usto
mer
Ser
vice
Sys
tem
$0.2
90.
01$
0.22
$
0.
05$
0.07
$
534
CS
S E
nhan
cem
ents
RT
B C
ost
Ope
xC
usto
mer
Ser
vice
Sys
tem
$0.2
0-
$
-
$
0.
00$
0.46
$
535
Gre
en B
utto
n C
onne
ct R
TB
Cos
tO
pex
Cus
tom
er E
ngag
emen
t Pro
duct
s an
d S
ervi
ces
$4.9
3-
$
0.
15$
0.40
$
10
.31
$
53
6D
ata
Lake
RT
B c
ost
Ope
xIS
Infr
astr
uctu
re$1
.29
-$
0.03
$
0.
10$
2.72
$
600
Cyb
er S
ecur
ity P
roje
ct C
apex
Initi
alC
apex
Cyb
er S
ecur
ity$7
.31
4.29
$
2.
52$
1.41
$
-
$
60
1C
yber
Sec
urity
Pro
ject
Ope
x In
itial
Ope
xC
yber
Sec
urity
$3.2
62.
01$
1.04
$
0.
60$
-$
602
Cyb
er S
ecur
ity P
roje
ct R
TB
O&
MO
pex
Cyb
er S
ecur
ity$5
.25
0.03
$
0.
16$
0.37
$
11
.63
$
60
3C
yber
Sec
urity
Ref
resh
/ R
emov
al C
apita
l C
apex
Cyb
er S
ecur
ity$7
.91
-$
-$
-$
18.9
4$
604
Cyb
er S
ecur
ity C
apita
l Ref
resh
/ R
emov
al O
pex
Ope
xC
yber
Sec
urity
$3.9
4-
$
-
$
0.
00$
8.85
$
To
tal C
ost
259.
75$
32
.55
$
62.3
2$
85
.70
$
246.
74$
100-
400'
sC
apex
93.4
3$
2.30
$
39
.23
$
67.1
0$
6.
28$
O
pex
27.8
1$
6.22
$
6.
20$
7.33
$
22
.97
$
T
otal
121.
24$
8.
53$
45.4
3$
74
.44
$
29.2
5$
500'
sC
apex
20.4
7$
10.5
8$
7.
60$
1.17
$
6.
35$
O
pex
89.6
5$
7.12
$
5.
29$
7.12
$
17
1.71
$
T
otal
110.
12$
17
.69
$
12.8
9$
8.
29$
178.
07$
600'
sC
apex
15.2
2$
4.29
$
2.
52$
1.41
$
18
.94
$
O
pex
12.4
5$
2.04
$
1.
20$
0.97
$
20
.49
$
T
otal
27.6
7$
6.33
$
3.
72$
2.39
$
39
.42
$
Tot
al C
apex
129.
11$
17
.17
$
49.3
5$
69
.68
$
31.5
7$
Tot
al O
pen
129.
91$
15
.38
$
12.6
8$
15
.43
$
215.
17$
THE NARRAGANSETT ELECTRIC COMPANY d/b/a NATIONAL GRID RIPUC Docket No. 4770 Workpaper 4.1 - AMF Costs, REDACTED Page 3 of 9
38

AM
F C
osts
and
Ben
efits
(in m
illio
ns)
TH
E N
AR
RA
GA
NS
ET
T E
LE
CT
RIC
CO
MP
AN
Yd/
b/a
NA
TIO
NA
L G
RID
RIP
UC
Doc
ket N
o. 4
770
Wor
kpap
er 4
.1 -
AM
F C
osts
, RE
DA
CT
ED
Pag
e 4
of 9
#D
escr
ipti
on
Cat
ego
ryG
rou
pN
PV
FY
20
FY
21
FY
22
FY
23
- F
Y 3
9
BE
NE
FIT
S (
Ele
ctri
c)
2B
enef
it fr
om e
limin
ated
AM
R m
eter
rea
ders
Ope
xA
MR
Met
er R
eadi
ng$1
3.51
-$
-$
0.46
$
30
.98
$
3
Ben
efit
from
elim
inat
ed A
MR
met
er r
eade
r ve
hicl
e co
sts
Ope
xA
MR
Met
er R
eadi
ng$1
.23
-$
-$
0.04
$
2.
81$
4
CO
2 be
nefit
from
elim
inat
ed A
MR
veh
icle
em
issi
ons
Em
issi
ons
AM
R M
eter
Rea
ding
(C
O2)
$0.0
2-
$
-
$
0.
00$
0.04
$
5B
enef
it fr
om r
educ
tion
of m
eter
inve
stig
atio
nsO
pex
Met
er In
vest
igat
ion
$6.2
0-
$
-
$
0.
21$
14.2
1$
6B
enef
it fr
om r
emot
e m
eter
ing
capa
bilit
ies
Ope
xR
emot
e C
onne
ct a
nd D
isco
nnec
t$2
6.90
-$
-$
0.92
$
61
.66
$
9
Ben
efit
from
impr
ovem
ent i
n ba
d de
bt w
rite-
offs
Ope
xR
educ
tion
in W
rite-
offs
$0.0
0-
$
-
$
-
$
18
.89
$
11
Ben
efit
from
miti
gatio
n / r
educ
tion
of d
amag
e cl
aim
sO
pex
Red
uctio
n in
Dam
age
Cla
ims
$2.6
1-
$
-
$
-
$
6.
13$
13
Ben
efit
from
red
uctio
n of
AM
R th
eft /
und
erm
eter
ing
Ope
xR
educ
tion
in T
heft
of S
ervi
ce$0
.00
-$
-$
1.22
$
80
.02
$
14
Ben
efit
from
VV
O/A
MF
inte
grat
ion
Ope
xV
olt-
VA
R O
ptim
izat
ion
$13.
73-
$
-
$
-
$
36
.88
$
15C
O2
bene
fit fr
om V
VO
/AM
F in
tegr
atio
nLo
sses
Vol
t-V
AR
Opt
imiz
atio
n (C
O2)
$5.4
6-
$
-
$
0.
14$
12.4
8$
16B
enef
it fr
om E
nerg
y In
sigh
ts/H
igh
usag
e al
erts
Rev
enue
Ene
rgy
Insi
ghts
/Hig
h U
sage
Ale
rts
$17.
78-
$
0.
40$
1.34
$
40
.40
$
17
CO
2 be
nefit
from
Ene
rgy
Insi
ghts
/Hig
h us
age
aler
tsLo
sses
Ene
rgy
Insi
ghts
/Hig
h U
sage
Ale
rts
(CO
2)$7
.88
-$
0.36
$
1.
05$
14.3
6$
18C
O2
bene
fit fr
om r
educ
tion
of m
eter
inve
stig
atio
nsE
mis
sion
sM
eter
Inve
stig
atio
n (C
O2)
$0.0
1-
$
-
$
0.
00$
0.03
$
19C
O2
bene
fit fr
om r
emot
e m
eter
ing
capa
bilit
ies
Em
issi
ons
Rem
ote
Con
nect
and
Dis
conn
ect (
CO
2)$0
.17
-$
-$
0.01
$
0.
35$
20O
utag
e M
anag
emen
t ope
ratio
nal b
enef
itO
pex
Sto
rm O
MS
Ben
efit
$1.8
8-
$
-
$
-
$
4.
42$
25B
enef
it fr
om E
lect
ric V
ehic
le T
VP
Ope
xE
lect
ric V
ehic
le P
ricin
g$2
4.81
-$
-$
-$
68.6
6$
26Lo
w-E
nd R
ed. &
Opt
-In
bene
fit fr
om C
ritic
al P
eak
Pric
ing
(CP
P)
peak
sha
ving
Ope
xT
ime
Var
ying
Pric
ing
$4.5
9-
$
-
$
-
$
12
.75
$
27
Low
-End
Red
. & O
pt-I
n be
nefit
from
Avo
ided
Ene
rgy
due
to T
ime-
of-U
se P
rogr
amO
pex
Tim
e V
aryi
ng P
ricin
g$3
.84
-$
-$
-$
10.6
5$
28Lo
w-E
nd R
ed. &
Opt
-In
CO
2 sa
ving
s fr
om A
void
ed E
nerg
y du
e to
Tim
e-of
-Use
Pro
gram
Em
issi
ons
Tim
e V
aryi
ng P
ricin
g (C
O2)
$2.8
6-
$
-
$
-
$
7.
59$
30B
enef
it fr
om E
lect
rom
echa
nica
l met
er A
ccur
acy
Ope
xE
lect
rom
echa
nica
l Met
er$0
.00
-$
2.08
$
4.
38$
20.8
9$
100
Avo
ided
Ele
ctric
AM
R E
quip
men
t Met
er R
epla
cem
ent
Cap
exC
apita
l $3
2.00
0.86
$
0.
89$
16.1
0$
30
.97
$
10
2A
void
ed A
MF
ele
ctric
met
er in
stal
latio
n co
st -
Cap
ex p
ortio
nC
apex
Cap
ital
$20.
600.
55$
0.57
$
10
.30
$
20.1
5$
105
Avo
ided
AM
F d
emon
stra
tion
perio
d co
stO
pex
Ope
ratio
ns &
Mai
nten
ance
$1.0
71.
16$
-$
-$
-$
123
Avo
ided
cos
t fro
m c
all c
ente
r an
d A
MO
, im
plem
enta
tion
Ope
xO
pera
tions
& M
aint
enan
ce$2
.44
-$
1.08
$
1.
87$
-$
124
Avo
ided
AM
F In
tern
al P
roje
ct M
anag
emen
t Lea
ders
hip
Sta
ff -
Cap
ex p
ortio
nC
apex
Cap
ital
$0.4
7-
$
0.
27$
0.28
$
-
$
12
6A
void
ed A
MF
ele
ctric
met
er in
stal
latio
n co
st -
CO
R p
ortio
nC
OR
Cap
ital
$0.6
40.
02$
0.02
$
0.
32$
0.62
$
128
Avo
ided
AM
F E
xter
nal P
roje
ct M
anag
emen
t lab
or c
ost -
Ope
x po
rtio
nO
pex
Ope
ratio
ns &
Mai
nten
ance
$0.0
0-
$
-
$
-
$
-
$
12
9A
void
ed A
MF
Inte
rnal
Pro
ject
Man
agem
ent L
eade
rshi
p S
taff
- O
pex
port
ion
Ope
xO
pera
tions
& M
aint
enan
ce$0
.25
0.27
$
-
$
-
$
-
$
13
4A
void
ed A
MF
inve
ntor
y eq
uipm
ent c
ost
Cap
exC
apita
l $0
.80
0.02
$
0.
02$
0.40
$
0.
77$
203
Avo
ided
CM
S D
eplo
ymen
t Cen
ter,
Fac
ility
cos
tC
apex
Cap
ital
$1.3
5-
$
1.
06$
0.54
$
-
$
20
4A
void
ed C
MS
Bac
k O
ffice
& C
leric
al c
ost
Cap
exC
apita
l $1
.86
-$
1.46
$
0.
75$
-$
205
Avo
ided
Ser
vice
Rep
rese
ntat
ive
Too
ls /
Uni
form
cos
tC
apex
Cap
ital
$0.1
9-
$
0.
16$
0.06
$
-
$
20
6A
void
ed In
stal
led
met
er Q
ualit
y A
ssur
ance
/ Q
ualit
y C
heck
cos
tC
apex
Cap
ital
$0.6
1-
$
0.
48$
0.25
$
-
$
20
7A
void
ed C
MS
Dep
loym
ent C
oord
inat
ion
Labo
r co
stC
apex
Cap
ital
$0.8
2-
$
0.
64$
0.33
$
-
$
20
8A
void
ed C
MS
Fie
ld In
stal
ler
Initi
al T
rain
ing
Cap
exC
apita
l $0
.78
0.43
$
0.
44$
-$
-$
209
Avo
ided
CM
S C
ellu
lar
Com
mun
icat
ion
cost
Cap
exC
apita
l $0
.06
-$
0.04
$
0.
02$
-$
210
Avo
ided
Han
dhel
d D
evic
es c
ost
Cap
exC
apita
l $0
.05
-$
0.06
$
-
$
-
$
302
Avo
ided
MD
S S
yste
m D
evel
opm
ent T
estin
gC
apex
Cap
ital
$0.0
40.
03$
0.01
$
-
$
-
$
400
Avo
ided
Cus
tom
er E
ngag
emen
t Pla
n C
ost
Ope
xO
pera
tions
& M
aint
enan
ce$2
.07
0.23
$
0.
85$
0.50
$
1.
16$
540
Avo
ided
FC
S C
osts
Ope
xF
CS
Met
er R
eadi
ng$0
.28
-$
-$
0.01
$
0.
66$
54
1A
void
ed In
terv
al M
eter
Rea
ding
Cos
tsO
pex
Inte
rval
Met
er R
eadi
ng$0
.02
-$
0.00
$
0.
00$
0.03
$
To
tal B
enef
it$1
99.8
73.
57$
10.8
7$
41
.51
$
498.
54$
THE NARRAGANSETT ELECTRIC COMPANY d/b/a NATIONAL GRID RIPUC Docket No. 4770 Workpaper 4.1 - AMF Costs, REDACTED Page 4 of 9
39

AM
F C
osts
and
Ben
efits
(in m
illio
ns)
TH
E N
AR
RA
GA
NS
ET
T E
LE
CT
RIC
CO
MP
AN
Yd/
b/a
NA
TIO
NA
L G
RID
RIP
UC
Doc
ket N
o. 4
770
Wor
kpap
er 4
.1 -
AM
F C
osts
, RE
DA
CT
ED
Pag
e 5
of 9
#D
escr
ipti
on
Cat
ego
ryG
rou
pN
PV
FY
20
FY
21
FY
22
FY
23
- F
Y 3
9
CO
ST
S (
Ele
ctri
c)
100
AM
F e
lect
ric m
eter
equ
ipm
ent c
ost
Cap
exA
MF
Ele
ctric
Met
er E
quip
men
t and
Inst
alla
tion
$50.
50-
$
20
.03
$
41.2
1$
-
$
10
2A
MF
ele
ctric
met
er in
stal
latio
n co
st -
Cap
ex p
ortio
nC
apex
AM
F E
lect
ric M
eter
Equ
ipm
ent a
nd In
stal
latio
n$2
3.35
-$
9.25
$
19
.08
$
-$
104
AM
F fa
iled
met
er e
quip
men
t rep
lace
men
t cos
tC
apex
Equ
ipm
ent a
nd In
stal
latio
n R
efre
sh C
ost
$0.8
9-
$
0.
03$
0.09
$
1.
86$
10
5A
MF
dem
onst
ratio
n pe
riod
cost
Ope
xA
MF
Ele
ctric
Met
er E
quip
men
t and
Inst
alla
tion
$1.4
31.
54$
-$
-$
-$
110
AM
F n
etw
ork
engi
neer
ing,
des
ign,
con
trac
ting
cost
Cap
exN
etw
ork
Equ
ipm
ent a
nd In
stal
latio
n$0
.06
0.07
$
-
$
-
$
-
$
11
1N
etw
ork
com
mun
icat
ions
equ
ipm
ent c
ost,
Ele
ctric
Met
ers
Cap
exN
etw
ork
Equ
ipm
ent a
nd In
stal
latio
n$1
.29
-$
0.51
$
1.
05$
-$
112
Net
wor
k co
mm
unic
atio
ns e
quip
men
t cos
t, G
as M
eter
sC
apex
Net
wor
k E
quip
men
t and
Inst
alla
tion
$0.0
0-
$
-
$
-
$
-
$
11
3N
etw
ork
com
mun
icat
ions
inst
alla
tion
cost
, Ele
ctric
Met
ers
Cap
exN
etw
ork
Equ
ipm
ent a
nd In
stal
latio
n$0
.10
-$
0.04
$
0.
09$
-$
114
Net
wor
k co
mm
unic
atio
ns in
stal
latio
n co
st, G
as M
eter
sC
apex
Net
wor
k E
quip
men
t and
Inst
alla
tion
$0.0
0-
$
-
$
-
$
-
$
11
5N
etw
ork
com
mun
icat
ions
LT
E b
ackh
aul c
ost,
Ele
ctric
Met
ers
Ope
xB
ackh
aul
$0.9
5-
$
0.
03$
0.09
$
2.
00$
11
6N
etw
ork
com
mun
icat
ions
LT
E b
ackh
aul c
ost,
Gas
Met
ers
Ope
xB
ackh
aul
$0.0
0-
$
-
$
-
$
-
$
11
7A
MF
met
er c
ellu
lar
serv
ice
cost
, Ele
ctric
Met
ers
Ope
xE
quip
men
t and
Inst
alla
tion
Ref
resh
Cos
t$1
.55
-$
0.05
$
0.
15$
3.25
$
118
Net
wor
k co
mm
unic
atio
ns e
quip
men
t cos
t upg
rade
Cap
exN
etw
ork
Equ
ipm
ent a
nd In
stal
latio
n$1
.00
-$
-$
-$
2.06
$
119
AM
F c
omm
unic
atio
ns fa
iled
equi
pmen
t rep
lace
men
t cos
tC
apex
Equ
ipm
ent a
nd In
stal
latio
n R
efre
sh C
ost
$0.1
6-
$
-
$
0.
01$
0.37
$
120
AM
F c
omm
unic
atio
ns e
quip
men
t O&
M c
ost (
outs
ide
war
rant
y)O
pex
Equ
ipm
ent a
nd In
stal
latio
n R
efre
sh C
ost
$0.3
2-
$
-
$
-
$
0.
74$
12
1A
MF
Ext
erna
l Pro
ject
Man
agem
ent l
abor
cos
t - C
apex
por
tion
Cap
exP
roje
ct M
anag
emen
t$1
.13
-$
1.31
$
-
$
-
$
12
3C
ost f
rom
cal
l cen
ter
and
AM
O, i
mpl
emen
tatio
nO
pex
Pro
ject
Man
agem
ent
$4.8
7-
$
2.
15$
3.74
$
-
$
12
4A
MF
Inte
rnal
Pro
ject
Man
agem
ent L
eade
rshi
p S
taff
- C
apex
por
tion
Cap
exP
roje
ct M
anag
emen
t$0
.47
-$
0.27
$
0.
28$
-$
125
AM
F In
tern
al P
roje
ct M
anag
emen
t Bus
ines
s S
uppo
rt -
Cap
ex p
ortio
nC
apex
Pro
ject
Man
agem
ent
$1.5
70.
83$
0.92
$
-
$
-
$
12
6A
MF
ele
ctric
met
er in
stal
latio
n co
st -
CO
R p
ortio
nC
OR
AM
F E
lect
ric M
eter
Equ
ipm
ent a
nd In
stal
latio
n$0
.72
-$
0.29
$
0.
59$
-$
128
AM
F E
xter
nal P
roje
ct M
anag
emen
t lab
or c
ost -
Ope
x po
rtio
nO
pex
Pro
ject
Man
agem
ent
$1.1
81.
27$
-$
-$
-$
129
AM
F In
tern
al P
roje
ct M
anag
emen
t Lea
ders
hip
Sta
ff -
Ope
x po
rtio
nO
pex
Pro
ject
Man
agem
ent
$0.2
50.
27$
-$
-$
-$
130
AM
F In
tern
al P
roje
ct M
anag
emen
t Bus
ines
s S
uppo
rt-
Ope
x po
rtio
nO
pex
Pro
ject
Man
agem
ent
$0.8
30.
89$
-$
-$
-$
134
AM
F in
vent
ory
equi
pmen
t cos
tC
apex
AM
F In
vent
ory
$1.2
6-
$
0.
50$
1.03
$
-
$
13
5P
rofe
ssio
nal S
ervi
ces
- F
ield
Dep
loym
ent S
uppo
rt W
orks
trea
m c
ost
Cap
exC
omm
unic
atio
n N
etw
ork
Inst
alla
tion
Man
agem
ent
$3.2
1-
$
0.
42$
2.00
$
1.
65$
13
6P
rofe
ssio
nal S
ervi
ces
- F
ield
Dep
loym
ent S
uppo
rt W
orks
trea
m T
rave
l Exp
ense
s co
stO
pex
Com
mun
icat
ion
Net
wor
k In
stal
latio
n M
anag
eme
nt$0
.48
-$
0.06
$
0.
30$
0.25
$
201
Bac
k-O
ffice
Rev
enue
Ass
uran
ce A
naly
st c
ost
Ope
xO
ngoi
ng B
usin
ess
Man
agem
ent
$0.0
0-
$
-
$
-
$
-
$
20
2C
ost o
f the
ft in
vest
igat
ions
Ope
xO
ngoi
ng B
usin
ess
Man
agem
ent
$0.0
0-
$
-
$
-
$
-
$
20
3C
MS
Dep
loym
ent C
ente
r, F
acili
ty c
ost
Cap
exS
uppo
rt In
fras
truc
ture
$1.3
5-
$
1.
06$
0.54
$
-
$
20
4C
MS
Bac
k O
ffice
& C
leric
al c
ost
Cap
exS
uppo
rt In
fras
truc
ture
$1.8
6-
$
1.
46$
0.75
$
-
$
20
5S
ervi
ce R
epre
sent
ativ
e T
ools
/ U
nifo
rm c
ost
Cap
exS
uppo
rt In
fras
truc
ture
$0.1
9-
$
0.
16$
0.06
$
-
$
20
6In
stal
led
met
er Q
ualit
y A
ssur
ance
/ Q
ualit
y C
heck
cos
tC
apex
Sup
port
Infr
astr
uctu
re$0
.61
-$
0.48
$
0.
25$
-$
207
CM
S D
eplo
ymen
t Coo
rdin
atio
n La
bor
cost
Cap
exS
uppo
rt In
fras
truc
ture
$0.8
2-
$
0.
64$
0.33
$
-
$
20
8C
MS
Fie
ld In
stal
ler
Initi
al T
rain
ing
Cap
exS
uppo
rt In
fras
truc
ture
$0.7
80.
43$
0.44
$
-
$
-
$
20
9C
MS
Cel
lula
r C
omm
unic
atio
n co
stC
apex
Sup
port
Infr
astr
uctu
re$0
.06
-$
0.04
$
0.
02$
-$
210
Han
dhel
d D
evic
es c
ost
Cap
exS
uppo
rt In
fras
truc
ture
$0.0
5-
$
0.
06$
-$
-$
300
AM
F A
dditi
onal
Met
er D
ata
Ser
vice
s la
bor
cost
Ope
xO
ngoi
ng B
usin
ess
Man
agem
ent
$2.7
1-
$
0.
22$
0.45
$
5.
08$
30
1B
illin
g S
yste
m D
evel
opm
ent T
estin
gO
pex
Ong
oing
Bus
ines
s M
anag
emen
t$2
.09
-$
0.17
$
0.
35$
3.92
$
302
MD
S S
yste
m D
evel
opm
ent T
estin
gC
apex
Sup
port
Infr
astr
uctu
re$0
.39
0.32
$
0.
11$
-$
-$
400
Cus
tom
er E
ngag
emen
t Pla
n C
ost
Ope
xC
usto
mer
Eng
agem
ent C
ost
$8.3
00.
93$
3.39
$
2.
00$
4.62
$
501
CS
S E
nhan
cem
ents
Cap
ex C
ost
Cap
exC
usto
mer
Ser
vice
Sys
tem
$4.7
93.
47$
1.81
$
-
$
-
$
50
2P
rofe
ssio
nal S
ervi
ces
- H
ead
End
/MD
M S
olut
ion
Pro
gram
Man
agem
ent c
ost
Ope
xA
MF
Hea
d-en
d an
d M
eter
Dat
a M
anag
emen
t Sys
tem
s*$1
.43
0.18
$
0.
83$
0.67
$
-
$
50
3E
nerg
y M
onito
ring
Por
tal O
pex
Cos
tO
pex
Cus
tom
er E
ngag
emen
t Pro
duct
s an
d S
ervi
ces
$0.9
00.
08$
0.02
$
-
$
1.
90$
50
4G
reen
But
ton
Con
nect
Cap
ex C
ost
Cap
exC
usto
mer
Eng
agem
ent P
rodu
cts
and
Ser
vice
s$1
.81
1.47
$
0.
50$
-$
-$
513
Tel
ecom
Cap
ex c
ost
Cap
exIS
Infr
astr
uctu
re$0
.06
0.03
$
0.
02$
0.02
$
-
$
51
4E
SB
Cap
ex c
ost
Cap
exIS
Infr
astr
uctu
re$4
.87
1.17
$
1.
95$
0.34
$
3.
70$
51
6In
form
atio
n M
anag
emen
t Cap
ex c
ost
Cap
exIS
Infr
astr
uctu
re$1
.58
0.54
$
0.
64$
0.40
$
0.
41$
51
7D
ata
Lake
Cap
ex c
ost
Cap
exIS
Infr
astr
uctu
re$0
.15
0.16
$
-
$
-
$
-
$
51
8P
rofe
ssio
nal S
ervi
ces
- H
ead
End
/MD
M S
yste
ms
Impl
emen
tatio
n W
orks
trea
m c
ost
Ope
xA
MF
Hea
d-en
d an
d M
eter
Dat
a M
anag
emen
t Sys
tem
s*$
3.31
3.12
$
0.
47$
-$
-$
519
Saa
S S
etup
Fee
s -
One
Tim
e S
etup
(V
ersi
on u
pgra
de a
nd s
cale
-up
exis
ting
syst
em)
cost
Ope
xA
MF
Hea
d-en
d an
d M
eter
Dat
a M
anag
emen
t S
yste
ms*
$0.1
20.
13$
-$
-$
-$
THE NARRAGANSETT ELECTRIC COMPANY d/b/a NATIONAL GRID RIPUC Docket No. 4770 Workpaper 4.1 - AMF Costs, REDACTED Page 5 of 9
40
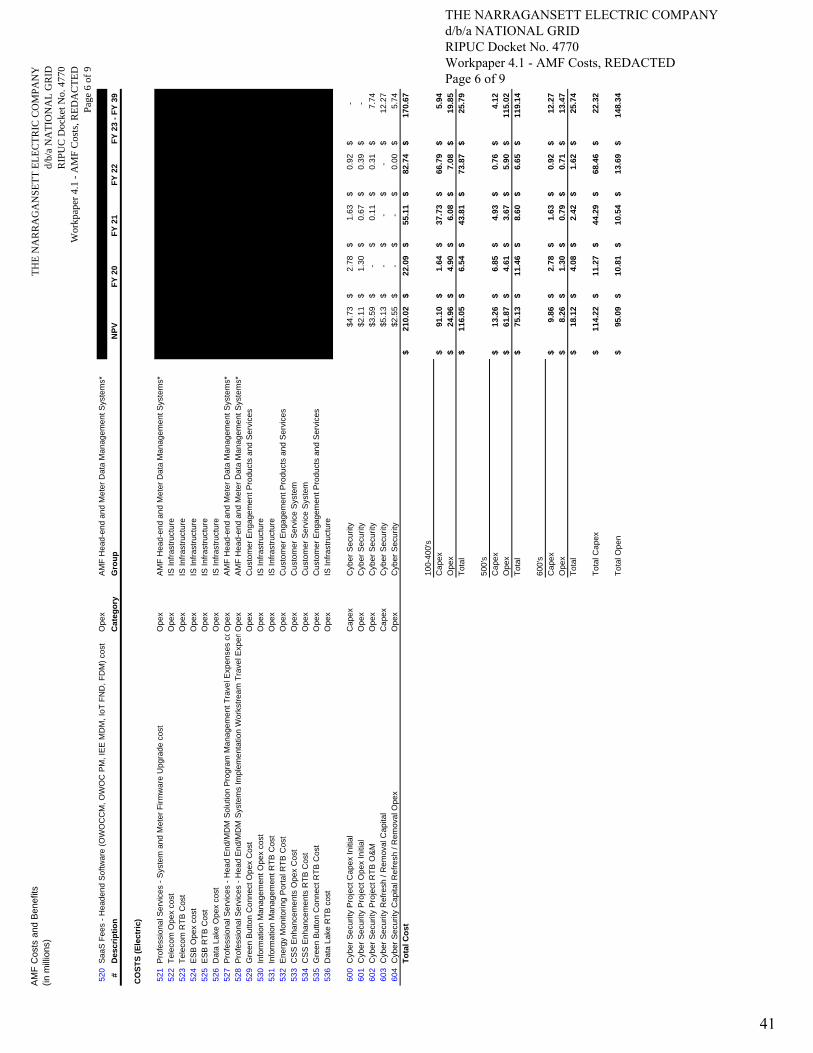
AM
F C
osts
and
Ben
efits
(in m
illio
ns)
TH
E N
AR
RA
GA
NS
ET
T E
LE
CT
RIC
CO
MP
AN
Yd/
b/a
NA
TIO
NA
L G
RID
RIP
UC
Doc
ket N
o. 4
770
Wor
kpap
er 4
.1 -
AM
F C
osts
, RE
DA
CT
ED
Pag
e 6
of 9
520
Saa
S F
ees
- H
eade
nd S
oftw
are
(OW
OC
CM
, OW
OC
PM
, IE
E M
DM
, IoT
FN
D, F
DM
) co
stO
pex
AM
F H
ead-
end
and
Met
er D
ata
Man
agem
ent S
yste
ms*
$36.
56-
$
1.
14$
3.52
$
76
.78
$
#D
escr
ipti
on
Cat
ego
ryG
rou
pN
PV
FY
20
FY
21
FY
22
FY
23
- F
Y 3
9
CO
ST
S (
Ele
ctri
c)
521
Pro
fess
iona
l Ser
vice
s -
Sys
tem
and
Met
er F
irmw
are
Upg
rade
cos
tO
pex
AM
F H
ead-
end
and
Met
er D
ata
Man
agem
ent S
yste
ms*
$0.3
8-
$
-
$
-
$
0.
68$
52
2T
elec
om O
pex
cost
Ope
xIS
Infr
astr
uctu
re$0
.00
-$
-$
-$
-$
523
Tel
ecom
RT
B C
ost
Ope
xIS
Infr
astr
uctu
re$4
.56
-$
0.08
$
0.
35$
9.55
$
524
ES
B O
pex
cost
Ope
xIS
Infr
astr
uctu
re$0
.34
0.14
$
0.
19$
0.05
$
-
$
52
5E
SB
RT
B C
ost
Ope
xIS
Infr
astr
uctu
re$4
.34
-$
0.08
$
0.
41$
8.95
$
526
Dat
a La
ke O
pex
cost
Ope
xIS
Infr
astr
uctu
re$1
.39
0.10
$
0.
08$
0.11
$
2.
59$
52
7P
rofe
ssio
nal S
ervi
ces
- H
ead
End
/MD
M S
olut
ion
Pro
gram
Man
agem
ent T
rave
l Exp
ense
s c o
Ope
xA
MF
Hea
d-en
d an
d M
eter
Dat
a M
anag
emen
t Sys
tem
s*$0
.21
0.03
$
0.
13$
0.10
$
-
$
52
8P
rofe
ssio
nal S
ervi
ces
- H
ead
End
/MD
M S
yste
ms
Impl
emen
tatio
n W
orks
trea
m T
rave
l Exp
enO
pex
AM
F H
ead-
end
and
Met
er D
ata
Man
agem
ent S
yste
ms*
$0.5
00.
47$
0.07
$
-
$
-
$
52
9G
reen
But
ton
Con
nect
Ope
x C
ost
Ope
xC
usto
mer
Eng
agem
ent P
rodu
cts
and
Ser
vice
s$0
.53
0.36
$
0.
23$
-$
-$
530
Info
rmat
ion
Man
agem
ent O
pex
cost
Ope
xIS
Infr
astr
uctu
re$0
.30
0.01
$
0.
02$
0.02
$
0.
60$
53
1In
form
atio
n M
anag
emen
t RT
B C
ost
Ope
xIS
Infr
astr
uctu
re$2
.11
-$
0.05
$
0.
17$
4.37
$
532
Ene
rgy
Mon
itorin
g P
orta
l RT
B C
ost
Ope
xC
usto
mer
Eng
agem
ent P
rodu
cts
and
Ser
vice
s$0
.28
-$
0.01
$
0.
03$
0.57
$
533
CS
S E
nhan
cem
ents
Ope
x C
ost
Ope
xC
usto
mer
Ser
vice
Sys
tem
$0.1
90.
00$
0.15
$
0.
03$
0.05
$
534
CS
S E
nhan
cem
ents
RT
B C
ost
Ope
xC
usto
mer
Ser
vice
Sys
tem
$0.1
3-
$
-
$
0.
00$
0.30
$
535
Gre
en B
utto
n C
onne
ct R
TB
Cos
tO
pex
Cus
tom
er E
ngag
emen
t Pro
duct
s an
d S
ervi
ces
$3.4
0-
$
0.
11$
0.34
$
6.
87$
53
6D
ata
Lake
RT
B c
ost
Ope
xIS
Infr
astr
uctu
re$0
.89
-$
0.02
$
0.
09$
1.81
$
600
Cyb
er S
ecur
ity P
roje
ct C
apex
Initi
alC
apex
Cyb
er S
ecur
ity$4
.73
2.78
$
1.
63$
0.92
$
-
$
60
1C
yber
Sec
urity
Pro
ject
Ope
x In
itial
Ope
xC
yber
Sec
urity
$2.1
11.
30$
0.67
$
0.
39$
-$
602
Cyb
er S
ecur
ity P
roje
ct R
TB
O&
MO
pex
Cyb
er S
ecur
ity$3
.59
-$
0.11
$
0.
31$
7.74
$
603
Cyb
er S
ecur
ity R
efre
sh /
Rem
oval
Cap
ital
Cap
exC
yber
Sec
urity
$5.1
3-
$
-
$
-
$
12
.27
$
60
4C
yber
Sec
urity
Cap
ital R
efre
sh /
Rem
oval
Ope
xO
pex
Cyb
er S
ecur
ity$2
.55
-$
-$
0.00
$
5.
74$
T
ota
l Co
st21
0.02
$
22.0
9$
55
.11
$
82.7
4$
17
0.67
$
100-
400'
sC
apex
91.1
0$
1.64
$
37
.73
$
66.7
9$
5.
94$
O
pex
24.9
6$
4.90
$
6.
08$
7.08
$
19
.85
$
T
otal
116.
05$
6.
54$
43.8
1$
73
.87
$
25.7
9$
500'
sC
apex
13.2
6$
6.85
$
4.
93$
0.76
$
4.
12$
O
pex
61.8
7$
4.61
$
3.
67$
5.90
$
11
5.02
$
T
otal
75.1
3$
11.4
6$
8.
60$
6.65
$
11
9.14
$
600'
sC
apex
9.86
$
2.
78$
1.63
$
0.
92$
12.2
7$
Ope
x8.
26$
1.30
$
0.
79$
0.71
$
13
.47
$
T
otal
18.1
2$
4.08
$
2.
42$
1.62
$
25
.74
$
Tot
al C
apex
114.
22$
11
.27
$
44.2
9$
68
.46
$
22.3
2$
Tot
al O
pen
95.0
9$
10.8
1$
10
.54
$
13.6
9$
14
8.34
$
THE NARRAGANSETT ELECTRIC COMPANY d/b/a NATIONAL GRID RIPUC Docket No. 4770 Workpaper 4.1 - AMF Costs, REDACTED Page 6 of 9
41

AM
F C
osts
and
Ben
efits
(in m
illio
ns)
TH
E N
AR
RA
GA
NS
ET
T E
LE
CT
RIC
CO
MP
AN
Yd/
b/a
NA
TIO
NA
L G
RID
RIP
UC
Doc
ket N
o. 4
770
Wor
kpap
er 4
.1 -
AM
F C
osts
, RE
DA
CT
ED
Pag
e 7
of 9
#D
escr
ipti
on
Cat
ego
ryG
rou
pN
PV
FY
20
FY
21
FY
22
FY
23
- F
Y 3
9
BE
NE
FIT
S (
GA
S)
2B
enef
it fr
om e
limin
ated
AM
R m
eter
rea
ders
Ope
xA
MR
Met
er R
eadi
ng$0
.00
-$
-$
-$
-$
3B
enef
it fr
om e
limin
ated
AM
R m
eter
rea
der
vehi
cle
cost
sO
pex
AM
R M
eter
Rea
ding
$0.0
0-
$
-
$
-
$
-
$
4
CO
2 be
nefit
from
elim
inat
ed A
MR
veh
icle
em
issi
ons
Em
issi
ons
AM
R M
eter
Rea
ding
(C
O2)
$0.0
0-
$
-
$
-
$
-
$
5
Ben
efit
from
red
uctio
n of
met
er in
vest
igat
ions
Ope
xM
eter
Inve
stig
atio
n $0
.00
-$
-$
-$
-$
6B
enef
it fr
om r
emot
e m
eter
ing
capa
bilit
ies
Ope
xR
emot
e C
onne
ct a
nd D
isco
nnec
t$0
.00
-$
-$
-$
-$
9B
enef
it fr
om im
prov
emen
t in
bad
debt
writ
e-of
fsO
pex
Red
uctio
n in
Writ
e-of
fs$0
.00
-$
-$
-$
-$
11B
enef
it fr
om m
itiga
tion
/ red
uctio
n of
dam
age
clai
ms
Ope
xR
educ
tion
in D
amag
e C
laim
s$0
.00
-$
-$
-$
-$
13B
enef
it fr
om r
educ
tion
of A
MR
thef
t / u
nder
met
erin
gO
pex
Red
uctio
n in
The
ft of
Ser
vice
$0.0
0-
$
-
$
-
$
-
$
14
Ben
efit
from
VV
O/A
MF
inte
grat
ion
Ope
xV
olt-
VA
R O
ptim
izat
ion
$0.0
0-
$
-
$
-
$
-
$
15C
O2
bene
fit fr
om V
VO
/AM
F in
tegr
atio
nLo
sses
Vol
t-V
AR
Opt
imiz
atio
n (C
O2)
$0.0
0-
$
-
$
-
$
-
$
16
Ben
efit
from
Ene
rgy
Insi
ghts
/Hig
h us
age
aler
tsR
even
ueE
nerg
y In
sigh
ts/H
igh
Usa
ge A
lert
s$4
.24
-$
0.15
$
0.
46$
8.48
$
17C
O2
bene
fit fr
om E
nerg
y In
sigh
ts/H
igh
usag
e al
erts
Loss
esE
nerg
y In
sigh
ts/H
igh
Usa
ge A
lert
s (C
O2)
$0.0
0-
$
-
$
-
$
-
$
18C
O2
bene
fit fr
om r
educ
tion
of m
eter
inve
stig
atio
nsE
mis
sion
sM
eter
Inve
stig
atio
n (C
O2)
$0.0
0-
$
-
$
-
$
-
$
19
CO
2 be
nefit
from
rem
ote
met
erin
g ca
pabi
litie
sE
mis
sion
sR
emot
e C
onne
ct a
nd D
isco
nnec
t (C
O2)
$0.0
0-
$
-
$
-
$
-
$
20O
utag
e M
anag
emen
t ope
ratio
nal b
enef
itO
pex
Sto
rm O
MS
Ben
efit
$0.0
0-
$
-
$
-
$
-
$
25B
enef
it fr
om E
lect
ric V
ehic
le T
VP
Ope
xE
lect
ric V
ehic
le P
ricin
g$0
.00
-$
-$
-$
-$
26Lo
w-E
nd R
ed. &
Opt
-In
bene
fit fr
om C
ritic
al P
eak
Pric
ing
(CP
P)
peak
sha
ving
Ope
xT
ime
Var
ying
Pric
ing
$0.0
0-
$
-
$
-
$
-
$
27
Low
-End
Red
. & O
pt-I
n be
nefit
from
Avo
ided
Ene
rgy
due
to T
ime-
of-U
se P
rogr
amO
pex
Tim
e V
aryi
ng P
ricin
g$0
.00
-$
-$
-$
-$
28Lo
w-E
nd R
ed. &
Opt
-In
CO
2 sa
ving
s fr
om A
void
ed E
nerg
y du
e to
Tim
e-of
-Use
Pro
gram
Em
issi
ons
Tim
e V
aryi
ng P
ricin
g (C
O2)
$0.0
0-
$
-
$
-
$
-
$
30B
enef
it fr
om E
lect
rom
echa
nica
l met
er A
ccur
acy
Ope
xE
lect
rom
echa
nica
l Met
er$0
.00
-$
-$
-$
-$
100
Avo
ided
Ele
ctric
AM
R E
quip
men
t Met
er R
epla
cem
ent
Cap
exC
apita
l $0
.00
-$
-$
-$
-$
102
Avo
ided
AM
F e
lect
ric m
eter
inst
alla
tion
cost
- C
apex
por
tion
Cap
exC
apita
l $0
.00
-$
-$
-$
-$
105
Avo
ided
AM
F d
emon
stra
tion
perio
d co
stO
pex
Ope
ratio
ns &
Mai
nten
ance
$0.0
0-
$
-
$
-
$
-
$
12
3A
void
ed c
ost f
rom
cal
l cen
ter
and
AM
O, i
mpl
emen
tatio
nO
pex
Ope
ratio
ns &
Mai
nten
ance
$0.0
0-
$
-
$
-
$
-
$
12
4A
void
ed A
MF
Inte
rnal
Pro
ject
Man
agem
ent L
eade
rshi
p S
taff
- C
apex
por
tion
Cap
exC
apita
l $0
.25
-$
0.15
$
0.
15$
-$
126
Avo
ided
AM
F e
lect
ric m
eter
inst
alla
tion
cost
- C
OR
por
tion
CO
RC
apita
l $0
.00
-$
-$
-$
-$
128
Avo
ided
AM
F E
xter
nal P
roje
ct M
anag
emen
t lab
or c
ost -
Ope
x po
rtio
nO
pex
Ope
ratio
ns &
Mai
nten
ance
$0.0
0-
$
-
$
-
$
-
$
12
9A
void
ed A
MF
Inte
rnal
Pro
ject
Man
agem
ent L
eade
rshi
p S
taff
- O
pex
port
ion
Ope
xO
pera
tions
& M
aint
enan
ce$0
.13
0.15
$
-
$
-
$
-
$
13
4A
void
ed A
MF
inve
ntor
y eq
uipm
ent c
ost
Cap
exC
apita
l $0
.00
-$
-$
-$
-$
203
Avo
ided
CM
S D
eplo
ymen
t Cen
ter,
Fac
ility
cos
tC
apex
Cap
ital
$0.0
0-
$
-
$
-
$
-
$
20
4A
void
ed C
MS
Bac
k O
ffice
& C
leric
al c
ost
Cap
exC
apita
l $0
.00
-$
-$
-$
-$
205
Avo
ided
Ser
vice
Rep
rese
ntat
ive
Too
ls /
Uni
form
cos
tC
apex
Cap
ital
$0.0
0-
$
-
$
-
$
-
$
20
6A
void
ed In
stal
led
met
er Q
ualit
y A
ssur
ance
/ Q
ualit
y C
heck
cos
tC
apex
Cap
ital
$0.0
0-
$
-
$
-
$
-
$
20
7A
void
ed C
MS
Dep
loym
ent C
oord
inat
ion
Labo
r co
stC
apex
Cap
ital
$0.0
0-
$
-
$
-
$
-
$
20
8A
void
ed C
MS
Fie
ld In
stal
ler
Initi
al T
rain
ing
Cap
exC
apita
l $0
.00
-$
-$
-$
-$
209
Avo
ided
CM
S C
ellu
lar
Com
mun
icat
ion
cost
Cap
exC
apita
l $0
.00
-$
-$
-$
-$
210
Avo
ided
Han
dhel
d D
evic
es c
ost
Cap
exC
apita
l $0
.00
-$
-$
-$
-$
302
Avo
ided
MD
S S
yste
m D
evel
opm
ent T
estin
gC
apex
Cap
ital
$0.0
20.
02$
0.01
$
-
$
-
$
400
Avo
ided
Cus
tom
er E
ngag
emen
t Pla
n C
ost
Ope
xO
pera
tions
& M
aint
enan
ce$0
.00
-$
-$
-$
-$
540
Avo
ided
FC
S C
osts
Ope
xF
CS
Met
er R
eadi
ng$0
.00
-$
-$
-$
-$
541
Avo
ided
Inte
rval
Met
er R
eadi
ng C
osts
Ope
xIn
terv
al M
eter
Rea
ding
$0.0
0-
$
-
$
-
$
-
$
T
ota
l Ben
efit
4.65
$
0.
16$
0.31
$
0.
61$
8.48
$
THE NARRAGANSETT ELECTRIC COMPANY d/b/a NATIONAL GRID RIPUC Docket No. 4770 Workpaper 4.1 - AMF Costs, REDACTED Page 7 of 9
42

AM
F C
osts
and
Ben
efits
(in m
illio
ns)
TH
E N
AR
RA
GA
NS
ET
T E
LE
CT
RIC
CO
MP
AN
Yd/
b/a
NA
TIO
NA
L G
RID
RIP
UC
Doc
ket N
o. 4
770
Wor
kpap
er 4
.1 -
AM
F C
osts
, RE
DA
CT
ED
Pag
e 8
of 9
#D
escr
ipti
on
Cat
ego
ryG
rou
pN
PV
FY
20
FY
21
FY
22
FY
23
- F
Y 3
9
CO
ST
S (
GA
S)
100
AM
F e
lect
ric m
eter
equ
ipm
ent c
ost
Cap
exA
MF
Ele
ctric
Met
er E
quip
men
t and
Inst
alla
tion
$0.0
0-
$
-
$
-
$
-
$
10
2A
MF
ele
ctric
met
er in
stal
latio
n co
st -
Cap
ex p
ortio
nC
apex
AM
F E
lect
ric M
eter
Equ
ipm
ent a
nd In
stal
latio
n$0
.00
-$
-$
-$
-$
104
AM
F fa
iled
met
er e
quip
men
t rep
lace
men
t cos
tC
apex
Equ
ipm
ent a
nd In
stal
latio
n R
efre
sh C
ost
$0.0
0-
$
-
$
-
$
-
$
10
5A
MF
dem
onst
ratio
n pe
riod
cost
Ope
xA
MF
Ele
ctric
Met
er E
quip
men
t and
Inst
alla
tion
$0.0
0-
$
-
$
-
$
-
$
11
0A
MF
net
wor
k en
gine
erin
g, d
esig
n, c
ontr
actin
g co
stC
apex
Net
wor
k E
quip
men
t and
Inst
alla
tion
$0.0
30.
04$
-$
-$
-$
111
Net
wor
k co
mm
unic
atio
ns e
quip
men
t cos
t, E
lect
ric M
eter
sC
apex
Net
wor
k E
quip
men
t and
Inst
alla
tion
$0.0
0-
$
-
$
-
$
-
$
11
2N
etw
ork
com
mun
icat
ions
equ
ipm
ent c
ost,
Gas
Met
ers
Cap
exN
etw
ork
Equ
ipm
ent a
nd In
stal
latio
n$0
.18
-$
0.07
$
0.
15$
-$
113
Net
wor
k co
mm
unic
atio
ns in
stal
latio
n co
st, E
lect
ric M
eter
sC
apex
Net
wor
k E
quip
men
t and
Inst
alla
tion
$0.0
0-
$
-
$
-
$
-
$
11
4N
etw
ork
com
mun
icat
ions
inst
alla
tion
cost
, Gas
Met
ers
Cap
exN
etw
ork
Equ
ipm
ent a
nd In
stal
latio
n$0
.01
-$
0.01
$
0.
01$
-$
115
Net
wor
k co
mm
unic
atio
ns L
TE
bac
khau
l cos
t, E
lect
ric M
eter
sO
pex
Bac
khau
l$0
.00
-$
-$
-$
-$
116
Net
wor
k co
mm
unic
atio
ns L
TE
bac
khau
l cos
t, G
as M
eter
sO
pex
Bac
khau
l$0
.11
-$
0.00
$
0.
00$
0.25
$
117
AM
F m
eter
cel
lula
r se
rvic
e co
st, E
lect
ric M
eter
sO
pex
Equ
ipm
ent a
nd In
stal
latio
n R
efre
sh C
ost
$0.0
0-
$
-
$
-
$
-
$
11
8N
etw
ork
com
mun
icat
ions
equ
ipm
ent c
ost u
pgra
deC
apex
Net
wor
k E
quip
men
t and
Inst
alla
tion
$0.1
4-
$
-
$
-
$
0.
29$
11
9A
MF
com
mun
icat
ions
faile
d eq
uipm
ent r
epla
cem
ent c
ost
Cap
exE
quip
men
t and
Inst
alla
tion
Ref
resh
Cos
t$0
.02
-$
-$
0.00
$
0.
05$
12
0A
MF
com
mun
icat
ions
equ
ipm
ent O
&M
cos
t (ou
tsid
e w
arra
nty)
Ope
xE
quip
men
t and
Inst
alla
tion
Ref
resh
Cos
t$0
.05
-$
-$
-$
0.11
$
121
AM
F E
xter
nal P
roje
ct M
anag
emen
t lab
or c
ost -
Cap
ex p
ortio
nC
apex
Pro
ject
Man
agem
ent
$0.6
2-
$
0.
71$
-$
-$
123
Cos
t fro
m c
all c
ente
r an
d A
MO
, im
plem
enta
tion
Ope
xP
roje
ct M
anag
emen
t$0
.00
-$
-$
-$
-$
124
AM
F In
tern
al P
roje
ct M
anag
emen
t Lea
ders
hip
Sta
ff -
Cap
ex p
ortio
nC
apex
Pro
ject
Man
agem
ent
$0.2
5-
$
0.
15$
0.15
$
-
$
12
5A
MF
Inte
rnal
Pro
ject
Man
agem
ent B
usin
ess
Sup
port
- C
apex
por
tion
Cap
exP
roje
ct M
anag
emen
t$0
.85
0.45
$
0.
50$
-$
-$
126
AM
F e
lect
ric m
eter
inst
alla
tion
cost
- C
OR
por
tion
CO
RA
MF
Ele
ctric
Met
er E
quip
men
t and
Inst
alla
tion
$0.0
0-
$
-
$
-
$
-
$
12
8A
MF
Ext
erna
l Pro
ject
Man
agem
ent l
abor
cos
t - O
pex
port
ion
Ope
xP
roje
ct M
anag
emen
t$0
.64
0.69
$
-
$
-
$
-
$
12
9A
MF
Inte
rnal
Pro
ject
Man
agem
ent L
eade
rshi
p S
taff
- O
pex
port
ion
Ope
xP
roje
ct M
anag
emen
t$0
.13
0.15
$
-
$
-
$
-
$
13
0A
MF
Inte
rnal
Pro
ject
Man
agem
ent B
usin
ess
Sup
port
- O
pex
port
ion
Ope
xP
roje
ct M
anag
emen
t$0
.45
0.49
$
-
$
-
$
-
$
13
4A
MF
inve
ntor
y eq
uipm
ent c
ost
Cap
exA
MF
Inve
ntor
y$0
.00
-$
-$
-$
-$
135
Pro
fess
iona
l Ser
vice
s -
Fie
ld D
eplo
ymen
t Sup
port
Wor
kstr
eam
cos
tC
apex
Com
mun
icat
ion
Net
wor
k In
stal
latio
n M
anag
emen
t$0
.00
-$
-$
-$
-$
136
Pro
fess
iona
l Ser
vice
s -
Fie
ld D
eplo
ymen
t Sup
port
Wor
kstr
eam
Tra
vel E
xpen
ses
cost
Ope
xC
omm
unic
atio
n N
etw
ork
Inst
alla
tion
Man
agem
ent
$0.0
0-
$
-
$
-
$
-
$
201
Bac
k-O
ffice
Rev
enue
Ass
uran
ce A
naly
st c
ost
Ope
xO
ngoi
ng B
usin
ess
Man
agem
ent
$0.0
0-
$
-
$
-
$
-
$
20
2C
ost o
f the
ft in
vest
igat
ions
Ope
xO
ngoi
ng B
usin
ess
Man
agem
ent
$0.0
0-
$
-
$
-
$
-
$
20
3C
MS
Dep
loym
ent C
ente
r, F
acili
ty c
ost
Cap
exS
uppo
rt In
fras
truc
ture
$0.0
0-
$
-
$
-
$
-
$
20
4C
MS
Bac
k O
ffice
& C
leric
al c
ost
Cap
exS
uppo
rt In
fras
truc
ture
$0.0
0-
$
-
$
-
$
-
$
20
5S
ervi
ce R
epre
sent
ativ
e T
ools
/ U
nifo
rm c
ost
Cap
exS
uppo
rt In
fras
truc
ture
$0.0
0-
$
-
$
-
$
-
$
20
6In
stal
led
met
er Q
ualit
y A
ssur
ance
/ Q
ualit
y C
heck
cos
tC
apex
Sup
port
Infr
astr
uctu
re$0
.00
-$
-$
-$
-$
207
CM
S D
eplo
ymen
t Coo
rdin
atio
n La
bor
cost
Cap
exS
uppo
rt In
fras
truc
ture
$0.0
0-
$
-
$
-
$
-
$
20
8C
MS
Fie
ld In
stal
ler
Initi
al T
rain
ing
Cap
exS
uppo
rt In
fras
truc
ture
$0.0
0-
$
-
$
-
$
-
$
20
9C
MS
Cel
lula
r C
omm
unic
atio
n co
stC
apex
Sup
port
Infr
astr
uctu
re$0
.00
-$
-$
-$
-$
210
Han
dhel
d D
evic
es c
ost
Cap
exS
uppo
rt In
fras
truc
ture
$0.0
0-
$
-
$
-
$
-
$
300
AM
F A
dditi
onal
Met
er D
ata
Ser
vice
s la
bor
cost
Ope
xO
ngoi
ng B
usin
ess
Man
agem
ent
$1.4
7-
$
0.
12$
0.25
$
2.
76$
30
1B
illin
g S
yste
m D
evel
opm
ent T
estin
gO
pex
Ong
oing
Bus
ines
s M
anag
emen
t$0
.00
-$
-$
-$
-$
302
MD
S S
yste
m D
evel
opm
ent T
estin
gC
apex
Sup
port
Infr
astr
uctu
re$0
.21
0.17
$
0.
06$
-$
-$
400
Cus
tom
er E
ngag
emen
t Pla
n C
ost
Ope
xC
usto
mer
Eng
agem
ent C
ost
$0.0
0-
$
-
$
-
$
-
$
501
CS
S E
nhan
cem
ents
Cap
ex C
ost
Cap
exC
usto
mer
Ser
vice
Sys
tem
$2.6
11.
89$
0.98
$
-
$
-
$
50
2P
rofe
ssio
nal S
ervi
ces
- H
ead
End
/MD
M S
olut
ion
Pro
gram
Man
agem
ent c
ost
Ope
xA
MF
Hea
d-en
d an
d M
eter
Dat
a M
anag
emen
t Sys
tem
s*$0
.77
0.10
$
0.
45$
0.36
$
-
$
50
3E
nerg
y M
onito
ring
Por
tal O
pex
Cos
tO
pex
Cus
tom
er E
ngag
emen
t Pro
duct
s an
d S
ervi
ces
$0.4
90.
04$
0.01
$
-
$
1.
04$
50
4G
reen
But
ton
Con
nect
Cap
ex C
ost
Cap
exC
usto
mer
Eng
agem
ent P
rodu
cts
and
Ser
vice
s$0
.98
0.80
$
0.
27$
-$
-$
513
Tel
ecom
Cap
ex c
ost
Cap
exIS
Infr
astr
uctu
re$0
.03
0.02
$
0.
01$
0.01
$
-
$
51
4E
SB
Cap
ex c
ost
Cap
exIS
Infr
astr
uctu
re$2
.64
0.64
$
1.
06$
0.18
$
2.
01$
51
6In
form
atio
n M
anag
emen
t Cap
ex c
ost
Cap
exIS
Infr
astr
uctu
re$0
.86
0.30
$
0.
35$
0.22
$
0.
23$
51
7D
ata
Lake
Cap
ex c
ost
Cap
exIS
Infr
astr
uctu
re$0
.08
0.09
$
-
$
-
$
-
$
51
8P
rofe
ssio
nal S
ervi
ces
- H
ead
End
/MD
M S
yste
ms
Impl
emen
tatio
n W
orks
trea
m c
ost
Ope
xA
MF
Hea
d-en
d an
d M
eter
Dat
a M
anag
emen
t Sys
tem
s*$
1.80
1.69
$
0.
26$
-$
-$
519
Saa
S S
etup
Fee
s -
One
Tim
e S
etup
(V
ersi
on u
pgra
de a
nd s
cale
-up
exis
ting
syst
em)
cost
Ope
xA
MF
Hea
d-en
d an
d M
eter
Dat
a M
anag
emen
t S
yste
ms*
$0.0
70.
07$
-$
-$
-$
THE NARRAGANSETT ELECTRIC COMPANY d/b/a NATIONAL GRID RIPUC Docket No. 4770 Workpaper 4.1 - AMF Costs, REDACTED Page 8 of 9
43

AM
F C
osts
and
Ben
efits
(in m
illio
ns)
TH
E N
AR
RA
GA
NS
ET
T E
LE
CT
RIC
CO
MP
AN
Yd/
b/a
NA
TIO
NA
L G
RID
RIP
UC
Doc
ket N
o. 4
770
Wor
kpap
er 4
.1 -
AM
F C
osts
, RE
DA
CT
ED
Pag
e 9
of 9
520
Saa
S F
ees
- H
eade
nd S
oftw
are
(OW
OC
CM
, OW
OC
PM
, IE
E M
DM
, IoT
FN
D, F
DM
) co
stO
pex
AM
F H
ead-
end
and
Met
er D
ata
Man
agem
ent S
yste
ms*
$15.
42-
$
0.
29$
0.45
$
37
.28
$
#D
escr
ipti
on
Cat
ego
ryG
rou
pN
PV
FY
20
FY
21
FY
22
FY
23
- F
Y 3
9
CO
ST
S (
GA
S)
521
Pro
fess
iona
l Ser
vice
s -
Sys
tem
and
Met
er F
irmw
are
Upg
rade
cos
tO
pex
AM
F H
ead-
end
and
Met
er D
ata
Man
agem
ent S
yste
ms*
$0.2
1-
$
-
$
-
$
0.
37$
52
2T
elec
om O
pex
cost
Ope
xIS
Infr
astr
uctu
re$0
.00
-$
-$
-$
-$
523
Tel
ecom
RT
B C
ost
Ope
xIS
Infr
astr
uctu
re$2
.09
-$
0.03
$
0.
06$
4.78
$
524
ES
B O
pex
cost
Ope
xIS
Infr
astr
uctu
re$0
.18
0.07
$
0.
10$
0.03
$
-
$
52
5E
SB
RT
B C
ost
Ope
xIS
Infr
astr
uctu
re$1
.97
0.00
$
0.
03$
0.07
$
4.
48$
52
6D
ata
Lake
Ope
x co
stO
pex
IS In
fras
truc
ture
$0.7
50.
05$
0.04
$
0.
06$
1.41
$
527
Pro
fess
iona
l Ser
vice
s -
Hea
d E
nd/M
DM
Sol
utio
n P
rogr
am M
anag
emen
t Tra
vel E
xpen
ses
c oO
pex
AM
F H
ead-
end
and
Met
er D
ata
Man
agem
ent S
yste
ms*
$0.1
20.
01$
0.07
$
0.
05$
-$
528
Pro
fess
iona
l Ser
vice
s -
Hea
d E
nd/M
DM
Sys
tem
s Im
plem
enta
tion
Wor
kstr
eam
Tra
vel E
xpen
Ope
xA
MF
Hea
d-en
d an
d M
eter
Dat
a M
anag
emen
t Sys
tem
s*$0
.27
0.25
$
0.
04$
-$
-$
529
Gre
en B
utto
n C
onne
ct O
pex
Cos
tO
pex
Cus
tom
er E
ngag
emen
t Pro
duct
s an
d S
ervi
ces
$0.2
90.
19$
0.12
$
-
$
-
$
53
0In
form
atio
n M
anag
emen
t Ope
x co
stO
pex
IS In
fras
truc
ture
$0.1
70.
01$
0.01
$
0.
01$
0.32
$
531
Info
rmat
ion
Man
agem
ent R
TB
Cos
tO
pex
IS In
fras
truc
ture
$0.9
6-
$
0.
02$
0.03
$
2.
19$
53
2E
nerg
y M
onito
ring
Por
tal R
TB
Cos
tO
pex
Cus
tom
er E
ngag
emen
t Pro
duct
s an
d S
ervi
ces
$0.1
3-
$
0.
00$
0.00
$
0.
29$
53
3C
SS
Enh
ance
men
ts O
pex
Cos
tO
pex
Cus
tom
er S
ervi
ce S
yste
m$0
.10
0.00
$
0.
08$
0.02
$
0.
03$
53
4C
SS
Enh
ance
men
ts R
TB
Cos
tO
pex
Cus
tom
er S
ervi
ce S
yste
m$0
.06
-$
-$
0.00
$
0.
16$
53
5G
reen
But
ton
Con
nect
RT
B C
ost
Ope
xC
usto
mer
Eng
agem
ent P
rodu
cts
and
Ser
vice
s$1
.53
-$
0.04
$
0.
06$
3.44
$
536
Dat
a La
ke R
TB
cos
tO
pex
IS In
fras
truc
ture
$0.4
0-
$
0.
01$
0.02
$
0.
91$
600
Cyb
er S
ecur
ity P
roje
ct C
apex
Initi
alC
apex
Cyb
er S
ecur
ity$2
.57
1.51
$
0.
89$
0.50
$
-
$
60
1C
yber
Sec
urity
Pro
ject
Ope
x In
itial
Ope
xC
yber
Sec
urity
$1.1
50.
71$
0.37
$
0.
21$
-$
602
Cyb
er S
ecur
ity P
roje
ct R
TB
O&
MO
pex
Cyb
er S
ecur
ity$1
.66
0.03
$
0.
04$
0.05
$
3.
90$
60
3C
yber
Sec
urity
Ref
resh
/ R
emov
al C
apita
l C
apex
Cyb
er S
ecur
ity$2
.79
-$
-$
-$
6.67
$
604
Cyb
er S
ecur
ity C
apita
l Ref
resh
/ R
emov
al O
pex
Ope
xC
yber
Sec
urity
$1.3
9-
$
-
$
0.
00$
3.12
$
To
tal C
ost
$49.
73$1
0.47
$7.2
1$2
.96
$76.
08
100-
400'
sC
apex
2.33
$
0.
66$
1.50
$
0.
32$
0.35
$
Ope
x2.
85$
1.32
$
0.
12$
0.25
$
3.
12$
T
otal
5.19
$
1.
98$
1.62
$
0.
57$
3.47
$
500'
sC
apex
7.21
$
3.
72$
2.68
$
0.
41$
2.24
$
Ope
x27
.78
$
2.
51$
1.61
$
1.
22$
56.6
9$
Tot
al34
.99
$
6.
23$
4.29
$
1.
63$
58.9
3$
600'
sC
apex
5.36
$
1.
51$
0.89
$
0.
50$
6.67
$
Ope
x4.
19$
0.74
$
0.
41$
0.27
$
7.
01$
T
otal
9.55
$
2.
25$
1.30
$
0.
77$
13.6
8$
Tot
al C
apex
14.9
0$
5.89
$
5.
07$
1.23
$
9.
25$
Tot
al O
pen
34.8
3$
4.57
$
2.
14$
1.74
$
66
.83
$
THE NARRAGANSETT ELECTRIC COMPANY d/b/a NATIONAL GRID RIPUC Docket No. 4770 Workpaper 4.1 - AMF Costs, REDACTED Page 9 of 9
44

Workpaper 5.1

THE NARRAGANSETT ELECTRIC COMPANY d/b/a NATIONAL GRID RIPUC Docket No. 4770
Witness: Nouel
Workpaper 5.1
Electric Transport Costs / Assumptions
45

TH
E N
AR
RA
GA
NS
ET
T E
LE
CT
RIC
CO
MP
AN
Yd/
b/a
NA
TIO
NA
L G
RID
RIP
UC
Doc
ket N
o. 4
770
Wor
kpap
er 5
.1 -
Ele
ctri
c T
rasn
port
Cos
ts/A
ssum
ptio
ns1
of 1
2E
lect
ric
Tra
nsp
orta
tion
In
itia
tive
- C
ost
Su
mm
ary
1T
otal
Cos
ts b
y P
rogr
am T
ype
2Y
ear
1Y
ear
2Y
ear
33-
Yea
r T
otal
3O
ff-P
eak
Cha
rgin
g R
ebat
e P
ilot
178,
745
$
244,
420
$
332,
567
$
755,
731
$
4
Cha
rgin
g S
tati
on D
emon
stra
tion
Pro
gram
1,37
7,31
3$
2,36
8,86
3$
5,33
4,83
1$
9,08
1,00
8$
5D
isco
unt P
ilot
for
DC
Fas
t Cha
rgin
g A
ccou
nts
103,
622
$
170,
650
$
264,
488
$
538,
760
$
6
Tra
nspo
rtat
ion
Edu
cati
on a
nd O
utre
ach
113,
970
$
164,
959
$
220,
468
$
499,
397
$
7
Com
pany
Fle
et E
xpan
sion
264,
000
$
128,
000
$
192,
000
$
584,
000
$
8
Init
iati
ve E
valu
atio
n30
,000
$
30
,000
$
30
,000
$
90
,000
$
9
Tot
al2,
067,
650
$
3,
106,
891
$
6,
374,
354
$
11
,548
,895
$
10 11
Pro
gram
Cos
ts b
y T
ype
of E
xpen
se12
Yea
r 1
Yea
r 2
Yea
r 3
3-Y
ear
Tot
al13
O&
M S
ubto
tal
879,
179
$
1,27
8,39
1$
2,04
7,84
3$
4,20
5,41
3$
14C
apit
al S
ubto
tal
1,18
8,47
0$
1,82
8,50
1$
4,32
6,51
1$
7,34
3,48
2$
15T
otal
2,06
7,65
0$
3,10
6,89
1$
6,37
4,35
4$
11,5
48,8
95$
16 17S
um
mar
y b
y In
itia
tive
18Y
ear
1Y
ear
2Y
ear
33-
Yea
r T
otal
19 O
ff-P
eak
Cha
rgin
g R
ebat
e P
ilot
20
Cap
ital
21
Exp
ense
17
8,74
5$
24
4,42
0$
33
2,56
7$
75
5,73
1$
22 C
harg
ing
Sta
tion
Dem
onst
rati
on P
rogr
am
23 C
apit
al
988,
470
$
1,82
8,50
1$
4,32
6,51
1$
7,14
3,48
2$
24 E
xpen
se
388,
843
$
540,
362
$
1,00
8,32
0$
1,93
7,52
5$
25 D
isco
unt P
ilot
for
DC
Fas
t Cha
rgin
g A
ccou
nts
26 C
apit
al
27 E
xpen
se
103,
622
$
170,
650
$
264,
488
$
538,
760
$
28
Tra
nspo
rtat
ion
Edu
cati
on a
nd O
utre
ach
29 C
apit
al
30 E
xpen
se
113,
970
$
164,
959
$
220,
468
$
499,
397
$
31
Com
pany
Fle
et E
xpan
sion
32
Cap
ital
20
0,00
0$
-
$
-$
20
0,00
0$
33 E
xpen
se
64,0
00$
128,
000
$
192,
000
$
384,
000
$
34
Ini
tiat
ive
Eva
luat
ion
35 E
xpen
se
30,0
00$
30,0
00$
30,0
00$
90,0
00$
36 T
otal
2,
067,
650
$
3,
106,
891
$
6,
374,
354
$
11
,548
,895
$
37 38
Off
sett
ing
Par
tici
pat
ion
Pay
men
t (4
0,00
0)$
(1
00,0
00)
$
(2
60,0
00)
$
(4
00,0
00)
$
THE NARRAGANSETT ELECTRIC COMPANY d/b/a NATIONAL GRID RIPUC Docket No. 4770 Workpaper 5.1 - Electric Transport Costs/Assumptions Page 1 of 12
46

TH
E N
AR
RA
GA
NS
ET
T E
LE
CT
RIC
CO
MP
AN
Yd/
b/a
NA
TIO
NA
L G
RID
RIP
UC
Doc
ket N
o. 4
770
Wor
kpap
er 5
.1 -
Ele
ctri
c T
rasn
port
Cos
ts/A
ssum
ptio
ns2
of 1
2C
ost
Est
imat
esO
ff-P
eak
Ch
argi
ng
Reb
ate
Pil
otY
ear
1Y
ear
2Y
ear
3T
otal
1N
G P
rogr
am M
anag
er F
TE
- P
rogr
am M
anag
er L
abor
96,2
45$
98
,170
$
50,0
67$
24
4,48
1$
2O
ff-P
eak
Reb
ate
Pil
ot -
Dat
a A
cqui
siti
on C
ost
20,0
00$
50
,000
$
100,
000
$
17
0,00
0$
3O
ff-P
eak
Reb
ate
Pil
ot -
Pil
ot S
uppo
rt40
,000
$
40,0
00$
40
,000
$
120,
000
$
4
Eva
luat
ion
30,0
00$
30
,000
$
5
Pro
gram
Mar
keti
ng15
,000
$
37,5
00$
75
,000
$
127,
500
$
6P
rogr
am A
dm
inis
trat
ion
Cos
t17
1,24
5$
225,
670
$
29
5,06
7$
691,
981
$
7 8
Reb
ate
Cos
t7,
500
$
18
,750
$
37,5
00$
63
,750
$
9 10
Tot
al E
xpen
se C
ost
178,
745
$
24
4,42
0$
332,
567
$
75
5,73
1$
11 12F
TE
Cal
cula
tion
13F
TE
per
yea
r0.
50.
50.
2514
2016
Lab
or R
ate
(Sr.
Pro
g M
gr)
107,
100
15
Esc
alat
ion
Rat
e2%
1620
18 L
abor
Rat
e 11
1,42
7
17L
abor
Bur
den
72.7
5%18
Ful
ly B
urde
ned
Lab
or R
ate
192,
490
19
6,34
0
200,
266
19 20
Off
-Pea
k R
ebat
e P
ilot
21
Dat
a A
cqui
siti
on C
ost
22C
ost p
er P
arti
cipa
nt p
er Y
ear
200
$
200
$
200
$
23P
arti
cipa
nts
per
year
100
250
500
24C
ost p
er Y
ear
20,0
00$
50
,000
$
100,
000
$
25 26
Mar
keti
ng C
ost p
er P
arti
cipa
nt15
0$
27 28
Reb
ate
Cos
t29
Cos
t per
Par
tici
pant
per
Yea
r75
$
30C
ost p
er Y
ear
7,50
0$
18,7
50$
37
,500
$
31 32P
ilot
Sup
port
120,
000
$
33
Cus
tom
er s
uppo
rt, c
all c
ente
r, s
urve
ys, d
ata
anal
ysis
, mar
keti
ng34 35
Eva
luat
ion
Cos
t36
Off
-Pea
k P
ilot
30,0
00
THE NARRAGANSETT ELECTRIC COMPANY d/b/a NATIONAL GRID RIPUC Docket No. 4770 Workpaper 5.1 - Electric Transport Costs/Assumptions Page 2 of 12
47

TH
E N
AR
RA
GA
NS
ET
T E
LE
CT
RIC
CO
MP
AN
Yd/
b/a
NA
TIO
NA
L G
RID
RIP
UC
Doc
ket N
o. 4
770
Wor
kpap
er 5
.1 -
Ele
ctri
c T
rasn
port
Cos
ts/A
ssum
ptio
ns
3 of
12
Cos
t E
stim
ates
Ch
argi
ng
Sta
tion
Dem
onst
rati
on P
rogr
amP
age
1
1P
rogr
am I
np
uts
2T
arge
ted
Ch
argi
ng
Seg
men
ts -
Est
imat
esT
ype
Sit
esP
orts
per
Sit
eP
orts
per
Seg
men
t%
Mak
e-R
eady
Mak
e-R
eady
Por
ts%
Uti
lity
-Ope
rate
dU
tili
ty-
Ope
rate
d P
orts
Mak
e-R
eady
E
VS
E R
ebat
e L
evel
3W
orkp
lace
sL
220
1020
050
%10
050
%10
050
%4
Apa
rtm
ent b
uild
ings
L2
46
2450
%12
50%
1275
%5
Dis
adva
ntag
ed c
omm
unit
y si
tes
L2
46
2450
%12
50%
1210
0%6
Pub
lic
tran
sit s
tati
ons
L2
210
2050
%10
50%
1050
%7
Pub
lic
DC
FC
DC
FC
45
2010
0%20
8G
over
nmen
t lig
ht-d
uty
flee
tL
23
824
100%
2450
%9
Cor
pora
te li
ght-
duty
fle
etL
23
824
100%
2450
%10
Pub
lic
tran
sit b
uses
Oth
er2
510
100%
1050
%11
Rid
esha
re c
ompa
ny c
harg
ing
hub
DC
FC
15
510
0%5
25%
12O
ther
hea
vy-d
uty/
DC
FC
(po
rt, a
irpo
rt)
Oth
er2
48
100%
850
%13
Mun
icip
al s
choo
l bus
esO
ther
31
310
0%3
75%
14T
otal
4868
362
208
154
15 16E
stim
ated
ED
C E
qu
ipm
ent
Cos
t p
er s
ite
17 18
Dis
trib
utio
n D
esig
n C
ases
Und
ergr
ound
Fee
d W
ith
New
Tra
nsfo
rmer
to
Met
er
Und
ergr
ound
Fee
d w
ith
Exi
stin
g T
rans
form
er
Ove
rhea
d D
rop
Wit
h N
ew
Tra
nsfo
rmer
to
Met
er
Ove
rhea
d S
econ
dary
D
rop
to M
eter
19D
irec
t Cos
ts p
er s
ite
21,8
04$
9,28
2$
11
,956
$
8,
822
$
20In
dire
ct C
osts
per
sit
e16
,185
$
7,
112
$
7,85
8$
6,
740
$
21T
otal
Est
imat
ed E
DC
Equ
ipm
ent C
ost p
er s
ite
37,9
89$
16,3
94$
19,8
14$
15,5
62$
22 23E
stim
ated
Pro
port
ion
of S
ites
in E
ach
Dis
trib
utio
n D
esig
n C
ase
15%
75%
5%5%
24W
eigh
ted
Ave
rage
Cos
t, ba
sed
on E
stim
ated
Pro
port
ion
of S
ites
19,7
63$
25C
onti
ngen
cy30
%26
Esc
alat
ion
2%27 28
Ave
rage
Est
imat
ed E
DC
Equ
ipm
ent C
ost p
er S
ite,
incl
. Con
ting
ency
2016
$20
17 $
2018
$20
19 $
2020
$20
18-2
020
Avg
2925
,691
$
26
,205
$
26
,729
$
27
,264
$
27
,809
$
27
,268
$
30 31
Est
imat
ed P
rem
ise
Wor
k C
ost
per
sit
e32
Est
imat
e 1
Est
imat
e 2
Est
imat
e 3
Ave
rage
33L
evel
2 S
ites
32,1
50$
49,1
38$
$
40
,644
34
DC
Fas
t Cha
rgin
g S
ites
60,1
00$
64,2
15$
75,3
00$
$
66
,538
35 36
Con
ting
ency
30%
37E
scal
atio
n2%
38 39A
vera
ge E
stim
ated
Pre
mis
e W
ork
Cos
t, in
cl. C
onti
ngen
cy20
16 $
2017
$20
18 $
2019
$20
20 $
2018
-202
0 A
vg40
Lev
el 2
Sit
e52
,837
$
53
,894
$
54
,972
$
56
,071
$
57
,193
$
56
,079
$
41
DC
Fas
t Cha
rgin
g S
ites
86,5
00$
88,2
30$
89,9
94$
91,7
94$
93,6
30$
91,8
06$
42 43E
stim
ated
EV
SE
Cos
t p
er P
ort
44L
evel
2 (
base
d on
2-p
ort,
netw
orke
d)2,
875
$
45D
CF
C35
,000
$
46
Oth
er H
eavy
Dut
y35
,000
$
A
ssum
es B
uses
/Oth
er (
e.g.
Por
t) D
CF
C E
VS
E is
equ
ival
entl
y pr
iced
to c
onsu
mer
veh
icle
DC
FC
Lin
e N
otes
Lin
es 1
8-23
= I
nter
nal D
istr
ibut
ion
Des
ign
Cos
t Est
imat
es, 8
-30-
16L
ine
19 =
Dir
ect C
osts
incl
ude
Cra
ft L
abor
, Mat
eria
ls, E
ngin
eeri
ng C
osts
, Con
trac
tors
/Con
sult
ants
, Pro
ject
Man
agem
ent C
ost,
and
Cra
ft S
uper
visi
onL
ine
20 =
Ind
irec
t Cos
ts in
clud
e S
tore
s H
andl
ing,
Lab
or A
dder
s, T
rans
port
atio
n, C
AD
, and
AF
UD
CL
ines
33-
34 =
Ext
erna
l est
imat
es o
btai
ned
by N
atio
nal G
rid;
cos
ts in
clud
e P
lans
&
Per
mit
s, L
abor
(el
ectr
icia
n), M
ater
ials
(pa
nel,
brea
kers
, con
duit
, fit
ting
s,
Lin
es 4
4-46
= N
atio
nal G
rid
inte
rnal
exp
erie
nce
THE NARRAGANSETT ELECTRIC COMPANY d/b/a NATIONAL GRID RIPUC Docket No. 4770 Workpaper 5.1 - Electric Transport Costs/Assumptions Page 3 of 12
48

TH
E N
AR
RA
GA
NS
ET
T E
LE
CT
RIC
CO
MP
AN
Yd/
b/a
NA
TIO
NA
L G
RID
RIP
UC
Doc
ket N
o. 4
770
Wor
kpap
er 5
.1 -
Ele
ctri
c T
rasn
port
Cos
ts/A
ssum
ptio
ns
4 of
12
Ch
argi
ng
Sta
tion
Dem
onst
rati
on P
rogr
amP
age
2
1D
irec
t S
ite
Cos
ts
2M
ake-
Rea
dy
Op
tion
Cos
t E
stim
ates
Mak
e-R
eady
Sit
esM
ake-
Rea
dy P
orts
Mak
e-R
eady
EV
SE
R
ebat
e L
evel
ED
C C
osts
(N
ew
Ser
vice
)P
rem
ise
Wor
k C
osts
EV
SE
Reb
ate
Cos
tT
otal
per
Seg
men
tC
ost p
er P
ort
Cos
t per
Sit
e3
Wor
kpla
ces
1010
050
%27
2,67
5$
56
0,78
6$
14
3,75
0$
97
7,21
1$
9,
772
$
97,7
21$
4A
part
men
t bui
ldin
gs2
1275
%54
,535
$
11
2,15
7$
25
,875
$
192,
567
$
16,0
47$
96
,284
$
5
Dis
adva
ntag
ed c
omm
unit
y si
tes
212
100%
54,5
35$
112,
157
$
34,5
00$
20
1,19
2$
16
,766
$
100,
596
$
6P
ubli
c tr
ansi
t sta
tion
s1
1050
%27
,268
$
56
,079
$
14,3
75$
97
,721
$
9,77
2$
97
,721
$
7
Pub
lic
DC
FC
8G
over
nmen
t lig
ht-d
uty
flee
t3
2450
%81
,803
$
16
8,23
6$
34
,500
$
284,
538
$
11,8
56$
94
,846
$
9
Cor
pora
te li
ght-
duty
fle
et3
2450
%81
,803
$
16
8,23
6$
34
,500
$
284,
538
$
11,8
56$
94
,846
$
10
Pub
lic
tran
sit b
uses
210
50%
54,5
35$
183,
613
$
175,
000
$
413,
148
$
41,3
15$
20
6,57
4$
11
Rid
esha
re c
ompa
ny c
harg
ing
hub
15
25%
27,2
68$
91,8
06$
43
,750
$
162,
824
$
32,5
65$
16
2,82
4$
12
Oth
er h
eavy
-dut
y/D
CF
C (
port
, air
port
)2
850
%54
,535
$
18
3,61
3$
14
0,00
0$
37
8,14
8$
47
,268
$
189,
074
$
13M
unic
ipal
sch
ool b
uses
33
75%
81,8
03$
275,
419
$
78,7
50$
43
5,97
2$
14
5,32
4$
145,
324
$
14T
otal
790,
758
$
1,91
2,10
1$
725,
000
$
3,42
7,85
9$
15 16U
tili
ty-O
per
ated
Op
tion
Cos
t E
stim
ates
Uti
lity
-Ope
rate
d S
ites
Uti
lity
-Ope
rate
d P
orts
Uti
lity
-Ope
rate
d E
VS
E C
osts
ED
C C
osts
(N
ew
Ser
vice
)P
rem
ise
Wor
k C
osts
EV
SE
Cos
ts
(Uti
lity
-Ow
ned)
Tot
al p
er S
egm
ent
Cos
t per
Por
tC
ost p
er S
ite
17W
orkp
lace
s10
100
100%
272,
675
$
560,
786
$
287,
500
$
1,12
0,96
1$
11,2
10$
11
2,09
6$
18
Apa
rtm
ent b
uild
ings
212
100%
54,5
35$
112,
157
$
34,5
00$
20
1,19
2$
16
,766
$
100,
596
$
19D
isad
vant
aged
com
mun
ity
site
s2
1210
0%54
,535
$
11
2,15
7$
34
,500
$
201,
192
$
16,7
66$
10
0,59
6$
20
Pub
lic
tran
sit s
tati
ons
110
100%
27,2
68$
56,0
79$
28
,750
$
112,
096
$
11,2
10$
11
2,09
6$
21
Pub
lic
DC
FC
420
100%
109,
070
$
367,
225
$
700,
000
$
1,17
6,29
5$
58,8
15$
29
4,07
4$
22
Tot
al19
154
518,
083
$
1,20
8,40
4$
1,08
5,25
0$
2,81
1,73
7$
147,
986
$
23 24S
ub
tota
l - B
oth
Cas
e s1,
308,
841
$
3,
120,
505
$
1,
810,
250
$
6,
239,
596
$
25 26
% S
ites
Eac
h Y
ear
10%
25%
65%
27#
Sit
es E
ach
Yea
r5
12
31
28 29
Pro
gram
Man
agem
ent
Off
ice
(PM
O)
Cos
t In
pu
ts30
Yea
r 1
Yea
r 2
Yea
r 3
31C
harg
ing
Dem
onst
rati
on P
rogr
am M
anag
er1
11
32S
r. P
roje
ct M
anag
ers
22
233
Acc
ount
Man
ager
0.5
11
34 35E
scal
atio
n2%
36P
rogr
am M
anag
er L
abor
Rat
e -
Ful
ly L
oade
d24
7,56
8$
252,
519
$
257,
570
$
37S
r. P
roje
ct M
anag
er L
abor
Rat
e -
Ful
ly L
oade
d18
8,71
6$
192,
490
$
196,
340
$
38A
ccou
nt M
anag
er L
abor
Rat
e -
Ful
ly L
oade
d19
7,87
8$
201,
836
$
205,
872
$
39 40C
harg
ing
Dem
onst
rati
on P
rogr
am M
anag
er24
7,56
8$
252,
519
$
257,
570
$
41S
r. P
roje
ct M
anag
ers
377,
432
$
38
4,98
1$
39
2,68
0$
42
Tot
al L
abor
625,
000
$
63
7,50
0$
65
0,25
0$
43 44
Sit
e A
gree
men
t Con
trac
ting
Cos
ts p
er s
ite
2,00
0$
45
Cus
tom
er S
ite
Cos
t Est
imat
ion
per
site
2,50
0$
46
Pro
ject
Man
agem
ent C
RM
Too
l Mod
ific
atio
ns50
,000
$
47
Sta
tion
Dat
a R
epor
ting
Int
erfa
ce50
,000
$
Lin
e N
otes
Lin
es 3
6-38
: B
ased
on
2016
Mar
ket R
efer
ence
Poi
nts
(MR
Ps)
for
req
uire
d jo
b ty
pes,
esc
alat
ed b
y on
e ye
ar 2
% a
nd w
ith
72.7
5% la
bor
burd
en a
ppli
ed f
or S
ervi
ce C
o. e
mpl
oyee
sL
ine
44: I
nter
nal l
egal
est
imat
e fo
r co
ntra
ct d
evel
opm
ent a
nd n
egot
iati
onL
ine
45: B
ased
on
expe
rien
ce w
ith
exte
rnal
est
imat
ion/
desi
gn o
f pr
ior
Com
pany
sit
esL
ine
46: M
odif
icat
ions
to C
RM
sys
tem
(e.
g. S
ales
forc
e) f
or C
harg
ing
Pro
gram
pro
ject
man
agem
ent a
nd r
ebat
e pr
oces
sing
Lin
e 47
: Sof
twar
e de
velo
pmen
t cos
t for
rep
orti
ng d
ata
from
mul
tipl
e st
atio
n ve
ndor
AP
Is
THE NARRAGANSETT ELECTRIC COMPANY d/b/a NATIONAL GRID RIPUC Docket No. 4770 Workpaper 5.1 - Electric Transport Costs/Assumptions Page 4 of 12
49

TH
E N
AR
RA
GA
NS
ET
T E
LE
CT
RIC
CO
MP
AN
Yd/
b/a
NA
TIO
NA
L G
RID
RIP
UC
Doc
ket N
o. 4
770
Wor
kpap
er 5
.1 -
Ele
ctri
c T
rasn
port
Cos
ts/A
ssum
ptio
ns
5 of
12
Ch
argi
ng
Sta
tion
Dem
onst
rati
on P
rogr
am
Pag
e 3
1S
um
mar
y of
Ch
argi
ng
Dem
onst
rati
on P
rogr
am C
apit
al C
osts
2 3C
apit
al O
verh
ead
Bur
den
13%
4 5D
irec
t C
apE
x C
ost
(est
.)D
epre
ciab
le L
ife
(est
.)6
ED
C C
osts
(M
ake-
Rea
dy &
Uti
lity
-Ope
rate
d)1,
478,
991
$
407
Pre
mis
e W
ork
Cos
ts (
Mak
e-R
eady
& U
tili
ty-O
pera
ted)
3,52
6,17
1$
20
8E
VS
E C
osts
(U
tili
ty-O
pera
ted
Onl
y)1,
226,
333
$
109
Tot
al6,
231,
494
$
10 11D
irec
t C
apE
x C
osts
per
Yea
r10
%25
%65
%12
ED
C C
osts
(M
ake-
Rea
dy &
Uti
lity
-Ope
rate
d)14
7,89
9$
369,
748
$
961,
344
$
13P
rem
ise
Wor
k C
osts
(M
ake-
Rea
dy &
Uti
lity
-Ope
rate
d)35
2,61
7$
881,
543
$
2,29
2,01
1$
14E
VS
E C
osts
(U
tili
ty-O
pera
ted
Onl
y)12
2,63
3$
306,
583
$
797,
116
$
15T
otal
623,
149
$
1,
557,
873
$
4,
050,
471
$
16 17
Cap
ital
ized
PM
O L
abor
18P
rogr
am M
anag
er -
% C
apit
aliz
ed50
%50
%50
%19
Sr.
Pro
ject
Man
ager
- %
Cap
ital
ized
75%
75%
75%
20 21P
rogr
am M
anag
er -
$ C
apit
aliz
ed12
3,78
4$
126,
260
$
128,
785
$
22S
r. P
roje
ct M
anag
er -
$ C
apit
aliz
ed14
1,53
7$
144,
368
$
147,
255
$
23C
apit
aliz
ed L
abor
265,
321
$
27
0,62
7$
27
6,04
0$
24 25
Pro
ject
Man
agem
ent /
CR
M T
ool M
odif
icat
ions
50,0
00$
26D
ata
Ana
lysi
s &
Rep
orti
ng T
ools
50,0
00$
27T
otal
Pro
ject
Man
agem
ent C
osts
365,
321
$
27
0,62
7$
27
6,04
0$
28 29
Yea
r 1
Yea
r 2
Yea
r 3
Yea
rs 1
-330
Tot
al D
irec
t Cap
ital
Cos
ts62
3,14
9$
1,55
7,87
3$
4,05
0,47
1$
6,23
1,49
4$
31
Tot
al C
apit
aliz
ed L
abor
& T
ool C
osts
365,
321
$
27
0,62
7$
27
6,04
0$
91
1,98
8$
32T
OT
AL
CA
PIT
AL
CO
ST
S98
8,47
0$
1,82
8,50
1$
4,32
6,51
1$
7,14
3,48
2$
THE NARRAGANSETT ELECTRIC COMPANY d/b/a NATIONAL GRID RIPUC Docket No. 4770 Workpaper 5.1 - Electric Transport Costs/Assumptions Page 5 of 12
50
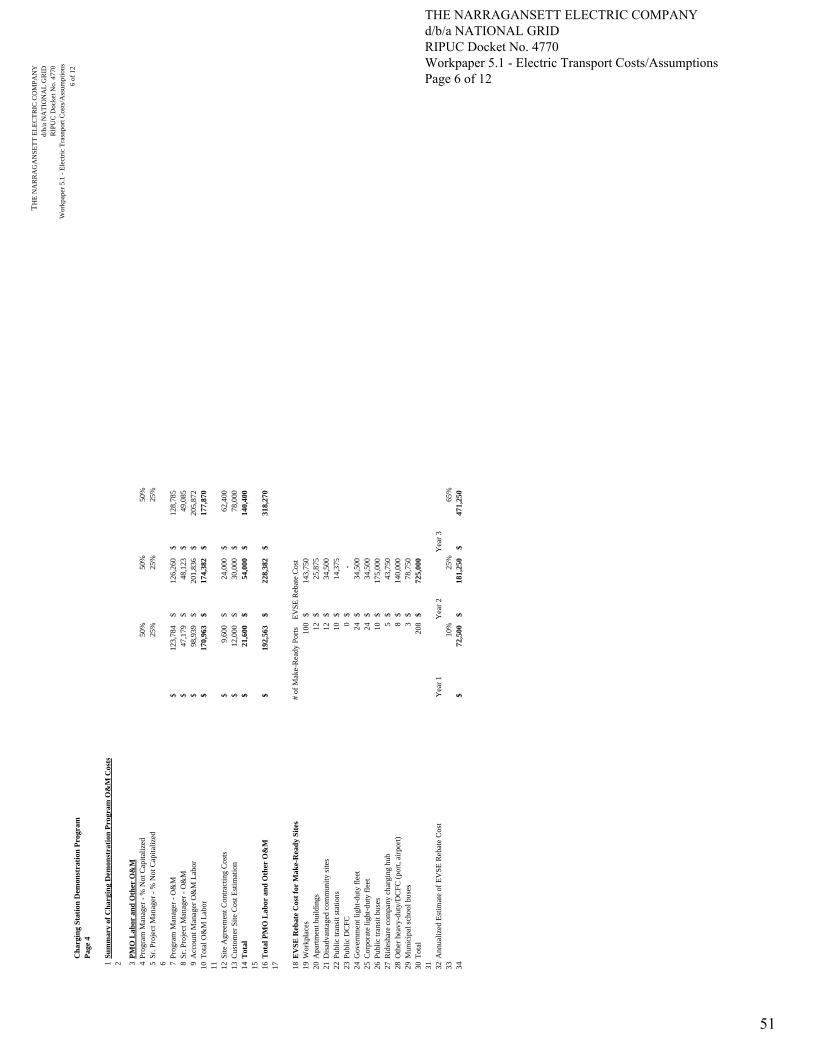
TH
E N
AR
RA
GA
NS
ET
T E
LE
CT
RIC
CO
MP
AN
Yd/
b/a
NA
TIO
NA
L G
RID
RIP
UC
Doc
ket N
o. 4
770
Wor
kpap
er 5
.1 -
Ele
ctri
c T
rasn
port
Cos
ts/A
ssum
ptio
ns
6 of
12
Ch
argi
ng
Sta
tion
Dem
onst
rati
on P
rogr
amP
age
4
1S
um
mar
y of
Ch
argi
ng
Dem
onst
rati
on P
rogr
am O
&M
Cos
ts2 3
PM
O L
abor
an
d O
ther
O&
M4
Pro
gram
Man
ager
- %
Not
Cap
ital
ized
50%
50%
50%
5S
r. P
roje
ct M
anag
er -
% N
ot C
apit
aliz
ed25
%25
%25
%6 7
Pro
gram
Man
ager
- O
&M
123,
784
$
12
6,26
0$
12
8,78
5$
8
Sr.
Pro
ject
Man
ager
- O
&M
47,1
79$
48,1
23$
49,0
85$
9A
ccou
nt M
anag
er O
&M
Lab
or98
,939
$
20
1,83
6$
20
5,87
2$
10
Tot
al O
&M
Lab
or17
0,96
3$
174,
382
$
177,
870
$
11 12S
ite
Agr
eem
ent C
ontr
acti
ng C
osts
9,60
0$
24
,000
$
62
,400
$
13
Cus
tom
er S
ite
Cos
t Est
imat
ion
12,0
00$
30,0
00$
78,0
00$
14T
otal
21,6
00$
54,0
00$
140,
400
$
15 16T
otal
PM
O L
abor
an
d O
ther
O&
M19
2,56
3$
228,
382
$
318,
270
$
17 18E
VS
E R
ebat
e C
ost
for
Mak
e-R
ead
y S
ites
# of
Mak
e-R
eady
Por
tsE
VS
E R
ebat
e C
ost
19W
orkp
lace
s10
014
3,75
0$
20
Apa
rtm
ent b
uild
ings
1225
,875
$
21
Dis
adva
ntag
ed c
omm
unit
y si
tes
1234
,500
$
22
Pub
lic
tran
sit s
tati
ons
1014
,375
$
23
Pub
lic
DC
FC
0-
$
24
Gov
ernm
ent l
ight
-dut
y fl
eet
2434
,500
$
25
Cor
pora
te li
ght-
duty
fle
et24
34,5
00$
26P
ubli
c tr
ansi
t bus
es10
175,
000
$
27R
ides
hare
com
pany
cha
rgin
g hu
b5
43,7
50$
28O
ther
hea
vy-d
uty/
DC
FC
(po
rt, a
irpo
rt)
814
0,00
0$
29
Mun
icip
al s
choo
l bus
es3
78,7
50$
30T
otal
208
725,
000
$
31 32A
nnua
lize
d E
stim
ate
of E
VS
E R
ebat
e C
ost
Yea
r 1
Yea
r 2
Yea
r 3
3310
%25
%65
%34
72,5
00$
181,
250
$
471,
250
$
THE NARRAGANSETT ELECTRIC COMPANY d/b/a NATIONAL GRID RIPUC Docket No. 4770 Workpaper 5.1 - Electric Transport Costs/Assumptions Page 6 of 12
51

TH
E N
AR
RA
GA
NS
ET
T E
LE
CT
RIC
CO
MP
AN
Yd/
b/a
NA
TIO
NA
L G
RID
RIP
UC
Doc
ket N
o. 4
770
Wor
kpap
er 5
.1 -
Ele
ctri
c T
rasn
port
Cos
ts/A
ssum
ptio
ns
7 of
12
Ch
argi
ng
Sta
tion
Dem
onst
rati
on P
rogr
amP
age
5
1S
tati
on O
&M
for
Uti
lity
-Op
erat
ed S
ites
2R
epai
rs a
nd M
aint
enan
ce p
er p
ort
$500
3N
etw
ork
Ser
vice
Fee
s pe
r po
rt$2
004 5
Yea
r 1
Yea
r 2
Yea
r 3
6C
umul
ativ
e P
orts
In
Ope
rati
on P
er Y
ear
15
54
15
4
7R
epai
rs a
nd M
aint
enan
ce p
er p
ort
7,70
0$
26
,950
$
77
,000
$
8
Net
wor
k S
ervi
ce F
ees
per
port
3,08
0$
10
,780
$
30
,800
$
9T
otal
O&
M C
osts
10,7
80$
37,7
30$
107,
800
$
10 11C
har
gin
g D
emon
stra
tion
Mar
ket
ing
12W
ebsi
te$2
5,00
0$5
,000
$5,0
00$3
5,00
0P
rogr
am P
age
13S
ocia
l Med
ia$1
8,00
0$1
8,00
0$3
6,00
0$7
2,00
0L
inke
din
14D
igit
al$2
0,00
0$2
0,00
0$2
0,00
0$6
0,00
0O
nlin
e B
anne
rs15
Con
tent
Dev
elop
men
t$1
0,00
0$1
0,00
0$1
0,00
0$3
0,00
0A
genc
y C
ontr
act
16In
tern
al M
arke
ting
Pro
gram
Man
agem
ent
$40,
000
$40,
000
$40,
000
$120
,000
Sta
ff T
ime
17C
har
gin
g D
emon
stra
tion
Mar
ket
ing
Tot
al$1
13,0
00$9
3,00
0$1
11,0
00$3
17,0
0018 19
O&
M S
UM
MA
RY
20Y
ear
1Y
ear
2Y
ear
321
PM
O L
abor
and
Oth
er O
&M
192,
563
$
22
8,38
2$
31
8,27
0$
73
9,21
5$
22E
VS
E R
ebat
e C
ost f
or M
ake-
Rea
dy S
ites
72,5
00$
181,
250
$
471,
250
$
725,
000
$
23
Sta
tion
O&
M f
or U
tili
ty-O
pera
ted
Sit
es10
,780
$
37
,730
$
10
7,80
0$
15
6,31
0$
24C
harg
ing
Dem
onst
rati
on M
arke
ting
$113
,000
$93,
000
$111
,000
317,
000
$
25T
OT
AL
O&
M C
OS
TS
388,
843
$
54
0,36
2$
1,
008,
320
$
1,
937,
525
$
THE NARRAGANSETT ELECTRIC COMPANY d/b/a NATIONAL GRID RIPUC Docket No. 4770 Workpaper 5.1 - Electric Transport Costs/Assumptions Page 7 of 12
52

TH
E N
AR
RA
GA
NS
ET
T E
LE
CT
RIC
CO
MP
AN
Yd/
b/a
NA
TIO
NA
L G
RID
RIP
UC
Doc
ket N
o. 4
770
Wor
kpap
er 5
.1 -
Ele
ctri
c T
rasn
port
Cos
ts/A
ssum
ptio
ns
8 of
12
Ch
argi
ng
Sta
tion
Dem
onst
rati
on P
rogr
amP
age
6
1P
arti
cip
atio
n P
aym
ent
Est
imat
e fo
r U
tili
ty-O
per
ated
Sit
es2 3
For
Uti
lity
-Ope
rate
d S
ites
415
%
515
% o
f D
irec
t Cos
ts
(w/C
apit
al O
verh
ead)
Cos
t Equ
ival
ence
M
etho
dP
arti
cip
atio
n
Pay
men
t#
of S
ites
Pay
men
t to
be C
olle
cted
6W
orkp
lace
s19
,000
$
17
,875
$
17
,500
$
10
175,
000
$
7A
part
men
t bui
ldin
gs17
,051
$
7,
813
$
7,50
02
15,0
00$
8D
isad
vant
aged
com
mun
ity
site
sN
o pa
rtic
ipat
ion
paym
ent
9P
ubli
c tr
ansi
t sta
tion
s19
,000
$
17
,875
$
10
,000
1
10
,000
$
10
Pub
lic
DC
FC
49,8
46$
73,5
00$
50,0
004
200,
000
$
1140
0,00
0$
12
An
nu
aliz
ed E
stim
ate
of P
arti
cip
atio
n P
aym
ent
Rev
enu
eY
ear
1Y
ear
2Y
ear
313
40,0
00$
100,
000
$
260,
000
$
14 15L
2 C
ost
Eq
uiv
alen
ce E
stim
ate
16 17A
nnua
l Dir
ect O
&M
per
Por
t$7
0018
Ass
umed
Ann
ual I
ndir
ect O
verh
ead
per
Sit
e72
019 20
# of
Por
tsE
VS
E C
ost (
Aft
er
Reb
ate)
5 Y
ears
of
Dir
ect
O&
MT
otal
21W
orkp
lace
s10
14,3
75$
$3,5
0017
,875
$
22
Apa
rtm
ent b
uild
ings
64,
313
$
$3,5
007,
813
$
23P
ubli
c tr
ansi
t sta
tion
s10
14,3
75$
$3,5
0017
,875
$
24
Pub
lic
DC
FC
570
,000
$
$3
,500
73,5
00$
THE NARRAGANSETT ELECTRIC COMPANY d/b/a NATIONAL GRID RIPUC Docket No. 4770 Workpaper 5.1 - Electric Transport Costs/Assumptions Page 8 of 12
53

TH
E N
AR
RA
GA
NS
ET
T E
LE
CT
RIC
CO
MP
AN
Yd/
b/a
NA
TIO
NA
L G
RID
RIP
UC
Doc
ket N
o. 4
770
Wor
kpap
er 5
.1 -
Ele
ctri
c T
rasn
port
Cos
ts/A
ssum
ptio
ns
9 of
12
Cos
t E
stim
ates
Dis
cou
nt
Pil
ot f
or D
C F
ast
Ch
argi
ng
Acc
oun
ts
1Y
ear
1Y
ear
2Y
ear
3T
otal
2Im
plem
enta
tion
Cos
t50
,000
$
50,0
00$
50,0
00$
150,
000
$
3P
rogr
am A
dmin
istr
atio
n C
ost
50,0
00$
50
,000
$
50
,000
$
15
0,00
0$
4 5
Pot
enti
al A
nnua
l Val
ue o
f D
isco
unt
53,6
22$
12
0,65
0$
214,
488
$
388,
760
$
6D
isco
unt C
ost
53,6
22$
12
0,65
0$
214,
488
$
388,
760
$
7 8T
otal
O&
M C
ost
103,
622
$
17
0,65
0$
264,
488
$
538,
760
$
9 10 11Im
plem
enta
tion
cos
t est
imat
e in
clud
es m
arke
ting
, cus
tom
er s
uppo
rt, b
illi
ng s
yste
m m
odif
icat
ions
, met
erin
g, a
nd d
ata
repo
rtin
g12 13
Pot
enti
al A
nnua
l Val
ue o
f D
isco
unt
14 15M
onth
ly V
alue
of
Dis
coun
t per
KW
$4.9
716
Ann
ual V
alue
of
Dis
coun
t per
KW
$59.
5817 18
Sta
tion
sB
ille
d K
W p
er S
tati
onK
W f
or G
roup
Tot
al D
isco
unt
19S
tati
ons
in Y
ear
120
4590
0$5
3,62
220
Sta
tion
s in
Yea
r 2
3067
.520
25$1
20,6
5021
Sta
tion
s in
Yea
r 3
4090
3600
$214
,488
THE NARRAGANSETT ELECTRIC COMPANY d/b/a NATIONAL GRID RIPUC Docket No. 4770 Workpaper 5.1 - Electric Transport Costs/Assumptions Page 9 of 12
54
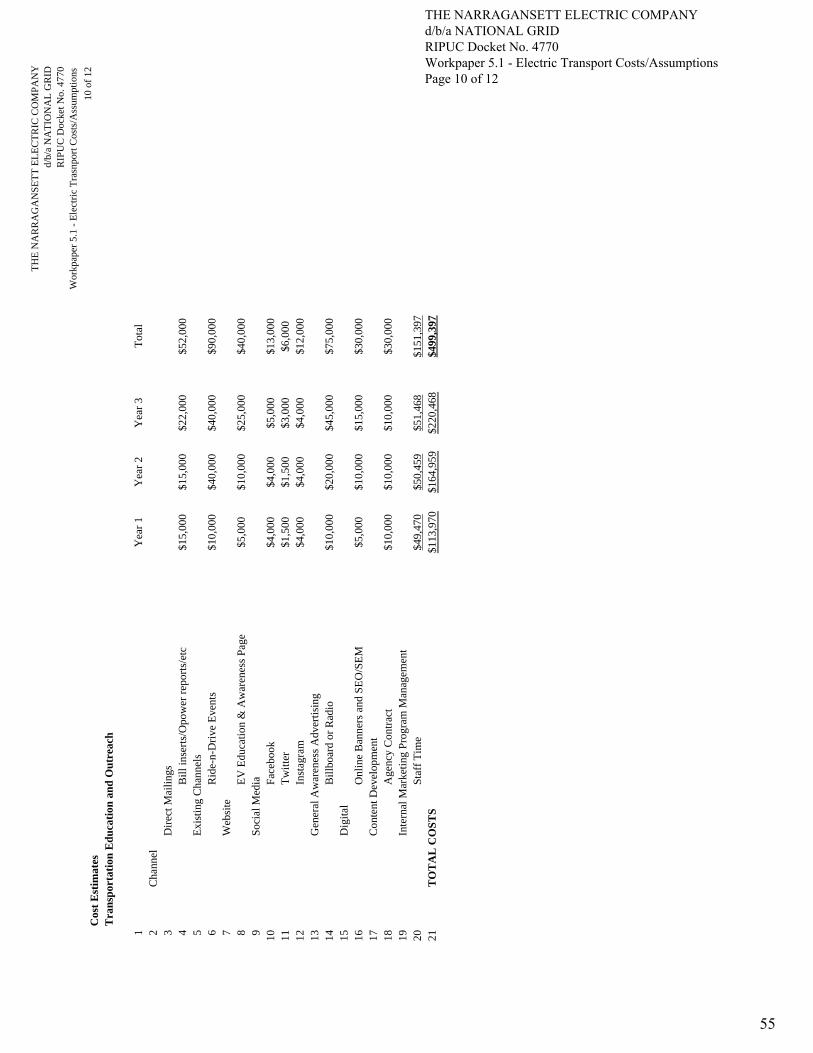
TH
E N
AR
RA
GA
NS
ET
T E
LE
CT
RIC
CO
MP
AN
Yd/
b/a
NA
TIO
NA
L G
RID
RIP
UC
Doc
ket N
o. 4
770
Wor
kpap
er 5
.1 -
Ele
ctri
c T
rasn
port
Cos
ts/A
ssum
ptio
ns
10 o
f 12
Cos
t E
stim
ates
Tra
nsp
orta
tion
Ed
uca
tion
an
d O
utr
each
1Y
ear
1Y
ear
2Y
ear
3T
otal
2C
hann
el3
Dir
ect M
aili
ngs
4B
ill i
nser
ts/O
pow
er r
epor
ts/e
tc$1
5,00
0$1
5,00
0$2
2,00
0$5
2,00
05
Exi
stin
g C
hann
els
6R
ide-
n-D
rive
Eve
nts
$10,
000
$40,
000
$40,
000
$90,
000
7W
ebsi
te8
EV
Edu
cati
on &
Aw
aren
ess
Pag
e$5
,000
$10,
000
$25,
000
$40,
000
9S
ocia
l Med
ia10
Fac
eboo
k$4
,000
$4,0
00$5
,000
$13,
000
11T
wit
ter
$1,5
00$1
,500
$3,0
00$6
,000
12In
stag
ram
$4,0
00$4
,000
$4,0
00$1
2,00
013
Gen
eral
Aw
aren
ess
Adv
erti
sing
14B
illb
oard
or
Rad
io$1
0,00
0$2
0,00
0$4
5,00
0$7
5,00
015
Dig
ital
16O
nlin
e B
anne
rs a
nd S
EO
/SE
M$5
,000
$10,
000
$15,
000
$30,
000
17C
onte
nt D
evel
opm
ent
18A
genc
y C
ontr
act
$10,
000
$10,
000
$10,
000
$30,
000
19In
tern
al M
arke
ting
Pro
gram
Man
agem
ent
20S
taff
Tim
e$4
9,47
0$5
0,45
9$5
1,46
8$1
51,3
9721
TO
TA
L C
OS
TS
$113
,970
$164
,959
$220
,468
$499
,397
THE NARRAGANSETT ELECTRIC COMPANY d/b/a NATIONAL GRID RIPUC Docket No. 4770 Workpaper 5.1 - Electric Transport Costs/Assumptions Page 10 of 12
55

TH
E N
AR
RA
GA
NS
ET
T E
LE
CT
RIC
CO
MP
AN
Yd/
b/a
NA
TIO
NA
L G
RID
RIP
UC
Doc
ket N
o. 4
770
Wor
kpap
er 5
.1 -
Ele
ctri
c T
rasn
port
Cos
ts/A
ssum
ptio
ns
11 o
f 12
Cos
t E
stim
ates
Com
pan
y F
leet
Exp
ansi
on
1Y
ear
1Y
ear
2Y
ear
3T
otal
2E
xpen
se (
Veh
icle
Lea
se a
nd O
&M
)64
,000
$
12
8,00
0$
192,
000
$
38
4,00
0$
3C
apit
al (
EV
SE
)20
0,00
0$
200,
000
$
4 5
Cos
t Bre
akdo
wn
6 7In
crem
enta
l Veh
icle
Lea
se C
ost p
er V
e h80
000
8L
ease
Ter
m10
9A
nnua
l Inc
rem
enta
l Veh
icle
Lea
se C
ost
8,00
0$
10 11
Ann
ual S
uppo
rt/M
aint
enan
ce8,
000
$
13 14C
umul
ativ
e V
ehic
les
48
1215
Veh
icle
Cos
t32
,000
$
64
,000
$
96
,000
$
19
2,00
0$
16O
&M
Cos
t32
,000
$
64
,000
$
96
,000
$
19
2,00
0$
17T
otal
Exp
ense
64,0
00$
128,
000
$
192,
000
$
38
4,00
0$
23 24E
VS
E25
Cos
t Per
Por
t (L
2)16
,667
$
26
Por
ts12
27E
VS
E c
ost
200,
000
$
20
0,00
0$
28 29T
otal
Cos
t26
4,00
0$
128,
000
$
19
2,00
0$
584,
000
$
30
Lin
e N
otes
Lin
e 7-
11:
NG
Fle
et D
epar
tmen
t
THE NARRAGANSETT ELECTRIC COMPANY d/b/a NATIONAL GRID RIPUC Docket No. 4770 Workpaper 5.1 - Electric Transport Costs/Assumptions Page 11 of 12
56

TH
E N
AR
RA
GA
NS
ET
T E
LE
CT
RIC
CO
MP
AN
Yd/
b/a
NA
TIO
NA
L G
RID
RIP
UC
Doc
ket N
o. 4
770
Wor
kpap
er 5
.1 -
Ele
ctri
c T
rasn
port
Cos
ts/A
ssum
ptio
ns
12 o
f 12
Cos
t E
stim
ates
Init
iati
ve E
valu
atio
nY
ear
1Y
ear
2Y
ear
3T
otal
Ann
ual 3
rd-p
arty
eva
luat
ion
repo
rts
30,0
00$
30,0
00$
30
,000
$
90
,000
$
THE NARRAGANSETT ELECTRIC COMPANY d/b/a NATIONAL GRID RIPUC Docket No. 4770 Workpaper 5.1 - Electric Transport Costs/Assumptions Page 12 of 12
57

W
orkpaper 6.1

THE NARRAGANSETT ELECTRIC COMPANY d/b/a NATIONAL GRID RIPUC Docket No. 4770
Witness: Miller
Workpaper 6.1
Electric Heat Costs / Assumptions
58

TH
E N
AR
RA
GA
NS
ET
T E
LE
CT
RIC
CO
MP
AN
Yd/
b/a
NA
TIO
NA
L G
RID
RIP
UC
Doc
ket N
o. 4
770
Wor
kpap
er 6
.1 -
Ele
ctri
c H
eat C
osts
/Ass
umpt
ions
Pag
e 1
of 5
Ele
ctri
c H
eat
Init
iati
ve -
Cos
t S
um
mar
y
1T
otal
Cos
ts b
y P
rogr
am T
ype
2Y
ear
1Y
ear
2Y
ear
33-
Yea
r T
otal
3G
SH
P P
rogr
am-
$
595,
000
$
-$
59
5,00
0$
4E
quip
men
t Inc
enti
ves
252,
140
$
280,
890
$
309,
640
$
842,
670
$
5
Com
mun
ity-
Bas
ed O
utre
ach
95,5
00$
95,5
00$
95,5
00$
286,
500
$
6
Oil
Dea
ler
Tra
inin
g an
d S
uppo
rt61
,000
$
61
,000
$
61
,000
$
18
3,00
0$
9T
otal
408,
640
$
1,03
2,39
0$
466,
140
$
1,90
7,17
0$
10 11P
rogr
am C
osts
by
Typ
e of
Exp
ense
12Y
ear
1Y
ear
2Y
ear
33-
Yea
r T
otal
13O
&M
Sub
tota
l40
8,64
0$
53
2,39
0$
46
6,14
0$
1,
407,
170
$
14
Cap
ital
Sub
tota
l-
$
500,
000
$
-$
50
0,00
0$
15T
otal
408,
640
$
1,03
2,39
0$
466,
140
$
1,90
7,17
0$
16 17S
um
mar
y b
y In
itia
tive
18Y
ear
1Y
ear
2Y
ear
33-
Yea
r T
otal
19 G
SH
P P
rogr
am
20 C
apit
al
-$
50
0,00
0$
-
$
500,
000
$
21
Exp
ense
-
$
95,0
00$
-$
95
,000
$
22
Equ
ipm
ent I
ncen
tive
s 23
Cap
ital
-
$
-$
-
$
-$
24 E
xpen
se
252,
140
$
280,
890
$
309,
640
$
842,
670
$
25 C
omm
unit
y-B
ased
Out
reac
h 26
Cap
ital
-
$
-$
-
$
27 E
xpen
se
95,5
00$
95,5
00$
95,5
00$
286,
500
$
28
Oil
Dea
ler
Tra
inin
g an
d S
uppo
rt
29 C
apit
al
30 E
xpen
se
61,0
00$
61,0
00$
61,0
00$
183,
000
$
36
Tot
al
408,
640
$
1,03
2,39
0$
466,
140
$
1,90
7,17
0$
THE NARRAGANSETT ELECTRIC COMPANY d/b/a NATIONAL GRID RIPUC Docket No. 4770 Workpaper 6.1 - Electric Heat Costs/Assumptions Page 1 of 5
59

TH
E N
AR
RA
GA
NS
ET
T E
LE
CT
RIC
CO
MP
AN
Yd/
b/a
NA
TIO
NA
L G
RID
RIP
UC
Doc
ket N
o. 4
770
Wor
kpap
er 6
.1 -
Ele
ctri
c H
eat C
osts
/Ass
umpt
ions
Pag
e 2
of 5
Cos
t E
stim
ates
GS
HP
Pro
gram
Yea
r 1
Yea
r 2
Yea
r 3
Tot
al1
NG
Pro
gram
Man
ager
FT
E -
Pro
gram
Man
ager
Lab
or-
$
27,1
15$
-
$
27,1
15$
2G
SH
P S
yste
m D
esig
n-
$
50,0
00$
-
$
50,0
00$
6P
rogr
am M
arke
ting
-$
17
,885
$
-$
17
,885
$
7-
$
95,0
00$
-
$
95,0
00$
8 9F
TE
Cal
cula
tion
10F
TE
per
yea
r0
0.25
011
2018
Lab
or R
ate
(Pro
g M
gr)
95,0
00$
14
Lab
or B
urde
n14
.17%
15F
ully
Bur
dene
d L
abor
Rat
e10
8,46
2$
108,
462
$
10
8,46
2$
THE NARRAGANSETT ELECTRIC COMPANY d/b/a NATIONAL GRID RIPUC Docket No. 4770 Workpaper 6.1 - Electric Heat Costs/Assumptions Page 2 of 5
60
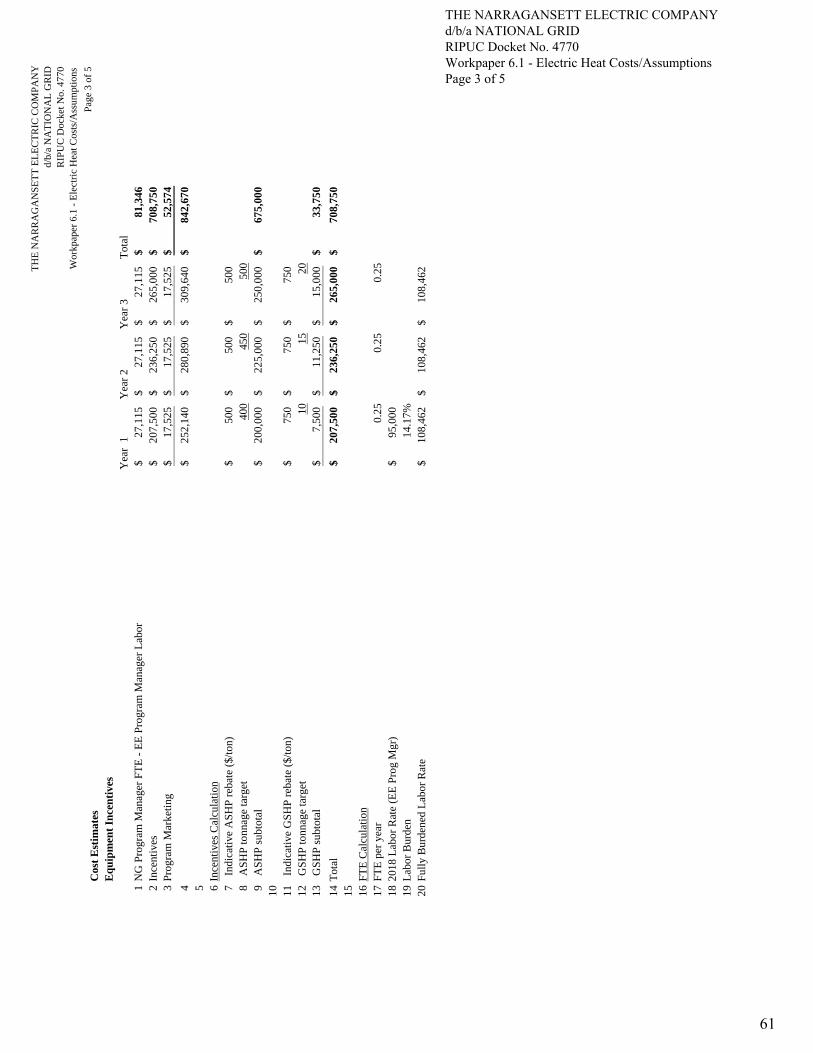
TH
E N
AR
RA
GA
NS
ET
T E
LE
CT
RIC
CO
MP
AN
Yd/
b/a
NA
TIO
NA
L G
RID
RIP
UC
Doc
ket N
o. 4
770
Wor
kpap
er 6
.1 -
Ele
ctri
c H
eat C
osts
/Ass
umpt
ions
Pag
e 3
of 5
Cos
t E
stim
ates
Eq
uip
men
t In
cen
tive
sY
ear
1Y
ear
2Y
ear
3T
otal
1N
G P
rogr
am M
anag
er F
TE
- E
E P
rogr
am M
anag
er L
abor
27,1
15$
27
,115
$
27,1
15$
81
,346
$
2
Ince
ntiv
es20
7,50
0$
236,
250
$
26
5,00
0$
708,
750
$
3
Pro
gram
Mar
keti
ng17
,525
$
17,5
25$
17
,525
$
52,5
74$
425
2,14
0$
280,
890
$
30
9,64
0$
842,
670
$
5 6
Ince
ntiv
es C
alcu
lati
on7
Ind
icat
ive
AS
HP
reb
ate
($/t
on)
500
$
500
$
500
$
8 A
SH
P to
nnag
e ta
rget
400
450
500
9 A
SH
P s
ubto
tal
200,
000
$
22
5,00
0$
250,
000
$
67
5,00
0$
10 11 I
ndic
ativ
e G
SH
P r
ebat
e ($
/ton
)75
0$
75
0$
75
0$
12
GS
HP
tonn
age
targ
et10
1520
13 G
SH
P s
ubto
tal
7,50
0$
11,2
50$
15
,000
$
33,7
50$
14T
otal
207,
500
$
23
6,25
0$
265,
000
$
70
8,75
0$
15 16F
TE
Cal
cula
tion
17F
TE
per
yea
r0.
250.
250.
2518
2018
Lab
or R
ate
(EE
Pro
g M
gr)
95,0
00$
19
Lab
or B
urde
n14
.17%
20F
ully
Bur
dene
d L
abor
Rat
e10
8,46
2$
108,
462
$
10
8,46
2$
THE NARRAGANSETT ELECTRIC COMPANY d/b/a NATIONAL GRID RIPUC Docket No. 4770 Workpaper 6.1 - Electric Heat Costs/Assumptions Page 3 of 5
61
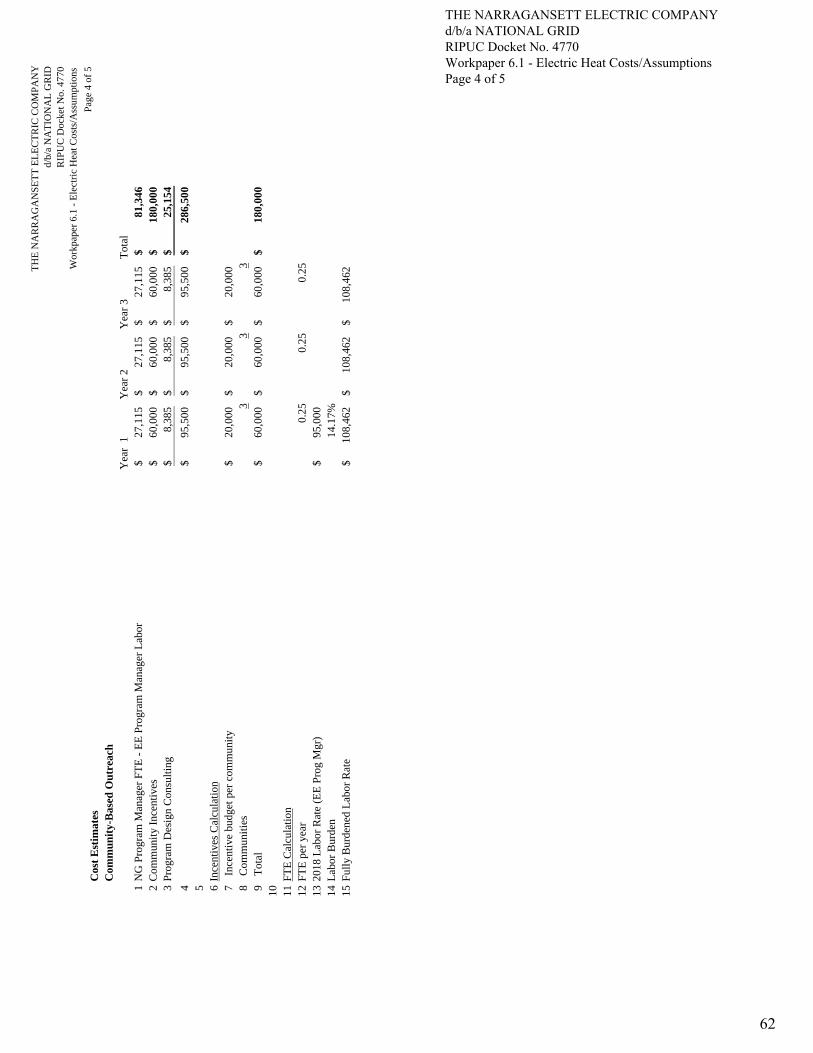
TH
E N
AR
RA
GA
NS
ET
T E
LE
CT
RIC
CO
MP
AN
Yd/
b/a
NA
TIO
NA
L G
RID
RIP
UC
Doc
ket N
o. 4
770
Wor
kpap
er 6
.1 -
Ele
ctri
c H
eat C
osts
/Ass
umpt
ions
Pag
e 4
of 5
Cos
t E
stim
ates
Com
mu
nit
y-B
ased
Ou
trea
chY
ear
1Y
ear
2Y
ear
3T
otal
1N
G P
rogr
am M
anag
er F
TE
- E
E P
rogr
am M
anag
er L
abor
27,1
15$
27
,115
$
27,1
15$
81
,346
$
2
Com
mun
ity
Ince
ntiv
es60
,000
$
60,0
00$
60
,000
$
180,
000
$
3
Pro
gram
Des
ign
Con
sult
ing
8,38
5$
8,38
5$
8,38
5$
25,1
54$
495
,500
$
95,5
00$
95
,500
$
286,
500
$
5 6
Ince
ntiv
es C
alcu
lati
on7
Inc
enti
ve b
udge
t per
com
mun
ity
20,0
00$
20
,000
$
20,0
00$
8
Com
mun
itie
s3
33
9 T
otal
60,0
00$
60
,000
$
60,0
00$
18
0,00
0$
10 11F
TE
Cal
cula
tion
12F
TE
per
yea
r0.
250.
250.
2513
2018
Lab
or R
ate
(EE
Pro
g M
gr)
95,0
00$
14
Lab
or B
urde
n14
.17%
15F
ully
Bur
dene
d L
abor
Rat
e10
8,46
2$
108,
462
$
10
8,46
2$
THE NARRAGANSETT ELECTRIC COMPANY d/b/a NATIONAL GRID RIPUC Docket No. 4770 Workpaper 6.1 - Electric Heat Costs/Assumptions Page 4 of 5
62

TH
E N
AR
RA
GA
NS
ET
T E
LE
CT
RIC
CO
MP
AN
Yd/
b/a
NA
TIO
NA
L G
RID
RIP
UC
Doc
ket N
o. 4
770
Wor
kpap
er 6
.1 -
Ele
ctri
c H
eat C
osts
/Ass
umpt
ions
Pag
e 5
of 5
Cos
t E
stim
ates
Oil
Dea
ler
Tra
inin
g an
d S
up
por
tY
ear
1Y
ear
2Y
ear
3T
otal
1N
G P
rogr
am M
anag
er F
TE
- E
E P
rogr
am M
anag
er L
abor
27,1
15$
27
,115
$
27,1
15$
81
,346
$
2
Tra
inin
g P
rogr
am M
arke
ting
8,88
5$
8,88
5$
8,88
5$
26,6
54$
3T
rain
ing
Pro
gram
Con
sult
ant
25,0
00$
25
,000
$
25,0
00$
75
,000
$
461
,000
$
61,0
00$
61
,000
$
183,
000
$
5 6
FT
E C
alcu
lati
on7
FT
E p
er y
ear
0.25
0.25
0.25
820
18 L
abor
Rat
e (E
E P
rog
Mgr
)95
,000
$
9L
abor
Bur
den
14.1
7%10
Ful
ly B
urde
ned
Lab
or R
ate
108,
462
$
10
8,46
2$
108,
462
$
THE NARRAGANSETT ELECTRIC COMPANY d/b/a NATIONAL GRID RIPUC Docket No. 4770 Workpaper 6.1 - Electric Heat Costs/Assumptions Page 5 of 5
63

W
orkpaper 7.1

THE NARRAGANSETT ELECTRIC COMPANY d/b/a NATIONAL GRID RIPUC Docket No. 4770
Witnesses: Nouel, Perkinson
Workpaper 7.1
Energy Storage Costs / Assumptions
64

TH
E N
AR
RA
GA
NS
ET
T E
LE
CT
RIC
CO
MP
AN
Yd/
b/a
NA
TIO
NA
L G
RID
RIP
UC
Doc
ket N
o. 4
770
Wor
kpap
er 7
.1 -
Ene
rgy
Sto
rage
Cos
ts/A
ssum
ptio
nsP
age
1 of
2
Ove
rall
Sto
rage
CA
PE
X C
ost
Est
imat
es
Sit
eT
ype
Siz
e un
its
Cos
t per
uni
t $/W
(h)
Fro
m E
xhib
it s
pp2
Cap
ital
in $
M f
or
Dev
elop
men
t
Est
imat
ed 3
%
Pro
ject
M
anag
emen
t C
ost (
$)
Est
imat
ed 1
.25%
C
omm
issi
onin
g co
st (
$)
Est
imat
ed
15%
Nat
iona
l G
rid
Cap
ital
O
verh
ead
All
ocat
ions
($)
Tot
al
Ow
ners
hip
Cos
t ($)
N
umbe
r of
in
vert
ers
Num
ber
of
mod
ules
(@
30
0 w
att)
Est
imat
ed
Lea
se r
ate
$k/M
W f
or
sola
r or
$k
/MW
h fo
r st
orag
e
Lea
se p
er y
ear
CY
201
6 P
rope
rty
Tax
es
1S
tora
ge50
0kW
h$1
,500
$750
,000
$2
2,50
0$9
,375
$112
,500
$894
,375
4N
/A10
$5,0
002
Sto
rage
75
0kW
h$1
,500
$1,1
25,0
00
$33,
750
$14,
063
$168
,750
$1,3
41,5
634
N/A
10$7
,500
3.00
%1.
25%
15%
Tot
al
$2,2
35,9
38T
otal
$1
2,50
0
THE NARRAGANSETT ELECTRIC COMPANY d/b/a NATIONAL GRID RIPUC Docket No. 4770 Workpaper 7.1 - Energy Storage Costs/Assumptions Page 1 of 2
65

TH
E N
AR
RA
GA
NS
ET
T E
LE
CT
RIC
CO
MP
AN
Yd/
b/a
NA
TIO
NA
L G
RID
RIP
UC
Doc
ket N
o. 4
770
Wor
kpap
er 7
.1 -
Ene
rgy
Sto
rage
Cos
ts/A
ssum
ptio
nsP
age
2 of
2E
stim
ated
Mid
-Poi
nt
Su
mm
ary
of C
osts
AB
-1B
-2C
-1C
-2D
EF
GH
-1H
-2H
-3I
Siz
e R
ange
(kW
)T
arge
ted
Tot
al
Sol
ar I
nsta
lled
pe
r R
ange
(k
W)
Tar
gete
d T
otal
S
yste
m
Enh
ance
men
ts
(kW
)
Mid
-poi
nt C
ost
for
Dev
elop
men
t of
Sol
ar (
$/kW
)
Mid
-poi
nt C
ost
for
Dev
elop
men
t of
Sys
tem
E
nhan
cem
ents
($
/kW
)
Tot
al M
id-
poin
t Sub
tota
l C
osts
($)
for
D
evel
opm
ent
Est
imat
ed 1
.5%
P
roje
ct
Man
agem
ent
Cos
t ($)
Est
imat
ed 1
.25%
C
omm
issi
onin
g co
st (
$)
Est
imat
ed 1
5%
Nat
iona
l Gri
d C
apit
al O
verh
ead
All
ocat
ions
($)
Mid
-poi
nt o
f T
otal
Ow
ners
hip
Cos
t ($)
(S
olar
)
Mid
-poi
nt o
f T
otal
Ow
ners
hip
Cos
t ($)
(Sys
tem
E
nhan
cem
ents
)
Tot
al M
id-p
oint
C
ost o
f O
wne
rshi
p ($
)
Mid
-poi
nt T
otal
fo
r ow
ners
hip
in
($/k
W)
9E
ner g
y S
tora
ge-
7,00
0-
$1,5
00
$10,
500,
000
$157
,500
$131
,250
$1,6
18,3
13-
$12,
407,
063
-1,
772
$
Lin
e 9
Col
umn
A =
Ene
rgy
Sto
rage
L
ine
9 C
olum
n C
2 =
Mid
-poi
nt d
evel
opm
ent c
ost f
or s
yste
m e
nhan
cem
ents
L
ine
9 C
olum
n D
= M
id-p
oint
of
deve
lopm
ent c
ost b
ased
on
the
targ
eted
kW
siz
e. C
olum
n B
mul
tipl
ied
by C
olum
n C
Lin
e 9
Col
umn
E =
Est
imat
ed P
roje
ct M
anag
emen
t fee
incu
rred
by
the
Com
pany
to p
rovi
de o
vers
ight
and
gui
danc
e to
dev
elop
ers
on d
evel
opm
ent i
ssue
s; e
stim
ated
at 1
.5%
of
the
deve
lopm
ent c
ost
Lin
e 9
Col
umn
F =
Est
imat
ed C
omm
issi
onin
g fe
e in
curr
ed b
y th
e C
ompa
ny to
ens
ure
inst
alle
d sy
stem
s ar
e in
stal
led
and
oper
atin
g as
des
ired
; est
imat
ed a
t 1.2
5% o
f th
e de
velo
pmen
t cos
tL
ine
9 C
olum
n G
= E
stim
ated
Com
pany
ove
rhea
d al
loca
tion
s fo
r bl
anke
t wor
k or
der
Cap
ital
Pro
ject
s; e
stim
ated
at 1
5% o
f th
e de
velo
pmen
t cos
tL
ine
9 C
olum
n H
-2 =
Sum
of
Col
umn
D th
roug
h H
(S
yste
m E
nhan
cem
ent C
osts
)L
ine
9 C
olum
n I
= C
olum
n H
div
ided
by
Col
umn
BL
ine
9 re
pres
ents
a s
yste
m e
nhan
cem
ent f
or li
thiu
m-i
on b
atte
ry s
yste
ms
in th
e 1
MW
h to
4 M
Wh
rang
e
THE NARRAGANSETT ELECTRIC COMPANY d/b/a NATIONAL GRID RIPUC Docket No. 4770 Workpaper 7.1 - Energy Storage Costs/Assumptions Page 2 of 2
66

Workpaper 8.1
THE NARRAGANSETT ELECTRIC COMPANY d/b/a NATIONAL GRID RIPUC Docket No. 4770
Witnesses: Nouel, Perkinson
Workpaper 8.1
Solar Costs / Assumptions
67

TH
E N
AR
RA
GA
NS
ET
T E
LE
CT
RIC
CO
MP
AN
Yd/
b/a
NA
TIO
NA
L G
RID
RIP
UC
Doc
ket N
o. 4
770
Wor
kpap
er 8
.1 -
Sol
ar C
osts
/Ass
umpt
ions
Pag
e 1
of 3
Ove
rall
Sol
ar C
AP
EX
Cos
t E
stim
ates
AB
CD
EF
GH
IJ
KL
MN
OP
Sit
eT
ype
Siz
e un
its
Cos
t per
uni
t $/W
(h)
Fro
m E
xhib
it s
pp2
Cap
ital
in $
M f
or
Dev
elop
men
t
Est
imat
ed 3
%
Pro
ject
M
anag
emen
t C
ost (
$)
Est
imat
ed 1
.25%
C
omm
issi
onin
g co
st (
$)
Est
imat
ed 1
5%
Nat
iona
l Gri
d C
apit
al
Ove
rhea
d A
lloc
atio
ns (
$)
Tot
al
Ow
ners
hip
Cos
t ($)
Pro
gram
Cos
t U
sed
in B
CA
($
)
Num
ber
of
inve
rter
s
Num
ber
of
mod
ules
(@
300
w
att)
Est
imat
ed L
ease
rat
e $k
/MW
for
sol
ar o
r $k
/MW
h fo
r st
orag
e L
ease
per
yea
rC
Y 2
016
Pro
pert
y T
axes
1S
olar
Can
opy
(par
king
lot)
250
kW$4
,450
$1
,112
,500
$3
3,37
5$1
3,90
6$1
66,8
75$1
,326
,656
$1,3
37,5
005
833
35$8
,750
2S
olar
Can
opy
(par
king
lot)
500
kW$4
,263
$2,1
31,5
00
$63,
945
$26,
644
$319
,725
$2,5
41,8
14$2
,550
,000
1016
6730
$15,
000
3S
olar
15
00kW
$2,8
93$4
,339
,500
$1
30,1
85$5
4,24
4$6
50,9
25$5
,174
,854
$5,1
75,0
0010
1667
30$4
5,00
03.
00%
1.25
%15
%
Tot
al
$9,0
43,3
24T
otal
$6
8,75
0
THE NARRAGANSETT ELECTRIC COMPANY d/b/a NATIONAL GRID RIPUC Docket No. 4770 Workpaper 8.1 - Solar Costs/Assumptions Page 1 of 3
68
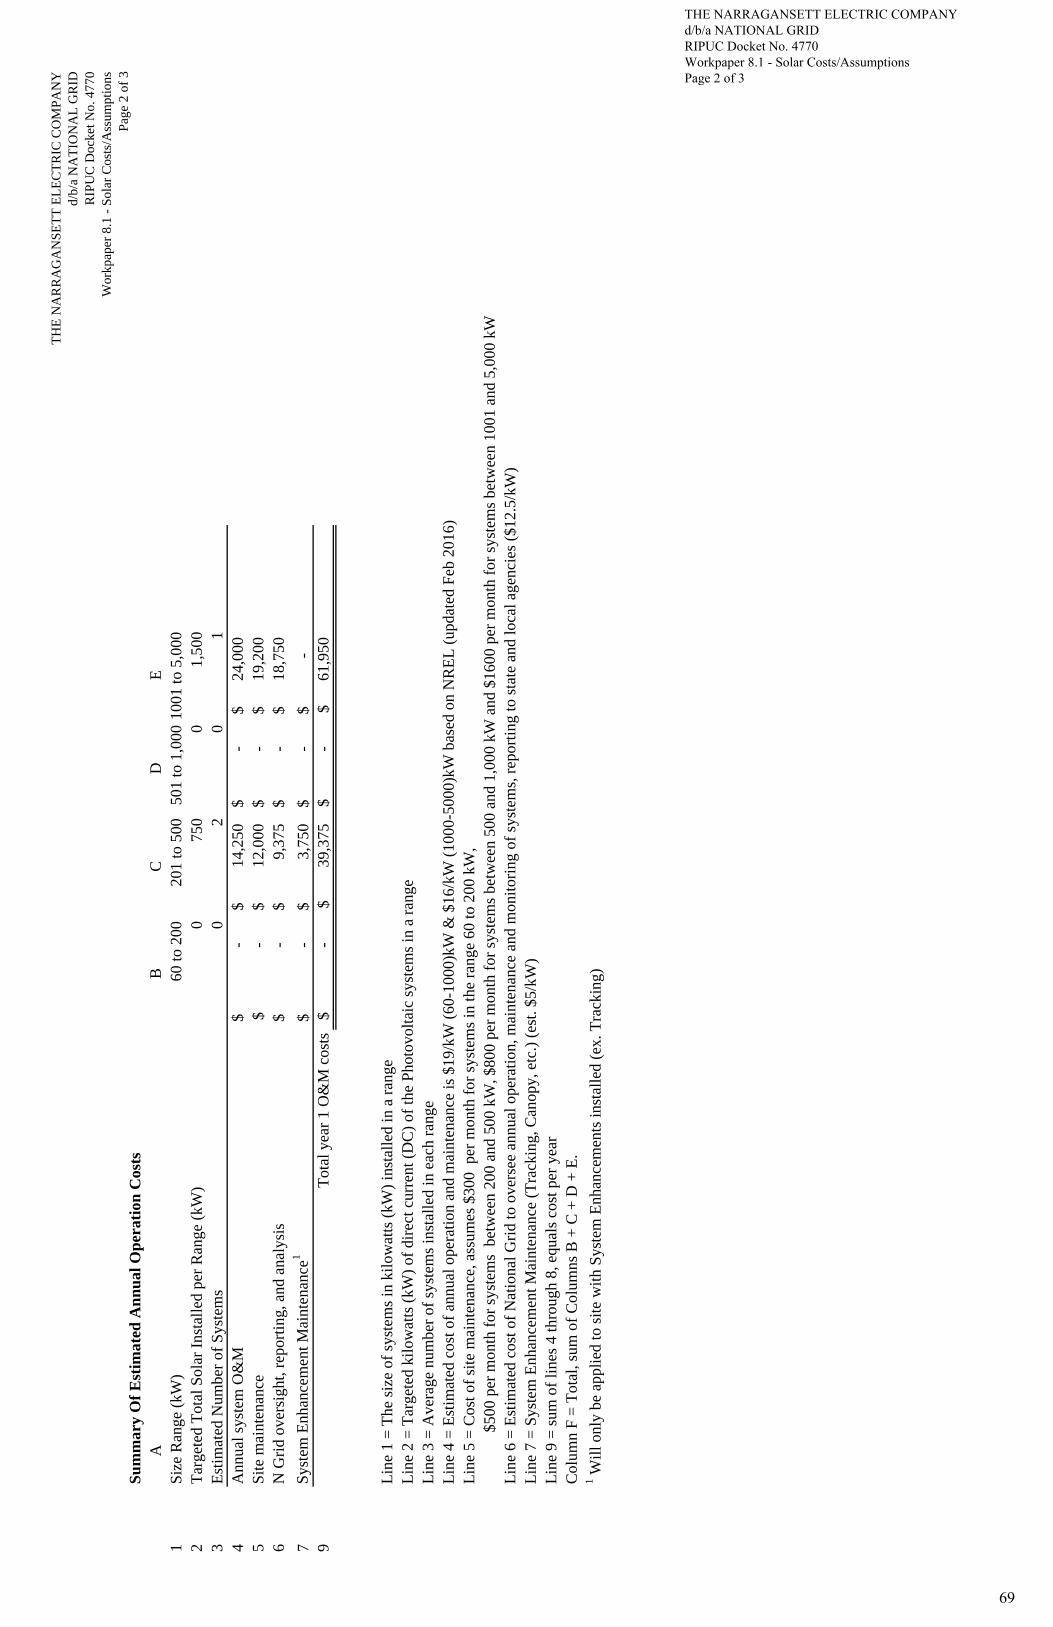
TH
E N
AR
RA
GA
NS
ET
T E
LE
CT
RIC
CO
MP
AN
Yd/
b/a
NA
TIO
NA
L G
RID
RIP
UC
Doc
ket N
o. 4
770
Wor
kpap
er 8
.1 -
Sol
ar C
osts
/Ass
umpt
ions
Pag
e 2
of 3
Su
mm
ary
Of
Est
imat
ed A
nn
ual
Op
erat
ion
Cos
ts
A
BC
DE
1S
ize
Ran
ge (
kW)
60 to
200
201
to 5
0050
1 to
1,0
0010
01 to
5,0
002
Tar
gete
d T
otal
Sol
ar I
nsta
lled
per
Ran
ge (
kW)
075
00
1,50
03
Est
imat
ed N
umbe
r of
Sys
tem
s0
20
14
Ann
ual s
yste
m O
&M
-$
14,2
50$
-
$
24
,000
$
5
Sit
e m
aint
enan
ce-
$
12
,000
$
-$
19,2
00$
6N
Gri
d ov
ersi
ght,
repo
rtin
g, a
nd a
naly
sis
-$
9,37
5$
-$
18,7
50$
7S
yste
m E
nhan
cem
ent M
aint
enan
ce1
-$
3,75
0$
-$
-$
9T
otal
yea
r 1
O&
M c
osts
-$
39,3
75$
-
$
61
,950
$
Lin
e 1
= T
he s
ize
of s
yste
ms
in k
ilow
atts
(kW
) in
stal
led
in a
ran
geL
ine
2 =
Tar
gete
d ki
low
atts
(kW
) of
dir
ect c
urre
nt (
DC
) of
the
Pho
tovo
ltai
c sy
stem
s in
a r
ange
Lin
e 3
= A
vera
ge n
umbe
r of
sys
tem
s in
stal
led
in e
ach
rang
eL
ine
4 =
Est
imat
ed c
ost o
f an
nual
ope
rati
on a
nd m
aint
enan
ce is
$19
/kW
(60
-100
0)kW
& $
16/k
W (
1000
-500
0)kW
bas
ed o
n N
RE
L (
upda
ted
Feb
201
6)
Lin
e 5
= C
ost o
f si
te m
aint
enan
ce, a
ssum
es $
300
per
mon
th f
or s
yste
ms
in th
e ra
nge
60 to
200
kW
,
$
500
per
mon
th f
or s
yste
ms
bet
wee
n 20
0 an
d 50
0 kW
, $80
0 pe
r m
onth
for
sys
tem
s be
twee
n 50
0 an
d 1,
000
kW a
nd $
1600
per
mon
th f
or s
yste
ms
betw
een
1001
and
5,0
00 k
WL
ine
6 =
Est
imat
ed c
ost o
f N
atio
nal G
rid
to o
vers
ee a
nnua
l ope
rati
on, m
aint
enan
ce a
nd m
onit
orin
g of
sys
tem
s, r
epor
ting
to s
tate
and
loca
l age
ncie
s ($
12.5
/kW
)L
ine
7 =
Sys
tem
Enh
ance
men
t Mai
nten
ance
(T
rack
ing,
Can
opy,
etc
.) (
est.
$5/k
W)
Lin
e 9
= s
um o
f li
nes
4 th
roug
h 8,
equ
als
cost
per
yea
rC
olum
n F
= T
otal
, sum
of
Col
umns
B +
C +
D +
E.
1 Wil
l onl
y be
app
lied
to s
ite
wit
h S
yste
m E
nhan
cem
ents
inst
alle
d (e
x. T
rack
ing)
THE NARRAGANSETT ELECTRIC COMPANY d/b/a NATIONAL GRID RIPUC Docket No. 4770 Workpaper 8.1 - Solar Costs/Assumptions Page 2 of 3
69
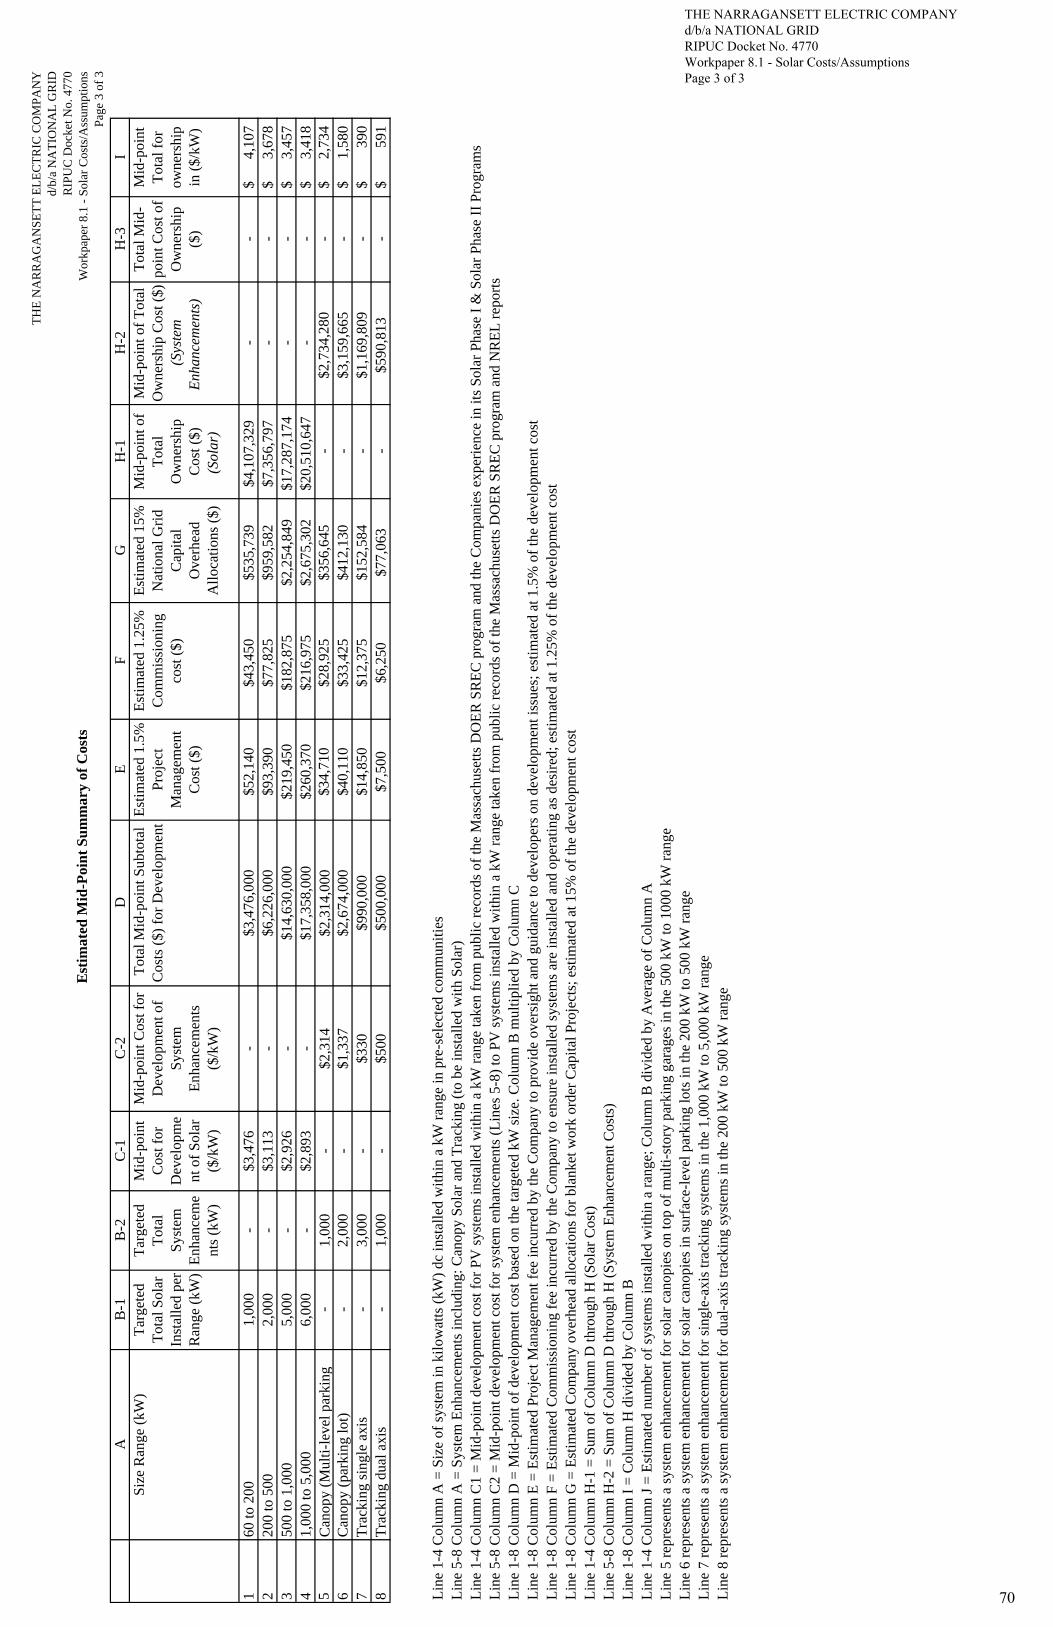
TH
E N
AR
RA
GA
NS
ET
T E
LE
CT
RIC
CO
MP
AN
Yd/
b/a
NA
TIO
NA
L G
RID
RIP
UC
Doc
ket N
o. 4
770
Wor
kpap
er 8
.1 -
Sol
ar C
osts
/Ass
umpt
ions
Pag
e 3
of 3
Est
imat
ed M
id-P
oin
t S
um
mar
y of
Cos
ts
AB
-1B
-2C
-1C
-2D
EF
GH
-1H
-2H
-3I
Siz
e R
ange
(kW
)T
arge
ted
Tot
al S
olar
In
stal
led
per
Ran
ge (
kW)
Tar
gete
d T
otal
S
yste
m
Enh
ance
me
nts
(kW
)
Mid
-poi
nt
Cos
t for
D
evel
opm
ent
of
Sol
ar
($/k
W)
Mid
-poi
nt C
ost f
or
Dev
elop
men
t of
Sys
tem
E
nhan
cem
ents
($
/kW
)
Tot
al M
id-p
oint
Sub
tota
l C
osts
($)
for
Dev
elop
men
tE
stim
ated
1.5
%
Pro
ject
M
anag
emen
t C
ost (
$)
Est
imat
ed 1
.25%
C
omm
issi
onin
g co
st (
$)
Est
imat
ed 1
5%
Nat
iona
l Gri
d C
apit
al
Ove
rhea
d A
lloc
atio
ns (
$)
Mid
-poi
nt o
f T
otal
O
wne
rshi
p C
ost (
$)
(Sol
ar)
Mid
-poi
nt o
f T
otal
O
wne
rshi
p C
ost (
$) (
Syst
em
Enh
ance
men
ts)
Tot
al M
id-
poin
t Cos
t of
Ow
ners
hip
($)
Mid
-poi
nt
Tot
al f
or
owne
rshi
p in
($/
kW)
160
to 2
001,
000
-$3
,476
-
$3,4
76,0
00
$52,
140
$43,
450
$535
,739
$4,1
07,3
29-
-4,
107
$
2
200
to 5
002,
000
-$3
,113
-
$6,2
26,0
00
$93,
390
$77,
825
$959
,582
$7,3
56,7
97-
-3,
678
$
3
500
to 1
,000
5,00
0-
$2,9
26
-$1
4,63
0,00
0 $2
19,4
50$1
82,8
75$2
,254
,849
$17,
287,
174
--
3,45
7$
41,
000
to 5
,000
6,00
0-
$2,8
93
-$1
7,35
8,00
0 $2
60,3
70$2
16,9
75$2
,675
,302
$20,
510,
647
--
3,41
8$
5C
anop
y (M
ulti
-lev
el p
arki
ng
-1,
000
-$2
,314
$2
,314
,000
$3
4,71
0$2
8,92
5$3
56,6
45-
$2,7
34,2
80-
2,73
4$
6C
anop
y (p
arki
ng lo
t)-
2,00
0-
$1,3
37
$2,6
74,0
00
$40,
110
$33,
425
$412
,130
-$3
,159
,665
-1,
580
$
7
Tra
ckin
g si
ngle
axi
s-
3,00
0-
$330
$9
90,0
00
$14,
850
$12,
375
$152
,584
-$1
,169
,809
-39
0$
8
Tra
ckin
g du
al a
xis
-1,
000
-$5
00
$500
,000
$7
,500
$6,2
50$7
7,06
3-
$590
,813
-59
1$
Lin
e 1-
4 C
olum
n A
= S
ize
of s
yste
m in
kil
owat
ts (
kW)
dc in
stal
led
wit
hin
a kW
ran
ge in
pre
-sel
ecte
d co
mm
unit
ies
Lin
e 5-
8 C
olum
n A
= S
yste
m E
nhan
cem
ents
incl
udin
g: C
anop
y S
olar
and
Tra
ckin
g (t
o be
inst
alle
d w
ith
Sol
ar)
Lin
e 1-
4 C
olum
n C
1 =
Mid
-poi
nt d
evel
opm
ent c
ost f
or P
V s
yste
ms
inst
alle
d w
ithi
n a
kW r
ange
take
n fr
om p
ubli
c re
cord
s of
the
Mas
sach
uset
ts D
OE
R S
RE
C p
rogr
am a
nd th
e C
ompa
nies
exp
erie
nce
in it
s S
olar
Pha
se I
& S
olar
Pha
se I
I P
rogr
ams
Lin
e 5-
8 C
olum
n C
2 =
Mid
-poi
nt d
evel
opm
ent c
ost f
or s
yste
m e
nhan
cem
ents
(L
ines
5-8
) to
PV
sys
tem
s in
stal
led
wit
hin
a kW
ran
ge ta
ken
from
pub
lic
reco
rds
of th
e M
assa
chus
etts
DO
ER
SR
EC
pro
gram
and
NR
EL
rep
orts
Lin
e 1-
8 C
olum
n D
= M
id-p
oint
of
deve
lopm
ent c
ost b
ased
on
the
targ
eted
kW
siz
e. C
olum
n B
mul
tipl
ied
by C
olum
n C
Lin
e 1-
8 C
olum
n E
= E
stim
ated
Pro
ject
Man
agem
ent f
ee in
curr
ed b
y th
e C
ompa
ny to
pro
vide
ove
rsig
ht a
nd g
uida
nce
to d
evel
oper
s on
dev
elop
men
t iss
ues;
est
imat
ed a
t 1.5
% o
f th
e de
velo
pmen
t cos
tL
ine
1-8
Col
umn
F =
Est
imat
ed C
omm
issi
onin
g fe
e in
curr
ed b
y th
e C
ompa
ny to
ens
ure
inst
alle
d sy
stem
s ar
e in
stal
led
and
oper
atin
g as
des
ired
; est
imat
ed a
t 1.2
5% o
f th
e de
velo
pmen
t cos
tL
ine
1-8
Col
umn
G =
Est
imat
ed C
ompa
ny o
verh
ead
allo
cati
ons
for
blan
ket w
ork
orde
r C
apit
al P
roje
cts;
est
imat
ed a
t 15%
of
the
deve
lopm
ent c
ost
Lin
e 1-
4 C
olum
n H
-1 =
Sum
of
Col
umn
D th
roug
h H
(S
olar
Cos
t)L
ine
5-8
Col
umn
H-2
= S
um o
f C
olum
n D
thro
ugh
H (
Sys
tem
Enh
ance
men
t Cos
ts)
Lin
e 1-
8 C
olum
n I
= C
olum
n H
div
ided
by
Col
umn
BL
ine
1-4
Col
umn
J =
Est
imat
ed n
umbe
r of
sys
tem
s in
stal
led
wit
hin
a ra
nge;
Col
umn
B d
ivid
ed b
y A
vera
ge o
f C
olum
n A
Lin
e 5
repr
esen
ts a
sys
tem
enh
ance
men
t for
sol
ar c
anop
ies
on to
p of
mul
ti-s
tory
par
king
gar
ages
in th
e 50
0 kW
to 1
000
kW r
ange
Lin
e 6
repr
esen
ts a
sys
tem
enh
ance
men
t for
sol
ar c
anop
ies
in s
urfa
ce-l
evel
par
king
lots
in th
e 20
0 kW
to 5
00 k
W r
ange
Lin
e 7
repr
esen
ts a
sys
tem
enh
ance
men
t for
sin
gle-
axis
trac
king
sys
tem
s in
the
1,00
0 kW
to 5
,000
kW
ran
geL
ine
8 re
pres
ents
a s
yste
m e
nhan
cem
ent f
or d
ual-
axis
trac
king
sys
tem
s in
the
200
kW to
500
kW
ran
ge
THE NARRAGANSETT ELECTRIC COMPANY d/b/a NATIONAL GRID RIPUC Docket No. 4770 Workpaper 8.1 - Solar Costs/Assumptions Page 3 of 3
70

W
orkpaper 9.1

THE NARRAGANSETT ELECTRIC COMPANY d/b/a NATIONAL GRID RIPUC Docket No. 4770
Witnesses: McGuinness, Roughan
Workpaper 9.1
Peak Demand Reduction Targets
71

TH
E N
AR
RA
GA
NS
ET
T E
LE
CT
RIC
CO
MP
AN
Yd/
b/a
NA
TIO
NA
L G
RID
RIP
UC
Doc
ket N
o. 4
770
Wor
kpap
er 9
.1 -
Pea
k D
eman
d R
educ
tion
Tar
gets
Pag
e 1
of 9
2019
2020
2021Basis Points
Minim
um
22
18
19
6
Target
29
26
26
12
Maxim
um
38
31
31
18
2019
2020
2021Basis Points
Minim
um
28
23
26
1
Target
36
34
36
1.75
Maxim
um
47
44
46
2.5
Annual Peak R
eduction Targets(M
Ws) and Basis Points
Annual Sum of Monthly Peak R
eduction Targets(M
Ws) and Basis Points
Summary of Forw
ard Cap
acity Market an
d M
onthly Transm
ission Peak Reduction Targets
THE NARRAGANSETT ELECTRIC COMPANY d/b/a NATIONAL GRID RIPUC Docket No. 4770 Workpaper 9.1 - Peak Demand Reduction Targets Page 1 of 9
72

TH
E N
AR
RA
GA
NS
ET
T E
LE
CT
RIC
CO
MP
AN
Yd/
b/a
NA
TIO
NA
L G
RID
RIP
UC
Doc
ket N
o. 4
770
Wor
kpap
er 9
.1 -
Pea
k D
eman
d R
educ
tion
Tar
gets
Pag
e 2
of 9
year
mw
_zon
e_50
_pre
mw
_zon
e_50
_pos
tm
w_e
em
w_p
v
RH
OD
E IS
LA
ND
SU
MM
ER
Ind
epen
den
t 50
/50
Pea
ks (
MW
)
(b
efo
re &
aft
er D
ER
s)
EE
% o
fP
V %
of
Cal
end
arR
eco
nst
itu
ted
Fin
al F
ore
cast
Fin
al F
ore
cast
EE
Red
uct
ion
PV
Red
uct
ion
'Rec
on
stit
ute
d'
'Rec
on
stit
ute
d'
An
nu
al E
E im
pac
tA
nn
ual
So
lar
imp
act
Cumulative EE
impact starting
2019
PV im
pact
starting 2019
Post‐2018
reconstituted
Yea
r(b
efo
re r
edu
ctio
ns)
w/ E
E R
edu
ctio
n o
nly
(aft
er a
ll re
du
ctio
ns)
Fo
reca
stF
ore
cast
Del
iver
ies
Del
iver
ies
2003
1,81
31,
803
1,80
39
00.
5%0.
0%20
041,
860
1,83
91,
839
210
1.1%
0.0%
11.9
020
051,
802
1,77
21,
772
300
1.7%
0.0%
90
2006
1,84
41,
803
1,80
341
02.
2%0.
0%11
020
071,
902
1,85
21,
852
510
2.7%
0.0%
100
2008
1,87
81,
817
1,81
761
03.
3%0.
0%10
020
091,
893
1,81
61,
816
770
4.0%
0.0%
150
2010
1,88
71,
798
1,79
889
04.
7%0.
0%12
020
111,
919
1,81
81,
817
102
05.
3%0.
0%13
0.23
016
2012
1,94
41,
823
1,82
212
10
6.2%
0.0%
190.
1818
620
131,
968
1,82
01,
817
148
27.
5%0.
1%27
2.05
758
2014
2,00
11,
814
1,81
118
74
9.3%
0.2%
391.
1751
620
152,
075
1,85
51,
850
220
510
.6%
0.2%
331.
1327
420
162,
036
1,78
51,
778
250
712
.3%
0.4%
312.
6159
720
172,
018
1,73
91,
723
279
1613
.8%
0.8%
298.
673
2018
2,04
11,
731
1,70
631
025
15.2
%1.
2%31
8.69
420
192,
063
1,72
31,
691
340
3216
.5%
1.6%
317.
413
317
1,72
920
202,
087
1,71
81,
679
369
3917
.7%
1.9%
296.
678
6014
.091
1,75
320
212,
109
1,71
41,
672
395
4218
.7%
2.0%
263.
192
8617
.283
1,77
420
222,
131
1,71
21,
668
419
4419
.7%
2.1%
242.
373
110
19.6
561,
797
2023
2,15
31,
712
1,66
644
147
20.5
%2.
2%22
132
21.9
661,
819
2024
2,17
71,
717
1,66
846
049
21.1
%2.
3%20
252,
202
1,72
51,
673
477
5121
.7%
2.3%
2026
2,22
61,
734
1,68
149
253
22.1
%2.
4%20
272,
249
1,74
21,
687
507
5622
.5%
2.5%
2028
2,27
21,
750
1,69
252
258
23.0
%2.
5%20
292,
293
1,75
61,
696
537
6023
.4%
2.6%
2030
2,31
41,
761
1,69
955
262
23.9
%2.
7%20
312,
333
1,76
61,
702
567
6424
.3%
2.8%
2032
2,35
21,
770
1,70
358
266
24.8
%2.
8%
'07
to '1
7: 1
0-ye
a0.
6%-0
.6%
-0.7
%'1
2 to
'17:
5-y
ear
0.8%
-0.9
%-1
.1%
'17
to '2
2: 5
-yea
r 1.
1%-0
.3%
-0.7
%'1
7 to
'27:
10-
yea
1.1%
0.0%
-0.2
%'1
7 to
'32:
15-
yea
1.0%
0.1%
-0.1
%
----
----
----
- S
YS
TE
M P
EA
K (
50/5
0) -
----
----
----
----
----
- D
ER
RE
DU
CT
ION
S -
----
-
THE NARRAGANSETT ELECTRIC COMPANY d/b/a NATIONAL GRID RIPUC Docket No. 4770 Workpaper 9.1 - Peak Demand Reduction Targets Page 2 of 9
73

THE NARRAGANSETT ELECTRIC COMPANYd/b/a NATIONAL GRIDRIPUC Docket No. 4770
Workpaper 9.1 - Peak Demand Reduction TargetsPage 3 of 9
Year 2019 2020 2021
Forecast Peak Load (1) 1691 1679 1672 Forecast peak load Rwith EE and PV impacts included
Forecast Peak Load (reconstituted) (2) 1729 1753 1774 Forecast peak load reconstituted for EE and PV for rate years
Minimum DER Impact (3)=(4)+(5)+(6)+(7)+(8)+(9) 43 82 117
Solar PV (4) 7 13 16
Energy Efficiency (5) 33 65 95
VVO (6) 2 3 5
Storage (7) 1 1 1
CHP (8) 0 0 0 CHP is assumed in EE targets
Heat Electrification (9) 0 0 0
Minimum Peak Load before Incremental effort (10)=(2)‐(3) 1686 1671 1657
Incremental effort (11) 2 5 10
Implied Minimum Peak Load Target (12)=(10)‐(11) 1684 1666 1647
Difference from original forecast (13)=(1)‐(12) 7 13 25
Year 2019 2020 2021
Forecast Peak Load (1) 1691 1679 1672 Forecast peak load Rwith EE and PV impacts included
Forecast Peak Load (reconstituted) (2) 1729 1753 1774 Forecast peak load reconstituted for EE and PV for rate years
Midpoint DER Impact (3)=(4)+(5)+(6)+(7)+(8)+(9) 46 91 133
Solar PV (4) 7 14 17
Energy Efficiency (5) 35 70 104
VVO (6) 3 5 8
Storage (7) 1 2 3
CHP (8) 0 0 0 CHP is assumed in EE targets
Heat Electrification (9) 0 0 0
Midpoint Peak Load before Incremental effort (10)=(2)‐(3) 1682 1661 1642
Incremental effort (11) 5 10 16
Implied Midpoint Peak Load Target (12)=(10)‐(11) 1677 1651 1626
Difference from original forecast (13)=(1)‐(12) 13 27 46
Year (1) 2019 2020 2021
Forecast Peak Load (reconstituted) (2) 1729 1753 1774 Forecast peak load Rwith EE and PV impacts included
Maximum DER Impact (3)=(4)+(5)+(6)+(7)+(8)+(9) 50 101 147 Forecast peak load reconstituted for EE and PV for rate years
Solar PV (4) 8 16 19
Energy Efficiecy (5) 37 75 113
VVO (6) 3 6 9
Storage (7) 2 4 6
CHP (8) 0 0 0 CHP is assumed in EE targets
Heat Electrification (9) 0 0 0
Maximum Peak Load before Incremental Effort (10)=(2)‐(3) 1678 1652 1627
Incremental effort (11) 10 15 21
Implied Maximum Peak Load Target (12)=(10)‐(11) 1668 1637 1606
Difference from original forecast (13)=(1)‐(12) 22 42 65
2018 WN Peak Forecast (MW)
1706 Cumulative MW Reductions from 2018
2019 2020 20201
Min 22 40 59
Mid 29 55 80
Max 38 69 100
Annual Peak MW Reductions from prior year (starting with 2018)
2019 2020 2021
Min 22 18 19
Mid 29 26 26
Max 38 31 31
Percent Reduction from 2018
2019 2020 2021
Min 1.30% 2.35% 3.46%
Mid 1.68% 3.19% 4.70%
Max 2.20% 4.04% 5.86%
Incremental MW Reductions to Forecast
2019 2020 2021
7 13 25
13 27 46
22 42 65
Forward Capacity Market Peak Demand Reduction Targets
MINIMUM PEAK REDUCTION TARGETS
MIDPOINT PEAK REDUCTION TARGETS
MAXIMUM PEAK REDUCTION TARGETS
74

THE NARRAGANSETT ELECTRIC COMPANYd/b/a NATIONAL GRIDRIPUC Docket No. 4770
Workpaper 9.1 - Peak Demand Reduction TargetsPage 4 of 9
Total Peak Impacts from DERs at Minimum, Target, and Maximum Levels
2012 2013 2014 2015 2016 2017 2018 2019 2020 2021
Peak ‐ Actual & Forecast 1,822 1,807 1,811 1,850 1,778 1,723 1,706 1,691 1,679 1,672
Peak Forecast for Rate Years ‐ without EE & PV 1729 1753 1774
Total Peak Impacts
Peak Impacts (MW) 2019 2020 2021
Solar photovoltaics (PV) 7 13 16
Energy Efficiency (EE) 33 65 95
VVO 2 3 5
Storage 1 1 1
CHP 0 0 0 Included in EE
Heat 0 0 0
Minimum 43 82 117
Peak Impacts (MW)2019 2020 2021
Solar photovoltaics (PV) 7 14 17
Energy Efficiency (EE) 35 70 104
VVO 3 5 8
Storage 1 2 3
CHP 0 0 0 Included in EE
Heat 0 0 0
Target 46 91 133
Peak Impacts (MW) 2019 2020 2021
Solar photovoltaics (PV) 8 16 19
Energy Efficiency (EE) 37 75 113
VVO 3 6 9
Storage 2 4 6
CHP 0 0 0 Included in EE
Heat 0 0 0
Maximum 50 101 147
NECO Weather Normalized Peak ‐ Internal Forecast
75
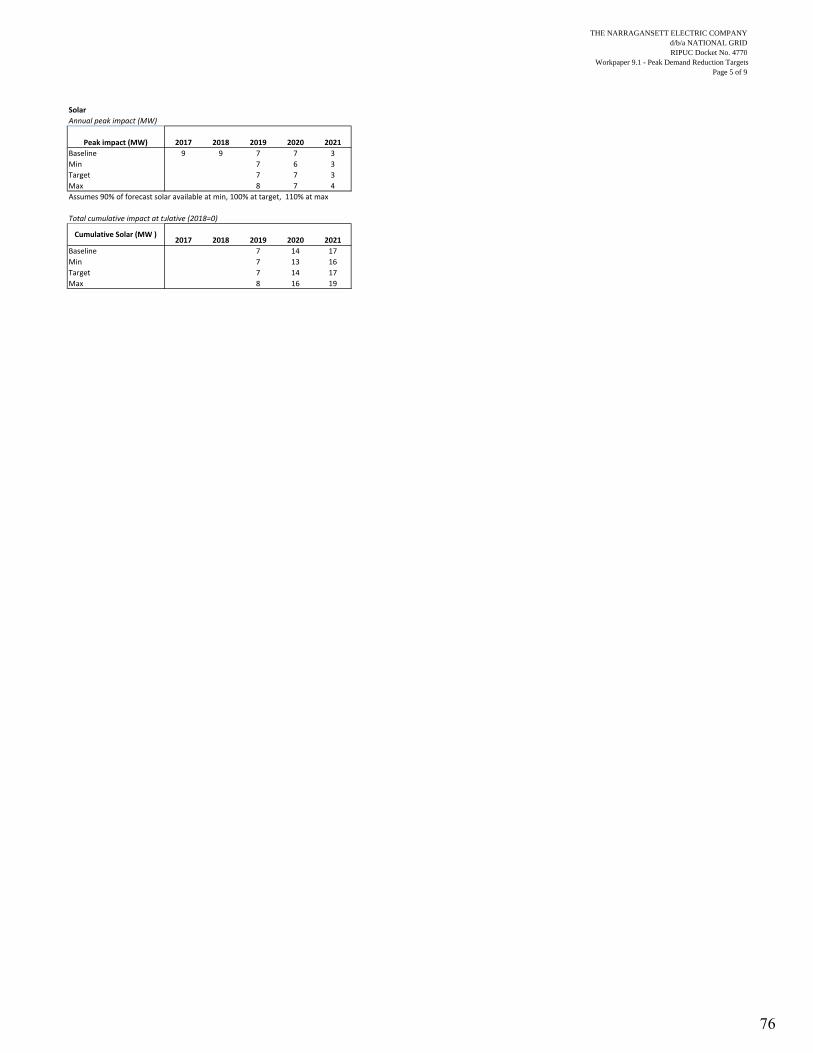
THE NARRAGANSETT ELECTRIC COMPANYd/b/a NATIONAL GRIDRIPUC Docket No. 4770
Workpaper 9.1 - Peak Demand Reduction TargetsPage 5 of 9
Solar
2017 2018 2019 2020 2021
Baseline 9 9 7 7 3
Min 7 6 3
Target 7 7 3
Max 8 7 4
Assumes 90% of forecast solar available at min, 100% at target, 110% at max
Total cumulative impact at thulative (2018=0)
2017 2018 2019 2020 2021
Baseline 7 14 17
Min 7 13 16
Target 7 14 17
Max 8 16 19
Annual peak impact (MW)
Peak impact (MW)
Cumulative Solar (MW )
Forecast
Forecast
76

THE NARRAGANSETT ELECTRIC COMPANYd/b/a NATIONAL GRIDRIPUC Docket No. 4770
Workpaper 9.1 - Peak Demand Reduction TargetsPage 6 of 9
Energy Efficiency
Peak Impact (MW) from annual incremental installations
2017 2018 2019 2020 2021
Baseline 0 35.188 35 34 34
Min 32 31 31
Target 35 34 34
Max 39 38 38
2019 and 2020 baseline reflect values in 3 Year Plan. 2021 assumed same as 2020
Assumes 90% of planned EE achieved at min, 100% at target, 110% at max
Peak Reduction
Total impact in MW at time oCumulative (2018 =0)
2017 2018 2019 2020 2021
Baseline 35 70 104
Min ‐ ‐ 33 65 95
Target ‐ ‐ 35 70 104
Max ‐ ‐ 37 75 113
Assumed % of annual installations that contribute to peak
0.50
Peak Impact (MW)
Forecast
Peak Impact (MW)
Forecast
77

TH
E N
AR
RA
GA
NS
ET
T E
LE
CT
RIC
CO
MP
AN
Yd/
b/a
NA
TIO
NA
L G
RID
RIP
UC
Doc
ket N
o. 4
770
Wor
kpap
er 9
.1 -
Pea
k D
eman
d R
educ
tion
Tar
gets
Pag
e 7
of 9
VVO
Total impact in M
W at time of system
peak
2017
2018
2019
2020
2021
Baseline
Min
1.80
3.35
5.372% red
uction
Target
2.70
5.03
8.063% red
uction
Max
3.15
5.87
9.413.5% red
uction
Project inform
ation
FY Installed
Ben
efits
realized
in FY
CAPEX
VVO
OPEX
VVO
COR VVO
# of substations
# of
feed
ers
# of customers
MVA
GWhr
2% M
VA
Red
uction
3% M
VA
reduction
3.5% M
VA
Red
uction
Cumulative M
VA
Impact (3%)
Cumulative
MVA Im
pact
(3.5%)
FY17
FY18
27
FY18
FY19
$1,486,674
$303,741
$98,407
38
20,109
90.05
247.79
1.8
2.7
3.15
2.7
3.15
FY19
FY20
$1,463,679
$318,384
$98,336
210
15,862
77.7
322.99
1.55
2.33
2.72
5.03
5.87
FY20
FY21
$1,814,591
$341,488
$127,032
115
18,531
101.01
393.51
2.02
3.03
3.54
8.06
9.41
FY21
FY22
$1,337,650
$324,480
$83,815
210
13,421
86.94
270.89
1.74
2.61
3.04
10.67
12.45
FY22
FY23
$571,026
$184,027
$38,779
13
4,560
28.44
129.57
0.57
0.85
111.52
13.44
MW
Forecast
PILOT
78

THE NARRAGANSETT ELECTRIC COMPANYd/b/a NATIONAL GRIDRIPUC Docket No. 4770
Workpaper 9.1 - Peak Demand Reduction TargetsPage 8 of 9
Battery Storage
Total impact in MW at time of system peak from battery storage
2017 2018 2019 2020 2021
Baseline
Min 0 0 0.896739 0.896739 0.896739
Target 0 0 1 2 3
Max 0 0 2 4 6
Min targets align with expected storage project impacts
Target and max assume additional storage
Peak Impact (MW)Forecast
79
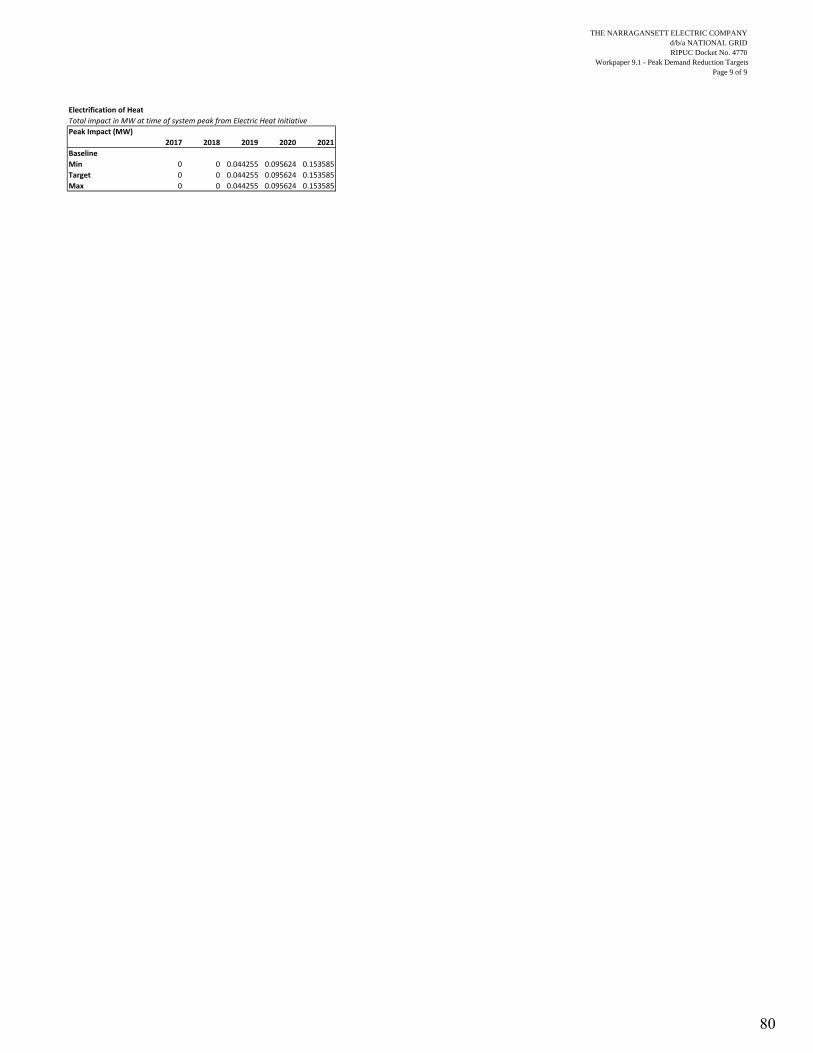
THE NARRAGANSETT ELECTRIC COMPANYd/b/a NATIONAL GRIDRIPUC Docket No. 4770
Workpaper 9.1 - Peak Demand Reduction TargetsPage 9 of 9
Electrification of Heat
Total impact in MW at time of system peak from Electric Heat Initiative
Peak Impact (MW)
2017 2018 2019 2020 2021
Baseline
Min 0 0 0.044255 0.095624 0.153585
Target 0 0 0.044255 0.095624 0.153585
Max 0 0 0.044255 0.095624 0.153585
80

Workpaper 9.2
THE NARRAGANSETT ELECTRIC COMPANY d/b/a NATIONAL GRID RIPUC Docket No. 4770
Witnesses: McGuinness, Roughan
Workpaper 9.2
Electric Heat Initiative Targets
81
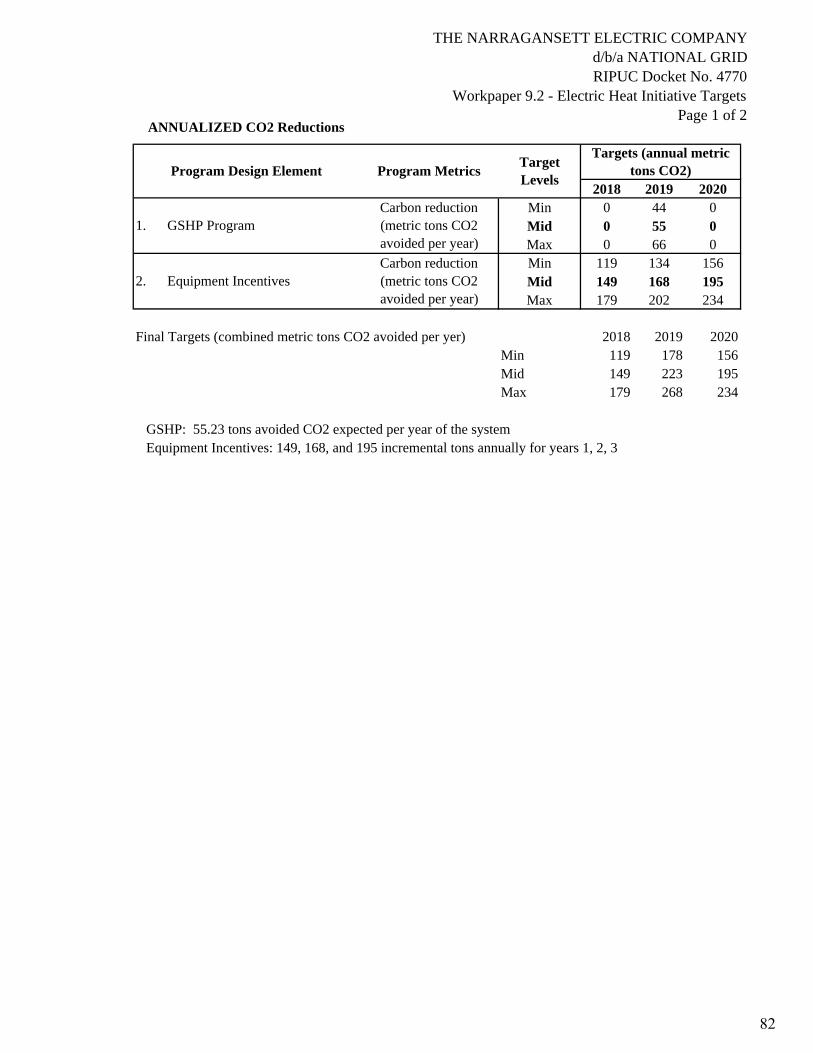
THE NARRAGANSETT ELECTRIC COMPANYd/b/a NATIONAL GRIDRIPUC Docket No. 4770
Workpaper 9.2 - Electric Heat Initiative TargetsPage 1 of 2
ANNUALIZED CO2 Reductions
2018 2019 2020Min 0 44 0Mid 0 55 0Max 0 66 0Min 119 134 156Mid 149 168 195Max 179 202 234
Final Targets (combined metric tons CO2 avoided per yer) 2018 2019 2020Min 119 178 156Mid 149 223 195Max 179 268 234
GSHP: 55.23 tons avoided CO2 expected per year of the system Equipment Incentives: 149, 168, and 195 incremental tons annually for years 1, 2, 3
Targets (annual metric tons CO2)
1. GSHP ProgramCarbon reduction (metric tons CO2 avoided per year)
2. Equipment IncentivesCarbon reduction (metric tons CO2 avoided per year)
Program Design Element Program MetricsTarget Levels
82

TH
E N
AR
RA
GA
NS
ET
T E
LE
CT
RIC
CO
MP
AN
Yd/
b/a
NA
TIO
NA
L G
RID
RIP
UC
Doc
ket N
o. 4
770
Wor
kpap
er 9
.2 -
Ele
ctri
c H
eat I
niti
ativ
e T
arge
tsP
age
2 of
2Assumptions
Carbon Emissions Factors ‐ non‐electric fuels
Fuel
Lbs / MMBTU
Short Ton /
MMBTU
Metric Ton /
MMBTU
Source
Natural G
as117
0.0585
0.05307037https://www.eia.gov/tools/faqs/faq.cfm
?id=73&t=11
Fuel Oil
161.3
0.08065
0.073164536https://www.eia.gov/tools/faqs/faq.cfm
?id=73&t=11
Propane
139
0.0695
0.063049414https://www.eia.gov/tools/faqs/faq.cfm
?id=73&t=11
Metric tons CO2
% reduction
Average annual emissions of an
oil‐heated
home
~8n/a
Average annual avoided
CO2 from oil‐to‐
ccASH
P conversion
~338%
Average annual avoided
CO2 from oil‐to‐GSH
P
conversion
~563%
THE NARRAGANSETT ELECTRIC COMPANY d/b/a NATIONAL GRID RIPUC Docket No. 4770 Workpaper 9.2 - Electric Heat Initiative Targets Page 2 of 2
83

W
orkpaper 9.3

THE NARRAGANSETT ELECTRIC COMPANY d/b/a NATIONAL GRID RIPUC Docket No. 4770
Witnesses: McGuinness, Roughan
Workpaper 9.3
Electric Vehicle Targets
84

TH
E N
AR
RA
GA
NS
ET
T E
LE
CT
RIC
CO
MP
AN
Yd/
b/a
NA
TIO
NA
L G
RID
RIP
UC
Doc
ket N
o. 4
770
Wor
kpap
er 9
.3 -
Ele
ctri
c V
ehic
le T
arge
tsP
age
1 of
1E
lect
ric
Veh
icle
s T
arge
t C
alcu
lati
onR
egis
tere
d E
Vs
in C
ompa
ny's
RI
Ter
rito
ry -
- S
umm
ary
of P
olk
Dat
aR
ow L
abel
s20
1020
1120
1220
1320
1420
1520
1620
17 Y
TD
2018
2019
2020
2021
BE
V(P
EV
)32
4111
719
329
3H
EV
(PH
EV
)17
818
241
353
873
3H
V(N
P_H
EV
)86
6990
7010
425
1098
511
613
Gra
nd T
otal
8879
9293
1095
511
716
1263
9
Cum
ulat
ive
EV
Reg
istr
atio
ns w
ith
Pro
ject
ions
Bas
ed o
n A
EO
201
7 E
V S
ales
Gro
wth
for
New
Eng
land
For
ecas
tB
EV
3241
117
193
293
463
706
1,
049
1,53
7
PH
EV
178
182
413
538
733
1,04
1
1,44
8
1,
983
2,68
8
Tot
al E
v21
022
353
073
110
261,
505
2,
153
3,03
2
4,
225
Ann
ual N
ew B
EV
Reg
istr
atio
ns9
7676
100
Ann
ual N
ew P
HE
V R
egis
trat
ions
423
112
519
5A
nnua
l New
EV
Reg
istr
atio
ns T
otal
1330
720
129
547
9
64
8
879
1,
193
Ann
ual N
ew R
egis
trat
ions
BE
Vs
- In
crem
enta
l20
1520
1620
1720
1820
1920
2020
21A
ctua
ls a
nd F
orec
ast
7676
120
17
0
242
344
48
8
PH
EV
s -
Incr
emen
tal
2015
2016
2017
2018
2019
2020
2021
Act
uals
and
For
ecas
t23
112
523
4
308
40
6
53
5
705
New
reg
istr
atio
ns ta
rget
bas
ed a
djus
tmen
t of
fore
cast
(in
clud
es f
orec
ast)
Gro
wth
Ass
um
pti
ons
Bas
ed o
n A
EO
201
720
1920
2020
21(C
AG
R o
f E
V S
ales
, New
En
glan
d,
2017
-202
1)M
in77
8
1,
055
1,43
2
12
0% o
f fo
reca
st p
redi
ctio
nB
EV
0.41
9903
316
Tar
get
908
1,23
0
1,
670
140%
of
fore
cast
pre
dict
ion
PH
EV
0.31
7319
663
Max
1,16
7
1,58
2
2,
148
180%
of
fore
cast
pre
dict
ion
Tot
al0.
3679
0871
3
Incr
emen
tal A
nnua
l New
Reg
istr
atio
ns (
abov
e fo
reca
st)
2019
2020
2021
Min
130
176
23
9
120%
of
fore
cast
pre
dict
ion
Tar
get
259
352
47
7
140%
of
fore
cast
pre
dict
ion
Max
519
703
954
18
0% o
f fo
reca
st p
redi
ctio
n
Act
ual
For
ecas
t (in
clud
es a
nnua
lize
d Y
TD
num
ber
for
2017
)
Act
ual
For
ecas
t (in
clud
es a
nnua
lize
d Y
TD
num
ber
for
2017
)
THE NARRAGANSETT ELECTRIC COMPANY d/b/a NATIONAL GRID RIPUC Docket No. 4770 Workpaper 9.3 - Electric Vehicle Targets Page 1 of 1
85

W
orkpaper 9.4

THE NARRAGANSETT ELECTRIC COMPANY d/b/a NATIONAL GRID RIPUC Docket No. 4770
Witnesses: McGuinness, Roughan
Workpaper 9.4
Incentive Benefits
86
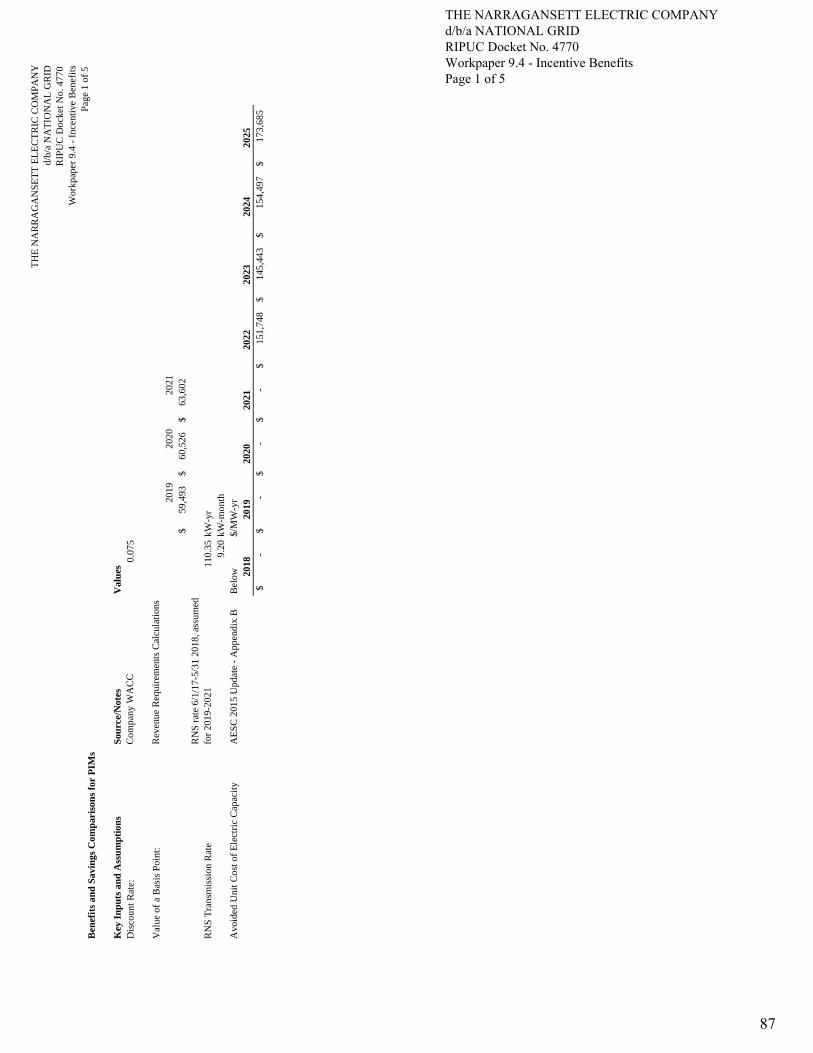
TH
E N
AR
RA
GA
NS
ET
T E
LE
CT
RIC
CO
MP
AN
Yd/
b/a
NA
TIO
NA
L G
RID
RIP
UC
Doc
ket N
o. 4
770
Wor
kpap
er 9
.4 -
Inc
enti
ve B
enef
its
Pag
e 1
of 5
Ben
efit
s an
d S
avin
gs C
omp
aris
ons
for
PIM
s
Key
In
pu
ts a
nd
Ass
um
pti
ons
Sou
rce/
Not
esV
alu
esD
isco
unt R
ate:
Com
pany
WA
CC
0.07
5
Val
ue o
f a
Bas
is P
oint
:R
even
ue R
equi
rem
ents
Cal
cula
tion
s20
1920
2020
2159
,493
$
60
,526
$
63
,602
$
RN
S T
rans
mis
sion
Rat
eR
NS
rat
e 6/
1/17
-5/3
1 20
18, a
ssum
ed
for
2019
-202
111
0.35
kW-y
r9.
20kW
-mon
thA
void
ed U
nit C
ost o
f E
lect
ric
Cap
acit
yA
ES
C 2
015
Upd
ate
- A
ppen
dix
BB
elow
$/M
W-y
r20
1820
1920
2020
2120
2220
2320
2420
25-
$
-
$
-
$
-
$
15
1,74
8$
14
5,44
3$
154,
497
$
17
3,68
5$
THE NARRAGANSETT ELECTRIC COMPANY d/b/a NATIONAL GRID RIPUC Docket No. 4770 Workpaper 9.4 - Incentive Benefits Page 1 of 5
87

TH
E N
AR
RA
GA
NS
ET
T E
LE
CT
RIC
CO
MP
AN
Yd/
b/a
NA
TIO
NA
L G
RID
RIP
UC
Doc
ket N
o. 4
770
Wor
kpap
er 9
.4 -
Inc
enti
ve B
enef
its
Pag
e 2
of 5
FC
M S
avin
gs a
nd
Val
ue
of I
nce
nti
ve C
omp
aris
ion
FC
M P
eak
Tar
kets
(M
W r
educ
ed, y
ear
over
yea
r)T
arge
ts20
1920
2020
21B
asis
Poi
nts
2218
196
2926
2612
3831
3118
FC
M P
eak
Tar
gets
exp
ress
ed a
s M
W r
educ
tion
s re
lati
ve to
Com
pany
for
ecas
t inc
ludi
ng E
E a
nd s
olar
impa
cts
Not
e: th
ese
valu
es w
ere
used
for
cal
cula
ting
FC
M b
enef
its
Tar
gets
2019
2020
2021
713
2513
2746
2242
65
Ann
ual C
apac
ity
Ben
efit
s20
1820
1920
2020
2120
22N
PV
Min
00
00
3,72
4,20
0$
2,59
4,12
4$
Tar
get
00
00
6,91
4,00
5$
4,81
6,01
0$
Max
00
00
9,90
8,10
5$
6,90
1,57
6$
Ann
ual V
alue
of
Ince
ntiv
e at
Tar
get L
evel
s20
1820
1920
2020
2120
22N
PV
Min
035
6,96
1$
363,
159
$
38
1,61
3$
886,
970
$
Tar
get
071
3,92
1$
726,
317
$
76
3,22
7$
1,77
3,94
0$
Max
01,
070,
882
$
1,08
9,47
6$
1,
144,
840
$
2,66
0,91
0$
Pre
sent
Val
ue o
f 20
21 I
ncen
tive
2018
2019
2020
2021
2022
NP
V0
00
381,
613
$
28
5,75
2$
0
00
763,
227
$
57
1,50
5$
0
00
1,14
4,84
0$
85
7,25
7$
THE NARRAGANSETT ELECTRIC COMPANY d/b/a NATIONAL GRID RIPUC Docket No. 4770 Workpaper 9.4 - Incentive Benefits Page 2 of 5
88
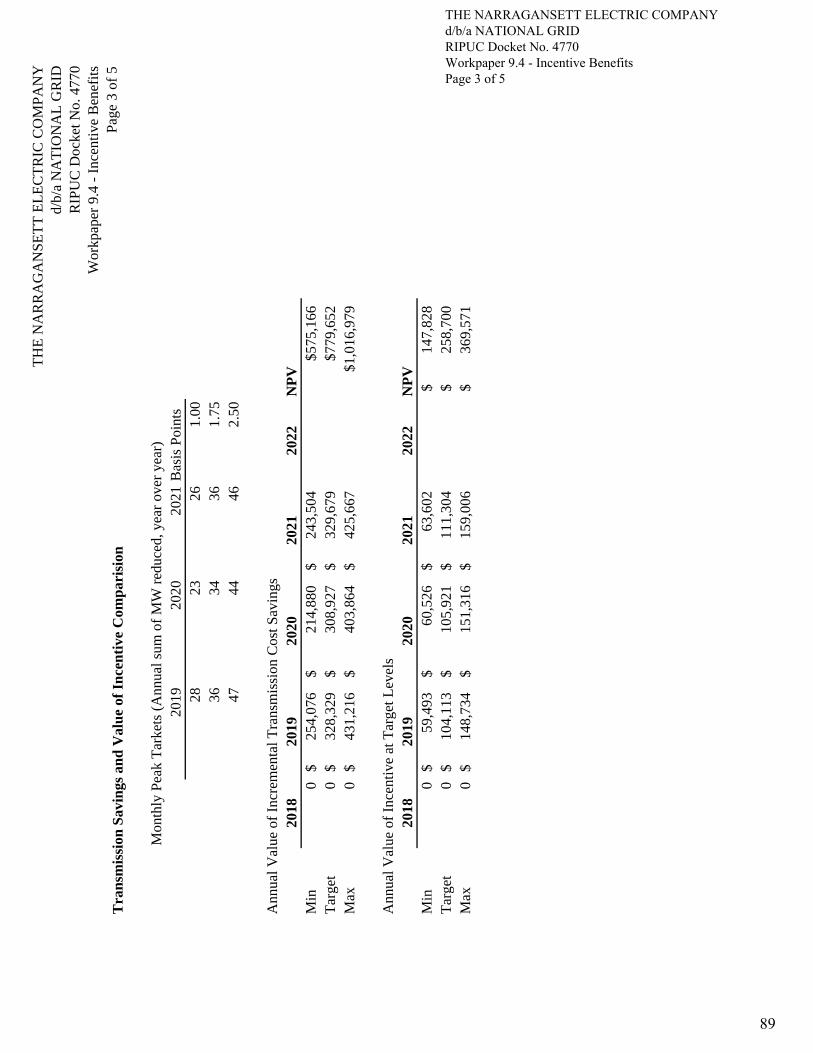
TH
E N
AR
RA
GA
NS
ET
T E
LE
CT
RIC
CO
MP
AN
Yd/
b/a
NA
TIO
NA
L G
RID
RIP
UC
Doc
ket N
o. 4
770
Wor
kpap
er 9
.4 -
Inc
enti
ve B
enef
its
Pag
e 3
of 5
Tra
nsm
issi
on S
avin
gs a
nd
Val
ue
of I
nce
nti
ve C
omp
aris
ion
Mon
thly
Pea
k T
arke
ts (
Ann
ual s
um o
f M
W r
educ
ed, y
ear
over
yea
r)20
1920
2020
21B
asis
Poi
nts
2823
261.
0036
3436
1.75
4744
462.
50
Ann
ual V
alue
of
Incr
emen
tal T
rans
mis
sion
Cos
t Sav
ings
2018
2019
2020
2021
2022
NP
VM
in0
254,
076
$
21
4,88
0$
243,
504
$
$5
75,1
66T
arge
t0
328,
329
$
30
8,92
7$
329,
679
$
$7
79,6
52M
ax0
431,
216
$
40
3,86
4$
425,
667
$
$1
,016
,979
Ann
ual V
alue
of
Ince
ntiv
e at
Tar
get L
evel
s20
1820
1920
2020
2120
22N
PV
Min
059
,493
$
60,5
26$
63,6
02$
14
7,82
8$
T
arge
t0
104,
113
$
10
5,92
1$
111,
304
$
25
8,70
0$
M
ax0
148,
734
$
15
1,31
6$
159,
006
$
36
9,57
1$
THE NARRAGANSETT ELECTRIC COMPANY d/b/a NATIONAL GRID RIPUC Docket No. 4770 Workpaper 9.4 - Incentive Benefits Page 3 of 5
89

TT
HE
NA
RR
AG
AN
SE
TT
EL
EC
TR
IC C
OM
PA
NY
d/b/
a N
AT
ION
AL
GR
IDR
IPU
C D
ocke
t No.
477
0 W
orkp
aper
9.4
- I
ncen
tive
Ben
efit
sP
age
4 of
5
Ele
ctri
c V
ehic
les
Pro
gram
Net
Ben
efit
s an
d V
alu
e of
In
cen
tive
Com
par
isio
n
NP
V o
f ne
t ben
efts
fro
m E
V
conv
ersi
on p
art o
f pr
ogra
m, p
er
BC
A1,
414,
836
$
Max
bas
is p
oint
s of
ince
ntiv
e3.
5
Net
Pre
sent
Val
ue o
f M
axim
um I
ncen
tive
2018
2019
2020
2021
2022
NP
VM
axim
um0
208,
227
$
21
1,84
2$
22
2,60
8$
$517
,399
.26
Ele
ctri
c H
eat I
niti
ativ
e P
rogr
am N
et B
enef
its
and
Val
ue o
f In
cent
ive
Com
pari
son
NP
V o
f pr
ogra
m n
et b
enef
its,
pe
r B
CA
396,
389
$
M
ax b
asis
poi
nts
of in
cent
ive
2
Net
Pre
sent
Val
ue o
f M
axim
um I
ncen
tive
2018
2019
2020
2021
2022
NP
VM
axim
um0
118,
987
$
12
1,05
3$
12
7,20
4$
$295
,657
THE NARRAGANSETT ELECTRIC COMPANY d/b/a NATIONAL GRID RIPUC Docket No. 4770 Workpaper 9.4 - Incentive Benefits Page 4 of 5
90
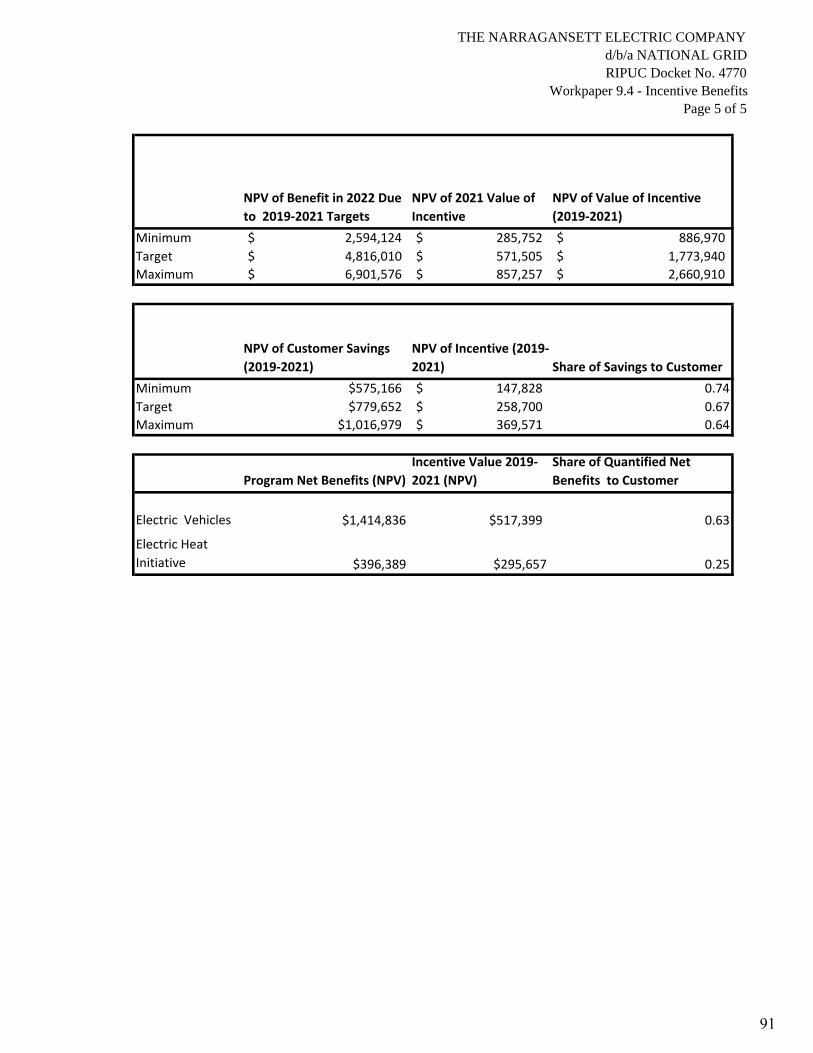
THE NARRAGANSETT ELECTRIC COMPANYd/b/a NATIONAL GRIDRIPUC Docket No. 4770
Workpaper 9.4 - Incentive BenefitsPage 5 of 5
NPV of Benefit in 2022 Due
to 2019‐2021 Targets
NPV of 2021 Value of
Incentive
NPV of Value of Incentive
(2019‐2021)
Minimum 2,594,124$ 285,752$ 886,970$
Target 4,816,010$ 571,505$ 1,773,940$
Maximum 6,901,576$ 857,257$ 2,660,910$
NPV of Customer Savings
(2019‐2021)
NPV of Incentive (2019‐
2021) Share of Savings to Customer
Minimum $575,166 147,828$ 0.74
Target $779,652 258,700$ 0.67
Maximum $1,016,979 369,571$ 0.64
Program Net Benefits (NPV)
Incentive Value 2019‐
2021 (NPV)
Share of Quantified Net
Benefits to Customer
Electric Vehicles $1,414,836 $517,399 0.63
Electric Heat
Initiative $396,389 $295,657 0.25
91