Embed Size (px)
Citation preview

The myth of the “cashless society”: How much of America’s currency is overseas?
Edgar L. Feige
Abstract The rapid growth of substitutes for cash, particularly debit and credit cards, has led economists to predict the advent of the “cashless society”. Yet cash holdings in most developed economies continue to grow and in the U.S., per capita currency holdings now amount to $3000. This paper revisits the long-standing controversy concerning the whereabouts of U.S. cash. Specifically, we employ a previously confidential data source on net shipments of U.S. currency abroad to re-estimate the fraction of U.S. currency held overseas. Contrary to the widely cited figure that 65 percent of U.S. currency is abroad, we now find that direct evidence supports the notion that overseas holdings amount to less than 25 percent. With domestic cash holdings amounting to roughly $2250 per capita, we are far from a “cashless society”.
Currently, the official figure for the percent of U.S. currency held abroad as published by the Federal Reserve in their Flow of Funds Accounts and by the Bureau of Economic Analysis in the U.S. Balance of Payments Accounts is 39 percent. This official figure is based on a proxy variable that is supposed to mimic the previously confidential data series maintained by the New York Federal Reserve. Judson (2012) made this series public enabling us to discover that the official estimates of currency abroad require downward revision to reflect accurately the newly released data on actual cash shipments abroad.
We also review the “indirect” approaches to estimating the fraction of currency overseas employed by Porter and Judson (1996) and Judson (2012). We find these indirect methods to be innovative but deeply flawed due to violations of their restrictive assumptions. Moreover, sensitivity analysis reveals the indirect estimates to be highly sensitive to alternative specifying assumptions. We conclude that the large estimates of currency abroad obtained by these methods are spurious.
The paper also examines the temporal pattern of overseas holdings of U.S. currency and finds that the observed decline in the demand for U.S cash abroad coincides with the growing popularity of the euro and its growth as a second currency held outside the euro area between 2003 and 2008. These new findings have significant implications for estimating the domestic money supply and other domestic monetary aggregates; for estimating the net benefits of seigniorage earnings of the Federal Reserve; for forecasting changes in output and prices and for estimating the amount of unreported income and tax evasion in the U.S.
Professor Emeritus, University of Wisconsin-Madison. Contact: [email protected].

1
The Myth of the “Cashless Society”: How much of America’s currency is really overseas?
Edgar L. Feige11
Introduction: The Currency Enigma
Over the past decades, we have witnessed a host of cash-saving financial
innovations, leading to widespread predictions of the advent of the “cashless society”.
However, contrary to these expectations, the demand for U.S. dollars continues to rise
and we remain awash in cash. As revealed by Figure 1, by the end of 2011, U.S. currency
in circulation with the public2 had risen to $1 trillion dollars, amounting to more than
$3000 for every man, woman and child in the country. Over the last twenty years, real
per capita currency holdings increased by 82 percent and currency as a fraction of the
M1 money supply increased from 30 percent to 45 percent.
1 Professor Emeritus, Department of Economics, University of Wisconsin-Madison. Contact [email protected]. The author gratefully acknowledges Roberto Coronado, Ruth Judson and Michael Mann for generously providing data employed in the study. This paper is an updated version of Feige (2012) employing newly acquired (previously confidential) data on recorded net shipments of U.S. currency overseas, released in graphic form in Hellerstein and Ryan (2011) and in Judson (2012). 2 The currency data used in the paper is the currency component of the M1 money supply defined as currency outside U.S. Treasury, Federal Reserve Banks and the vaults of depository institutions. (Not seasonally adjusted). (http://www.federalreserve.gov/releases/h6/hist/h6hist4.pdf) . The “currency outside banks” series from the Flow of Funds Accounts of the United States Z.1 (Table L 204, line 6) (not seasonally adjusted) is typically somewhat larger than the currency component series. .
0
500
1000
1500
0,0
200,0
400,0
600,0
800,0
1000,0
1200,0
1964
1966
1968
1970
1972
1974
1976
1978
1980
1982
1984
1986
1988
1990
1992
1994
1996
1998
2000
2002
2004
2006
2008
2010
Dollars (Billions)
Figure 1Currency and Real Per Capita Currency
Currency in Circulation (Left scale) Real Per capita Currency (Right scale)

2
To put these figures in perspective, they imply that the average American’s
bulging wallet holds roughly 91 pieces of U.S. paper currency, consisting of: 31 one
dollar bills; 7 fives; 5 tens; 21 twenties; 4 fifties and 23 one hundred dollar bills. Few of
us will recognize ourselves as “average” citizens. Clearly, these amounts of currency are
not normally necessary for those of us simply wishing to make payments when neither
credit/debit cards nor checks are accepted or convenient to use. Yet as shown in Figure 2,
these surprisingly high U.S. per capita currency values were exceeded by per capita
currency values for Europe ($3274); Hong Kong ($3963), Switzerland ($6335) and Japan
($7562).
Source: Bank for International Settlements. 2010 Data.
Federal Reserve surveys (Avery et al. 1986, 1987) of household currency usage
found that U.S. residents admitted to holding less than 10 percent of the nation’s currency
supply. Businesses (Anderson, 1977; Sumner, 1990) admitted to holding only 5 percent.
An even greater puzzle emerges from the Japanese Survey of Household Finances. In
2007, Japanese households admitted to holding only 10 percent of the nation’s cash in
circulation. 3 Yet Japan’s per capita currency holdings are two and a half times larger than
those in the U.S. These surveys suggest that the whereabouts of 85 -90 percent of some
3 Fujiki and Tanaka (2009)
0
2000
4000
6000
8000
1162 1372 1517 1685 21762981 3274
3963
63357562
Dollars per cap
ita
Figure 2
Per Capita Currency in Circulation with the Public

3
nation’s currency supplies are unknown, suggesting that the “currency enigma” (Feige
1989, 1994) is still very much with us.
A growing body of evidence suggests that portions of some national currencies
are held outside of the issuing country. Leung et. al. (2010) estimates that 50-70 percent
of Hong Kong dollars circulate outside of Hong Kong and the European Central Bank
(2011) estimates that 20-25 percent of euro banknotes circulate outside the euro area. The
amount of Swiss currency in circulation outside of Switzerland is unknown and very few
Japanese Yen circulate outside of Japan. The whereabouts of the U.S. currency supply is
the key issue this paper seeks to address.
2) The controversy over the location of U.S. currency.
Research in the early nineties witnessed a number of studies attempting to
estimate the fraction of U.S. currency held abroad, resulting in an empirical controversy
that persists to this day. Examining direct data sources 4 on net outflows of U.S. currency
(Feige, 1994), and indirect methods, (variants of monetary demography models) Feige
(1996) concluded, “that roughly 36 percent of U.S. currency is held abroad”. Examining
the veracity of alternative methods of estimating overseas currency holdings, Feige
(1997) suggested that the most plausible range of estimates was between 25-45 percent.
Doyle (2000) subsequently estimated that in 1995, 30 percent of U.S. currency was
abroad.
Porter and Judson (1996) obtained very different results. Their main finding,
based on an innovative, albeit fragile, indirect “seasonal” method was that 70 percent of
the nation’s currency was abroad. Taking account of alternative estimation methods,
Porter and Judson reported a “median flow estimate” for 1995 of 55 percent abroad,
similar to the estimate produced by Anderson and Rasche (1997) of 53.2 percent. Porter
and Judson concluded, “that between 55 percent and 70 percent of the U.S. currency
stock” was “held outside the country”.5
Most recently, Feige (2012) revisited the question of how much of America’s
currency was held abroad, and brought to light the fact that the Federal Reserve publishes
4 These included both Currency and Monetary Instrument Reports (CMIR) and the Federal Reserve Bank of New York’s (FSN) confidential wholesale currency bulk transport data. 5Porter and Judson (1996), p. 899.
4
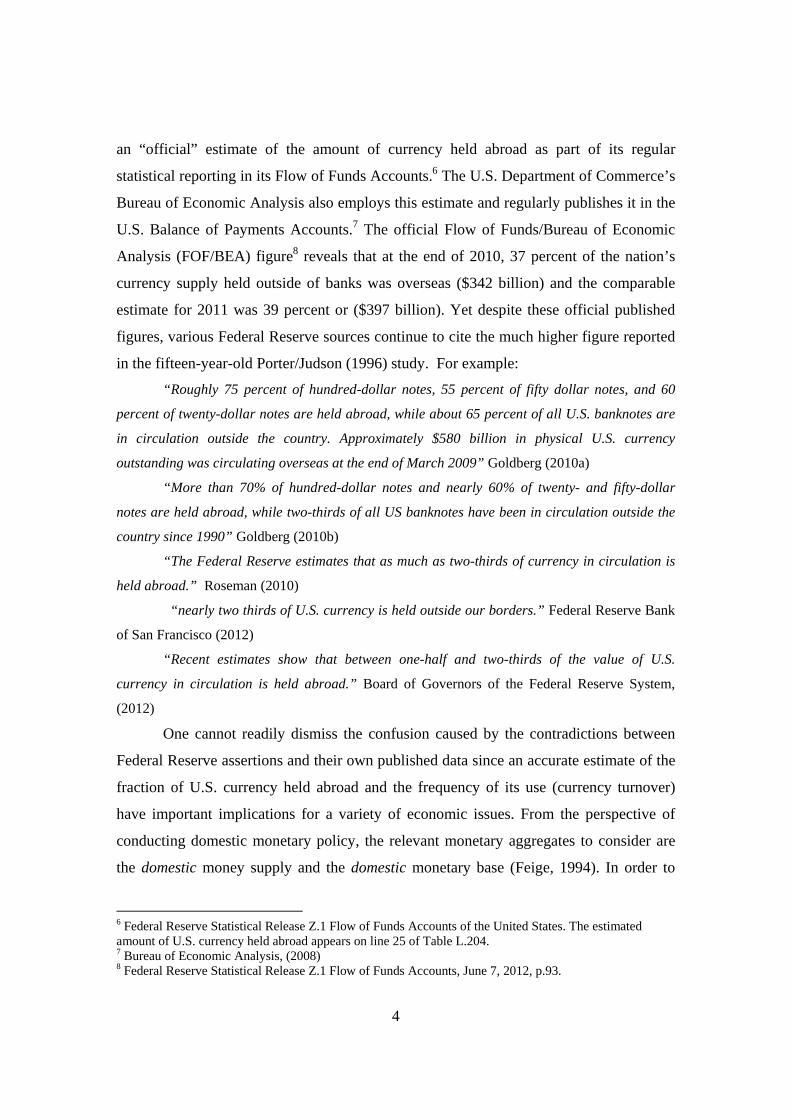
an “official” estimate of the amount of currency held abroad as part of its regular
statistical reporting in its Flow of Funds Accounts.6 The U.S. Department of Commerce’s
Bureau of Economic Analysis also employs this estimate and regularly publishes it in the
U.S. Balance of Payments Accounts.7 The official Flow of Funds/Bureau of Economic
Analysis (FOF/BEA) figure8 reveals that at the end of 2010, 37 percent of the nation’s
currency supply held outside of banks was overseas ($342 billion) and the comparable
estimate for 2011 was 39 percent or ($397 billion). Yet despite these official published
figures, various Federal Reserve sources continue to cite the much higher figure reported
in the fifteen-year-old Porter/Judson (1996) study. For example:
“Roughly 75 percent of hundred-dollar notes, 55 percent of fifty dollar notes, and 60
percent of twenty-dollar notes are held abroad, while about 65 percent of all U.S. banknotes are
in circulation outside the country. Approximately $580 billion in physical U.S. currency
outstanding was circulating overseas at the end of March 2009” Goldberg (2010a)
“More than 70% of hundred-dollar notes and nearly 60% of twenty- and fifty-dollar
notes are held abroad, while two-thirds of all US banknotes have been in circulation outside the
country since 1990” Goldberg (2010b)
“The Federal Reserve estimates that as much as two-thirds of currency in circulation is
held abroad.” Roseman (2010)
“nearly two thirds of U.S. currency is held outside our borders.” Federal Reserve Bank
of San Francisco (2012)
“Recent estimates show that between one-half and two-thirds of the value of U.S.
currency in circulation is held abroad.” Board of Governors of the Federal Reserve System,
(2012)
One cannot readily dismiss the confusion caused by the contradictions between
Federal Reserve assertions and their own published data since an accurate estimate of the
fraction of U.S. currency held abroad and the frequency of its use (currency turnover)
have important implications for a variety of economic issues. From the perspective of
conducting domestic monetary policy, the relevant monetary aggregates to consider are
the domestic money supply and the domestic monetary base (Feige, 1994). In order to
6 Federal Reserve Statistical Release Z.1 Flow of Funds Accounts of the United States. The estimated amount of U.S. currency held abroad appears on line 25 of Table L.204. 7 Bureau of Economic Analysis, (2008) 8 Federal Reserve Statistical Release Z.1 Flow of Funds Accounts, June 7, 2012, p.93.
5
determine the domestic monetary aggregates, the Federal Reserve needs to have an
accurate estimate of the fraction of U.S. currency held abroad and an estimate of the
annual net outflow of U.S. currency going abroad. This knowledge is also required for
operational decisions regarding the production, provision and maintenance of the U.S.
currency supply. Similarly, foreign monetary authorities need to know the extent to
which their nations are “de facto dollarized” (Feige et. al., 2003), and the magnitude of
net inflows of foreign currencies into their economies. De facto dollarization reduces the
effectiveness of exchange rate stabilization policies and reduces seigniorage revenues.
The volatility of foreign demand for U.S. currency increases the difficulty of formulating
appropriate domestic monetary policy.
Accurate estimates of the amount of U.S. currency circulating abroad are also
essential for calculating the net seigniorage benefit to U.S. taxpayers obtained by virtue
of the fact that the U.S. government effectively obtains an interest free loan from
foreigners holding U.S. dollars. According to the 2010 annual report of the Board of
Governors, the Federal Reserve obtained $667 billion dollars in total seigniorage income
between 1990 and 2010. Domestic seigniorage earnings (based on the fraction of U.S.
currency held at home) simply represent a redistribution of income from U.S. currency
holders to U.S. taxpayers. On the other hand, seigniorage earnings on currency held
abroad represent a net transfer of real resources from foreign currency holders to U.S.
taxpayers. Based on official (FOF/BEA) estimates of overseas holdings, American
taxpayers experienced a cumulative seigniorage windfall of $244 billion since 1990 from
the overseas holdings of U.S. currency. However, based on the foregoing assertions of
Federal Reserve officials who claim that two thirds of the U.S. currency supply was
abroad during this period, we would conclude that U.S. taxpayers had obtained a
cumulative seigniorage benefit of $434 billion since 1990. Discrepancies of this
magnitude suggest that resolution of this empirical conflict requires serious attention.
Feige (2012) demonstrates that accurate estimates of the fraction of U.S. currency
held abroad also have important implications for assessing counterfeiting dangers; for our
ability to forecast changes in prices and output; and for estimating the magnitude of the
unreported economy and tax evasion. The widespread use of U.S. currency abroad
increases the likelihood of counterfeiting, since foreign users are less familiar with the

6
dollar than domestic users, making the passing of counterfeit notes abroad easier than at
home. The whereabouts of America’s cash also has fiscal consequences. U.S. currency is
a preferred medium of exchange for facilitating clandestine transactions, and for storing
illicit and untaxed wealth. Knowledge of its location and usage is required to estimate the
origins and volume of illicit transactions. These include the illegal trade in drugs, arms
and human trafficking as well as the amount of “unreported” income, that is, income not
properly reported to the fiscal authorities due to noncompliance with the tax code. The
fiscal revenue lost to the government creates a “tax gap” that measures the extent to
which taxpayers do not pay the amount they legally owe to the Federal Government in a
timely manner. The problem of tax evasion is even more salient in times of severe fiscal
deficits. Improved tax compliance reduces fiscal deficits.
In short, our understanding of a number of key monetary and fiscal issues depends
upon answers to two key empirical questions: 1) What fraction of the U.S. currency
supply is held abroad and 2) how has the amount of U.S. currency held abroad changed
over time? Earlier answers to these questions have relied on two distinct approaches:
direct measures of inflows and outflows of U.S. currency and indirect methods
employing various versions of monetary demography models. 9 We first update earlier
direct estimates of currency abroad with newly acquired direct source data on net bulk
currency shipments overseas. This data has been reported to the New York Federal
Reserve Bank by wholesale currency shippers since 1988 but was regarded as
confidential until Judson (2012) recently released it. To anticipate our results, these
newly released aggregate data suggest that only 25 percent of U.S. currency is abroad.
Further investigation of informal channels of currency flows abroad due to travel and
immigrant remittances reinforces this conclusion.
We then reexamine the indirect approaches that were responsible for the initial
Porter/Judson (1996) claim that between 55 and 70 percent of U/S. currency was held
abroad. We find that some key assumptions of their monetary demography models are
grossly violated by available information and that the results of the “seasonal” model are
so sensitive to specifying assumptions as to raise serious doubts concerning their
reliability.
9 Feige (1996; 1997; 2012) presents detailed information concerning each of these approaches.

7
3) Direct Measures of Net Currency Outflows Abroad
A) Net bulk shipments of U.S. currency abroad
The most direct method for estimating the fraction of currency held abroad relies
upon data systems designed to track currency outflows and inflows to and from abroad.
Two such information systems are the U.S. Customs Service Currency and Monetary
Instrument Reports (CMIR)10 and the New York Federal Reserve Bank’s (FSN) records
of net international wholesale currency shipments abroad.11 The CMIR data are no longer
readily available and their accuracy has been diminished since the mid 1990’s because of
the establishment of Federal Reserve Extended Custodial Inventory (ECI) sites abroad.12
As such, The New York Federal Reserve Bank’s data on net bulk shipments of U.S.
currency abroad (FSN) are the best measure of net currency flows abroad.
Specialist wholesale bulk banknote dealers handle most of the U.S. currency that
flows into or out of the country and they report the amount, origin and destination of their
currency shipments to the New York Federal Reserve. These bulk shippers satisfy the
overseas demand for U.S. currency by overseas commercial banks that in turn make the
U.S. currency available to exchange bureaus, firms and individuals abroad. Similarly,
when overseas banks find themselves with excess U.S. currency, they return the
banknotes to the U.S via wholesale banknote shippers who report the transactions to the
New York Federal Reserve Bank. Unfortunately, the New York Federal Reserve Bank
has historically regarded this critical data set as confidential. As a result, the official
Federal Reserve Flow of Funds estimates of U.S. currency flows abroad 13 are based on a
proxy variable (NYLAM) designed to mimic the confidential series (FSN) of net bulk
shipments of U.S. currency. A recent paper by Judson (2012) presented at this
conference, finally disclosed these previously confidential aggregate annual net currency
shipments (FSN).
10 Currently known as the Report of International Transportation of Currency or Monetary Instruments (FinCEN Form 105). 11 Both of these data systems are described, compared and evaluated in Feige (1996, 1997, 2012). 12 See Feige (2012) and Judson (2012) for an elaboration of the present deficiencies of the CMIR data. 13 Federal Reserve Flow of Funds Accounts, Z.1 Table F -204

8
Figure 3 reveals that although the official Federal Reserve (NYLAM) proxy is
highly correlated (.87) with the actual recorded bulk shipment (FSN) data it attempts to
mimic, between 1997 and 2010 the (NYLAM) proxy consistently overestimated actual
net currency outflows.
Figure 4 shows that by 2011, the NYLAM proxy (which the Federal Reserve
employed as its “official” published figure) estimated the cumulative amount of U.S.
‐30,0
‐20,0
‐10,0
0,0
10,0
20,0
30,0
40,0
50,0
60,0
70,0
1988 1990 1992 1994 1996 1998 2000 2002 2004 2006 2008 2010Dollars (Billions)
Figure 3Actual recorded net bulk currency outflows (FSN) and the Federal
Reserve (NYLAM) proxy
FSN (Actual Recorded) NYLAM (Proxy)
0,0
50,0
100,0
150,0
200,0
250,0
300,0
350,0
400,0
450,0
Dollars (Billions)
Figure 4Estimated Cumulative Amount of U.S. Currency Held Abroad
FSN (Actual Recorded) NYLAM (Proxy)

9
currency overseas to be $397 billion, whereas the cumulative amount overseas estimated
by the actual net bulk shipment series (FSN) amounted to only $252 billion. Moreover,
the temporal pattern suggested by the two series is quite distinct. According to the actual
reported FSN data, overseas demand for U.S. currency declined substantially between
2003 and 2007 by roughly $50 billion and rose again in the aftermath of the financial
crisis of 2008. This pattern is entirely consistent with the findings of the European
Central Bank (2011) and Augustin (2011), which suggest that the demand for euros
outside the euro area increased substantially during the period that the demand for dollars
fell. In short, the decline in overseas demand for dollars is entirely consistent with the
hypothesis that the euro substituted for the dollar as a second currency in countries on the
periphery of the euro area. Conversely, shipments of euros to regions outside the euro
area ceased to grow after 2008 while the demand for U.S. currency abroad resumed its
upward trend, suggesting that U.S. currency replaced euros in periphery countries
because of the growing debt crisis in Europe.
Figure 5 displays the alternative estimated shares of U.S. currency held abroad.
According to the “official” FOF/BEA published NYLAM proxy based figures, the share
of U.S. currency held abroad remained within the narrow range of 35-40 percent between
1994 and 2011. The newly released bulk shipment data (FSN) suggest that the share of
currency held abroad peaked at 42 percent in 1997 and then fell dramatically to a low of
0
10
20
30
40
50
Percent
Figure 5Estimated share of U.S. currency held abroad
FSN (Actual Recorded) NYLAM Proxy

10
19 percent in 2007, recently increasing to a share of 25 percent by the end of 2011. The
dramatic rise in U.S. cash shipments to the former USSR and Argentina between 1989
and 1997 and the equally dramatic fall in such shipments between 1997 and 2008
explains this pattern.14
To summarize, the newly released New York Federal Reserve data on recorded
net bulk shipments of U.S. currency abroad indicate that the “official” FOF/BEA
estimates of overseas currency based on the NYLAM proxy have overestimated the
amount of U.S. currency abroad since 1998. By 2011, it appears that $150 billion of U.S.
cash previously believed to be abroad was in fact in circulation domestically. Moreover,
the current share of U.S currency held abroad is closer to 25 percent than the officially
published estimate of 40 percent. The recorded decline in the demand for U.S. currency
abroad between 2002 and 2007 appears to be the result of euro substitution for the dollar
in countries outside the euro area.
B) Informal net flows of currency abroad due to travel and immigrant remittances
The foregoing estimates of U.S. held abroad based on net bulk wholesale
shipments are incomplete insofar as they do not reflect currency hand carried or mailed in
to or out of the country by travelers or guest workers in the form of immigrant
remittances. They may also exclude some currency shipments into or out of the country
by non-reporting shipping entities and may include errors due to some deliberate
falsification of reports by bulk shippers. 15 However, we have no a priori way of knowing
whether such omissions lead to an over or under estimate of the amount of currency held
abroad.
Judson (2012) makes the highly implausible claim that informal or “retail”
channels of net U.S. currency outflows could exceed recorded wholesale net shipments
(FSN) by more than $300 billion.16 If her “admittedly crude”17 approach is taken
seriously, it implies that 52-53 percent of U.S. currency is presently held abroad, more
14 See Judson (2012) Figure 8. 15 In 2003, the Federal Reserve terminated its Extended Custodial Inventory (ECI) agreement with UBS and in 2004 followed with a $100 million civil penalty after discovering that UBS had falsified its reports of overseas shipments to the Federal Reserve over an eight year period. (Pasley, 2005) 16 Judson (2012) Figure 11A. 17 Judson, (2012) p. 16.

11
than double the estimate based on the FSN data. Rather than attempt to directly estimate
the impact of travel and immigrant remittances on the amount of U.S. cash held overseas,
Judson arbitrarily selects a group of countries “known to have significant tourism or
significant populations of immigrants or migrant workers in the United States” and “ a
group of countries whose total net shipments is substantial and negative”.18 Without
identifying the countries she has thus selected, nor indicating the amounts of net
shipments of cash to or from those countries, she simply assumes that the currency
flowing back into the U.S. from each of these unspecified countries was zero. This is
tantamount to throwing out over $300 billion dollars of net currency inflows reported to
the Federal Reserve Bank of New York by bonded professional wholesale currency
shippers. This “very rough adjustment” 19 is both arbitrary and implausible. Similarly,
Judson’s use of the “adjusted shipment proxy series” lacks credibility since the Federal
Reserve and the Bureau of Economic Analysis20 abandoned it fifteen years ago precisely
because it took no account of reflows of currency known to be received by the Miami
cash office from Latin America and from the Los Angles cash office from Asia.
Judson’s general observation that “retail” or informal channels of currency flows
may affect our estimates of the amount of U.S. currency held abroad is indisputable, as is
her suggestion that the primary informal currency flows are likely to arise due to
immigrant remittances and travel. The challenge is therefore to estimate the net size of
these flows from the available evidence.
We obtain estimates of immigrant remittances from the U.S. Balance of
Payments records of “private remittances and other transfers”,21 the relevant component
of which are remittances representing “personal transfers by foreign born population”. In
order to estimate the fraction of these transfers made in cash, we rely on survey
information provided by the Banco de Mexico of remittances by type of transfer
payment.22
18 Judson (2012) p. 15. 19 Judson (2012) p.15. 20 Bach (1997) 21 U.S. International Transactions Accounts: June 13, 2012 Table 1 Line 38. 22 I am indebted to Roberto Coronado of the San Francisco Federal Reserve for providing the data and necessary translations of the Banco de Mexico survey.

12
Source: Banco de Mexico
Figure 6 reveals that the vast majority of immigrant remittances are transferred by
electronic means, which presently amount to 98 percent of all transfers. Cash payments,
which in 1996 accounted for roughly 10 percent of all remittance transfers now account
for just 1 percent. We obtain our annual estimate of total cash outflows of U.S. currency
due to immigrant remittances by multiplying the personal transfers of foreign born by the
fraction of remittances transferred in cash. We find that cumulative cash remittances
made since 1988 amount to roughly 11 percent of cumulative wholesale shipments as
recorded in the FSN data.
The U.S Balance of Payment Accounts also records travel and tourism
expenditures of inbound (exports) and outbound (imports) travelers. 23 Moreover, the
Commerce Department’s Office of Travel and Tourism conducts annual surveys of
overseas travelers to the U.S. and of U.S. resident travelers visiting overseas destinations.
These inbound and outbound survey profiles include estimates of the fraction of total
travel expenditures made in cash by incoming and outgoing travelers. We are therefore
able to estimate the volume of cash expenditures made by inbound and outbound
travelers. A sizable and growing portion of these cash expenditures are made with
currency obtained from ATM machines or exchange bureaus in the destination country.
23 The data source is U.S. Department of Commerce, (2012)
0%
20%
40%
60%
80%
100%
1996 1997 1998 1999 2000 2001 2002 2003 2004 2005 2006 2007 2008 2009 2010 2011
Percent
Figure 6Remittances by type of payment
Electronic transfer Money Orders Cash and in kind Personal checks

13
Assuming that foreign travelers to the U.S. bring U.S. currency into the country for
twenty percent of their cash expenditures and American travelers going abroad make
twenty percent of their cash expenditures with dollars taken out of the U.S. and, we can
estimate the magnitude of informal “retail” inflows and outflows of U.S. currency due to
travel. We find that the net effect of travelers transferring cash is to reduce the estimate of
currency abroad since inbound travelers bring more cash into the country than outbound
travelers take out.24
Figure 7 summarizes our estimates of the amounts of U.S. currency held abroad
taking account of both net wholesale shipments as reported to the New York Federal
Reserve (FSN) and estimates of “retail” or informal channels of cash transfers arising
from immigrant remittances and travel. By 2011, these direct measurements suggest that
U.S. currency abroad amounts to roughly $230 billion, or 23 percent of the outstanding
currency supply held by the public. The most significant conclusion resulting from our
24 It should be noted that if we alternatively assume that inbound travelers pay 20 percent of their cash expenditures with U.S. currency obtained abroad and that U.S. travelers going overseas pay for 15 percent of their cash expenditures with dollars taken abroad, this reduces our estimate of overseas currency by an additional $20 billion.
0
50
100
150
200
250
300
Dollars (Billions)
Figure 7Estimated U.S. currency overseas: Wholesale and retail channels
FSN FSN+Remittaces and Travel(20/20)

14
review of direct measures of overseas currency is that far less currency appears to be
circulating overseas than was previously thought to be the case.
Figure 8 compares the share of U.S. currency held abroad as measured by direct
estimates of wholesale and retail cash flows to the “official” published FOF/BEA
estimates that relied on the NYLAM proxy. It appears that from 1987-1998, the NYLAM
proxy underestimated the share of currency abroad, whereas in the most recent decade,
the proxy appears to have overestimated the share of currency abroad. The direct
measurement approach reveals that the share abroad rose abruptly from 23 percent in
1987 to a high of 43 percent in 1997 and then subsequently declined reaching a low point
of 18 percent at the end of 2007. Note that both series suggest that the amount of
currency held abroad was significantly less than the oft-cited claim that between 55 to 70
percent of U.S. currency was abroad. We now turn to an investigation of the indirect
methods of estimating overseas currency that are the basis of this latter claim.
4) Indirect Measures of Currency Abroad
A) The simple monetary demography model.
A simple indirect means of estimating currency abroad employs some variant of
the monetary demography model25. The monetary demography model (MDM) basically
25 Feige (1996,1997)
0,0
10,0
20,0
30,0
40,0
50,0
Percent
Figure 8Direct and proxy estimates of share of currency abroad
FSN+Travel+Remittances "Official" FOF/BEA (NYLAM Proxy)

15
assumes that any observed characteristic of the U.S. currency supply (X) can be
decomposed into an unobserved domestic component (Xd) and an unobserved foreign
component (Xf ) such that X= Xd + Xf . Now assume that there exists a country very
similar to the U.S. (say Canada) except that it must neither import foreign currency nor
export its own currency to other countries. Since its own currency (Y) is assumed to have
no foreign characteristic, Y might then be assumed to behave like the domestic
component of the U.S. currency supply such that, Y≈ Xd .
Then, if X = Y + Xf , one can obtain an estimate of the unobserved fraction of X
made up by its foreign component since, Xf/X = 1- Y/X. Often some observable
Canadian characteristic related to Canadian currency is taken to represent the comparable
unobserved domestic characteristic of the U.S currency supply. For example, we can
consider the currency/GDP ratio (Judson, 2012), currency per capita, or the ratio of
currency to wages and salaries (WS) as possible characteristics.26
Figure 9 presents the results of some simple variants of the MDM model.27 First,
we note that the temporal path is highly sensitive to the particular characteristic chosen;
hence, the estimates are not robust to simple changes in the model specification. The
26 Feige (1996, 1997), Porter, and Judson (1996) also employ age, note quality, coin/note ratios and seasonal characteristics. 27 Judson (2012) p.11-12 obtains similar results.
0,0
10,0
20,0
30,0
40,0
50,0
Percent
Figure 9Simple indirect MDM estimates of the share of U.S. currency abroad
Cur/GDP Cur/POP Cur/WS
16
results also suggest that 46 percent of U.S. currency is currently overseas, roughly double
the figure obtained by the direct estimation procedure.
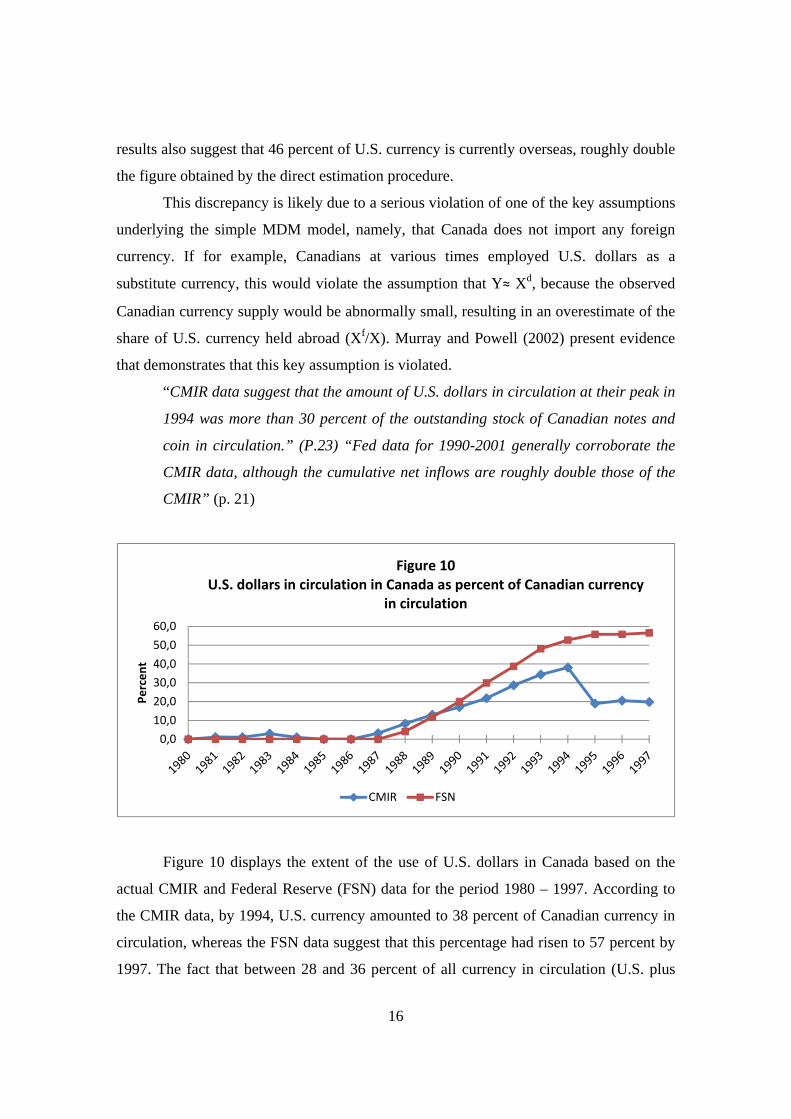
This discrepancy is likely due to a serious violation of one of the key assumptions
underlying the simple MDM model, namely, that Canada does not import any foreign
currency. If for example, Canadians at various times employed U.S. dollars as a
substitute currency, this would violate the assumption that Y≈ Xd, because the observed
Canadian currency supply would be abnormally small, resulting in an overestimate of the
share of U.S. currency held abroad (Xf/X). Murray and Powell (2002) present evidence
that demonstrates that this key assumption is violated.
“CMIR data suggest that the amount of U.S. dollars in circulation at their peak in
1994 was more than 30 percent of the outstanding stock of Canadian notes and
coin in circulation.” (P.23) “Fed data for 1990-2001 generally corroborate the
CMIR data, although the cumulative net inflows are roughly double those of the
CMIR” (p. 21)
Figure 10 displays the extent of the use of U.S. dollars in Canada based on the
actual CMIR and Federal Reserve (FSN) data for the period 1980 – 1997. According to
the CMIR data, by 1994, U.S. currency amounted to 38 percent of Canadian currency in
circulation, whereas the FSN data suggest that this percentage had risen to 57 percent by
1997. The fact that between 28 and 36 percent of all currency in circulation (U.S. plus
0,0
10,0
20,0
30,0
40,0
50,0
60,0
Percent
Figure 10U.S. dollars in circulation in Canada as percent of Canadian currency
in circulation
CMIR FSN

17
Canadian) was in the form of U.S. dollars implies a gross violation of the key
assumptions of the MDM models and hence makes the results presented in Figure 9 and
the similar ones presented by Judson (2012) highly suspect. Since neither the CMIR data
nor the FSN data are available on a country basis for the period of the past decade, it is
impossible to tell whether the demand for U.S. currency increased or decreased during
this period.
B) The “seasonal” variant of the monetary demography model.
At the outset, it is important to note that the repeated assertions that as much as
two thirds of the U.S. currency supply circulates abroad is almost entirely based on the
results reported by Porter and Judson (1996) derived from the “seasonal” variant of the
monetary demography model. The seasonal variant of the monetary demography model
requires a set of highly restrictive assumptions. Porter and Judson (1996) and Judson
(2012) assume that:
1) “the seasonal amplitude, or the percentage difference between the seasonal peak and
trough of the domestic demand for U.S. currency is virtually identical to the demand
within Canada for Canadian dollars”;
2) “that the foreign demand for U.S. dollars has no significant seasonal pattern, or
correspondingly, that the seasonal amplitude for the foreign component of demand for
U.S. dollars is zero”;
3) “that the circulation of Canadian dollars outside of Canada is negligible.”
4) “that U.S. currency is not used to a substantial degree inside Canada.”
As demonstrated in section 3A above, the fourth assumption is grossly violated,
thereby invalidating empirical results based on it. Furthermore, as demonstrated by Feige
(1997, p 91) the estimation procedure is highly arbitrary, and the results can fluctuate
substantially depending upon which seasonal metric is employed.
Figure 11 illustrates the sensitivity of the seasonal results to alternative
specifications concerning which seasonal characteristic the researcher chooses to employ.
The first estimate labeled (Porter/Judson (1996) [Dec-Feb] is simply an updating of the
seasonal model originally proposed and estimated by Porter/Judson (1996) employing the

18
difference between the December and February seasonal. 28 This seasonal model suggests
that in 2011, $790 billion of U.S. currency was abroad, 79 percent of the total U.S.
currency in circulation.
Judson (2012) finds that the seasonal trough has shifted from February to
September but changes the model’s specification to the difference between the December
and January seasonal. The results are charted in Figure 11 (labeled Judson (2012) [Dec-
Jan]. This alternative specification reduces the estimated amount of U.S. currency abroad
by $170 billion, and lowers the share abroad to 64 percent. However, had Judson
employed the same criterion for choosing the seasonal characteristic as used in the 1996
paper, namely the difference between the seasonal peak and the seasonal trough, she
would have calculated the model employing the difference between the December peak
and the new September trough. Figure 11 also displays these results (labeled Seasonal
[Dec–Sept]). Not only does this seemingly minor modification drastically change the
entire estimated temporal pattern of the estimates, it lowers the estimated amount of U.S.
currency abroad to $368 billion, or to 37 percent of the U.S. currency supply.
28 Porter and Judson (1996) claim that the “best estimate of the model is obtained by measuring the seasonal variation around Christmas, specifically from the seasonal high that is reached in currency in December to the seasonal low in February.”
0
100
200
300
400
500
600
700
800
Dollars (Billion)
Figure 11Alternative seasonal model estimates of U.S. currency abroad
Porter/Judson (1996) [Dec‐Feb] Judson(2012) [Dec‐Jan] Seasonal [Dec‐Sept]

19
The sensitivity of the share results to minor alternative specifications of the seasonal
model are displayed in Figure 12. Given the radical changes in both the temporal pattern
and the magnitude of the estimated shares resulting from these alternative specifications
of the model, we conclude that this indirect approach is unfit for estimating the share of
U.S. currency abroad. This conclusion is bolstered by the empirical finding that one of
the key assumptions of the model is violated, namely, that U.S. currency is not used
inside Canada.
5) Summary and Conclusions
Even a cursory examination of the growth and magnitude of the U.S. currency
supply in circulation with the public reveals that predictions of the advent of the “cashless
society” are unfounded. Despite financial innovations giving rise to convenient
substitutes for cash, per capita cash holdings continue to increase and by the end of 2011,
amounted to $3000 for every man woman and child residing in the U.S. While this figure
does not comport with our common sense notion of how many dollars the average person
holds in her wallet, we show that Europeans and Japanese citizens hold even larger
amounts of cash. Two explanations are offered for these large cash holdings. The first
posits that a large fraction of U.S. currency is held abroad, the second that large amounts
of cash are employed to undertake transactions that individuals and firms prefer to hide
from the government either to avoid taxes, regulations or punishment for illegal activities.
1020304050607080
Percent ab
road
Figure 12Estimated share of U.S. currency abroad: Seasonal model sensitivity
analysis
Porter/Judson (1996) [Dec‐Feb] Judson(2012) [Dec‐Jan] Seasonal [Dec‐Sept]

20
Cash, being an anonomous medium of exchange leaving no paper trail, is the logical
choice for undertaking such transactions.
Feige(2012) employed the official estimates29 (FOF/BEA) of the amount of U.S.
currency believed to be overseas, to derive estimates of U.S. seiniorage earnings, the
domestic money supply, and estimates of the unreported economy and the “tax gap”. This
official FOF/BEA estimate of the share of U.S. currency abroad is based on a proxy
measure (NYLAM) that was designed to mimic a confidential data series controlled by
the New York Federal Reserve (FSN) that tracks bulk shipments of U.S. currency by
wholesale currency dealers into and out of the U.S. This confidential aggregate shipment
data was recently published in a paper by Judson (2012), enabling researchers to
reexamine the veracity of the official FOF/BEA (NYLAM) proxy estimates of the
amount of U.S. currency held abroad.
As displayed in Figure 13, the NYLAM proxy appears to track the formerly
confidential FSN series reasonalby closely between 1988 and 2001, after which time the
proxy begins to substantially overstate the series it is supposed to mimic. By 2011, the
official FOF/BEA (NYLAM) estimate of overseas currency is roughly $150 billion larger
than the amount reported to the New York Federal Reserve (FSN) by wholesale bulk
29 As published by the Federal Reserve in its Flow of Funds Accounts and by the Bureau of Economic Analysis in the U.S. Balance of Payment Accounts.
0
200
400
600
800
Dollars (Billions)
Figure 13 Alternative estimates of currency abroad
FSN (Actual Recorded) FSN+Remittances + Travel
NYLAM (Proxy) Average MDM
Porter Judson(1996) Judson (2012)
21
shippers of currency. Judson (2012) suggests that the the FSN series may be an
understatement of the amount of U.S. currency abroad because it omits net currency
shipments abroad through informal channels such as immigrant remitances and travel.
We therefore directly estimate cash flows through these informal channels and find that
taking account of immigrant remitances and cash transported by inbound and outbound
passengers leads to a slight increase in our estiamte of U.S. cash held abroad between
1988 and 2002. Thereafter, informal flows reduce our estimates of currency abroad. We
conclude that by the end of 2011, the best direct estimates of U.S currency held abroad
suggest that $230 billion is held overseas, that is, 23 percent of the currency in circulation
with the public. This estimate implies that per capita domestic cash holdings amount to
roughly $2300. We strongly suggest that the Federal Reserve and the Bureau of
Economic Analysis downward revise their official estimates of overseas currency to
bring them into conformity with the New York Federal Reserves (FSN) series and the
available estimates of immigrant remittances and travel flows.
We then turn to a reexamination of “indirect” means of estimating the amount of
U.S. currency abroad. These indirect methods, based on varients of monetary
demography models, are the basis for the oft cited claims, that as much as 55 -70 percent
of the nation’s currency supply is held overseas. While these indirect methods are
admittedly innovative, we demonstrate that they require highly restrictive assumptions
that can be shown to be significantly violated by available empirical data. Figure 13
reveals that an average of simple monetary demography models suggests that $470
billion of U.S. currency (47 percent) is currently held abroad. We also update the
“seasonal” models proposed by Porter and Judson (1996) and Judson (2012) also
displayed in Figure 13. If taken at face value, they suggest that between $620 - $790
billon (62-79 percent) of U.S. currency is held abroad. As such, the indirect approaches
produce estimates exceeding the direct estimates by an astounding $390-550 billion.
They also suggest a temporal path at variance with that of direct estimates. The direct
estimates reveal that the introduction of the euro led to a substitution of euros for U.S.
dollars until the financial crisis. The seasonal models suggest a continual upward trend in
the demand for U.S. dollars abroad. We not only demonstrate that a key assumption
underlying these indirect models is false but also show that the results from these models

22
are highly sensitive to slight variations in their specifying assumptions. We conclude that
these indirect models, particularly the seasonal models, are unfit methods for estimating
the amount of U.S. currency held abroad.
It is beyond the scope of the present paper to examine many of the interesting
implications that follow from our finding that the amount of currency overseas is less
than 25 percent of the nation’s cash in circulation with the public. We do however,
strongly urge Federal Reserve officials to come to some agreement concerning the
amount of currency held abroad so that the current discrepancies between their published
data, their internal data and their public pronouncements can finally be put to rest.

23
References:
Anderson, 1977, P. Anderson, Currency in use and in hoards, New England Economic
Review, Federal Reserve Bank of Boston, (1977), pp. 21-30.
Anderson and Rasche, 1997, R.G. Anderson and R.H. Rasche, Construction of an
estimated domestic monetary base using new estimates of foreign holdings of U.S.
currency, Federal Reserve Bank of St. Louis Working paper 019A, (1997), pp. 1-50.
Augustin, 2011, S. Augustin, The circulation of euro banknotes outside of the euro area,
Billertaria, Issue 10, December, (2011), pp. 16-17.
Avery, et.al. , 1986, R.B. Avery, G.E. Elliehausen, A.B. Kinneckell and P. A. Spindt, The
use of cash and transaction accounts by American families, Federal Reserve Bulletin, 72
(1986) pp. 87-108.
Avery, et.al. , 1987, R.B. Avery, G.E. Elliehausen, A.B. Kinneckell and P. A Spindt,
Changes in the use of transaction accounts and cash from 1984 to 1986, Federal Reserve
Bulletin, 73 (1987) pp. 179-196.
Bach, 1997, C.L. Bach, U.S. International transactions, revised estimates for 1974-96,
Survey of Current Business 77(7) (1997), pp. 43-55
Board of Governors of the Federal Reserve System, 2012, Currency and Coin Services,
May, 22, 2012. http://www.federalreserve.gov/paymentsystems/coin_about.htm
Bureau of Economic Analysis, 2008, News release, June, 17, 2008, pp. 1-7.
Cebula and Feige, 1997, R. Cebula and E.L. Feige America’s Unreported Economy:
Measuring the Size, Growth and determinants of Income Tax Evasion in the U.S, Crime,
Law and Social Change, Vol.57 Issue 3, April, 2012

24
Doyle, 2000, B. M. Doyle, Here,dollars,dollars..Estimating currency demand and
worldwide currency substitution, International Finance Working Paper No. 657, January
2000.
European Central Bank, 2011, The International Role of the Euro, July.
Federal Reserve Bank of San Francisco, 2012, President John C. Williams’ speech to the
Western Economic Association International, July, 2, 2012.
http://www.frbsf.org/news/speeches/2012/john-williams-0702.html
Federal Reserve Statistical Release Z.1, 2011, Flow of Funds Accounts of the United
States, December 8, 2011.
Feige, 1989, E.L. Feige, Currency velocity and cash payments in the U.S. Economy: The Currency Enigma, http://ideas.repec.org/p/pra/mprapa/13807.html.
Feige, 1994, E.L. Feige, The underground economy and the currency enigma, Public
Finance, 49, 1994 pp.119-139. Reprinted in G. Fiorentini and S Zamagni (ed.) The
economics of corruption and illegal markets, International Library of Critical Writings in
Economics, Elgar (1999), pp. 23-40)
Feige, 1996, E.L. Feige, Overseas holdings of U.S. currency and the underground
economy, in Pozo (ed.) Exploring the underground economy: studies of illegal and
unreported activity, Kalamazoo, Mich. W.E Upjohn Institute for Employment and
Research, (1966), pp. 5-62.
Feige, 1997, E.L. Feige, Revised estimates of the underground economy: Implications of
U.S. currency held abroad, in O. Lippert and M. Walker (ed.) The Underground
economy: Global evidence of its size and impact. (1997), pp.151-208.

25
Feige et. al. 2003, E.L. Feige, M. Faulend, V. Sonje and V. Sosic, Unofficial dollarization
in Latin America: Currency substitution, network externalities and irreversibility, in D.
Salvatore, J.W. Dean and T.D. Willett (ed.) The Dollarization debate, Oxford university
press, (2003), pp.46-71.
Feige, 2012, E. L. Feige, New Estimates of U.S. Currency Abroad, the Domestic Money
Supply and the Unreported Economy, Crime, Law and Social Change, Vol.53 Issue 3,
April, 2012
Fujiki and Tanaka, 2009, H. Fujiki and M. Tanaka, Currency demand, new technology
and the adoption of electric money: Evidence using individual household data. IMES
Discussion Paper Series 09-E-27, Institute for Monetary and Economic Studies, Bank of
Japan.
Goldberg, 2010a, L. S. Goldberg, Is the International Role of the Dollar Changing?
Federal Reserve Bank Of New York, Current Issues in Economics and Finance, 16(1)
(2010) pp.1-7.
Goldberg, 2010b, L. Goldberg, “What is the status of the international roles of the dollar?
VOX, March, 31, 2010. http://www.voxeu.org/article/dollar-s-international-roles
Hellerstein and Ryan, 2011, R. Hellerstein and W. Ryan, Cash Dollars Abroad, Federal
Reserve Bank of New York Staff Report no. 400. February, 2011.
Judson, 2012, R. Judson, Crisis and calm: Demand for U.S. currency at home and abroad
from the fall of the Berlin Wall to 2011, Presented at the International conference on
“The usage, costs and benefits of cash: Theory and evidence from macro and micro data”,
Deutsche Bundesbank, Eltville, Germany, February, 2012, pp. 1-33

26
Leung et al. 2010, F. Leung, P. Ng, S. Chan, Analyzing External Demand for the Hong
Kong-Dollar Currency, Hong Kong Monetary Authority Working Paper 07/2010,
September.
Murray and Powell, 2002, J. Murray and J. Powell, Dollarization in Canada: The buck
stops there, Bank of Canada, Technical report No. 90, August, 2002.
Pasley, 2005, R. Pasley, Recent Developments in Bank Secrecy Act Enforcement, North
Carolina Banking Institute, 9 pp.61-102.
Porter and Judson, 1996, R.D. Porter and R.A. Judson, The location of U.S. currency:
How much is abroad? Federal Reserve Bulletin, vol. 82 (October), pp.883-903
Roseman, 2010, L.L. Roseman, Statement of Louise L. Roseman, Director, Division of
Reserve Bank Operations and Payment Systems, Board of Governors of the Federal
Reserve System before the Subcommittee on Domestic Monetary Policy and Technology
of the Committee on Financial Services, U.S. House of Representatives, Washington,
D.C. July 20, 2010.
http://www.federalreserve.gov/newsevents/testimony/roseman20100720a.htm
Sumner, 1990, S.B. Sumner, The transactions and hoarding demand for currency,
Quarterly Review of Economics and Business, 30 (1990), pp. 75-89.
U.S. Department of Commerce, 2012, Office of Travel and Tourism Industries from the
Bureau of Economic Analysis. June, (2012)
U.S Department of Commerce, 2012, International trade Administration, Office of Travel
and Tourism Industries. Profile of U.S. Resident Travelers Visiting Overseas
Destinations: Various Years, Outbound

27
U.S Department of Commerce, 2012, International trade Administration, Office of Travel
and Tourism Industries. Profile of Overseas Travelers to the United States: Various
Years, Inbound
United States Treasury Department, 2000, United States Treasury Department, 2000, The
use and counterfeiting of United States Currency Abroad, January (2000).
United States Treasury Department, 2006, United States Treasury Department, 2006, The
use and counterfeiting of United States Currency Abroad, Part 3, January (2006).