Embed Size (px)
Citation preview
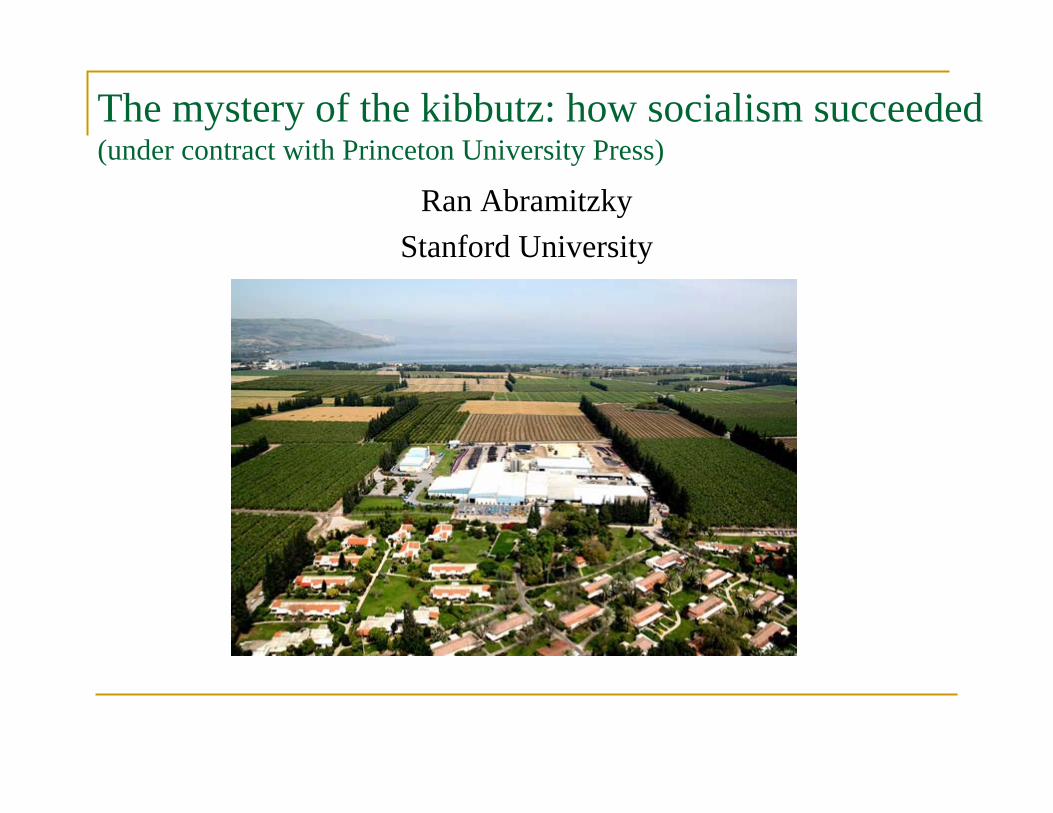
The mystery of the kibbutz: how socialism succeeded(under contract with Princeton University Press)
Ran AbramitzkyStanford University

What is my book about Kibbutzim, egalitarian and socialist communities in Israel, thrived for
almost a century within a more capitalist society
 This is despite the gloomy predictions that such communities arelikely to fail because of severe incentive problems: members areexpected to shirk on each other, the brightest members are expected to exit, and only the least productive workers are expected to enter
 How did such socialist islands survive successfully within a more capitalist society?
 Specifically: Were there incentive problems in kibbutzim? How did kibbutzim thrive and provide equal sharing despite incentive problems? Why did some kibbutzim eventually shift away from equal sharing while others didn’t? Did the shift away from equal sharing help kibbutzim to survive? What are the lessons from kibbutzim for other organizations and societies aiming at high degrees of redistribution?
What is my book about Part I: The economic history of the kibbutz Part II: Do kibbutz members respond to economic
incentives? Part III: How did kibbutzim thrive despite incentive
problems? Part IV: Why did some kibbutzim shift away from
equal sharing and others not? An empirical test of the limits of equality
 Part V: Did the shift away from equal sharing reduce incentive problems?
 Part VI: Implications beyond kibbutzim
This book is in part based on my following papers:
1. “Lessons from the Kibbutz on the Equality-Incentives Trade-Off,” Journal of Economic Perspectives, 25:1, 185-208, Winter 2011
2. “On the (lack of) Stability of Communes: An Economic Perspective,” in Oxford Handbook of the Economics of Religion (edited by Rachel McCleary), Oxford University Press, Chapter 9, 169-189, 2011
3. “The Effect of Redistribution on Migration: Evidence from the Israeli kibbutz,” Journal of Public Economics, 93, 498-511, 2009
4. “The Limits of Equality: Insights from the Israeli Kibbutz,” Quarterly Journal of Economics, 123:3, 1111-1159, August 2008
5. “The Limits of Equality: An Economic Analysis of the Israeli Kibbutz,”Journal of Economic History, 67(2), 495-499, 2007
6. “How Responsive is Investment in Schooling to Changes in Redistribution Policies and in Returns?” with Victor Lavy [current draft: April 2012]

The puzzle:
How did socialist islands thrive within a capitalist society?
Stereotypical idealistic view Emphasizes the role of ideology
 Founders of kibbutzim were socialist idealists who migrated from Eastern Europe to modern-day Israel
 Attempted to create a “new human being” who cared about the group more than about himself, and to challenge the selfish homo economicus

An economic perspective To an economist, thinking about incentives that
selfish individuals face…, equal-sharing arrangements seem unlikely to last:
1. Shirking and free riding are likely to be prevalent (moral hazard)
2. Low-ability individuals have an incentive to enter (adverse selection)
3. High-ability members have an incentive to exit (brain drain)
4. No incentives to invest in skill (because no return…)
Kibbutzim are a good experiment to study the survival of egalitarian communities
 Voluntary (unlike Russian Kolkhoz…)Ç so incentives can play a role…
 Never at margin of society; aware of outside option Long-lived
 Rest of the talk:1. Did incentive problems exist in kibbutzim?2. How did kibbutzim survive despite these problems?3. What are the lessons for other contexts?

Part I: The economic history of the kibbutz
[Here only brief background]

Kibbutz experiment in voluntary socialism Communities in Israel based on equal sharing of income
and communal ownership of property Survived successfully over the last century; one of most
honest experiments in voluntary socialism First kibbutz established in 1910 Most established 1930s and 1940s 120,000 members, 268 kibbutzim, 2.5% of Jewish
population today [population over time] On average: 440 members 80% industry/manufacturing, 20% agriculture By 1970s, living standards higher than Israel’s average

Identifying features of kibbutzim (until recently)Á Equality (in kind vs. cash): “from ability to needs”Á Common ownership of property; kibbutz belongs to its
members: factories, services, housing, etc Á Communal dining hallsÁ Separate communal residences for childrenÁ Many local public goods: swimming pool, cultural centerÁ No use of hired labor, no private savingsÁ Voluntary and democratic: general meeting elected
secretary, treasurer, farm manager, other officials; committees: planning, education, personal problems

Superficial timeline
 Before 1980s: all kibbutzim were very similar
 Late 1970s: children moved to parents’ homes
 Late 1980s: Ç Financial stress hit some kibbutzim more than othersÇ High-tech boom in Israel increased the outside option
 Late 1990s-2000s: Many kibbutzim shifted away from equal sharing to various degrees

Part II: Do kibbutz members respond to economic incentives?
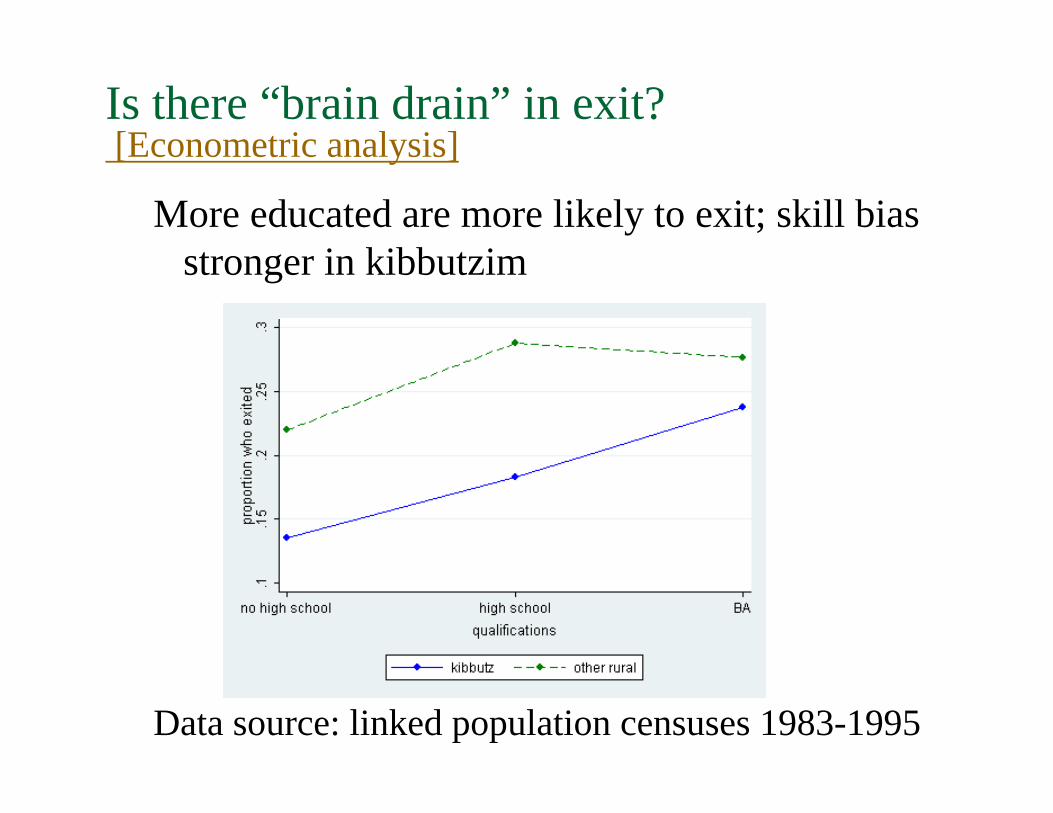
Is there “brain drain” in exit?[Econometric analysis]
More educated are more likely to exit; skill bias stronger in kibbutzim
Data source: linked population censuses 1983-1995

Members with more skilled occupations more likely to exit; skill bias stronger in kibbutzim

Are less productive individuals more likely to enter? [Econometric analysis]Â Individuals who earn less are more likely to enter
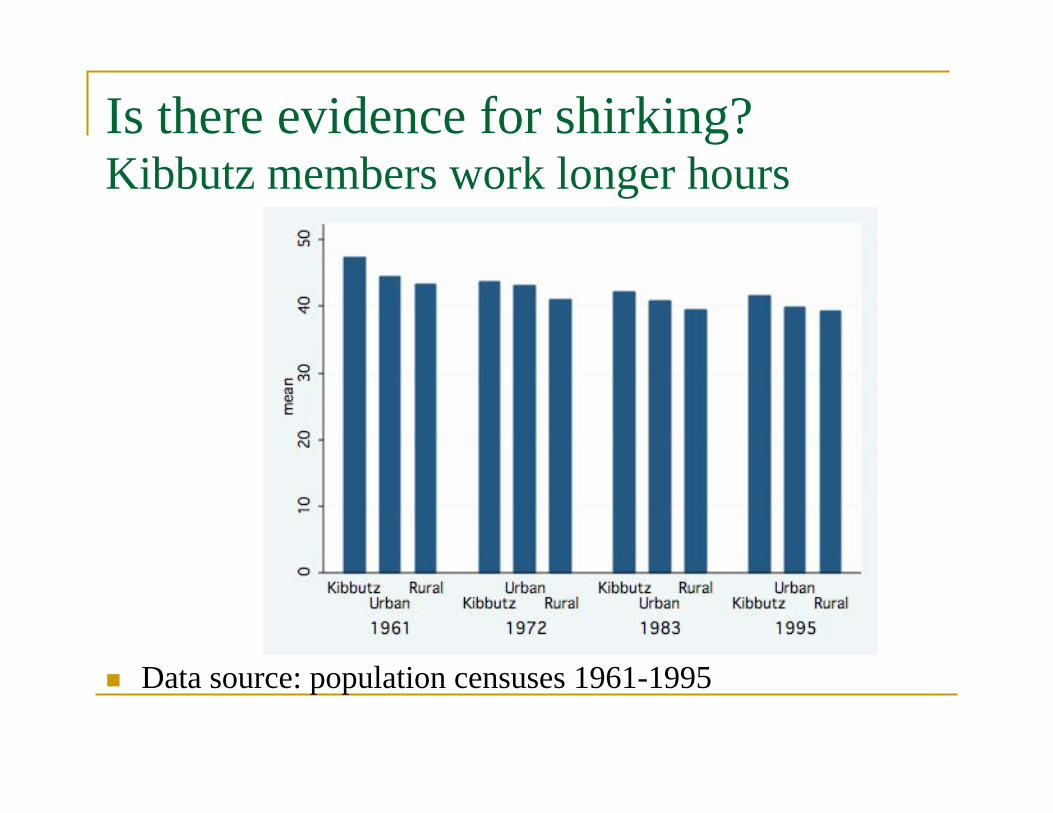
Is there evidence for shirking?Kibbutz members work longer hours
 Data source: population censuses 1961-1995
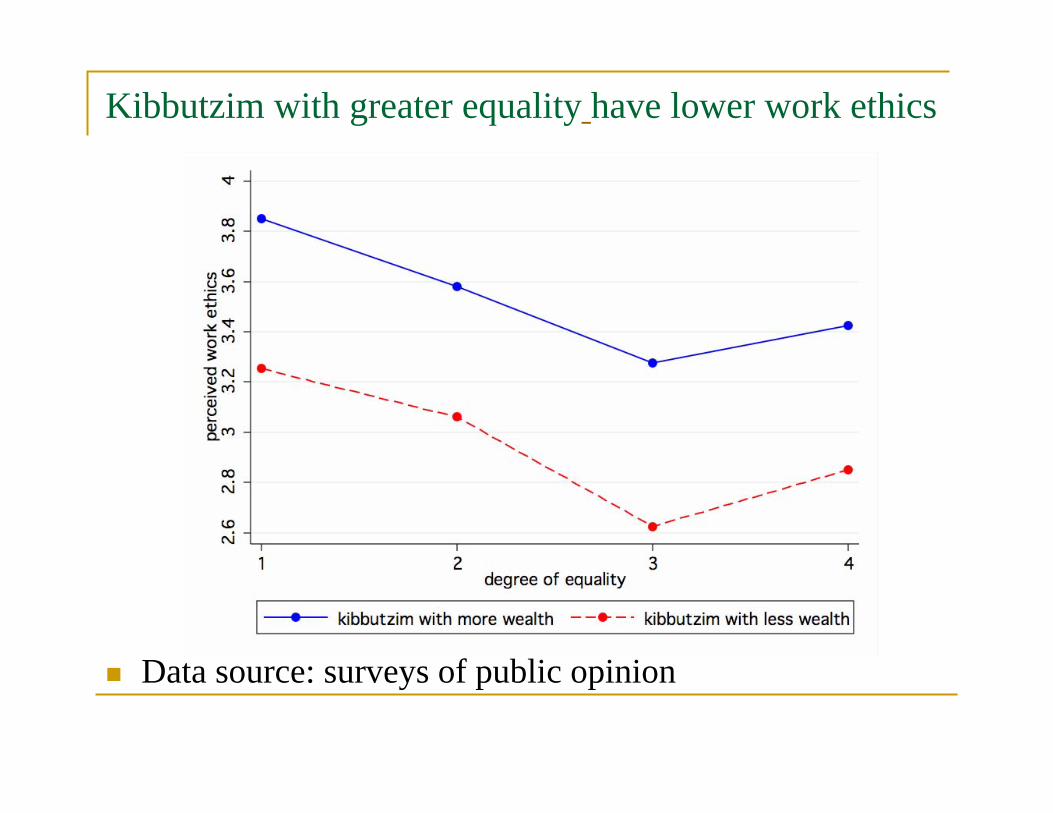
Are work ethics low in kibbutzim?
 Evidence is mixed…
 Members have always worried about “parasites” who don’t work hard and free ride on others
 Sociological studies (e.g. Palgi 1984, Shimony et al 1994) have found members actually have more work motivation than non-members

Do kibbutz members invest less in education? Kibbutz members are actually more educated

Part III: How did kibbutzim thrive despite incentive problems?[detailed version]

Conceptual framework: striving for equality while mitigating incentive problems [model]
 These incentive problems do not exist in purely capitalist (no redistribution) environments…
 Equal sharing provides better insurance and safety net for poor and unfortunate…
 But incentive problems are inherent issues in an equal sharing society with an exit option
 Design society to deal with incentive issues while providing insurance

Kibbutzim’s design mitigates incentive problems
 Kibbutzim actively designed their norms/institutions to deal with incentive issues
 Dealing with brain drain in exit: Ç communal property as a “bond” that increases the cost of exitÇ other lock-in devices such as local public goods
 Dealing with adverse selection in entry: Ç strict limits on entry; screening; “trial period”Ç admitting individuals with similar prospects (ex ante
“homogeneous”) Ç costly signals of commitment…
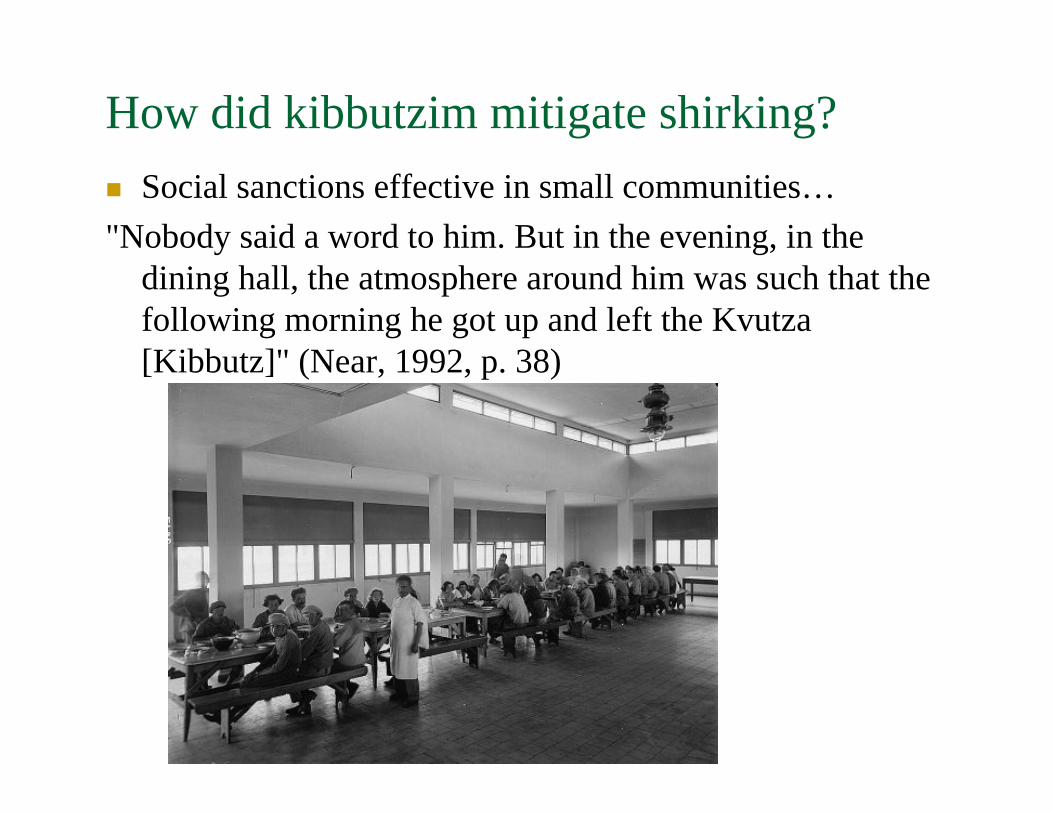
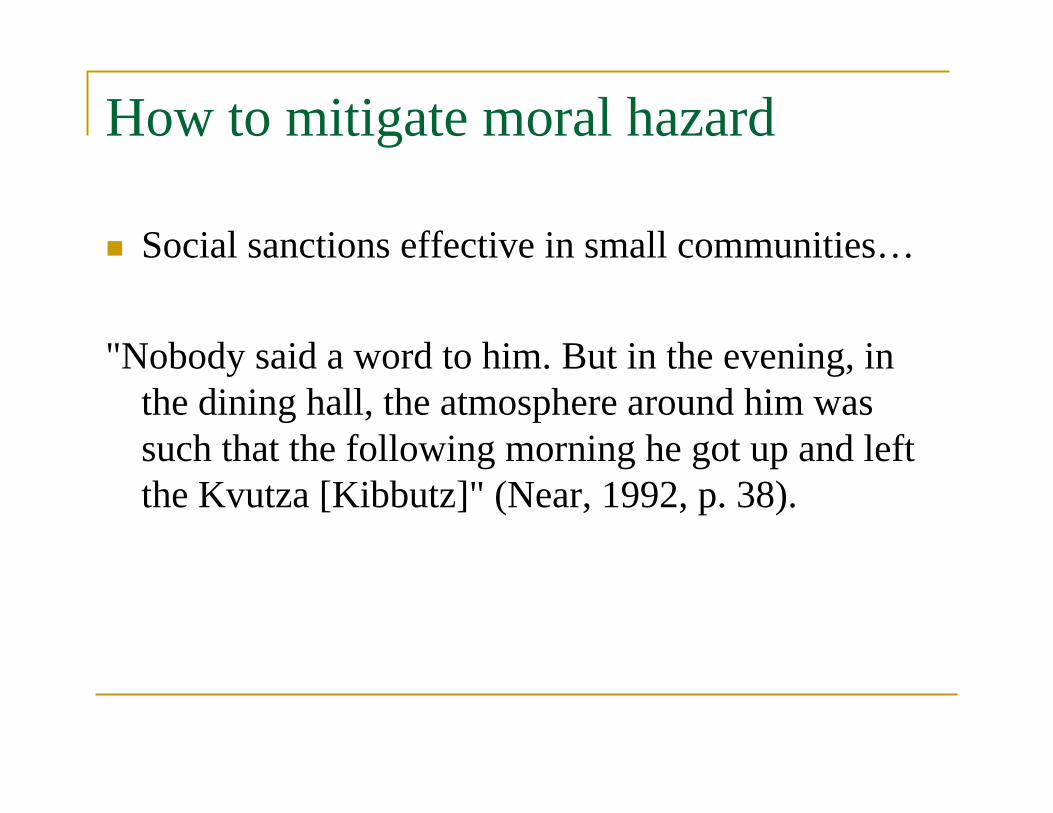
How did kibbutzim mitigate shirking? Social sanctions effective in small communities…"Nobody said a word to him. But in the evening, in the
dining hall, the atmosphere around him was such that the following morning he got up and left the Kvutza [Kibbutz]" (Near, 1992, p. 38)

How did kibbutzim mitigate shirking?
 Encouraging easy-to-monitor occupations (orange picking, cotton picking…)

How did kibbutzim mitigate shirking?
 Improving information flows (limited privacy, gossip)
 Increasing interaction (living in close proximity, interacting repeatedly, limiting population size)
 Rotation of prestigious leadership positions…
The role of ideology  Ideology matters: members with strong socialist
ideology don’t shirk and don’t leave
 Instilling ideology is key: important in avoiding opportunistic behavior
 But ideology declines with each generation, and concerns about incentives become more important
Ç Living in a kibbutz becomes default rather than choice
 Ideology played a bigger role in the creation of kibbutzim, economics plays a bigger role in their persistence

Part IV: Why did some kibbutzim shift away from equal sharing and others not? An empirical test of the limits of equality

The limits of equality: empirical test [Econometric details]Â Recent events provide opportunity to test the
determinants of equality…Ç Data source: newly-assembled kibbutz-level data
 Higher communal wealth leads to more equalityÇ Identification: Equality and wealth were similar pre;
financial stress reduced wealth in some kibbutzim more than in others…
 Higher ideology (as measured by movement affiliation and voting for socialist parties) is associated with more equality
 No correlation between membership size and equality
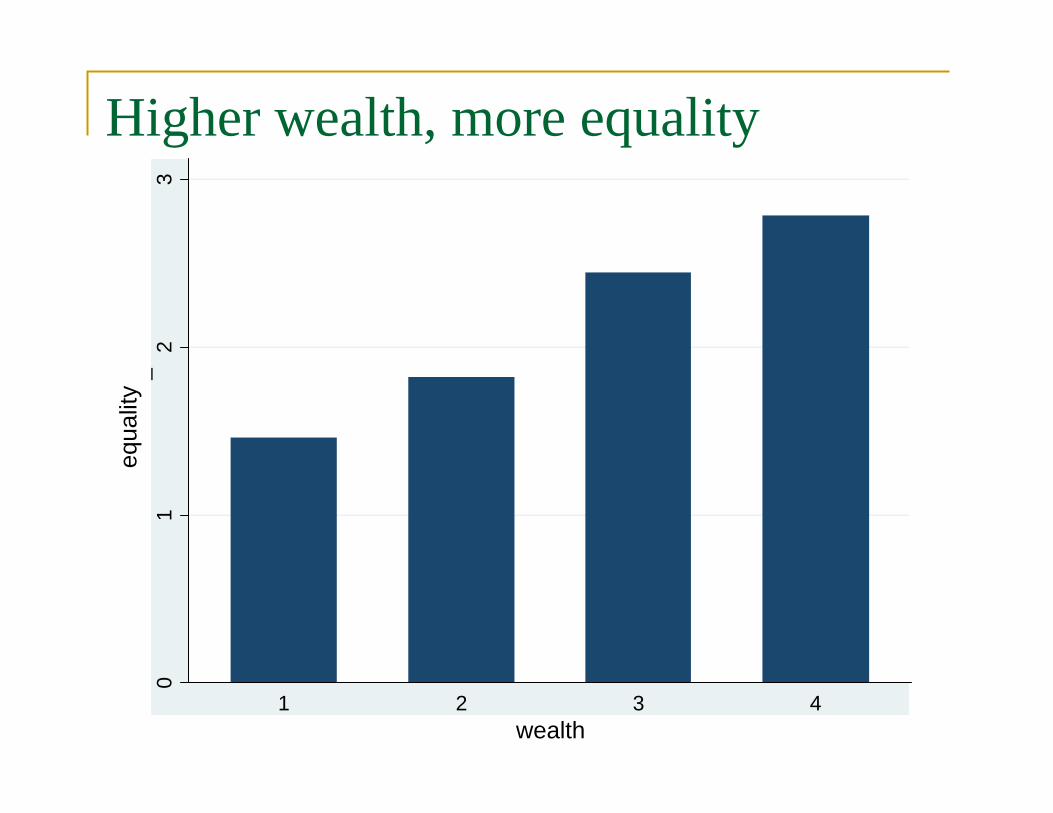
Higher wealth, more equality0
12
3_
1 2 3 4wealth
equa
lity
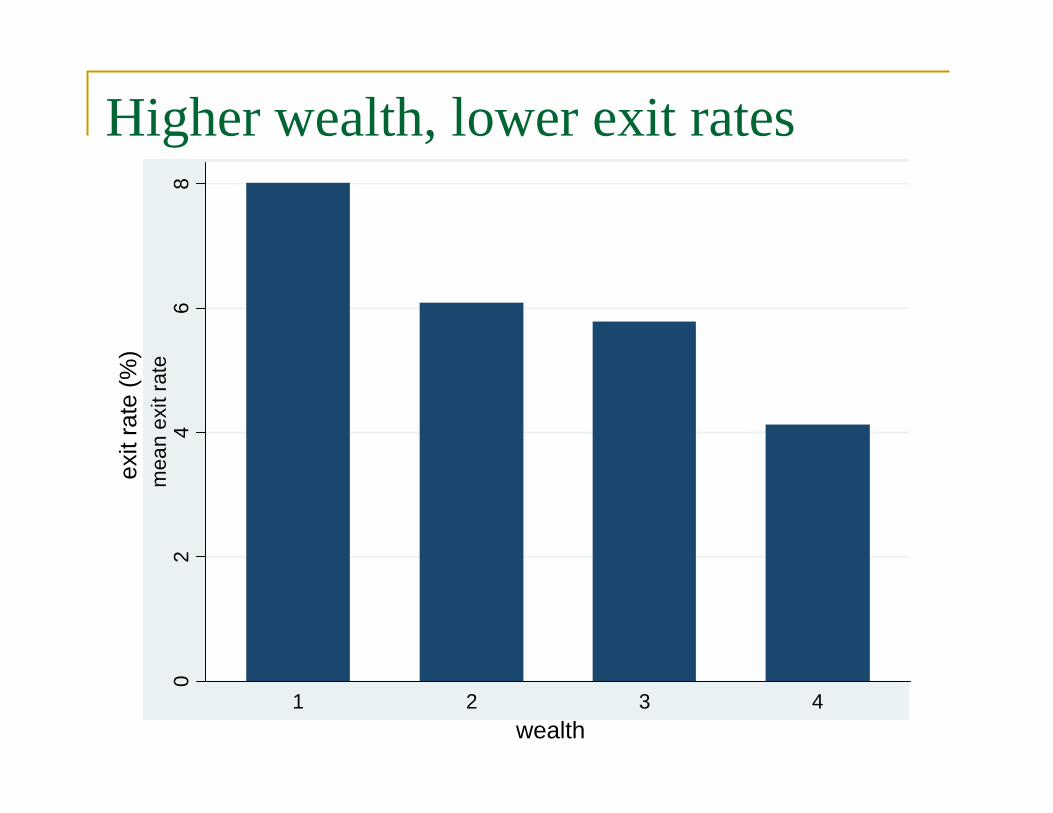
Higher wealth, lower exit rates0
24
68
mea
n ex
it ra
te
1 2 3 4wealth
exit
rate
(%)
Part V: Did the shift away from equal sharing reduce incentive problems?

High school students study harder once their kibbutz shifts away from equal sharing[research details]Â Students post reform:Ç are 3% points more likely to graduateÇ are 6% points more likely to achieve a matriculation
certificate that meets university entrance requirementsÇ get an average of 3.6 more points in their exams
 Effect is: driven by students whose parents have low schooling; larger for males; stronger in kibbutzim that reformed to greater degree
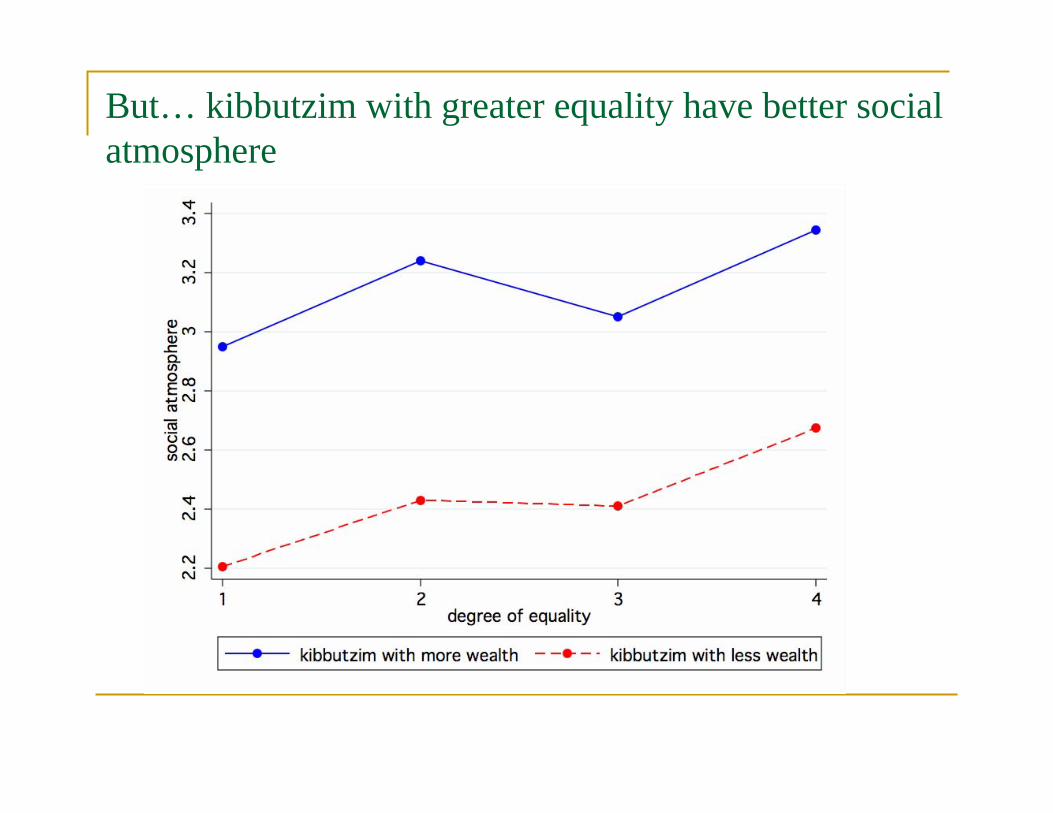
But… kibbutzim with greater equality have better social atmosphere

Part VI: Implications beyond kibbutzim

Implications beyond kibbutzim Equality-incentives tradeoff is central. Lessons for: 1. Other communes ; hunters and gatherers 2. Organizations: professional partnerships, labor
managed firms, cooperatives, academic departments…
3. Communist countries, welfare states4. Migration: selection of migrants5. Development: village economies and group lending in
developing countries 6. Public: mobility limits redistribution7. Problem of “commons”: common ownership of
property as a solution rather than only a problem…

THE END

Links from presentation to details

Kibbutz population [back]

A model of kibbutzim [back][1/3]

A model of kibbutzim [back][2/3]Â Social planner offers contracts to maximize utility of
ex ante identical members (who give in their assets to the planner)
 Social planner is subject to (BC), (PC), (IC; solved assuming Kendel and Lazear 1992 cost of shirking)
 Planner’s wealth increases cost of exit and facilitates equal sharing
 Presence of ideologically committed members facilitates equal sharing

A model of kibbutzim: insurance vs. participation [back][3/3]Â Ex ante, individuals with similar expected ability
would like insurance“The main characteristic of the kibbutzim (at the outset) was homogeneity.
Kibbutzim were established by young unattached individuals who shared a comparatively long period of social, ideological and vocational training” (Talmon, 1972, p.2)
 But, ex post, members who realize they are more productive than average might leave
 To allow equal sharing, members “post a bond” that makes exit costly: give all private property to the kibbutz: “Each Kibbutz member must live inside the Kibbutz, bring to the possession of the Kibbutz… any income and assets he owns and/or receives from any source” (Kibbutz’s bylaws)


Brain drain: Econometric details [back] [1/7]

Summary statistics: movers are more educated and skilled [back] [2/7]
(1) (2) (3) (4) (5) (6)Stayed in Kibbutz Kibbutz-to-city migrants Kibbutz-to-other rural City natives City-to-kibbutz migrants City-to-other rural
Variable migrants migrants
1983 monthly earnings - - - 32,120 25,877 31,211(20,276) (18,168) (20,111)
At least high school diploma 0.500 0.615 0.630 0.507 0.642 0.692(0.500) (0.488) (0.486) (0.500) (0.481) (0.462)
High-skill 0.084 0.099 0.099 0.141 0.066 0.149(0.278) (0.300) (0.300) (0.348) (0.250) (0.357)
Low-skill 0.226 0.149 0.086 0.084 0.073 0.061(0.418) (0.357) (0.283) (0.277) (0.261) (0.239)
Age 36.295 29.500 29.963 33.327 26.570 28.434(8.719) (7.900) (7.279) (8.719) (5.998) (6.574)
Age squared 1393.3 932.4 950.1 1186.7 741.7 851.7(648.8) (532.0) (477.6) (618.1) (363.4) (423.5)
Male 0.494 0.550 0.543 0.576 0.556 0.533(0.500) (0.498) (0.501) (0.494) (0.498) (0.499)
Married 0.796 0.523 0.704 0.743 0.344 0.641(0.403) (0.500) (0.459) (0.437) (0.477) (0.480)
Family Size 3.570 2.576 3.136 4.068 3.311 3.687(1.627) (1.663) (1.730) (1.506) (1.588) (1.528)
Born in Israel 0.669 0.752 0.654 0.538 0.775 0.731(0.471) (0.433) (0.479) (0.499) (0.419) (0.444)
Israel's north region 0.524 0.508 0.568 0.072 0.066 0.105(0.500) (0.501) (0.498) (0.259) (0.250) (0.307)
Israel's south region 0.199 0.256 0.259 0.118 0.139 0.105(0.400) (0.437) (0.441) (0.323) (0.347) (0.307)
Observations 1,234 262 81 20,617 151 610
TABLE 1Summary statistics
Wage-based measure of skill [back] [3/7]
 Predicted log earnings upon moving
 1995 city log earnings expected by a mover with certain 1983 observable characteristics
 OLS regression of 1995 city log earnings on education, occupation (high/low skill), and controls

Kibbutz leavers are more skilled than stayers; skill bias in exit from kibbutzim stronger than from other rural localities [back] [4/7]
(1) (2) (4) (5) (6) (7)
city other rural Variable
Kibbutz*Predicted 1995 log earnings 0.777** 0.413* 0.965*** 0.461**(0.326) (0.223) (0.334) (0.229)
Kibbutz -6.863** -3.602* -8.396*** -3.920**(2.772) (1.900) (2.838) (1.954)
Predicted 1995 log earnings 1.922*** 1.900*** 1.986*** 0.177 1.306*** -0.01 1.238***(0.284) (0.314) (0.500) (0.225) (0.222) (0.237) (0.232)
At least high school diploma 0.656***(0.144)
High-skill 0.502**(0.233)
Low-skill -0.682***(0.197)
Age (/10) -2.416*** -3.901*** -3.843*** -4.224*** -3.095*** -3.035***(0.744) (0.797) (0.865) (1.550) (0.517) (0.536)
Age squared (/100) 0.201* 0.410*** 0.413*** 0.414* 0.329*** 0.311***(0.103) (0.110) (0.120) (0.218) (0.073) (0.076)
Male 0.137 -0.980*** -0.982*** -0.958** -0.894*** -0.854***(0.144) (0.224) (0.247) (0.399) (0.146) (0.149)
Married -0.391* -0.478** -0.608** 0.035 -0.753*** -0.760***(0.228) (0.229) (0.253) (0.410) (0.124) (0.126)
Family Size -0.002 0.027 -0.002 0.119 0.041 0.051*(0.071) (0.071) (0.079) (0.124) (0.027) (0.027)
Born in Israel -0.297* -0.492*** -0.382** -0.798*** -0.506*** -0.494***(0.157) (0.160) (0.180) (0.268) (0.112) (0.116)
Region dummies Yes Yes Yes Yes Yes Yes
Predicted Probability 0.175 0.176 0.134 0.039 0.212 0.202Observations 1,577 1,577 3,091 3,091 3,044 3,044
TABLE 2Exit from kibbutzim and other rural areas (logit and multinomial logit regressions), 1983-1995
1,577
other rural areas other non-metropolitan rural
Logit of exit from kibbutz
(3)
Multinomial logit of exit from kibbutz to: Logit of exit to city of kibbutz members relative to residents of:
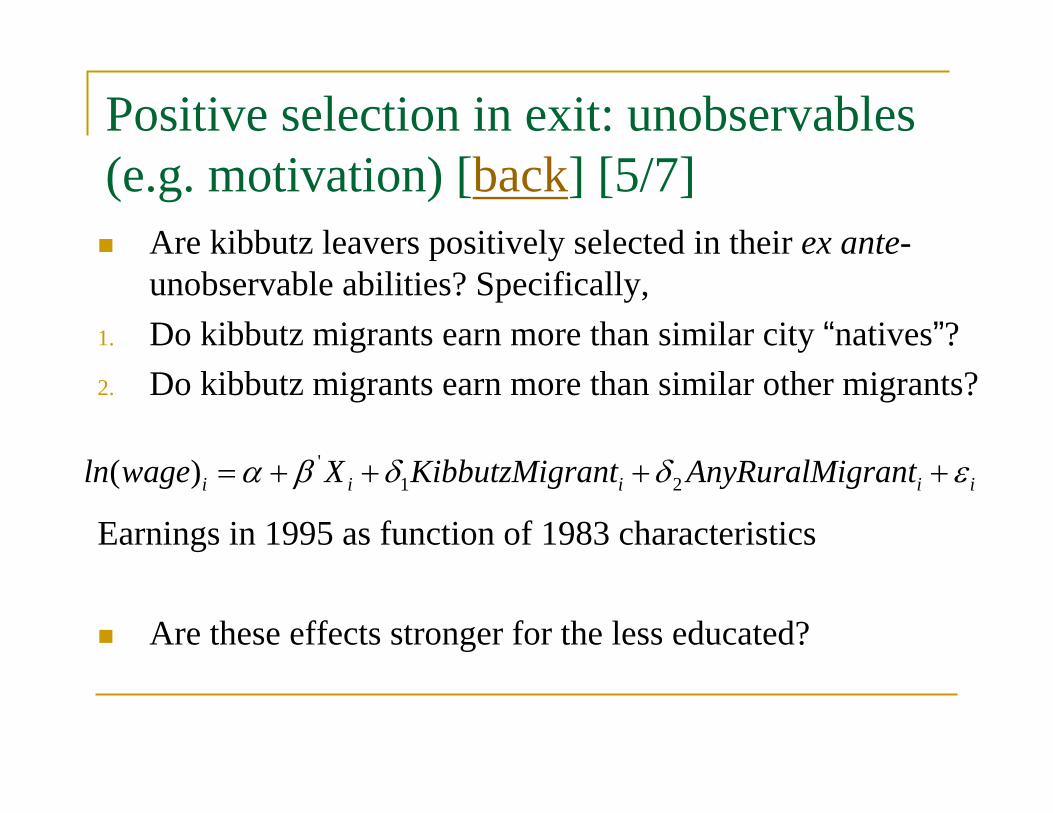
Positive selection in exit: unobservables (e.g. motivation) [back] [5/7]Â Are kibbutz leavers positively selected in their ex ante-
unobservable abilities? Specifically,1. Do kibbutz migrants earn more than similar city “natives”? 2. Do kibbutz migrants earn more than similar other migrants?
Earnings in 1995 as function of 1983 characteristics
 Are these effects stronger for the less educated?
'1 2( )i i i i iln wage X KibbutzMigrant AnyRuralMigrantα β δ δ ε= + + + +

Kibbutz migrants earn more than city natives; and earn more than other rural migrants [back] [6/7]
(1) (2) (3) (4) (5) (6)
city natives city nativesVariable
Kibbutz migrant 0.068 0.181*** 0.098* 0.170** 0.110** 0.169*(0.043) (0.068) (0.054) (0.086) (0.055) (0.087)
Kibbutz migrant*At least high school diploma -0.184** -0.113 -0.088(0.086) (0.111) (0.112)
Any migrant -0.032 0.011 -0.044 0.012(0.035) (0.054) (0.037) (0.055)
Any migrant*At least high school diploma -0.073 -0.099(0.071) (0.073)
At least high school diploma 0.357*** 0.359*** 0.357*** 0.361*** 0.358*** 0.362***(0.010) (0.010) (0.010) (0.010) (0.010) (0.010)
High-skill 0.363*** 0.362*** 0.363*** 0.362*** 0.363*** 0.362***(0.015) (0.015) (0.015) (0.015) (0.015) (0.015)
Low-skill -0.226*** -0.226*** -0.226*** -0.226*** -0.226*** -0.226***(0.017) (0.017) (0.017) (0.017) (0.017) (0.017)
Age (/10) 0.870*** 0.871*** 0.869*** 0.871*** 0.869*** 0.871***(0.042) (0.042) (0.042) (0.042) (0.042) (0.042)
Age squared (/100) -0.121*** -0.121*** -0.121*** -0.121*** -0.121*** -0.121***(0.006) (0.006) (0.006) (0.006) (0.006) (0.006)
Male 0.600*** 0.600*** 0.601*** 0.601*** 0.601*** 0.601***(0.010) (0.010) (0.010) (0.010) (0.010) (0.010)
Born in Israel 0.113*** 0.113*** 0.113*** 0.113*** 0.113*** 0.113***(0.010) (0.010) (0.010) (0.010) (0.010) (0.010)
Region dummies Yes Yes Yes Yes Yes Yes
0.264 0.264 0.265 0.265 0.265 0.265Observations 21,150 21,150 21,132 21,132 21,132 21,132
Earnings in 1995 of kibbutz-to-city migrants vs. other rural-to-city migrants (OLS regression)TABLE 3
other rural migrants other rural migrants from outside
metropolitan areas
Comparing kibbutz migrants with:

Kernel densities of 1995 wages of kibbutz-to-outside movers and others outside, 1995 [back] [7/7]


Adverse selection: Econometric details [back] [1/5]
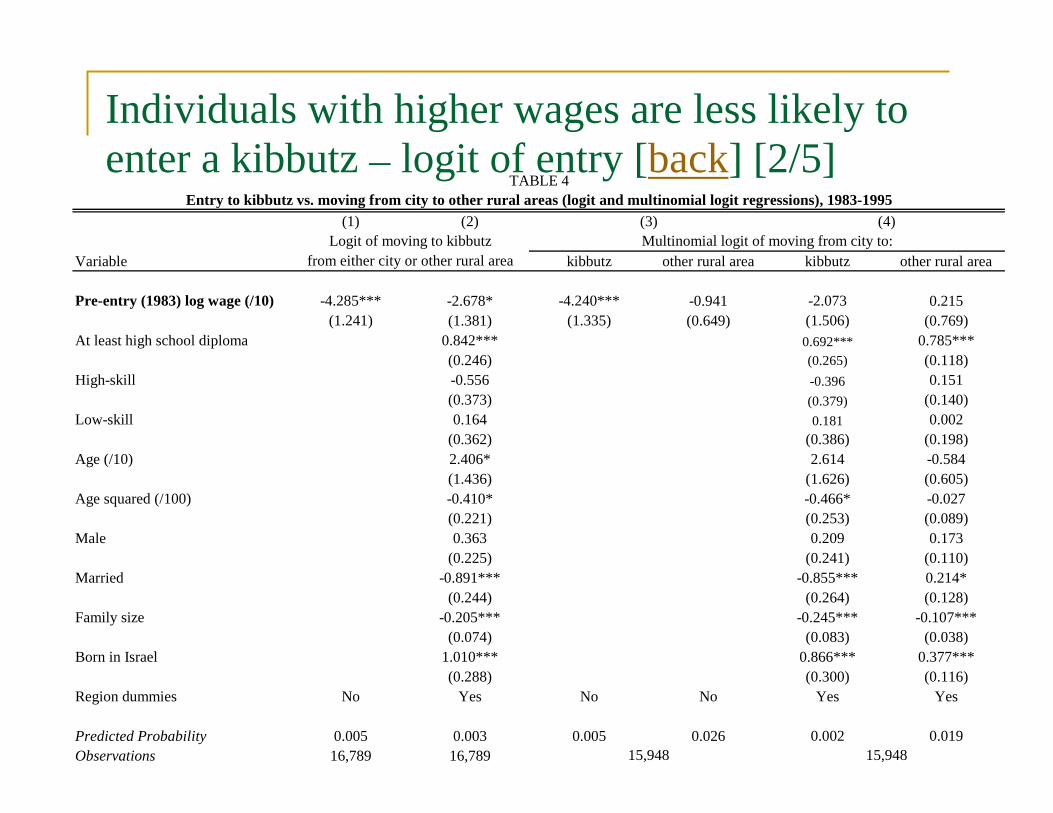
Individuals with higher wages are less likely to enter a kibbutz – logit of entry [back] [2/5]
(1) (2)
Variable kibbutz other rural area kibbutz other rural area
Pre-entry (1983) log wage (/10) -4.285*** -2.678* -4.240*** -0.941 -2.073 0.215(1.241) (1.381) (1.335) (0.649) (1.506) (0.769)
At least high school diploma 0.842*** 0.692*** 0.785***(0.246) (0.265) (0.118)
High-skill -0.556 -0.396 0.151(0.373) (0.379) (0.140)
Low-skill 0.164 0.181 0.002(0.362) (0.386) (0.198)
Age (/10) 2.406* 2.614 -0.584(1.436) (1.626) (0.605)
Age squared (/100) -0.410* -0.466* -0.027(0.221) (0.253) (0.089)
Male 0.363 0.209 0.173(0.225) (0.241) (0.110)
Married -0.891*** -0.855*** 0.214*(0.244) (0.264) (0.128)
Family size -0.205*** -0.245*** -0.107***(0.074) (0.083) (0.038)
Born in Israel 1.010*** 0.866*** 0.377***(0.288) (0.300) (0.116)
Region dummies No Yes No No Yes Yes
Predicted Probability 0.005 0.003 0.005 0.026 0.002 0.019Observations 16,789 16,789 15,948 15,948
from either city or other rural area
TABLE 4Entry to kibbutz vs. moving from city to other rural areas (logit and multinomial logit regressions), 1983-1995
Logit of moving to kibbutz(4)
Multinomial logit of moving from city to:(3)
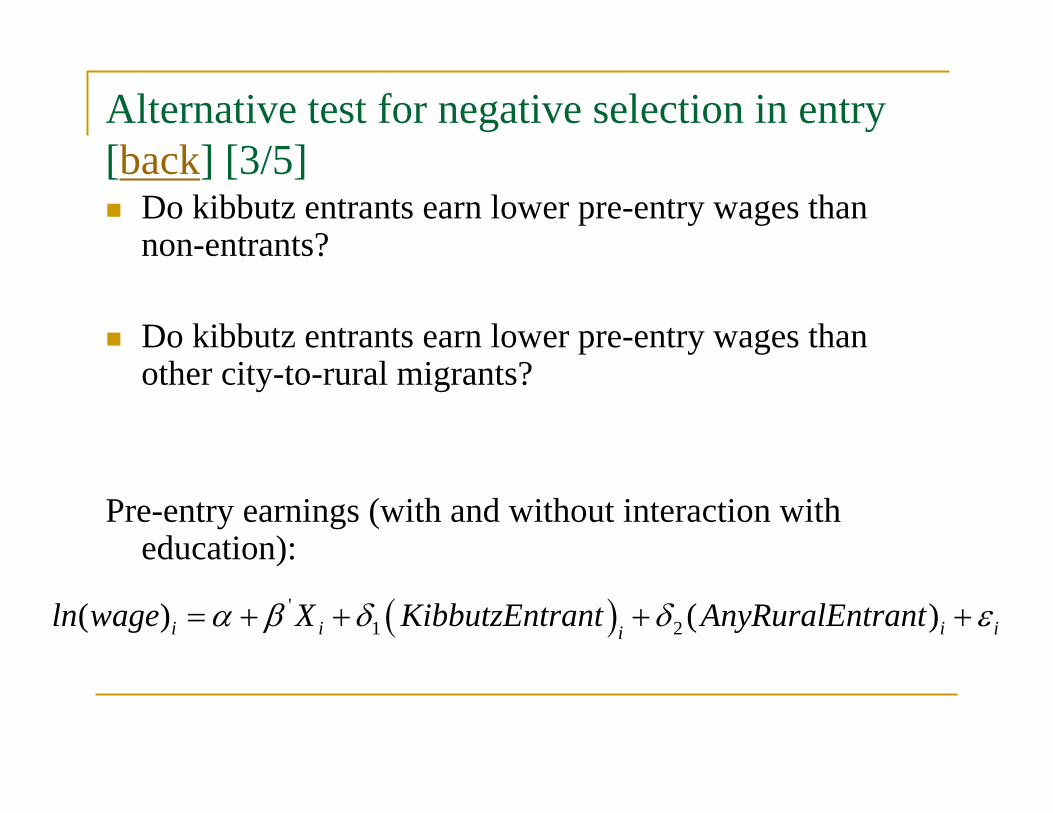
Alternative test for negative selection in entry [back] [3/5]Â Do kibbutz entrants earn lower pre-entry wages than
non-entrants?
 Do kibbutz entrants earn lower pre-entry wages than other city-to-rural migrants?
Pre-entry earnings (with and without interaction with education):
( )'1 2( ) ( )i i i ii
ln wage X KibbutzEntrant AnyRuralEntrantα β δ δ ε= + + + +

Kibbutz entrants earn less than non-entrants; earn less than other migrants [back] [4/5]
(1) (2) (3) (4) (5) (6)
Variable
Entered kibbutz -0.027*** -0.016** 0.003 -0.022** -0.016** -0.016(0.009) (0.007) (0.013) (0.009) (0.008) (0.014)
Entered kibbutz * At least school diploma -0.028* -0.000(0.016) (0.017)
Any migrant -0.005 -0.000 0.019***(0.004) (0.003) (0.006)
Any migrant * At least high school diploma -0.028***(0.007)
At least high school diploma 0.021*** 0.021*** 0.021*** 0.021***(0.001) (0.001) (0.001) (0.001)
High-skill 0.028*** 0.028*** 0.028*** 0.028***(0.001) (0.001) (0.001) (0.001)
Low-skill -0.027*** -0.027*** -0.027*** -0.027***(0.002) (0.002) (0.002) (0.002)
Age 0.112*** 0.112*** 0.112*** 0.112***(0.005) (0.005) (0.005) (0.005)
Age squared -0.013*** -0.013*** -0.013*** -0.013***(0.001) (0.001) (0.001) (0.001)
Male 0.054*** 0.054*** 0.054*** 0.054***(0.001) (0.001) (0.001) (0.001)
Born in Israel 0.007*** 0.007*** 0.007*** 0.007***(0.001) (0.001) (0.001) (0.001)
Region dummies No Yes Yes No Yes Yes
0.001 0.279 0.279 0.001 0.279 0.280Observations 15,948 15,948 15,948 15,948 15,948 15,948
TABLE 5Pre-entry earnings of city-to-kibbutz migrants, city-to-other rural migrants, and non-migrants (OLS regression), 1983
non-entrants city-to-other rural migrantsComparing kibbutz entrants with:

Kernel densities of 1983 wages of kibbutz entrants and city stayers [back] [5/5]

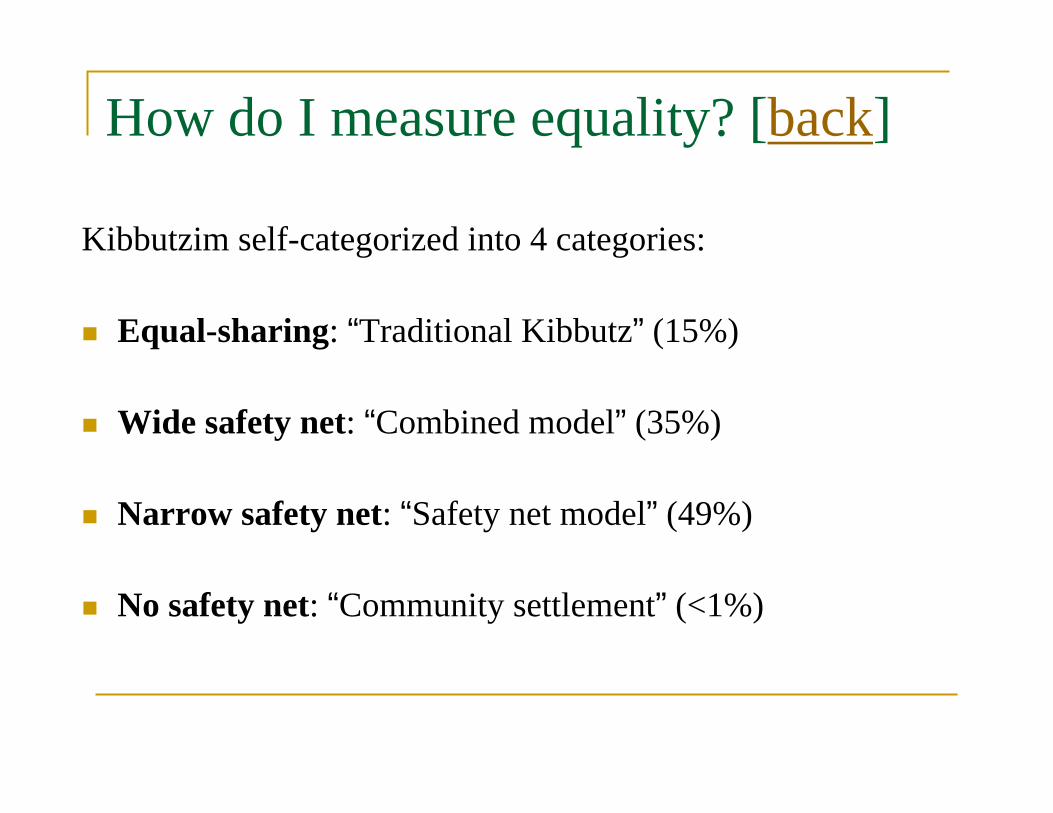
How do I measure equality? [back]
Kibbutzim self-categorized into 4 categories:
 Equal-sharing: “Traditional Kibbutz” (15%)
 Wide safety net: “Combined model” (35%)
 Narrow safety net: “Safety net model” (49%)
 No safety net: “Community settlement” (<1%)


Investment in human capital: Research design [back][1/20]

How responsive is education to changes in return? [back][2/20]
year
pre-reform cohort(1995-1996)
treatment kibbutzim reformed (1998-1999)
post-reform cohort(1999-2000)
control kibbutzim reformed (2003-2004)
Difference-in-differences approach:1st diff (treatment/control): students in kibbutzim that reformed: (a) early are “treatment group”, (b) late are “control group”2nd diff (post/pre): affected vs. unaffected cohorts of students

Investment in human capital: Tables [back][3/20]
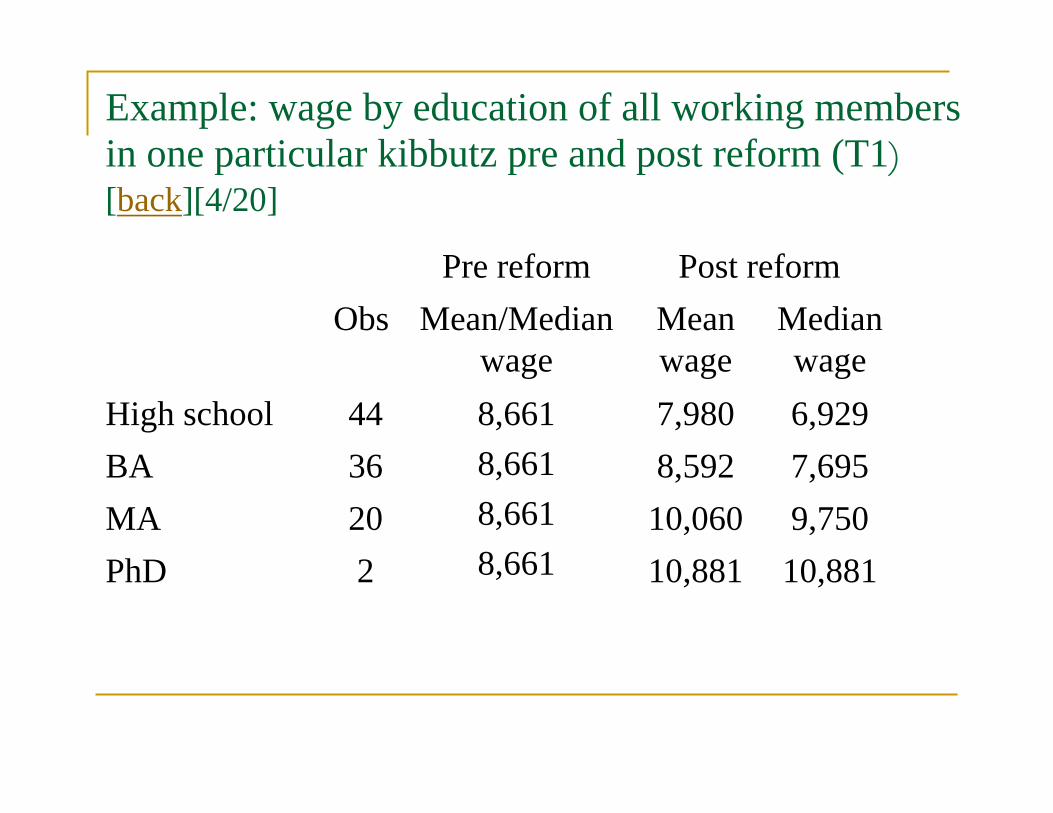
Example: wage by education of all working members in one particular kibbutz pre and post reform (T1) [back][4/20]
Pre reform Post reformObs Mean/Median
wageMean wage
Median wage
High school 44 8,6618,6618,6618,661
7,980 6,929BA 36 8,592 7,695MA 20 10,060 9,750PhD 2 10,881 10,881

Post reform wage by education of all working members in 2 kibbutzim (T2). Dep Var: Ln(wage) [back][5/20]Years of schooling 0.080
(0.021)0.083
(0.021)High school Omitted OmittedBA 0.318
(0.088)0.306
(0.090)MA 0.443
(0.135)0.456
(0.135)PhD 0.584
(0.283)0.639
(0.285)Age and Age2 No Yes No Yes Kibbutz FE Yes Yes Yes Yes

Distribution of kibbutzim and students, by year of reform and cohort (T3) [back][6/20]
Year of reform1998-2000 2003-2004Treatment Control
A. 10th grade students in 1995-1996
Kibbutzim 74 33Students 1,100 601
B. 10th grade students in 1999-2000
Kibbutzim 74 33Students 1,043 605
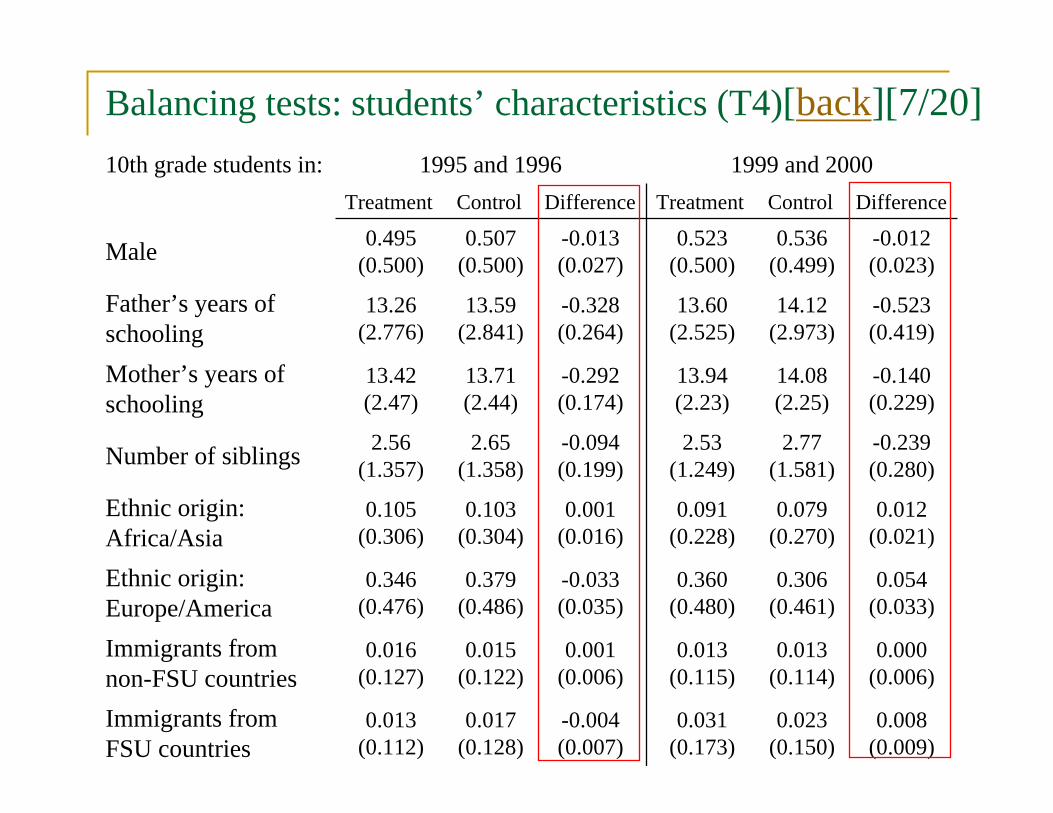
Balancing tests: students’ characteristics (T4)[back][7/20]10th grade students in: 1995 and 1996 1999 and 2000
Treatment Control Difference Treatment Control Difference
Male 0.495(0.500)
0.507(0.500)
-0.013(0.027)
0.523(0.500)
0.536(0.499)
-0.012(0.023)
Father’s years of schooling
13.26(2.776)
13.59(2.841)
-0.328(0.264)
13.60(2.525)
14.12(2.973)
-0.523(0.419)
Mother’s years of schooling
13.42(2.47)
13.71(2.44)
-0.292(0.174)
13.94(2.23)
14.08(2.25)
-0.140(0.229)
Number of siblings 2.56(1.357)
2.65(1.358)
-0.094(0.199)
2.53(1.249)
2.77(1.581)
-0.239(0.280)
Ethnic origin: Africa/Asia
0.105(0.306)
0.103(0.304)
0.001(0.016)
0.091(0.228)
0.079(0.270)
0.012(0.021)
Ethnic origin: Europe/America
0.346(0.476)
0.379(0.486)
-0.033(0.035)
0.360(0.480)
0.306(0.461)
0.054(0.033)
Immigrants from non-FSU countries
0.016(0.127)
0.015(0.122)
0.001(0.006)
0.013(0.115)
0.013(0.114)
0.000(0.006)
Immigrants from FSU countries
0.013(0.112)
0.017(0.128)
-0.004(0.007)
0.031(0.173)
0.023(0.150)
0.008(0.009)

Balancing tests: pre-reform outcomes (T4) [back][8/20]
10th grade students in 1995 and 1996
Treatment Control Difference
High school completion 0.951(0.216)
0.967(0.180)
-0.016(0.011)
Mean matriculation score 70.62(23.25)
72.48(21.04)
-1.862(1.309)
Matriculation certification 0.549(0.498)
0.569(0.496)
-0.020(0.036)
University qualified matriculation
0.516(0.500)
0.536(0.499)
-0.019(0.035)

Treatment-control and between-cohort differences in students’ exit rates (T5) [back][9/20]
10th grade students in Treatment Control Difference
1995-96 0.056(0.231)
0.042(0.200)
0.015(0.016)
1999-2000 0.052(0.222)
0.038(0.191)
0.014(0.011)
Difference -0.002(0.010)
-0.001(0.011)

Treatment-control differences in pre-reform time trends: linear model (T6) [back][10/20]
Matriculation certificate
Mean matriculation score
(1) (2) (3) (4)
Time trend 0.025(0.011)
0.026(0.010)
1.225(0.478)
1.287(0.451)
Treatment x Time trend
-0.008(0.013)
-0.006(0.012)
-0.267(0.580)
-0.361(0.547)
Treatment 0.005(0.050) - 0.681
(2.270) -
Kibbutz FE No Yes No Yes

Treatment-control differences in pre-reform time trends: cohort dummies model (T6) [back][11/20]
Matriculation certification Mean matriculation score(1) (2) (3) (4)
Treatment x 1994 -0.022(0.076)
-0.005(0.070)
2.178(3.481)
2.329(3.295)
Treatment x 1995 -0.011(0.075)
0.003(0.070)
-1.716(3.446)
-1.782(3.255)
Treatment x 1996 -0.030(0.075)
-0.008(0.070)
0.403(3.446)
0.024(3.255)
Treatment x 1997 0.036(0.075)
0.051(0.070)
1.765(3.446)
0.816(3.259)
Treatment x 1998 -0.087(0.075)
-0.074(0.069)
-2.019(3.416)
-1.962(3.221)
Treatment -0.002(0.053) - -0.358
(2.424) -
Kibbutz FE No Yes No Yes
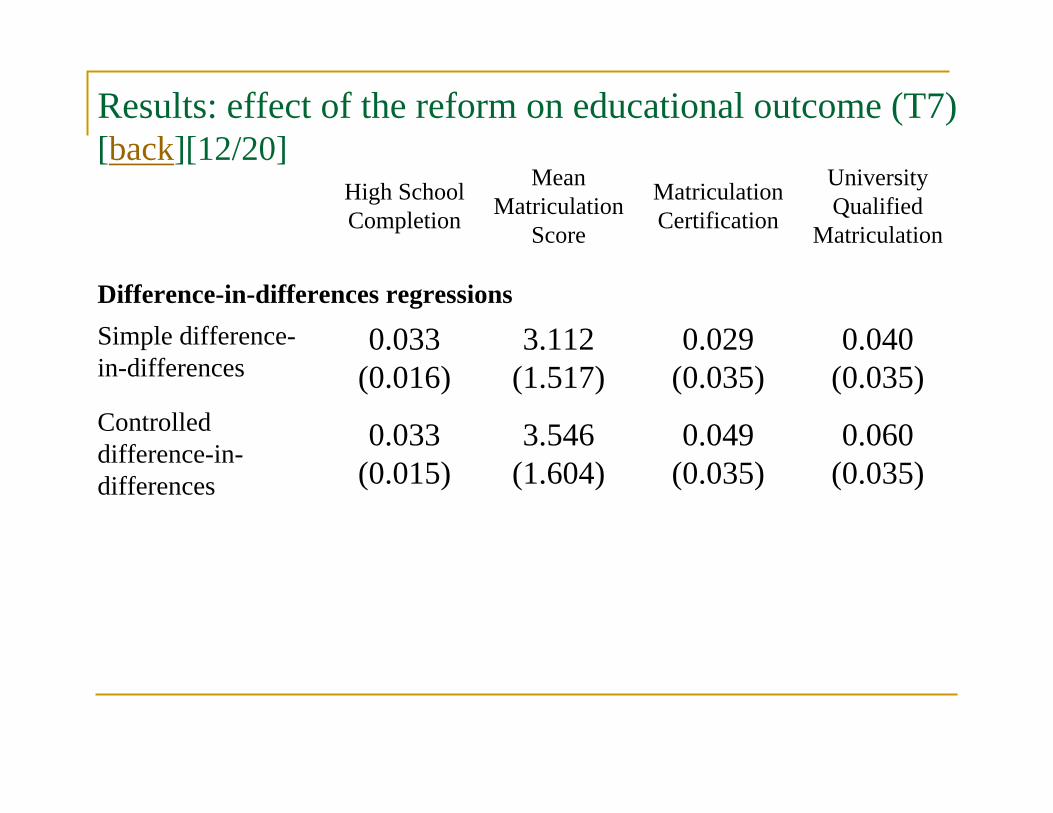
Results: effect of the reform on educational outcome (T7) [back][12/20]
High School Completion
Mean Matriculation
Score
Matriculation Certification
University Qualified
Matriculation
Difference-in-differences regressionsSimple difference-in-differences
0.033(0.016)
3.112(1.517)
0.029(0.035)
0.040(0.035)
Controlled difference-in-differences
0.033(0.015)
3.546(1.604)
0.049(0.035)
0.060(0.035)
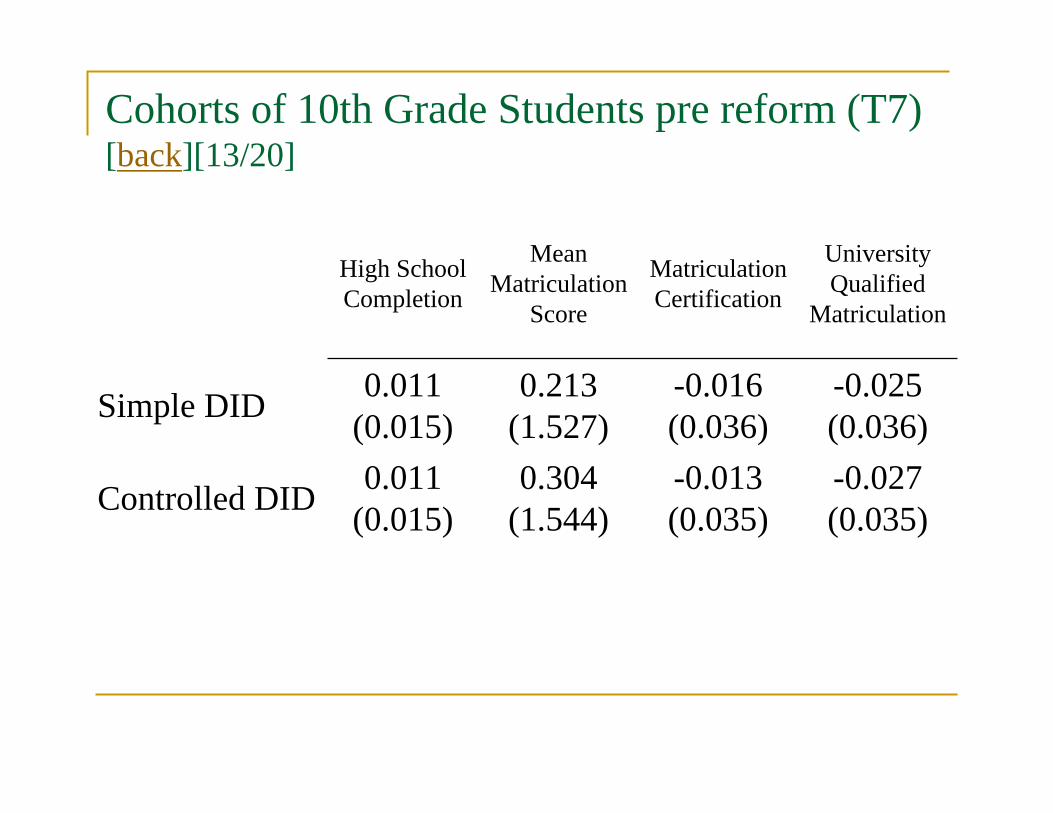
Cohorts of 10th Grade Students pre reform (T7) [back][13/20]
High School Completion
Mean Matriculation
Score
Matriculation Certification
University Qualified
Matriculation
Simple DID 0.011(0.015)
0.213(1.527)
-0.016(0.036)
-0.025(0.036)
Controlled DID 0.011(0.015)
0.304(1.544)
-0.013(0.035)
-0.027(0.035)

Controlled DID by parental education (T8) [back][14/20]
High School Completion
Mean Matriculation
Score
Matriculation Certification
University Qualified
Matriculation
Mother’s education
Low 0.049(0.024)
6.175(2.553)
0.116(0.053)
0.100(0.053)
High 0.014(0.019)
0.329(2.114)
-0.031(0.047)
0.002(0.048)
Father’s education
Low 0.033(0.027)
5.879(2.781)
0.093(0.055)
0.086(0.055)
High 0.031(0.017)
1.701(1.924)
0.010(0.046)
0.034(0.047)
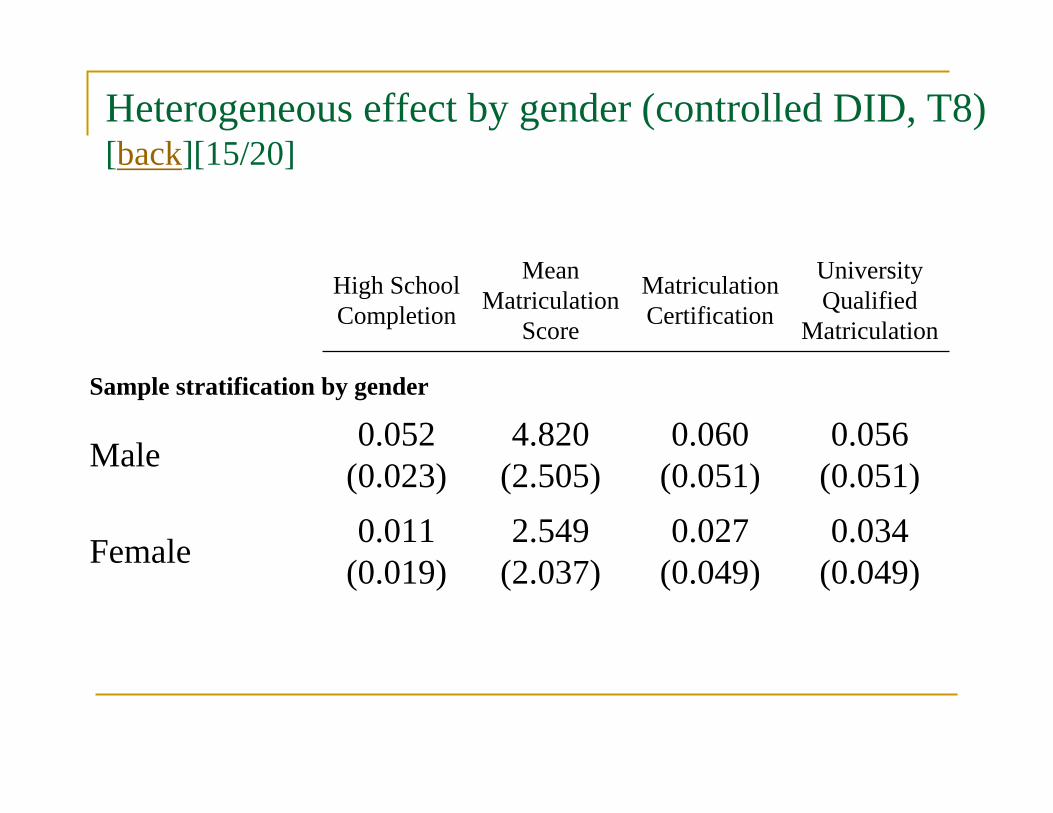
Heterogeneous effect by gender (controlled DID, T8) [back][15/20]
High School Completion
Mean Matriculation
Score
Matriculation Certification
University Qualified
Matriculation
Sample stratification by gender
Male 0.052(0.023)
4.820(2.505)
0.060(0.051)
0.056(0.051)
Female 0.011(0.019)
2.549(2.037)
0.027(0.049)
0.034(0.049)

Controlled DID by level of reform intensity (T9) [back][16/20] High School
Completion
Mean Matriculation
Score
Matriculation Certification
University Qualified
Matriculation
Intensity of exposureThree years of partial reform (N=313)
0.016(0.020)
1.239(2.202)
0.036(0.045)
0.025(0.045)
One year of full reform (N=114)
0.053(0.024)
3.744(2.485)
0.009(0.058)
-0.020(0.059)
Two years of full reform (N=211)
0.054(0.018)
5.621(1.925)
0.031(0.047)
0.083(0.047)
Three years of full reform (N=405)
0.029(0.019)
4.288(2.055)
0.082(0.043)
0.100(0.043)

Controlled DID by level of reform intensity (T9) [back][17/20]
High School Completion
Mean Matriculation
Score
Matriculation Certification
University Qualified
Matriculation
Intensity of exposure: partial vs. fullThree years of partial reform (N=313)
0.16(0.021)
1.285(2.221)
0.035(0.045)
0.026(0.045)
Three years of full reform (N=405)
0.030(0.019)
4.431(2.064)
0.084(0.045)
0.103(0.043)

Controlled DID: by level of intensity, by mother’s education (T10) [back][18/20]
High school completion
Mean matriculation
score
Matriculation
certification
University qualified
matriculationLowPartial reform
0.026(0.033)
2.792(3.612)
0.109(0.069)
0.085(0.069)
Full reform 0.044(0.033)
8.255(3.421)
0.196(0.067)
0.168(0.068)
High
Partial reform
0.006(0.027)
-0.246(2.899)
-0.047(0.063)
-0.036(0.064)
Full reform 0.008(0.024)
-0.011(2.624)
-0.034(0.058)
0.023(0.059)
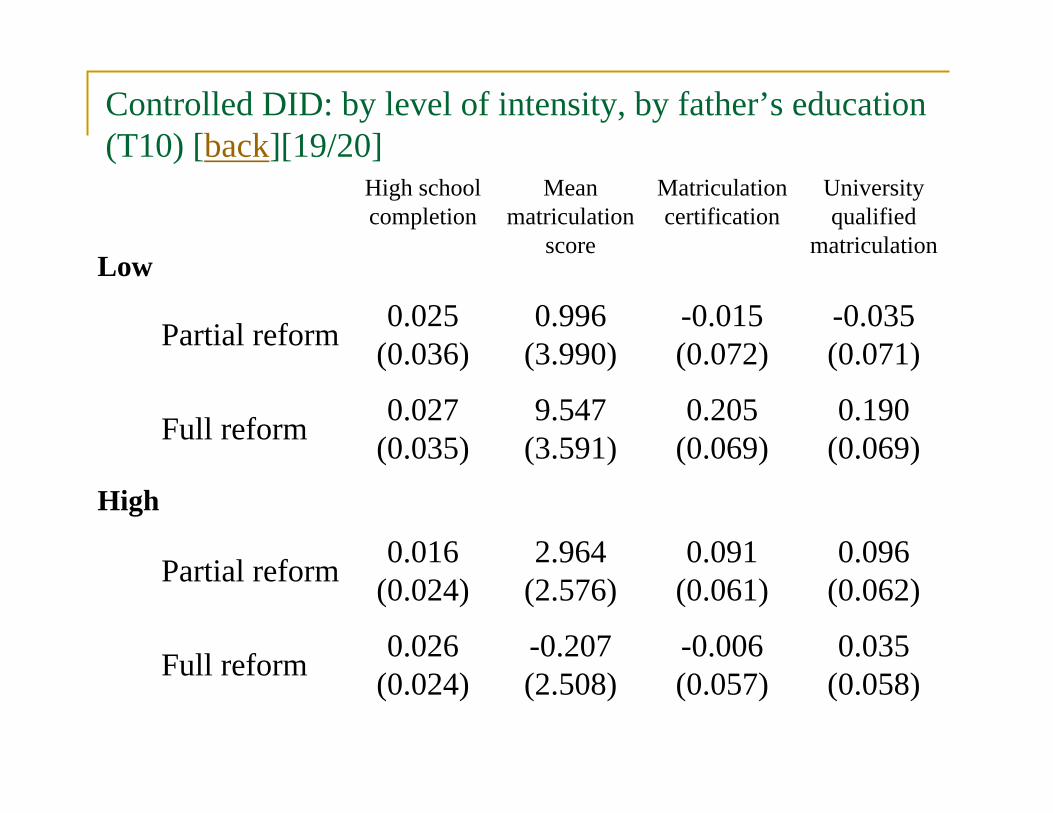
Controlled DID: by level of intensity, by father’s education (T10) [back][19/20]
High school completion
Mean matriculation
score
Matriculation certification
University qualified
matriculationLow
Partial reform 0.025(0.036)
0.996(3.990)
-0.015(0.072)
-0.035(0.071)
Full reform 0.027(0.035)
9.547(3.591)
0.205(0.069)
0.190(0.069)
High
Partial reform 0.016(0.024)
2.964(2.576)
0.091(0.061)
0.096(0.062)
Full reform 0.026(0.024)
-0.207(2.508)
-0.006(0.057)
0.035(0.058)

Controlled DID: by level of intensity, by gender (T11) [back][20/20]
High school completion
Mean matriculation
score
Matriculation certification
University qualified
matriculationMale
Partial reform 0.018(0.034)
1.085(3.460)
0.028(0.067)
0.007(0.067)
Full reform 0.042(0.030)
6.017(3.211)
0.100(0.063)
0.096(0.063)
Female
Partial reform 0.017(0.021)
2.201(2.702)
0.045(0.064)
0.037(0.064)
Full reform 0.008 (0.026)
2.832(2.710)
0.035(0.062)
0.048(0.063)


Part III: How do kibbutzim mitigate incentive problems?[detailed version] [back] [1/3]

Mitigating brain drain [back] [2/3]
Mitigating brain drain with lock-in devices [back] [3/3] Theory highlights role of sunk contributions No private property, no bequests, no private savings,
can’t accept outside gifts (reparations from Germany…)Â Local public goods such as swimming pools, tennis
courts, parks, cultural center Work inside kibbutz, limiting knowledge of outside
option Exit from kibbutzim lower than from other rural areas,
suggesting lock-in devices useful

Mitigating adverse selection

Adverse selection among entrants Theory highlights role of homogeneity Main sources of entry before 1970s were youth
movements, and the army through service in units called Nahal
 Such individuals had similar expected productivity, and would find equal sharing attractive as it provides insurance
 However, when applicants from the outside seek to enter equal sharing arrangements, we expect low-ability individuals to apply (adverse selection)
Mitigating adverse selection
 Highly restricted entry from outside (when kibbutzim experimented with open door in early 1980s, many members complained about low ability of entrants…)
 Centralized screening… “Trial periods”… Concerns about adverse selection rationalize
various costly signals of commitment to kibbutz, norms of serving in combat units in army
Mitigating moral hazard
How to mitigate moral hazard
 Social sanctions effective in small communities…
"Nobody said a word to him. But in the evening, in the dining hall, the atmosphere around him was such that the following morning he got up and left the Kvutza [Kibbutz]" (Near, 1992, p. 38).

How to mitigate moral hazard
 Members rarely expelled (but “work organizer” could assign less desirable job…)
 Kibbutzim institutional design mitigates moral hazard by supporting social sanctions and reducing monitoring costs
1. Making effort observable (orange picking…)2. Improving information flows (limited privacy, gossip)3. Increasing interaction (living in close proximity,
interacting repeatedly, limiting population size)Â Rotation of prestigious leadership positions…

Measures of wealth [back]
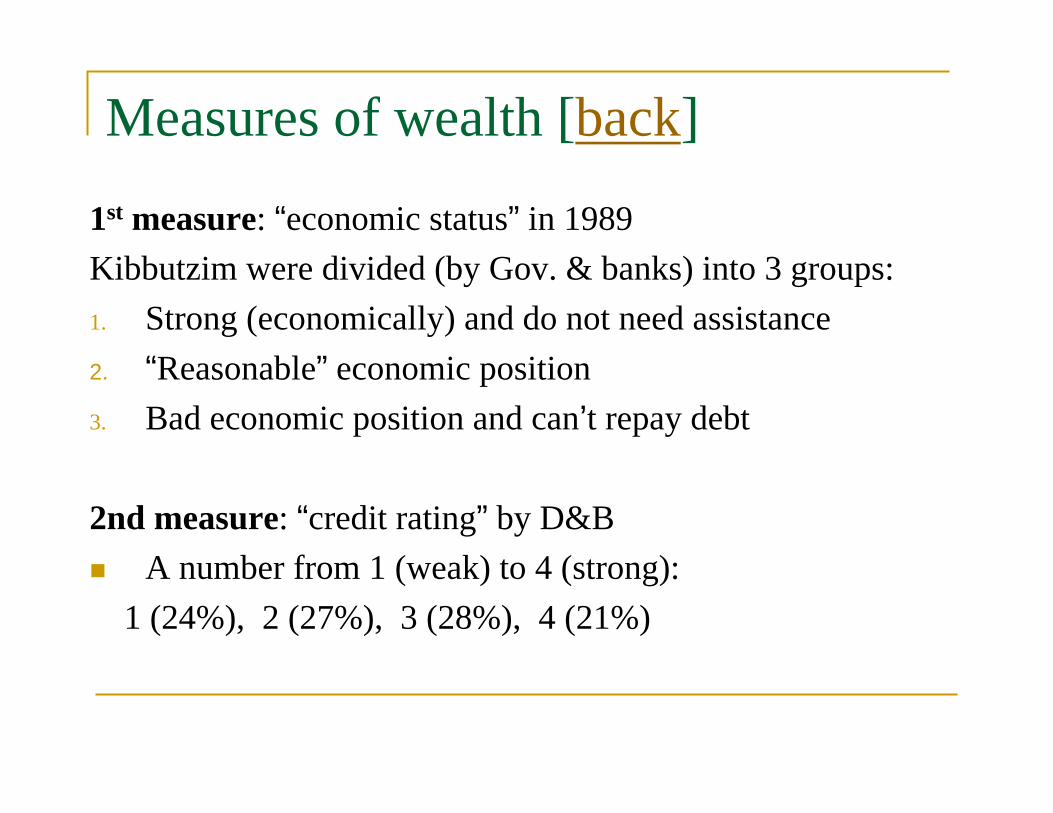
1st measure: “economic status” in 1989Kibbutzim were divided (by Gov. & banks) into 3 groups:1. Strong (economically) and do not need assistance2. “Reasonable” economic position3. Bad economic position and can’t repay debt
2nd measure: “credit rating” by D&B Â A number from 1 (weak) to 4 (strong):
1 (24%), 2 (27%), 3 (28%), 4 (21%)
Measures of wealth [back]
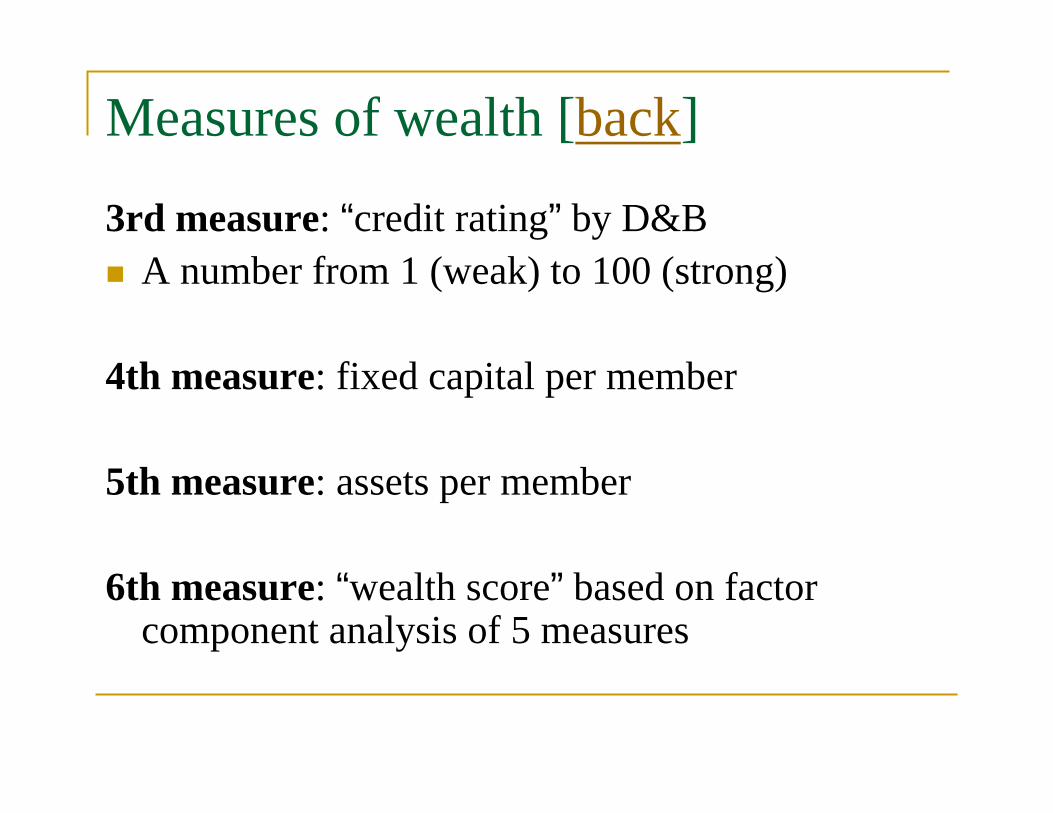
3rd measure: “credit rating” by D&B Â A number from 1 (weak) to 100 (strong)
4th measure: fixed capital per member
5th measure: assets per member
6th measure: “wealth score” based on factor component analysis of 5 measures

Measures of ideology [back]
1. Movement affiliation
2. % votes in elections for left wing parties
2. Decline in % votes in elections for left wing parties
3. “Ideology score”

How do I measure equality? [back]
Kibbutzim self-categorized into 4 categories:
 Equal-sharing: “Traditional Kibbutz” (15%)
 Wide safety net: “Combined model” (35%)
 Narrow safety net: “Safety net model” (49%)
 No safety net: “Community settlement” (<1%)


The determinants of equality: Econometric details [back] [1/4]
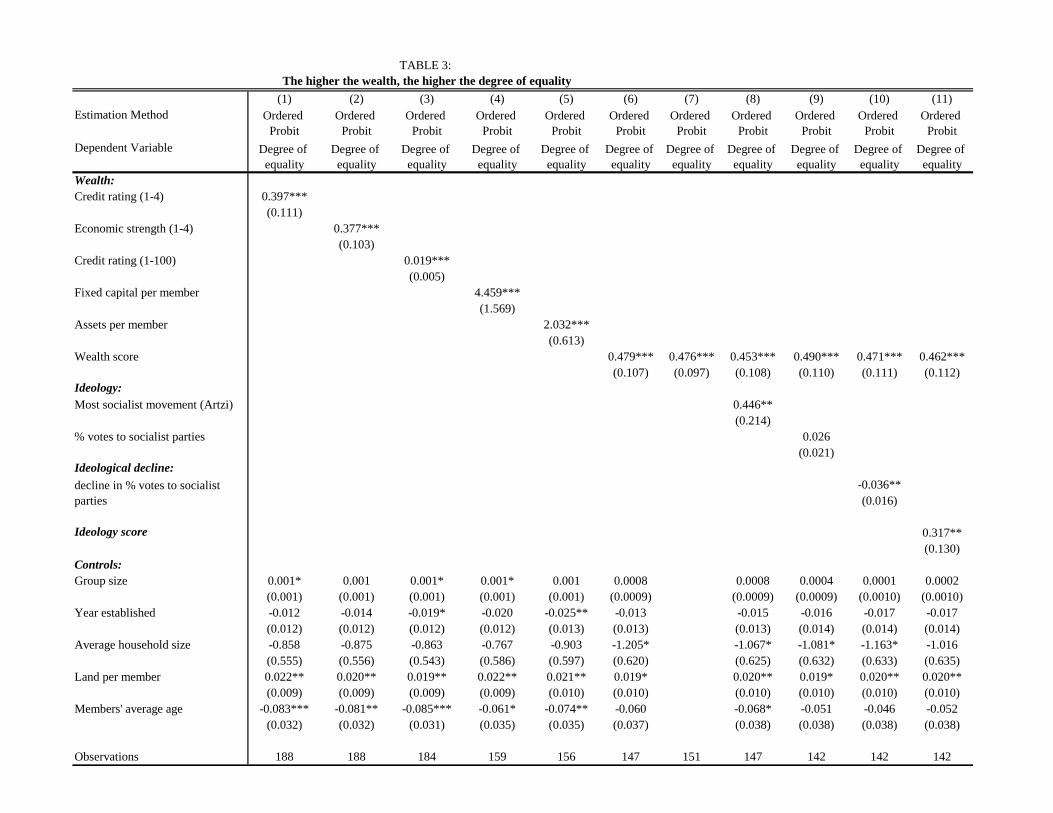
TABLE 3: The higher the wealth, the higher the degree of equality
(1) (2) (3) (4) (5) (6) (7) (8) (9) (10) (11)Estimation Method
Dependent Variable
Wealth:Credit rating (1-4) 0.397***
(0.111)Economic strength (1-4) 0.377***
(0.103)Credit rating (1-100) 0.019***
(0.005)Fixed capital per member 4.459***
(1.569)Assets per member 2.032***
(0.613)Wealth score 0.479*** 0.476*** 0.453*** 0.490*** 0.471*** 0.462***
(0.107) (0.097) (0.108) (0.110) (0.111) (0.112)Ideology: Most socialist movement (Artzi) 0.446**
(0.214)% votes to socialist parties 0.026
(0.021)Ideological decline:
-0.036**(0.016)
Ideology score 0.317**(0.130)
Controls:Group size 0.001* 0.001 0.001* 0.001* 0.001 0.0008 0.0008 0.0004 0.0001 0.0002
(0.001) (0.001) (0.001) (0.001) (0.001) (0.0009) (0.0009) (0.0009) (0.0010) (0.0010)Year established -0.012 -0.014 -0.019* -0.020 -0.025** -0.013 -0.015 -0.016 -0.017 -0.017
(0.012) (0.012) (0.012) (0.012) (0.013) (0.013) (0.013) (0.014) (0.014) (0.014)Average household size -0.858 -0.875 -0.863 -0.767 -0.903 -1.205* -1.067* -1.081* -1.163* -1.016
(0.555) (0.556) (0.543) (0.586) (0.597) (0.620) (0.625) (0.632) (0.633) (0.635)Land per member 0.022** 0.020** 0.019** 0.022** 0.021** 0.019* 0.020** 0.019* 0.020** 0.020**
(0.009) (0.009) (0.009) (0.009) (0.010) (0.010) (0.010) (0.010) (0.010) (0.010)Members' average age -0.083*** -0.081** -0.085*** -0.061* -0.074** -0.060 -0.068* -0.051 -0.046 -0.052
(0.032) (0.032) (0.031) (0.035) (0.035) (0.037) (0.038) (0.038) (0.038) (0.038) Observations 188 188 184 159 156 147 151 147 142 142 142
Degree of equality
Degree of equality
Degree of equality
Degree of equality
Degree of equality
Degree of equality
Degree of equality
Degree of equality
decline in % votes to socialist parties
Ordered Probit
Ordered Probit
Ordered Probit
Ordered Probit
Ordered Probit
Ordered Probit
Ordered Probit
Ordered Probit
Ordered Probit
Ordered Probit
Ordered Probit
Degree of equality
Degree of equality
Degree of equality
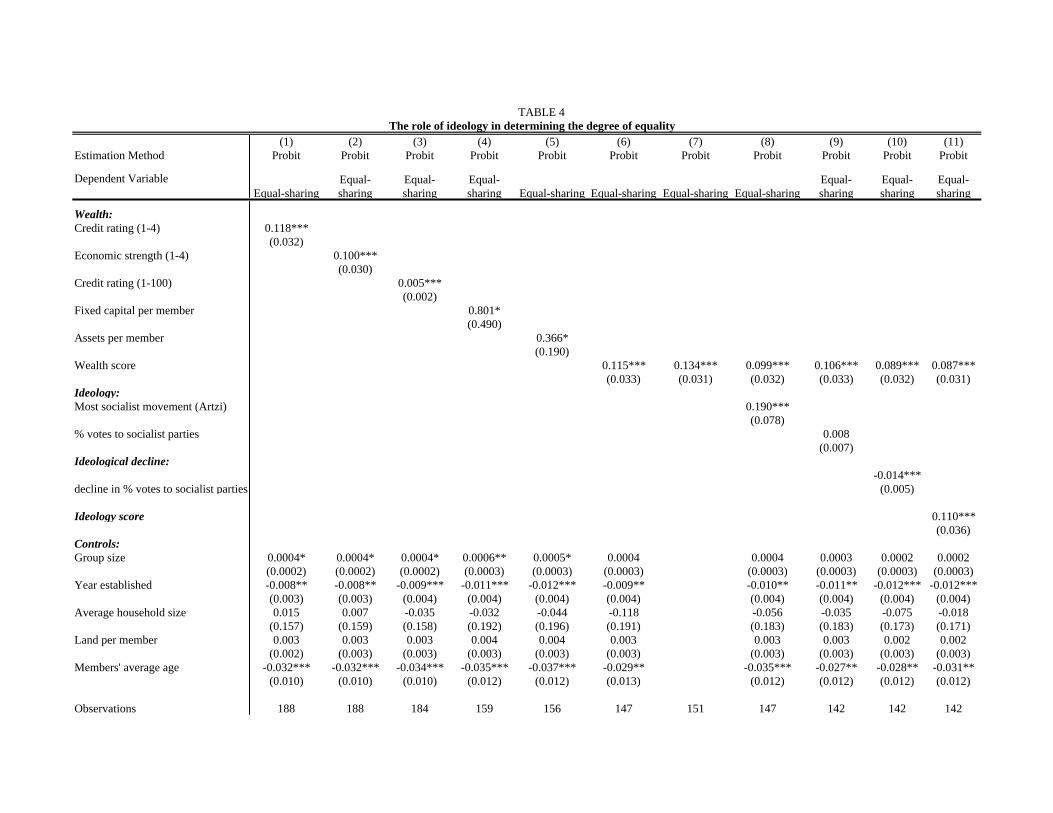
TABLE 4The role of ideology in determining the degree of equality
(1) (2) (3) (4) (5) (6) (7) (8) (9) (10) (11)Estimation Method Probit Probit Probit Probit Probit Probit Probit Probit Probit Probit Probit
Dependent Variable
Wealth:Credit rating (1-4) 0.118***
(0.032)Economic strength (1-4) 0.100***
(0.030)Credit rating (1-100) 0.005***
(0.002)Fixed capital per member 0.801*
(0.490)Assets per member 0.366*
(0.190)Wealth score 0.115*** 0.134*** 0.099*** 0.106*** 0.089*** 0.087***
(0.033) (0.031) (0.032) (0.033) (0.032) (0.031)Ideology: Most socialist movement (Artzi) 0.190***
(0.078)% votes to socialist parties 0.008
(0.007)Ideological decline:
-0.014***(0.005)
Ideology score 0.110***(0.036)
Controls:Group size 0.0004* 0.0004* 0.0004* 0.0006** 0.0005* 0.0004 0.0004 0.0003 0.0002 0.0002
(0.0002) (0.0002) (0.0002) (0.0003) (0.0003) (0.0003) (0.0003) (0.0003) (0.0003) (0.0003)Year established -0.008** -0.008** -0.009*** -0.011*** -0.012*** -0.009** -0.010** -0.011** -0.012*** -0.012***
(0.003) (0.003) (0.004) (0.004) (0.004) (0.004) (0.004) (0.004) (0.004) (0.004)Average household size 0.015 0.007 -0.035 -0.032 -0.044 -0.118 -0.056 -0.035 -0.075 -0.018
(0.157) (0.159) (0.158) (0.192) (0.196) (0.191) (0.183) (0.183) (0.173) (0.171)Land per member 0.003 0.003 0.003 0.004 0.004 0.003 0.003 0.003 0.002 0.002
(0.002) (0.003) (0.003) (0.003) (0.003) (0.003) (0.003) (0.003) (0.003) (0.003)Members' average age -0.032*** -0.032*** -0.034*** -0.035*** -0.037*** -0.029** -0.035*** -0.027** -0.028** -0.031**
(0.010) (0.010) (0.010) (0.012) (0.012) (0.013) (0.012) (0.012) (0.012) (0.012) Observations 188 188 184 159 156 147 151 147 142 142 142
Equal-sharing Equal-sharing
Equal-sharing
Equal-sharingEqual-sharing
decline in % votes to socialist parties
Equal-sharingEqual-sharing
Equal-sharing
Equal-sharing Equal-sharing Equal-sharing
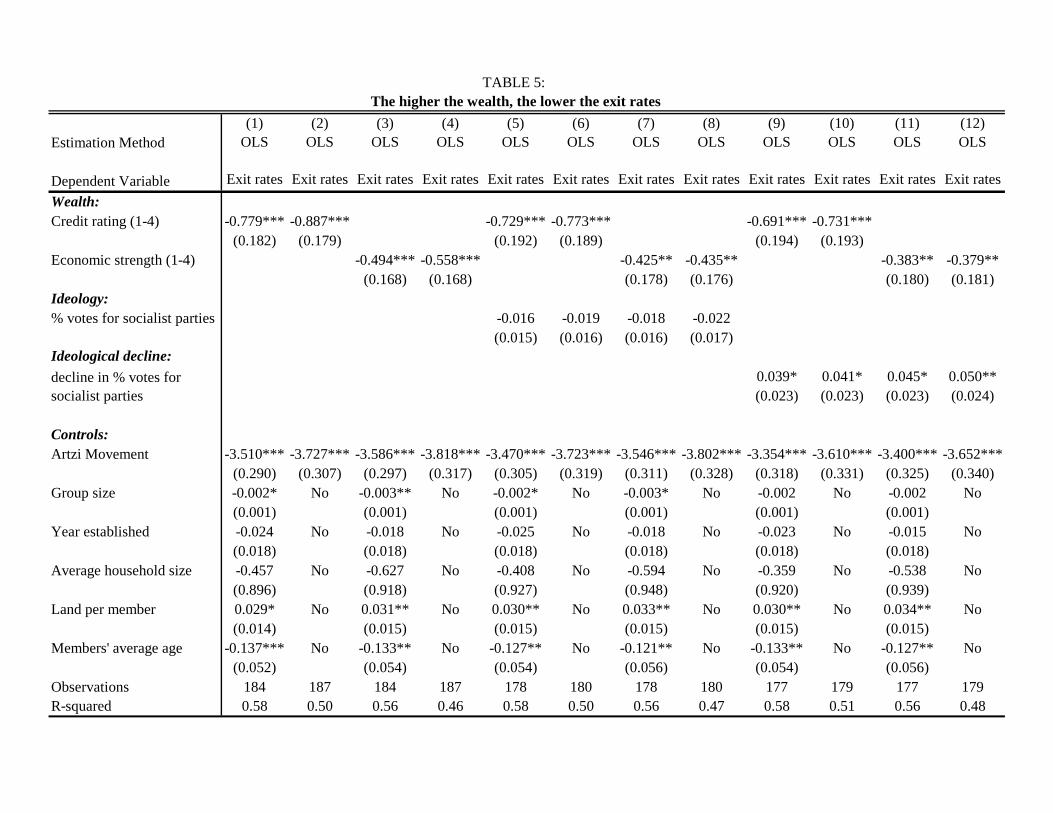
TABLE 5: The higher the wealth, the lower the exit rates
(1) (2) (3) (4) (5) (6) (7) (8) (9) (10) (11) (12)Estimation Method OLS OLS OLS OLS OLS OLS OLS OLS OLS OLS OLS OLS
Dependent Variable Exit rates Exit rates Exit rates Exit rates Exit rates Exit rates Exit rates Exit rates Exit rates Exit rates Exit rates Exit ratesWealth:Credit rating (1-4) -0.779*** -0.887*** -0.729*** -0.773*** -0.691*** -0.731***
(0.182) (0.179) (0.192) (0.189) (0.194) (0.193)Economic strength (1-4) -0.494*** -0.558*** -0.425** -0.435** -0.383** -0.379**
(0.168) (0.168) (0.178) (0.176) (0.180) (0.181)Ideology:% votes for socialist parties -0.016 -0.019 -0.018 -0.022
(0.015) (0.016) (0.016) (0.017)Ideological decline:
0.039* 0.041* 0.045* 0.050**(0.023) (0.023) (0.023) (0.024)
Controls:Artzi Movement -3.510*** -3.727*** -3.586*** -3.818*** -3.470*** -3.723*** -3.546*** -3.802*** -3.354*** -3.610*** -3.400*** -3.652***
(0.290) (0.307) (0.297) (0.317) (0.305) (0.319) (0.311) (0.328) (0.318) (0.331) (0.325) (0.340)Group size -0.002* No -0.003** No -0.002* No -0.003* No -0.002 No -0.002 No
(0.001) (0.001) (0.001) (0.001) (0.001) (0.001)Year established -0.024 No -0.018 No -0.025 No -0.018 No -0.023 No -0.015 No
(0.018) (0.018) (0.018) (0.018) (0.018) (0.018)Average household size -0.457 No -0.627 No -0.408 No -0.594 No -0.359 No -0.538 No
(0.896) (0.918) (0.927) (0.948) (0.920) (0.939)Land per member 0.029* No 0.031** No 0.030** No 0.033** No 0.030** No 0.034** No
(0.014) (0.015) (0.015) (0.015) (0.015) (0.015)Members' average age -0.137*** No -0.133** No -0.127** No -0.121** No -0.133** No -0.127** No
(0.052) (0.054) (0.054) (0.056) (0.054) (0.056)Observations 184 187 184 187 178 180 178 180 177 179 177 179R-squared 0.58 0.50 0.56 0.46 0.58 0.50 0.56 0.47 0.58 0.51 0.56 0.48
decline in % votes for socialist parties


Beyond kibbutzim: detailed discussion

Beyond kibbutzim Other communes; hunters and gatherers Organizations: professional partnerships,
cooperatives Development: village economies and group lending
in developing countries, communist countries, welfare states
 Labor: migration literature on selection of migrants Public: mobility limits redistribution Problem of “commons”: common ownership of
property as a solution rather than only a problem…

Lessons for other communes [back][1/6]
 Think communes aiming at equality/sharing
 Economic approach: communities striving for equality while mitigating the inherent problems associated with a high degree of equality:
Ç brain drainÇ moral hazardÇ adverse selection

On the (lack of) stability of communes…[back][2/6]
 These inherent problems meant most communes in history were short-lived
 Communes that were better able to structure themselves to solve these problems, such as the Hutterites, lasted longer and were more successful
 Communes’ attempts to solve these problems explain many of their common key features
The role of ideology and/or religion [back][3/6]
 Ideology and religion play important roles in alleviating:Ç brain drain: they increase members’ perceived value of
living in the commune, thereby alleviating brain drain Ç adverse selection: they serve as hard-to-fake signals of
commitment to the commune, thereby excluding free riders in entry
Ç moral hazard: they promote loyalty and norms of cooperation
 Religious communes tend to last longer… Rituals enhance stability…
Brief background on US communes [back][4/6]
 American communes have existed continuously since the mid-1700s
 US was a relatively attractive setting:Ç Freedom of religion (often religiously oppressed in Europe) Ç Abundance of land and opening up of West enabled communes to
acquire land at fairly low prices, with space for their isolation
 Long-lived communes: Shakers, Harmony, Zoar, Amana, Oneida and Hutterite communes
 Socialist communes began to appear in US in the 1820s More communes were established by socialist European
migrants, e.g. by the Icaria movement (founded in France)

Equal sharing and incentives in communes[back][5/6]Â Combining equal sharing with free exit threatens
the stability of communes through brain drain
 Evidence that more literate exited from and illiterate entered Shakers commune
 Evidence that moral hazard was a key concern
 Institutional design reflected attempt to maintain sharing while mitigating incentive problems…
Communes and the outside world [back][6/6]
 All communes struggled to find a balance between isolation and integration/assimilation
 Isolation alleviates incentive problems…but limits economic development…
 Three ways communes adapted to modernization:Ç Collapse…Ç Increased integration (kibbutz)…Ç Increased isolation (hutterites)…

Lessons for professional partnerships [back][1/2]
 Professional partnerships are often based on revenue sharing
 Revenue sharing provides insurance
 Partners have outside option and might leave
 Partners can’t recover some of their share upon leaving (e.g. customers)

Lessons for professional partnerships [back][2/2]Â Tendency for brain drain
 Sharing rule reflects tradeoff between insurance & brain drain
 “Lock in” required to make exit costly
 Mutual monitoring to prevent shirking and allow insurance

Lessons for village economies in developing countries [back]
 Village economies are often based on a large degree of equality (risk sharing), but not full equal sharing
 Could one reason be the exit option and imperfect monitoring?
 Could kibbutzim’s institutional design shed light on microfinance institutions such as group lending?

Lessons for migration [back][1/5]
 Does redistribution/wage-compression encourage the exit of more productive individuals and entry of less productive ones?

Are migrants positively or negatively selected? [back][2/5] Â Big debate in migration literature…
 View 1: migrants are always positively selected, because to make the move, you have to be motivated
 View 2: depends on the earnings inequality (returns to skills) in the origin vs. destination (based on the Roy model)

Borjas’ selection hypothesis [back][3/5] Selection depends on differences in earnings
inequality (redistribution) between origin and destination:
 Origin more equal than destination - positive selection
 Origin less equal than destination - negative selection

Testing selection hypothesis [back][4/5]
 Hypothesis generated a lot of attention
 But, its relevance was widely criticized:
1. Earnings inequality poorly measures returns to skills2. Most studies only observe migrants at destination3. No empirical evidence of negative selection
Using kibbutzim to test selection hypothesis [back][5/5]
 Internal migration from/to Israeli kibbutzim between 1983-1995
 Kibbutzim suitable to test selection hypothesis:1. Kibbutzim were based on intensive redistribution
(equal sharing) offered lower skill-premiathan cities
2. I compare movers to/from kibbutzim with stayers3. Test selection on both observables and unobservables

Public finance: mobility limits redistribution[back]Â Individuals might move between states to take
advantage of or avoid redistributive policies
 Kibbutz experience suggests such mobility limits redistribution/ equality…


Data Appendix
 Making all the kibbutz-level data I can publicly available
 This will allow other scholars to do more interesting research than I did…

Data sources: individual level
 Population censuses (1961, 1972, 1983, 1995, 2011?)
 Linked 1983-1995 censuses
 Labor forces surveys (annual 1979-2005)
 Education and occupation of applicants (1995-2000)
Data sources: kibbutz level Degree of equality (year and degree of shift from
equal sharing)Â Economic condition, wealth per member (post
reform)Â Ideology: movement affiliation, voting for socialist
parties in national elections (since 1950s)Â Population, membership, exit rates (since 1960s)Â Land per member, average household size, age
distribution (post reform)Â Education (by gender/exit status) since 1979Â Balance sheets (1937-1947, 2002)