Embed Size (px)
Citation preview
THE MUTUAL FACTOR:How Performance, Structure, and Focus Sets
Mutual Insurance Companies Apart
Copyright © 2018 by National Association of Mutual Insurance Companies. All rights reserved.
ROBERT P. HARTWIG, Ph.D., CPCUClinical Associate Professor, Finance DepartmentDirector, Center for Risk and Uncertainty ManagementDarla Moore School of BusinessUniversity of South Carolina
NEIL ALLDREDGESenior Vice President, Corporate AffairsNational Association of Mutual Insurance Companies
TABLE OF CONTENTS
INTRODUCTION & HISTORY 1
EXECUTIVE SUMMARY 3
THE DIFFERENCE BETWEEN MUTUAL & STOCK COMPANY COMBINED RATIOS 13
INDUSTRY PERFORMANCE STANDARDS 15
CONSUMER SURVEY 20
STATE OF MUTUALS 5
METHODOLOGY AND TECHNICAL NOTES 25

1
Introduction & HistoryMutual insurance companies represent a large and diverse segment of the property/casualty insurance industry. They account for nearly 40 percent of the total U.S. property/casualty insurance market, and in some states and lines of insurance, mutual companies insure well over half of the total market. Mutuals protect millions of policyholders by insuring nearly 60 percent of the homeowner’s insurance market and roughly half of the auto insurance coverage in the nation.
The defining difference between mutual insurers and stock insurers is that mutual companies operate solely for the benefit of their policyholders. Mutual insurers do not have shareholders – they do not have owners in the traditional sense of corporate stock/equity ownership. Instead, in addition to being customers, mutual policyholders possess distinct governance and other control rights in the company. The mutual insurer and its policyholders share an alignment of interests that is unique and without the potentially conflicting interest of shareholders who expect a return on their investment.
This report, by the National Association of Mutual Insurance Companies, provides an analysis of the marketplace performance of mutual property/casualty insurance companies. The objective of the report is to document some of the distinctions in key metrics of operating performance between mutual and stock insurers and the insurance industry overall during 2017.
NAMIC is proud to publish this report in partnership with Robert Hartwig, Ph.D., director of the Risk and Uncertainty Management Center in the Darla Moore School of Business at the University of South Carolina. This initial report will provide a benchmark for future comparison, with annual updates. Further, this report does provide some general information about the entire insurance industry that goes beyond just the performance of the mutual sector.
2
History of MutualsIn his 2017 paper “What It Means to be Mutual,” Lawrence S. Powell, Ph.D., executive director of the Alabama Center for Insurance Information and Research at the University of Alabama, recounted the history of the mutual insurance industry as shared with him by NAMIC. The following is an excerpt of that paper:
“Modern fire insurance began in London, England, following the Great Fire of London in 1666. The first operational insurer was the Insurance Office for Houses, a stock company located on the Royal Exchange and founded in 1681. Fifteen years later, Contributors for Insuring Houses, Chambers or Rooms from Loss by Fire by Amicable Contribution became the first mutual fire insurance company.
The first insurers in the United States were mutual companies, created by farmers and property owners with common interests looking to share risk within a large group. The earliest known U.S. insurer was the Friendly Society for Mutual Insurance of Houses Against Fire. The Friendly Society began operations in 1736 in Charles Town, South Carolina, but it failed four years later when the Great Fire of 1740 destroyed more than 300 houses.
In 1752, Benjamin Franklin and colleagues founded The Philadelphia Contributionship for the Insurance of Houses from Loss by Fire under the mutual principle “whereby every man might help another without any disservice to himself.” The Philadelphia Contributionship continues operations today as the oldest mutual insurer in the U.S.
While fire insurance continued to spread throughout New England and down the Eastern seaboard over the next several decades in a mix of mutual and stock companies, perhaps the largest catalyst for mutual insurance was the Homestead Act of 1862. It gave 160 acres of western farmland to any citizen willing to claim it. As the population moved west following the Civil War, homesteaders settling new farmland did not trust business and financial entities on the northeastern coast. These included the “trust” monopolies for railroad transportation, machinery, and banking, as well as the fire insurance industry. This sentiment led farmers to create their own social and political organizations, often called “Granges.” The Grange in each state lobbied for laws allowing formation of farm mutual fire insurance companies, and it often served as an organizational foundation for the state’s first farm mutual insurers. This early activity established the farm mutual movement in which approximately 1,100 county farm mutual insurance companies were formed between 1870 and 1900. The number of farm mutual companies grew through the first half of the 1920s, peaking near 2,000 in 1925. In the next several decades, as farms became larger and the number of farmers decreased, these companies consolidated and began to offer new insurance products.
3
This consolidation of companies and expansion of business lines gave us many of the mutual companies whose names we recognize today.”
Throughout their history, mutual companies have provided a stable economic platform, one that is not subject to the short-term perils of a particular storm or in need of meeting quarterly stock performance metrics. The mutual model provides a structure that has proven durable and compatible with the long-term nature of insurance needs. It is not a coincidence that 60 percent of the mutual insurance companies operating today are more than 100 years old, with the median age of 120.
Today, the mutual sector remains diverse with small niche writers, regional and super regional insurers, and national companies that are household names. As the mutual industry’s association, NAMIC’s own history follows closely with the creation and spread of mutuality. The association was founded in 1895 and today is the largest insurance company trade association in the United States.
Executive Summary of FindingsProperty/casualty insurance is a vast industry, with more than $550 billion in premiums written in 2017. It is an intensely competitive business as well, with dozens and sometimes hundreds of insurers competing for policyholders and premium dollars in some markets. Competition breeds diversity in approach to the assessment, pricing, and financing of risk. It is that diversity that is one of the insurance industry’s greatest assets and a key driver of the industry’s enduring strength in the face of often unforeseeable adversity and innumerable challenges.
Over the course of centuries, insurers have adopted and experimented with various operating models. Yet the roots of modern insurance originate indisputably with mutual insurers – entities organized for the sole benefit of their members. The understanding that mutual risks could be pooled to benefit all members of the pool is a simple and intuitive concept that dates back to ancient times and remains as relevant today as ever. Mutual insurers today compete with other insurers, particularly stock insurers that operate for the benefit of their investors. In recent years, capital markets have sought to play a larger role, particularly in the area of reinsurance.
The different organizational structures within the insurance industry naturally give rise to somewhat different approaches to the management and pricing of risk as well as investment strategies that, in turn, result in differences in operating performance.
4
The purpose of this report is to document some of the distinctions in key measures of operating performance between mutual and stock insurers and the industry overall during 2017. In this report, 16 metrics are compared across the mutual, stock, and “other” categories of insurer.1 Some of the key findings are as follows:
• While all insurers experienced higher underwriting losses in 2017 as a direct result of near-record catastrophe losses, mutual insurers experienced slightly higher underwriting losses relative to premiums than did stock insurers (inclusive of loss adjustment expenses), 77.1 percent vs. 74.0 percent.
• Expense ratios across all segments of the insurance industry were comparable, with the mutual, stock, and other segments of the industry all with a narrow range of 27 percent to 28 percent.
• Commission and brokerage expenses as a percentage of premiums written were slightly lower for mutual insurers (10.0 percent) than for stock insurers (11.7 percent).
• The dividend ratio, a gauge of the proportion of premium returned to policyholders, was eight times larger for mutuals (1.6 percent) than for stock companies (0.2 percent).
• Capital and surplus growth was strong across the industry in 2017, despite heavy catastrophe losses, with mutual insurers posting an increase of 8.1 percent compared to 9.5 percent for stock companies.
• The pace of increase in capital and surplus was nearly double that of premium growth in 2017, therefore reducing leverage industrywide – and thereby increasing the amount of capital standing behind each dollar of premium written. Mutual insurers were less leveraged than their stock counterparts last year, with $1.89 in policyholder surplus backing up each dollar in net premiums written compared to $1.64 for stock insurers.
• Low interest rates continued to weigh heavily on the industry, with the industrywide yield on invested assets remaining near 3 percent for mutual and stock companies alike, at or close to their lowest levels since the beginning of the financial crisis in 2008. Yields are slightly lower for mutual insurers, suggesting a somewhat more conservative fixed-income portfolio.
• The combination of elevated catastrophe activity and persistently low interest rates exerted negative pressure on insurer profitability in 2017, pushing return on surplus to the low-to-mid single digit range for many insurers. The return on average surplus for the mutual segment was 2.4 percent last year compared to 6.0 percent for stock insurers.
1 LLCs, U.S. branch of alien insurers, insurance pool of trusts, and syndicates.
5
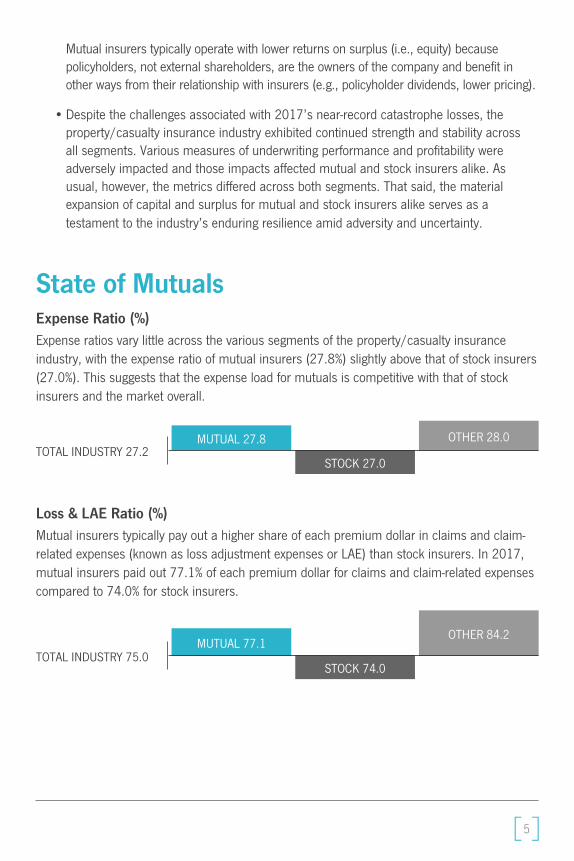
Mutual insurers typically operate with lower returns on surplus (i.e., equity) because policyholders, not external shareholders, are the owners of the company and benefit in other ways from their relationship with insurers (e.g., policyholder dividends, lower pricing).
• Despite the challenges associated with 2017’s near-record catastrophe losses, the property/casualty insurance industry exhibited continued strength and stability across all segments. Various measures of underwriting performance and profitability were adversely impacted and those impacts affected mutual and stock insurers alike. As usual, however, the metrics differed across both segments. That said, the material expansion of capital and surplus for mutual and stock insurers alike serves as a testament to the industry’s enduring resilience amid adversity and uncertainty.
State of MutualsExpense Ratio (%)Expense ratios vary little across the various segments of the property/casualty insurance industry, with the expense ratio of mutual insurers (27.8%) slightly above that of stock insurers (27.0%). This suggests that the expense load for mutuals is competitive with that of stock insurers and the market overall.
Loss & LAE Ratio (%)Mutual insurers typically pay out a higher share of each premium dollar in claims and claim-related expenses (known as loss adjustment expenses or LAE) than stock insurers. In 2017, mutual insurers paid out 77.1% of each premium dollar for claims and claim-related expenses compared to 74.0% for stock insurers.
MUTUAL 27.8TOTAL INDUSTRY 27.2
OTHER 28.0
STOCK 27.0
MUTUAL 77.1TOTAL INDUSTRY 75.0
OTHER 84.2
STOCK 74.0
6
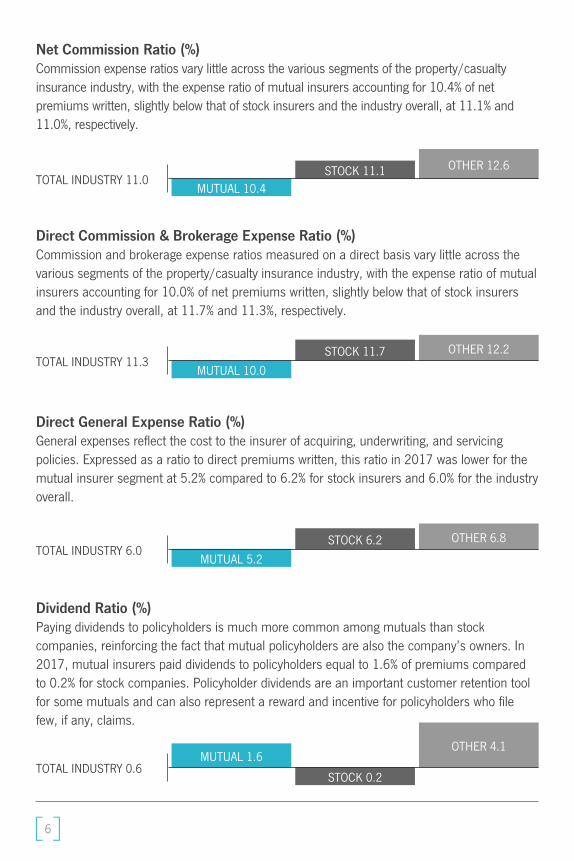
Net Commission Ratio (%)Commission expense ratios vary little across the various segments of the property/casualty insurance industry, with the expense ratio of mutual insurers accounting for 10.4% of net premiums written, slightly below that of stock insurers and the industry overall, at 11.1% and 11.0%, respectively.
Direct Commission & Brokerage Expense Ratio (%)Commission and brokerage expense ratios measured on a direct basis vary little across the various segments of the property/casualty insurance industry, with the expense ratio of mutual insurers accounting for 10.0% of net premiums written, slightly below that of stock insurers and the industry overall, at 11.7% and 11.3%, respectively.
Direct General Expense Ratio (%)General expenses reflect the cost to the insurer of acquiring, underwriting, and servicing policies. Expressed as a ratio to direct premiums written, this ratio in 2017 was lower for the mutual insurer segment at 5.2% compared to 6.2% for stock insurers and 6.0% for the industry overall.
Dividend Ratio (%)Paying dividends to policyholders is much more common among mutuals than stock companies, reinforcing the fact that mutual policyholders are also the company’s owners. In 2017, mutual insurers paid dividends to policyholders equal to 1.6% of premiums compared to 0.2% for stock companies. Policyholder dividends are an important customer retention tool for some mutuals and can also represent a reward and incentive for policyholders who file few, if any, claims.
MUTUAL 10.4TOTAL INDUSTRY 11.0
OTHER 12.6STOCK 11.1
MUTUAL 1.6TOTAL INDUSTRY 0.6
OTHER 4.1
STOCK 0.2
MUTUAL 10.0TOTAL INDUSTRY 11.3
OTHER 12.2STOCK 11.7
MUTUAL 5.2TOTAL INDUSTRY 6.0
OTHER 6.8STOCK 6.2
7
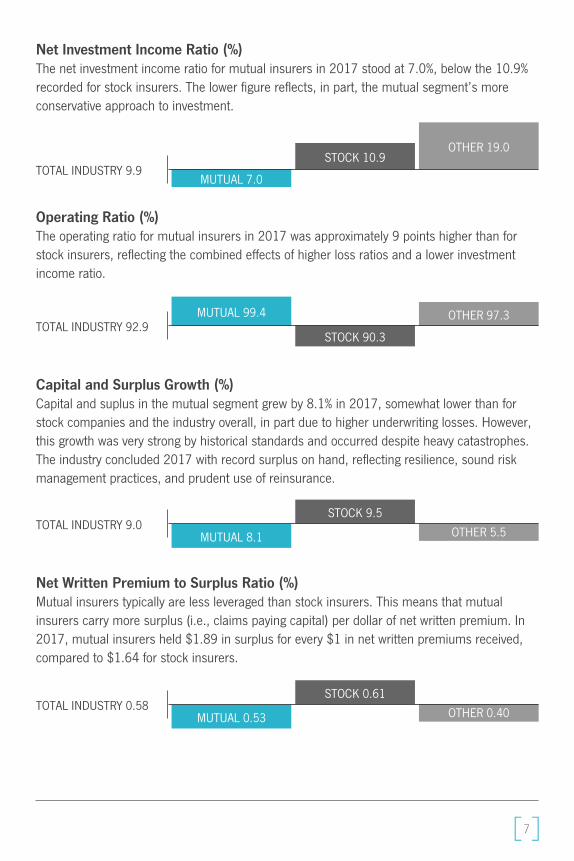
Net Investment Income Ratio (%)The net investment income ratio for mutual insurers in 2017 stood at 7.0%, below the 10.9% recorded for stock insurers. The lower figure reflects, in part, the mutual segment’s more conservative approach to investment.
Operating Ratio (%)The operating ratio for mutual insurers in 2017 was approximately 9 points higher than for stock insurers, reflecting the combined effects of higher loss ratios and a lower investment income ratio.
Capital and Surplus Growth (%)Capital and suplus in the mutual segment grew by 8.1% in 2017, somewhat lower than for stock companies and the industry overall, in part due to higher underwriting losses. However, this growth was very strong by historical standards and occurred despite heavy catastrophes. The industry concluded 2017 with record surplus on hand, reflecting resilience, sound risk management practices, and prudent use of reinsurance.
Net Written Premium to Surplus Ratio (%)Mutual insurers typically are less leveraged than stock insurers. This means that mutual insurers carry more surplus (i.e., claims paying capital) per dollar of net written premium. In 2017, mutual insurers held $1.89 in surplus for every $1 in net written premiums received, compared to $1.64 for stock insurers.
MUTUAL 7.0TOTAL INDUSTRY 9.9
OTHER 19.0STOCK 10.9
MUTUAL 99.4TOTAL INDUSTRY 92.9
OTHER 97.3
STOCK 90.3
MUTUAL 8.1TOTAL INDUSTRY 9.0 OTHER 5.5
STOCK 9.5
MUTUAL 0.53TOTAL INDUSTRY 0.58 OTHER 0.40
STOCK 0.61
8
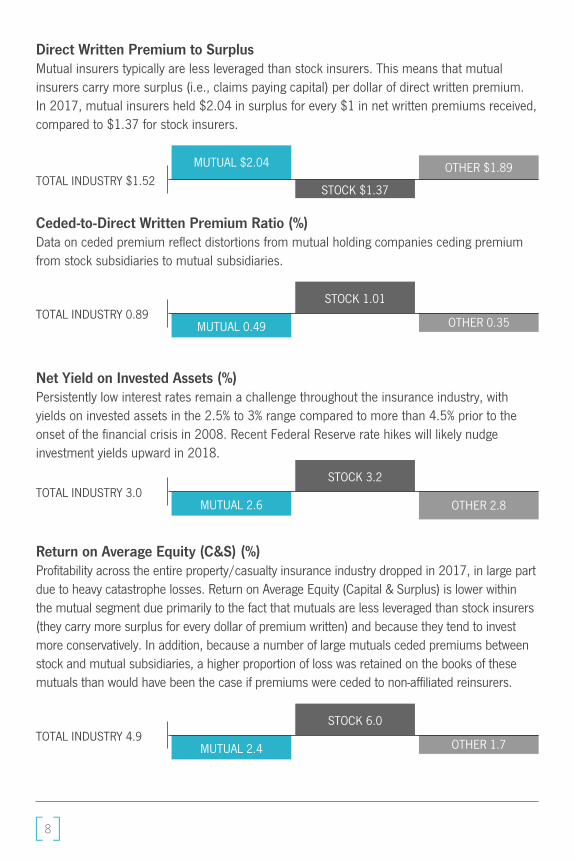
Direct Written Premium to SurplusMutual insurers typically are less leveraged than stock insurers. This means that mutual insurers carry more surplus (i.e., claims paying capital) per dollar of direct written premium. In 2017, mutual insurers held $2.04 in surplus for every $1 in net written premiums received, compared to $1.37 for stock insurers.
Ceded-to-Direct Written Premium Ratio (%)Data on ceded premium reflect distortions from mutual holding companies ceding premium from stock subsidiaries to mutual subsidiaries.
Net Yield on Invested Assets (%)Persistently low interest rates remain a challenge throughout the insurance industry, with yields on invested assets in the 2.5% to 3% range compared to more than 4.5% prior to the onset of the financial crisis in 2008. Recent Federal Reserve rate hikes will likely nudge investment yields upward in 2018.
Return on Average Equity (C&S) (%)Profitability across the entire property/casualty insurance industry dropped in 2017, in large part due to heavy catastrophe losses. Return on Average Equity (Capital & Surplus) is lower within the mutual segment due primarily to the fact that mutuals are less leveraged than stock insurers (they carry more surplus for every dollar of premium written) and because they tend to invest more conservatively. In addition, because a number of large mutuals ceded premiums between stock and mutual subsidiaries, a higher proportion of loss was retained on the books of these mutuals than would have been the case if premiums were ceded to non-affiliated reinsurers.
MUTUAL $2.04TOTAL INDUSTRY $1.52
OTHER $1.89
STOCK $1.37
MUTUAL 0.49TOTAL INDUSTRY 0.89
OTHER 0.35
STOCK 1.01
MUTUAL 2.6TOTAL INDUSTRY 3.0
OTHER 2.8
STOCK 3.2
MUTUAL 2.4TOTAL INDUSTRY 4.9
OTHER 1.7
STOCK 6.0
9
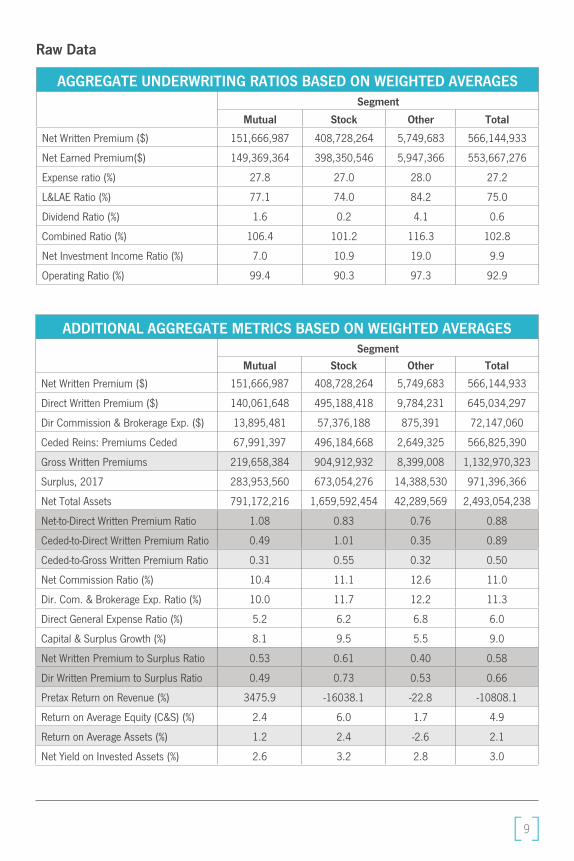
Raw Data
AGGREGATE UNDERWRITING RATIOS BASED ON WEIGHTED AVERAGESSegment
Mutual Stock Other Total
Net Written Premium ($) 151,666,987 408,728,264 5,749,683 566,144,933
Net Earned Premium($) 149,369,364 398,350,546 5,947,366 553,667,276
Expense ratio (%) 27.8 27.0 28.0 27.2
L&LAE Ratio (%) 77.1 74.0 84.2 75.0
Dividend Ratio (%) 1.6 0.2 4.1 0.6
Combined Ratio (%) 106.4 101.2 116.3 102.8
Net Investment Income Ratio (%) 7.0 10.9 19.0 9.9
Operating Ratio (%) 99.4 90.3 97.3 92.9
ADDITIONAL AGGREGATE METRICS BASED ON WEIGHTED AVERAGESSegment
Mutual Stock Other Total
Net Written Premium ($) 151,666,987 408,728,264 5,749,683 566,144,933
Direct Written Premium ($) 140,061,648 495,188,418 9,784,231 645,034,297
Dir Commission & Brokerage Exp. ($) 13,895,481 57,376,188 875,391 72,147,060
Ceded Reins: Premiums Ceded 67,991,397 496,184,668 2,649,325 566,825,390
Gross Written Premiums 219,658,384 904,912,932 8,399,008 1,132,970,323
Surplus, 2017 283,953,560 673,054,276 14,388,530 971,396,366
Net Total Assets 791,172,216 1,659,592,454 42,289,569 2,493,054,238
Net-to-Direct Written Premium Ratio 1.08 0.83 0.76 0.88
Ceded-to-Direct Written Premium Ratio 0.49 1.01 0.35 0.89
Ceded-to-Gross Written Premium Ratio 0.31 0.55 0.32 0.50
Net Commission Ratio (%) 10.4 11.1 12.6 11.0
Dir. Com. & Brokerage Exp. Ratio (%) 10.0 11.7 12.2 11.3
Direct General Expense Ratio (%) 5.2 6.2 6.8 6.0
Capital & Surplus Growth (%) 8.1 9.5 5.5 9.0
Net Written Premium to Surplus Ratio 0.53 0.61 0.40 0.58
Dir Written Premium to Surplus Ratio 0.49 0.73 0.53 0.66
Pretax Return on Revenue (%) 3475.9 -16038.1 -22.8 -10808.1
Return on Average Equity (C&S) (%) 2.4 6.0 1.7 4.9
Return on Average Assets (%) 1.2 2.4 -2.6 2.1
Net Yield on Invested Assets (%) 2.6 3.2 2.8 3.0
10
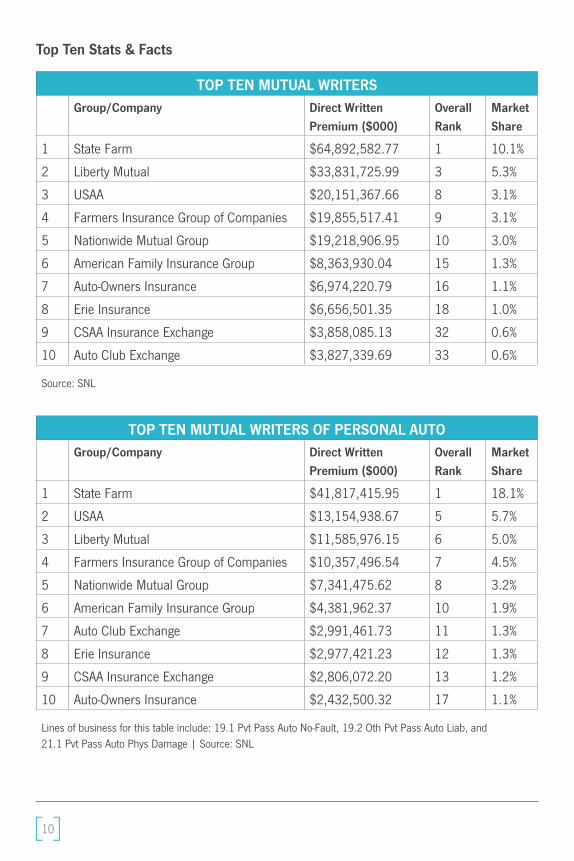
Top Ten Stats & Facts
TOP TEN MUTUAL WRITERSGroup/Company Direct Written
Premium ($000)Overall Rank
Market Share
1 State Farm $64,892,582.77 1 10.1%
2 Liberty Mutual $33,831,725.99 3 5.3%
3 USAA $20,151,367.66 8 3.1%
4 Farmers Insurance Group of Companies $19,855,517.41 9 3.1%
5 Nationwide Mutual Group $19,218,906.95 10 3.0%
6 American Family Insurance Group $8,363,930.04 15 1.3%
7 Auto-Owners Insurance $6,974,220.79 16 1.1%
8 Erie Insurance $6,656,501.35 18 1.0%
9 CSAA Insurance Exchange $3,858,085.13 32 0.6%
10 Auto Club Exchange $3,827,339.69 33 0.6%
Source: SNL
TOP TEN MUTUAL WRITERS OF PERSONAL AUTOGroup/Company Direct Written
Premium ($000)Overall Rank
Market Share
1 State Farm $41,817,415.95 1 18.1%
2 USAA $13,154,938.67 5 5.7%
3 Liberty Mutual $11,585,976.15 6 5.0%
4 Farmers Insurance Group of Companies $10,357,496.54 7 4.5%
5 Nationwide Mutual Group $7,341,475.62 8 3.2%
6 American Family Insurance Group $4,381,962.37 10 1.9%
7 Auto Club Exchange $2,991,461.73 11 1.3%
8 Erie Insurance $2,977,421.23 12 1.3%
9 CSAA Insurance Exchange $2,806,072.20 13 1.2%
10 Auto-Owners Insurance $2,432,500.32 17 1.1%
Lines of business for this table include: 19.1 Pvt Pass Auto No-Fault, 19.2 Oth Pvt Pass Auto Liab, and 21.1 Pvt Pass Auto Phys Damage | Source: SNL
11
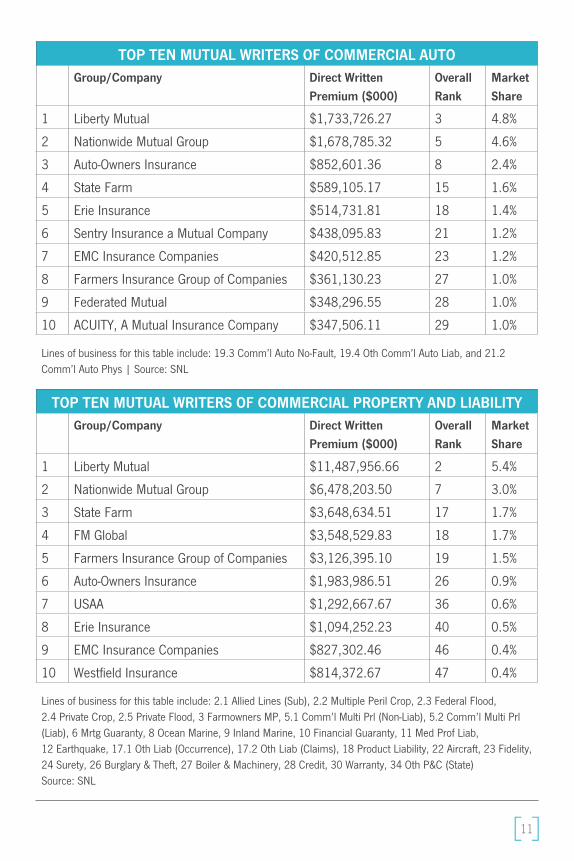
TOP TEN MUTUAL WRITERS OF COMMERCIAL PROPERTY AND LIABILITYGroup/Company Direct Written
Premium ($000)Overall Rank
Market Share
1 Liberty Mutual $11,487,956.66 2 5.4%
2 Nationwide Mutual Group $6,478,203.50 7 3.0%
3 State Farm $3,648,634.51 17 1.7%
4 FM Global $3,548,529.83 18 1.7%
5 Farmers Insurance Group of Companies $3,126,395.10 19 1.5%
6 Auto-Owners Insurance $1,983,986.51 26 0.9%
7 USAA $1,292,667.67 36 0.6%
8 Erie Insurance $1,094,252.23 40 0.5%
9 EMC Insurance Companies $827,302.46 46 0.4%
10 Westfield Insurance $814,372.67 47 0.4%
Lines of business for this table include: 2.1 Allied Lines (Sub), 2.2 Multiple Peril Crop, 2.3 Federal Flood, 2.4 Private Crop, 2.5 Private Flood, 3 Farmowners MP, 5.1 Comm’l Multi Prl (Non-Liab), 5.2 Comm’l Multi Prl (Liab), 6 Mrtg Guaranty, 8 Ocean Marine, 9 Inland Marine, 10 Financial Guaranty, 11 Med Prof Liab, 12 Earthquake, 17.1 Oth Liab (Occurrence), 17.2 Oth Liab (Claims), 18 Product Liability, 22 Aircraft, 23 Fidelity, 24 Surety, 26 Burglary & Theft, 27 Boiler & Machinery, 28 Credit, 30 Warranty, 34 Oth P&C (State)Source: SNL
TOP TEN MUTUAL WRITERS OF COMMERCIAL AUTOGroup/Company Direct Written
Premium ($000)Overall Rank
Market Share
1 Liberty Mutual $1,733,726.27 3 4.8%
2 Nationwide Mutual Group $1,678,785.32 5 4.6%
3 Auto-Owners Insurance $852,601.36 8 2.4%
4 State Farm $589,105.17 15 1.6%
5 Erie Insurance $514,731.81 18 1.4%
6 Sentry Insurance a Mutual Company $438,095.83 21 1.2%
7 EMC Insurance Companies $420,512.85 23 1.2%
8 Farmers Insurance Group of Companies $361,130.23 27 1.0%
9 Federated Mutual $348,296.55 28 1.0%
10 ACUITY, A Mutual Insurance Company $347,506.11 29 1.0%
Lines of business for this table include: 19.3 Comm’l Auto No-Fault, 19.4 Oth Comm’l Auto Liab, and 21.2 Comm’l Auto Phys | Source: SNL
12
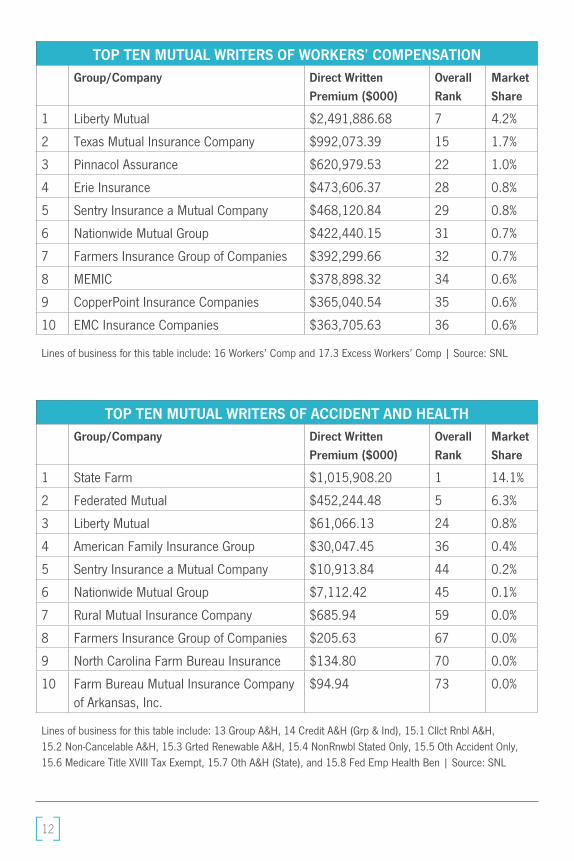
TOP TEN MUTUAL WRITERS OF WORKERS’ COMPENSATIONGroup/Company Direct Written
Premium ($000)Overall Rank
Market Share
1 Liberty Mutual $2,491,886.68 7 4.2%
2 Texas Mutual Insurance Company $992,073.39 15 1.7%
3 Pinnacol Assurance $620,979.53 22 1.0%
4 Erie Insurance $473,606.37 28 0.8%
5 Sentry Insurance a Mutual Company $468,120.84 29 0.8%
6 Nationwide Mutual Group $422,440.15 31 0.7%
7 Farmers Insurance Group of Companies $392,299.66 32 0.7%
8 MEMIC $378,898.32 34 0.6%
9 CopperPoint Insurance Companies $365,040.54 35 0.6%
10 EMC Insurance Companies $363,705.63 36 0.6%
Lines of business for this table include: 16 Workers’ Comp and 17.3 Excess Workers’ Comp | Source: SNL
TOP TEN MUTUAL WRITERS OF ACCIDENT AND HEALTHGroup/Company Direct Written
Premium ($000)Overall Rank
Market Share
1 State Farm $1,015,908.20 1 14.1%
2 Federated Mutual $452,244.48 5 6.3%
3 Liberty Mutual $61,066.13 24 0.8%
4 American Family Insurance Group $30,047.45 36 0.4%
5 Sentry Insurance a Mutual Company $10,913.84 44 0.2%
6 Nationwide Mutual Group $7,112.42 45 0.1%
7 Rural Mutual Insurance Company $685.94 59 0.0%
8 Farmers Insurance Group of Companies $205.63 67 0.0%
9 North Carolina Farm Bureau Insurance $134.80 70 0.0%
10 Farm Bureau Mutual Insurance Company of Arkansas, Inc.
$94.94 73 0.0%
Lines of business for this table include: 13 Group A&H, 14 Credit A&H (Grp & Ind), 15.1 Cllct Rnbl A&H, 15.2 Non-Cancelable A&H, 15.3 Grted Renewable A&H, 15.4 NonRnwbl Stated Only, 15.5 Oth Accident Only, 15.6 Medicare Title XVIII Tax Exempt, 15.7 Oth A&H (State), and 15.8 Fed Emp Health Ben | Source: SNL
13
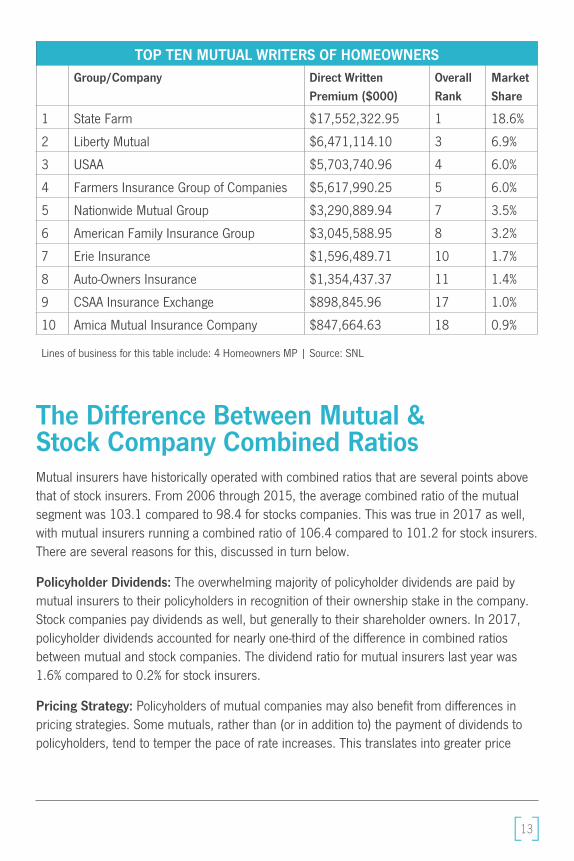
The Difference Between Mutual & Stock Company Combined RatiosMutual insurers have historically operated with combined ratios that are several points above that of stock insurers. From 2006 through 2015, the average combined ratio of the mutual segment was 103.1 compared to 98.4 for stocks companies. This was true in 2017 as well, with mutual insurers running a combined ratio of 106.4 compared to 101.2 for stock insurers. There are several reasons for this, discussed in turn below.
Policyholder Dividends: The overwhelming majority of policyholder dividends are paid by mutual insurers to their policyholders in recognition of their ownership stake in the company. Stock companies pay dividends as well, but generally to their shareholder owners. In 2017, policyholder dividends accounted for nearly one-third of the difference in combined ratios between mutual and stock companies. The dividend ratio for mutual insurers last year was 1.6% compared to 0.2% for stock insurers.
Pricing Strategy: Policyholders of mutual companies may also benefit from differences in pricing strategies. Some mutuals, rather than (or in addition to) the payment of dividends to policyholders, tend to temper the pace of rate increases. This translates into greater price
TOP TEN MUTUAL WRITERS OF HOMEOWNERSGroup/Company Direct Written
Premium ($000)Overall Rank
Market Share
1 State Farm $17,552,322.95 1 18.6%
2 Liberty Mutual $6,471,114.10 3 6.9%
3 USAA $5,703,740.96 4 6.0%
4 Farmers Insurance Group of Companies $5,617,990.25 5 6.0%
5 Nationwide Mutual Group $3,290,889.94 7 3.5%
6 American Family Insurance Group $3,045,588.95 8 3.2%
7 Erie Insurance $1,596,489.71 10 1.7%
8 Auto-Owners Insurance $1,354,437.37 11 1.4%
9 CSAA Insurance Exchange $898,845.96 17 1.0%
10 Amica Mutual Insurance Company $847,664.63 18 0.9%
Lines of business for this table include: 4 Homeowners MP | Source: SNL
14
stability and lower relative premiums for policyholders. At the same time, a slower pace of rate increase for mutuals will generally lead to loss ratios and ultimately combined ratios that are higher than those of stock companies, which tend to seek rate increases more rapidly and of a larger magnitude. Stock insurers are obliged to operate in this manner because their focus is to maximize returns for their shareholders. Mutual insurers over the long-run must operate profitably, of course but with their primary objective being growth of surplus. Consequently, mutual insurers do not generally face the same degree of immediacy with respect to the need to increase rates that in turn benefits policyholders as the mutual insurer will pay out a higher share of each premium dollar collected from customers.
Note that this does not mean that the average cost per claim (i.e., claim severity) is higher for mutuals. It simply means that mutual insurers, on average, absorb proportionately more losses than do stock companies.
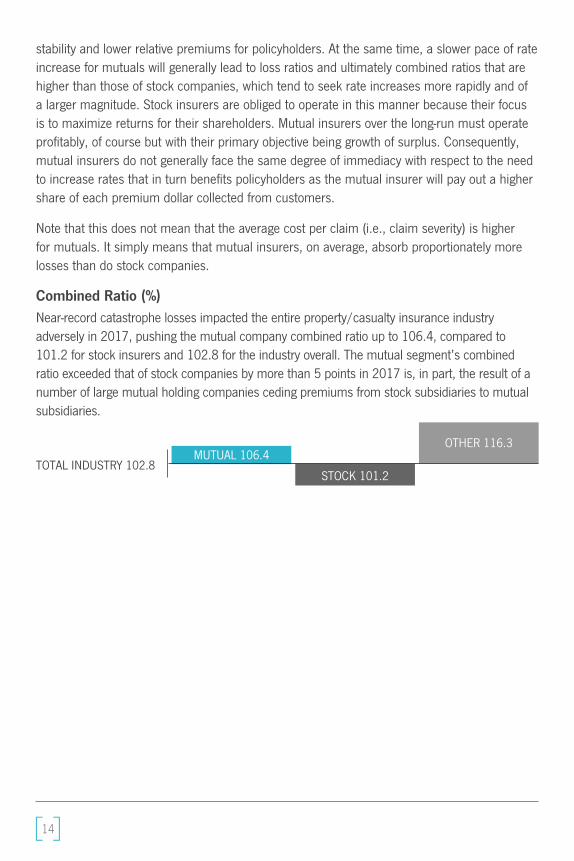
Combined Ratio (%)Near-record catastrophe losses impacted the entire property/casualty insurance industry adversely in 2017, pushing the mutual company combined ratio up to 106.4, compared to 101.2 for stock insurers and 102.8 for the industry overall. The mutual segment’s combined ratio exceeded that of stock companies by more than 5 points in 2017 is, in part, the result of a number of large mutual holding companies ceding premiums from stock subsidiaries to mutual subsidiaries.
MUTUAL 106.4TOTAL INDUSTRY 102.8
OTHER 116.3
STOCK 101.2
15
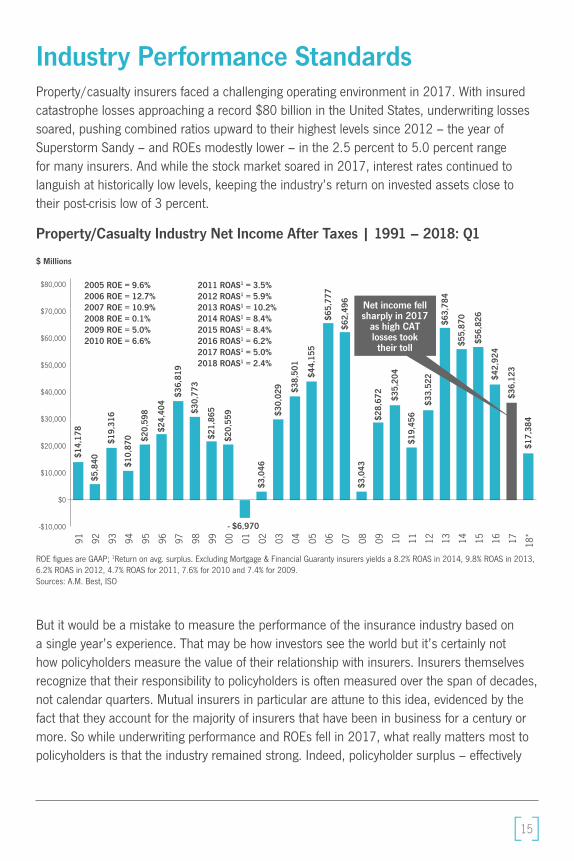
Industry Performance StandardsProperty/casualty insurers faced a challenging operating environment in 2017. With insured catastrophe losses approaching a record $80 billion in the United States, underwriting losses soared, pushing combined ratios upward to their highest levels since 2012 – the year of Superstorm Sandy – and ROEs modestly lower – in the 2.5 percent to 5.0 percent range for many insurers. And while the stock market soared in 2017, interest rates continued to languish at historically low levels, keeping the industry’s return on invested assets close to their post-crisis low of 3 percent.
Property/Casualty Industry Net Income After Taxes | 1991 – 2018: Q1
But it would be a mistake to measure the performance of the insurance industry based on a single year’s experience. That may be how investors see the world but it’s certainly not how policyholders measure the value of their relationship with insurers. Insurers themselves recognize that their responsibility to policyholders is often measured over the span of decades, not calendar quarters. Mutual insurers in particular are attune to this idea, evidenced by the fact that they account for the majority of insurers that have been in business for a century or more. So while underwriting performance and ROEs fell in 2017, what really matters most to policyholders is that the industry remained strong. Indeed, policyholder surplus – effectively
Net income fell sharply in 2017
as high CAT losses took
their toll
$14
,178
$5
,840
$19
,316
$1
0,87
0
$20
,598
$24,
404
$3
6,81
9
$30
,773
$2
1,86
5
$20
,559
$3,0
46
$30
,029
$
38,5
01
$44
,155
$6
5,77
7
$
62,4
96
$3,0
43
$
28,6
72
$
35,2
04
$1
9,45
6
$33
,522
$63
,784
$
55,8
70
$
56,8
26
$42
,924
$
36,1
23
$17
,384
$80,000
$70,000
$60,000
$50,000
$40,000
$30,000
$20,000
$10,000
$0
-$10,000
$ Millions
91 92 93 94 95 96 97 98 99 00 01 02 03 04 05 06 07 08 09 10 11 12 13 14 15 16 17 18*
2005 ROE = 9.6%2006 ROE = 12.7%2007 ROE = 10.9%2008 ROE = 0.1%2009 ROE = 5.0%2010 ROE = 6.6%
2011 ROAS1 = 3.5%2012 ROAS1 = 5.9%2013 ROAS1 = 10.2%2014 ROAS1 = 8.4%2015 ROAS1 = 8.4%2016 ROAS1 = 6.2%2017 ROAS1 = 5.0%2018 ROAS1 = 2.4%
ROE figues are GAAP; 1Return on avg. surplus. Excluding Mortgage & Financial Guaranty insurers yields a 8.2% ROAS in 2014, 9.8% ROAS in 2013, 6.2% ROAS in 2012, 4.7% ROAS for 2011, 7.6% for 2010 and 7.4% for 2009.Sources: A.M. Best, ISO
- $6,970
16
the pool of capital available to pay claims – increased to a record high in 2017, exceeding $900 billion. The bottom line is that the industry entered 2017 in rock-solid shape and ended the year even stronger, despite the fury of Mother Nature.
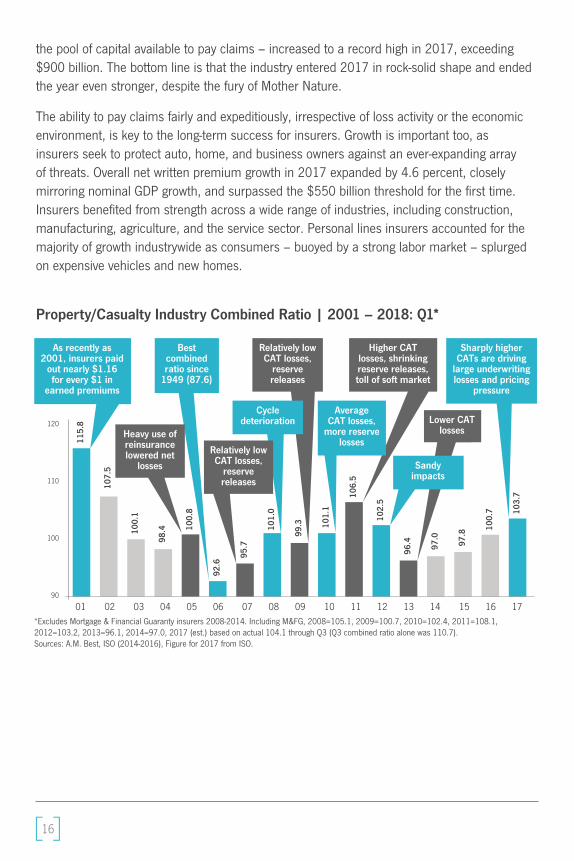
The ability to pay claims fairly and expeditiously, irrespective of loss activity or the economic environment, is key to the long-term success for insurers. Growth is important too, as insurers seek to protect auto, home, and business owners against an ever-expanding array of threats. Overall net written premium growth in 2017 expanded by 4.6 percent, closely mirroring nominal GDP growth, and surpassed the $550 billion threshold for the first time. Insurers benefited from strength across a wide range of industries, including construction, manufacturing, agriculture, and the service sector. Personal lines insurers accounted for the majority of growth industrywide as consumers – buoyed by a strong labor market – splurged on expensive vehicles and new homes.
Property/Casualty Industry Combined Ratio | 2001 – 2018: Q1*
Lower CAT losses
Higher CAT losses, shrinking reserve releases, toll of soft market
Best combined ratio since
1949 (87.6)
Sandy impacts
Average CAT losses,
more reserve losses
Relatively low CAT losses,
reserve releases
1
15.8
107
.5
100
.1
98.4 10
0.8
92.
6 95.
7
101.
0
99.3 101
.1
106
.5
1
02.5
96.4
97.
0
97.
8 100.
7
103
.7
120
110
100
90
01 02 03 04 05 06 07 08 09 10 11 12 13 14 15 16 17*Excludes Mortgage & Financial Guaranty insurers 2008-2014. Including M&FG, 2008=105.1, 2009=100.7, 2010=102.4, 2011=108.1, 2012=103.2, 2013=96.1, 2014=97.0, 2017 (est.) based on actual 104.1 through Q3 (Q3 combined ratio alone was 110.7).Sources: A.M. Best, ISO (2014-2016), Figure for 2017 from ISO.
As recently as 2001, insurers paid
out nearly $1.16 for every $1 in
earned premiums
Heavy use of reinsurance lowered net
losses
Cycle deterioration
Relatively low CAT losses,
reserve releases
Sharply higher CATs are driving
large underwriting losses and pricing
pressure
17
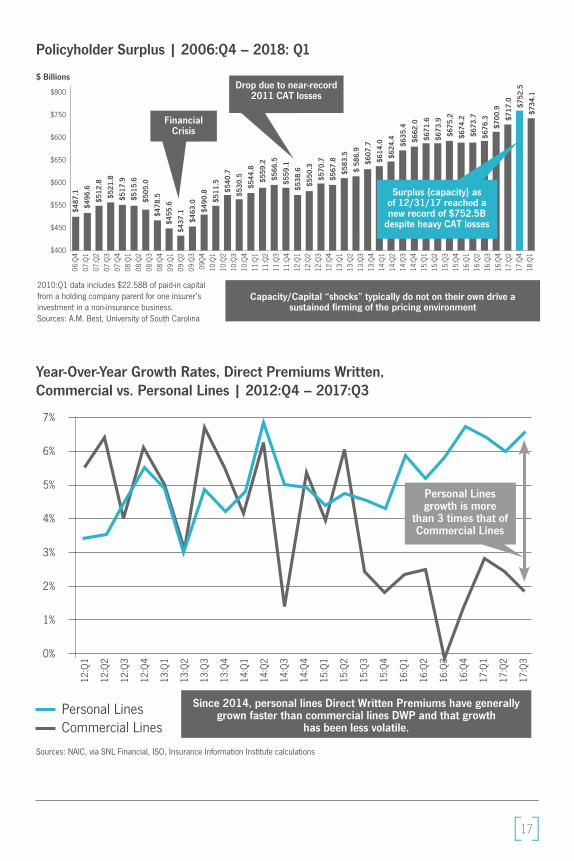
Policyholder Surplus | 2006:Q4 – 2018: Q1
Year-Over-Year Growth Rates, Direct Premiums Written, Commercial vs. Personal Lines | 2012:Q4 – 2017:Q3
$
487.
1
$49
6.6
$
512.
8
$521
.8
$
517.
9
$
515.
6
$
505.
0
$4
78.5
$
455.
6
$43
7.1
$463
.0
$
490.
8
$
511.
5
$5
40.7
$53
0.5
$
544.
8
$55
9.2
$5
66.5
$55
9.1
$
538.
6
$550
.3
$5
70.7
$5
67.8
$583
.5
$
$ 5
86.9
$
607.
7
$614
.0
$62
4.4
$63
5.4
$
662.
0
$
671.
6
$
673.
9
$67
5.2
$674
.2
$67
3.7
$676
.3
$
700.
9
$7
17.0
$
752.
5
$734
.1$800
$750
$600
$650
$600
$550
$450
$400
$ Billions06
:Q4
07:Q
107
:Q2
07:Q
307
:Q4
08:Q
108
:Q2
08:Q
308
:Q4
09:Q
109
:Q2
09:Q
309
Q4
10:Q
110
:Q2
10:Q
310
:Q4
11:Q
111
:Q2
11:Q
311
:Q4
12:Q
112
:Q2
12:Q
312
:Q4
13:Q
113
:Q2
13:Q
313
:Q4
14:Q
114
:Q2
14:Q
314
:Q4
15:Q
115
:Q2
15:Q
315
:Q4
16:Q
116
:Q2
16:Q
316
:Q4
17:Q
217
:Q4
18:Q
1
2010:Q1 data includes $22.58B of paid-in capital from a holding company parent for one insurer’s investment in a non-insurance business.Sources: A.M. Best, University of South Carolina
Drop due to near-record 2011 CAT losses
Financial Crisis
Capacity/Capital “shocks” typically do not on their own drive a sustained firming of the pricing environment
Surplus (capacity) as of 12/31/17 reached a new record of $752.5B
despite heavy CAT losses
7%
6%
5%
4%
3%
2%
1%
0%
Sources: NAIC, via SNL Financial, ISO, Insurance Information Institute calculations
12:Q
1
12:Q
2
12:Q
3
12:Q
4
13:Q
1
13:Q
2
13:Q
3
13:Q
4
14:Q
1
14:Q
2
14:Q
3
14:Q
4
15:Q
1
15:Q
2
15:Q
3
15:Q
4
16:Q
1
16:Q
2
16:Q
3
16:Q
4
17:Q
1
17:Q
2
17:Q
3
Since 2014, personal lines Direct Written Premiums have generally grown faster than commercial lines DWP and that growth
has been less volatile.Personal LinesCommercial Lines
Personal Lines growth is more
than 3 times that of Commercial Lines
18
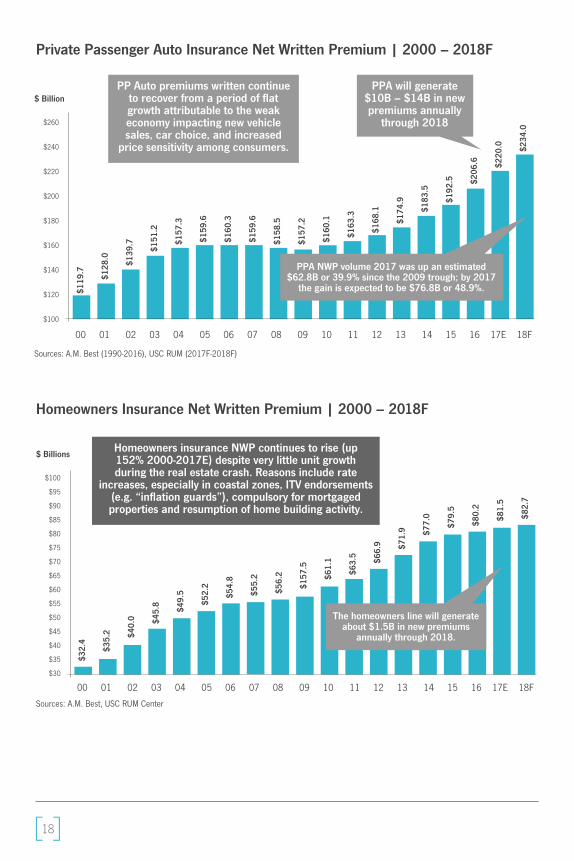
Private Passenger Auto Insurance Net Written Premium | 2000 – 2018F
Homeowners Insurance Net Written Premium | 2000 – 2018F
$119
.7
$128
.0
$139
.7
$151
.2
$1
57.3
$
159.
6
$
160.
3
$
159.
6
$1
58.5
$1
57.2
$
160.
1
$163
.3
$16
8.1
$174
.9
$
183.
5
$1
92.5
$
206.
6
$220
.0
$23
4.0$260
$240
$220
$200
$180
$160
$140
$120
$100
00 01 02 03 04 05 06 07 08 09 10 11 12 13 14 15 16 17E 18F
Sources: A.M. Best (1990-2016), USC RUM (2017F-2018F)
$ Billion
PPA NWP volume 2017 was up an estimated $62.8B or 39.9% since the 2009 trough; by 2017
the gain is expected to be $76.8B or 48.9%.
PPA will generate $10B – $14B in new premiums annually
through 2018
PP Auto premiums written continue to recover from a period of flat growth attributable to the weak economy impacting new vehicle sales, car choice, and increased
price sensitivity among consumers.
$32.
4
$
35.2
$
40.0
$
45.8
$4
9.5
$52.
2
$5
4.8
$
55.2
$
56.2
$15
7.5
$
61.1
$63
.5
$66.
9
$71.
9
$77.
0
0
$7
9.5
$
80.2
2
$81.
5
$82
.7
$100
$95
$90
$85
$80
$75
$70
$65
$60
$55
$50
$45
$40
$35
$30
00 01 02 03 04 05 06 07 08 09 10 11 12 13 14 15 16 17E 18F
Sources: A.M. Best, USC RUM Center
$ BillionsHomeowners insurance NWP continues to rise (up 152% 2000-2017E) despite very little unit growth during the real estate crash. Reasons include rate
increases, especially in coastal zones, ITV endorsements (e.g. “inflation guards”), compulsory for mortgaged properties and resumption of home building activity.
The homeowners line will generate about $1.5B in new premiums
annually through 2018.
19
Looking ahead, the industry’s future is one that is full of both challenges and opportunities. Economic and political uncertainties roiled capital markets through the first eight months of 2018. The imposition of tariffs, for example, on a wide range of imported products, including auto parts and lumber, is driving up claim severities in auto and property lines. At the same time, insurers are providing state-of-the-art solutions across a wide array of risk management challenges – from cyber and private flood insurance to active assailant coverages.
The underwriting and overall financial performance of the property/casualty insurance industry are historically both volatile and cyclical – with 2017 exemplifying both. Yet the industry – focused on the long run and its responsibility to tens of millions of policyholders – remains strong, stable, sound, and secure.
Top Growth Factors: Personal Lines
Rate: Favorable rate trends in both auto and home
• Adverse severity trends are pressuring personal auto
• Record CAT losses in 2017 will further pressure homeowner’s line
Economic Strength: Economic growth, supported by low unemployment, tax cuts, and rising consumer confidence are supporting strength in new auto sales and new home construction
Household Formation: Millennials are finally becoming car and home buyers in larger numbers, driving exposures upward
High Net-Worth Customers: This segment has seen consistent (and profitable) growth as the “wealth effect” grows
Driving More: Americans are behind the wheel more than ever
Market Discipline: Major personal insurers remain generally price disciplined
20
Consumer Survey In 2018 NAMIC conducted a public opinion survey to gauge consumer knowledge regarding mutual companies and the concept of mutuality. A summary of the highlights of the survey is included here. While not necessarily about the performance of mutual companies, the survey does provide some interesting findings regarding the industry.
The consumer survey was conducted to provide NAMIC membership with data on the current reputation of mutual insurance companies among purchasers of auto and home insurance. The study is intended to provide a benchmark against which changes in the industry’s reputation among consumer insurance buyers can be tracked over time. The research results are based on a national sample of 1,001 car and/or home insurance buyers, who are the sole or joint decision makers for insurance purchases. The survey has a margin of error +/- 5 percent.
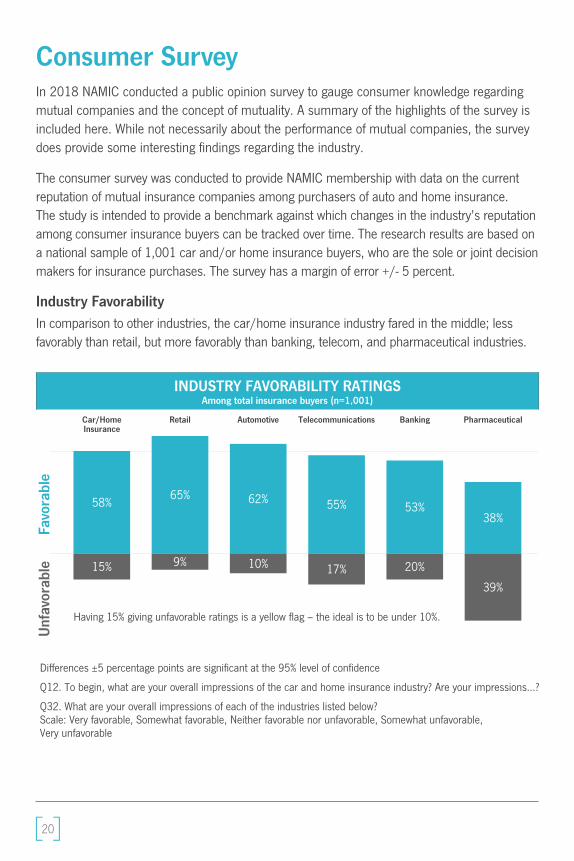
Industry FavorabilityIn comparison to other industries, the car/home insurance industry fared in the middle; less favorably than retail, but more favorably than banking, telecom, and pharmaceutical industries.
58%
15%
65%
9%
62%
10%
55%
17%
53%
20%
38%
39%
Favo
rabl
eU
nfav
orab
le
INDUSTRY FAVORABILITY RATINGSAmong total insurance buyers (n=1,001)
RetailCar/Home Insurance
Automotive Telecommunications Banking Pharmaceutical
Having 15% giving unfavorable ratings is a yellow flag – the ideal is to be under 10%.
Differences ±5 percentage points are significant at the 95% level of confidence
Q12. To begin, what are your overall impressions of the car and home insurance industry? Are your impressions…?
Q32. What are your overall impressions of each of the industries listed below? Scale: Very favorable, Somewhat favorable, Neither favorable nor unfavorable, Somewhat unfavorable, Very unfavorable
21
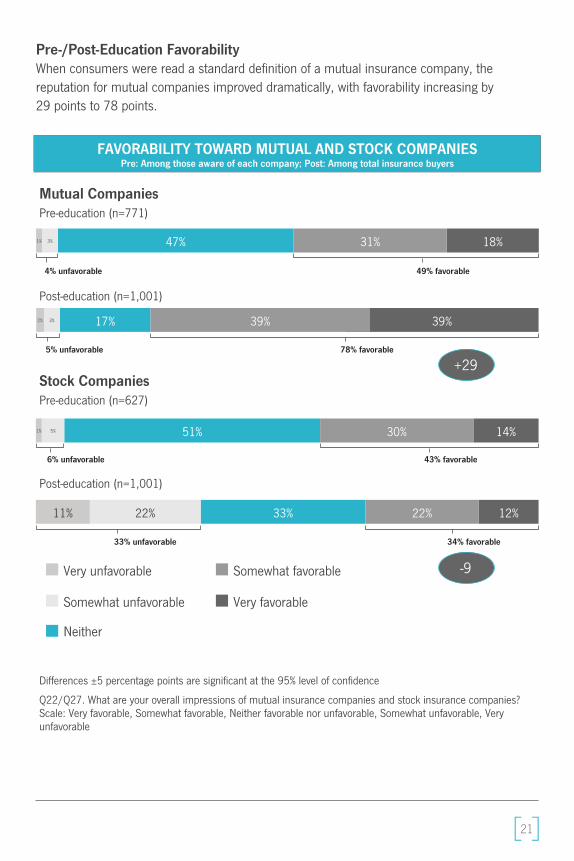
Pre-/Post-Education FavorabilityWhen consumers were read a standard definition of a mutual insurance company, the reputation for mutual companies improved dramatically, with favorability increasing by 29 points to 78 points.
FAVORABILITY TOWARD MUTUAL AND STOCK COMPANIESPre: Among those aware of each company; Post: Among total insurance buyers
Mutual Companies Pre-education (n=771)
47% 18%31%1% 3%
4% unfavorable 49% favorable
Post-education (n=1,001)
17% 39%39%2% 3%
5% unfavorable 78% favorable
Stock CompaniesPre-education (n=627)
51% 14%30%1% 5%
6% unfavorable 43% favorable
Post-education (n=1,001)
33% 12%22%11% 22%
33% unfavorable 34% favorable
Very unfavorable Somewhat favorable
Somewhat unfavorable Very favorable
Neither
Differences ±5 percentage points are significant at the 95% level of confidence
Q22/Q27. What are your overall impressions of mutual insurance companies and stock insurance companies? Scale: Very favorable, Somewhat favorable, Neither favorable nor unfavorable, Somewhat unfavorable, Very unfavorable
+29
-9
22
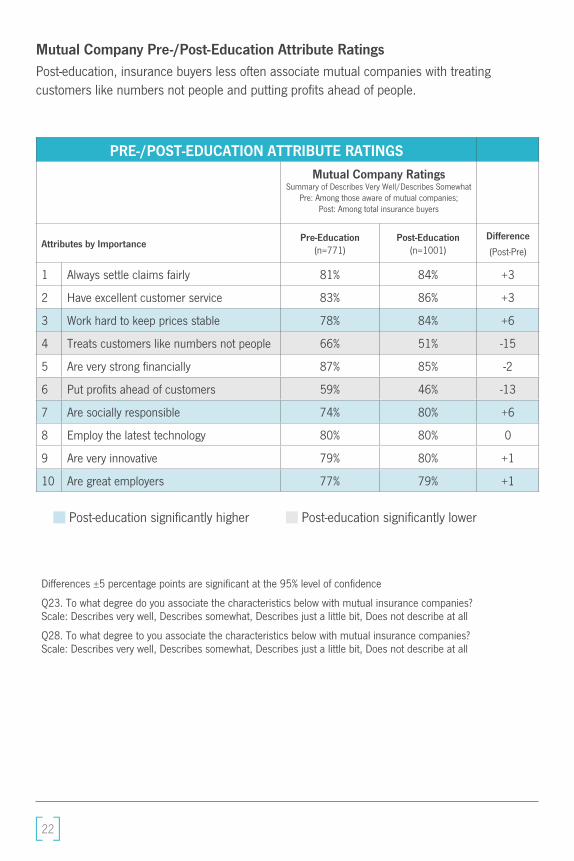
Mutual Company Pre-/Post-Education Attribute RatingsPost-education, insurance buyers less often associate mutual companies with treating customers like numbers not people and putting profits ahead of people.
PRE-/POST-EDUCATION ATTRIBUTE RATINGSMutual Company Ratings
Summary of Describes Very Well/Describes Somewhat Pre: Among those aware of mutual companies;
Post: Among total insurance buyers
Attributes by ImportancePre-Education
(n=771)Post-Education
(n=1001)Difference
(Post-Pre)
1 Always settle claims fairly 81% 84% +3
2 Have excellent customer service 83% 86% +3
3 Work hard to keep prices stable 78% 84% +6
4 Treats customers like numbers not people 66% 51% -15
5 Are very strong financially 87% 85% -2
6 Put profits ahead of customers 59% 46% -13
7 Are socially responsible 74% 80% +6
8 Employ the latest technology 80% 80% 0
9 Are very innovative 79% 80% +1
10 Are great employers 77% 79% +1
Post-education significantly higher Post-education significantly lower
Differences ±5 percentage points are significant at the 95% level of confidence
Q23. To what degree do you associate the characteristics below with mutual insurance companies? Scale: Describes very well, Describes somewhat, Describes just a little bit, Does not describe at all
Q28. To what degree to you associate the characteristics below with mutual insurance companies? Scale: Describes very well, Describes somewhat, Describes just a little bit, Does not describe at all
23
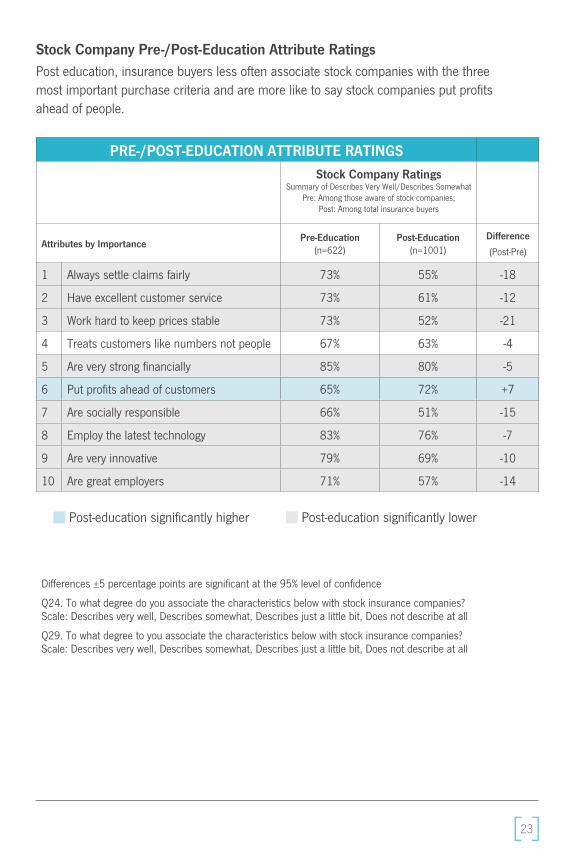
Stock Company Pre-/Post-Education Attribute RatingsPost education, insurance buyers less often associate stock companies with the three most important purchase criteria and are more like to say stock companies put profits ahead of people.
PRE-/POST-EDUCATION ATTRIBUTE RATINGSStock Company Ratings
Summary of Describes Very Well/Describes Somewhat Pre: Among those aware of stock companies;
Post: Among total insurance buyers
Attributes by ImportancePre-Education
(n=622)Post-Education
(n=1001)Difference
(Post-Pre)
1 Always settle claims fairly 73% 55% -18
2 Have excellent customer service 73% 61% -12
3 Work hard to keep prices stable 73% 52% -21
4 Treats customers like numbers not people 67% 63% -4
5 Are very strong financially 85% 80% -5
6 Put profits ahead of customers 65% 72% +7
7 Are socially responsible 66% 51% -15
8 Employ the latest technology 83% 76% -7
9 Are very innovative 79% 69% -10
10 Are great employers 71% 57% -14
Post-education significantly higher Post-education significantly lower
Differences ±5 percentage points are significant at the 95% level of confidence
Q24. To what degree do you associate the characteristics below with stock insurance companies? Scale: Describes very well, Describes somewhat, Describes just a little bit, Does not describe at all
Q29. To what degree to you associate the characteristics below with stock insurance companies? Scale: Describes very well, Describes somewhat, Describes just a little bit, Does not describe at all
24
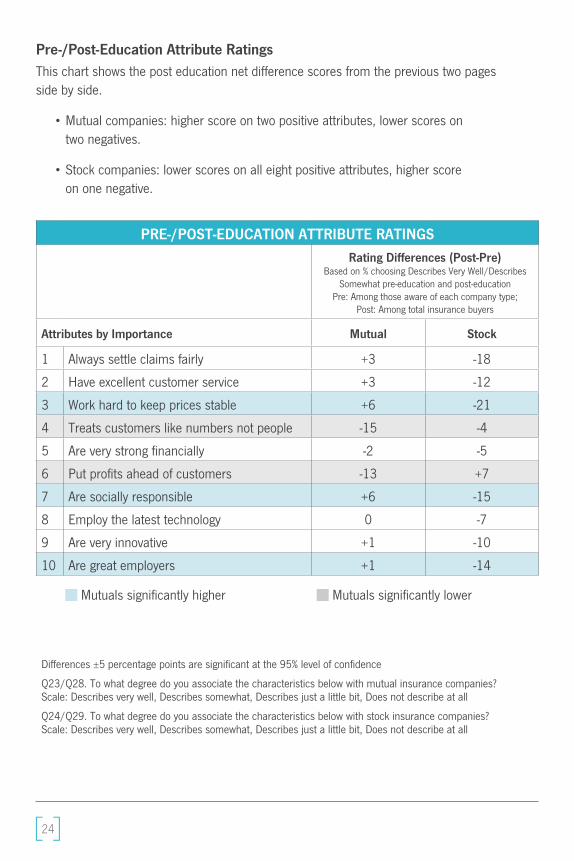
Pre-/Post-Education Attribute RatingsThis chart shows the post education net difference scores from the previous two pages side by side.
• Mutual companies: higher score on two positive attributes, lower scores on two negatives.
• Stock companies: lower scores on all eight positive attributes, higher score on one negative.
PRE-/POST-EDUCATION ATTRIBUTE RATINGSRating Differences (Post-Pre)
Based on % choosing Describes Very Well/Describes Somewhat pre-education and post-education
Pre: Among those aware of each company type;Post: Among total insurance buyers
Attributes by Importance Mutual Stock
1 Always settle claims fairly +3 -18
2 Have excellent customer service +3 -12
3 Work hard to keep prices stable +6 -21
4 Treats customers like numbers not people -15 -4
5 Are very strong financially -2 -5
6 Put profits ahead of customers -13 +7
7 Are socially responsible +6 -15
8 Employ the latest technology 0 -7
9 Are very innovative +1 -10
10 Are great employers +1 -14
Mutuals significantly higher Mutuals significantly lower
Differences ±5 percentage points are significant at the 95% level of confidence
Q23/Q28. To what degree do you associate the characteristics below with mutual insurance companies? Scale: Describes very well, Describes somewhat, Describes just a little bit, Does not describe at all
Q24/Q29. To what degree do you associate the characteristics below with stock insurance companies? Scale: Describes very well, Describes somewhat, Describes just a little bit, Does not describe at all
25
Market Analysis Methodology and Technical NotesGeneralInsurance companies were assigned to one of three segments based on reported NAIC Ownership Structure, classifying each insurer as a policyholder-owned “mutual,” a shareholder-owned “stock,” or “other” (e.g., limited liability corporation, U.S. Branch of alien insurer).2
Using financial data for individual insurance companies as provided by NAMIC, two types of aggregate metrics were calculated for each segment and the three segments as a group: sums for dollar-denominated fields such as premiums and weighted averages for ratios such as the net commission expense ratio.
Weighted averages are averages in which each observation is assigned or multiplied by a “weight” reflecting its relative importance in the overall average. For example, when calculating weighted average expense ratios, the expense ratio for each insurer was multiplied by premiums, with the sumproduct for premiums and expense ratios divided by total premiums to generate an average properly assigning more “weight” to the ratios for larger insurers and less “weight” the ratios for smaller insurers.
To avoid potential biases consequent to missing data, the data for an individual insurer was used in the calculation of a weighted average ratio only if data for both the weight and the ratio were present. If the data for an individual insurer included the weight but lacked the ratio, using the data for that insurer when calculating the weighted average would lead to a downward bias.
Because the data for an insurer was omitted from the calculation of an aggregate metric if data for one or more necessary fields were missing but were included in the calculation of other aggregate metrics, the population of insurers included in the calculation of any aggregate metric may differ from that used in the calculation of other aggregate metrics.
Further Comments on the Use of Data for Individual Insurance CompaniesMany individual insurance companies are members of larger “groups,” and some big groups have dozens of member companies.
A mutual insurance company that is a member of a larger group may own stock insurance companies that are members of the same group. Similarly, an insurance company that is
2 LLCs, U.S. branch of alien insurers, insurance pool of trusts, and syndicates.
26
neither a mutual nor a stock – an “other” insurance company – may own stock insurers that are part of the same group. For these reasons, aggregate values based on data for individual insurance companies may differ from aggregate values derived from data for groups.
That some insurance companies own other insurance companies can also give rise to some double counting when calculating aggregate values. For example, when an insurer receives investment income from an insurer that it owns, transfers within the group can lead to overstatement of investment income for the group as a whole.
Other NotesAggregate combined ratios are the sums of aggregate expense ratios, aggregate loss and loss adjustment expense ratios, and aggregate dividend ratios, rather than weighted averages. Similarly, aggregate operating ratios are the sums of aggregate combined ratios and aggregate investment ratios.


NATIONAL ASSOCIATION OF MUTUAL INSURANCE COMPANIES
3601 Vincennes Road | Indianapolis, IN 46268 | 317.875.5250 20 F Street, NW, Suite 510 | Washington, D.C. 20001 | 202.628.1558
www.namic.org