Embed Size (px)
Citation preview
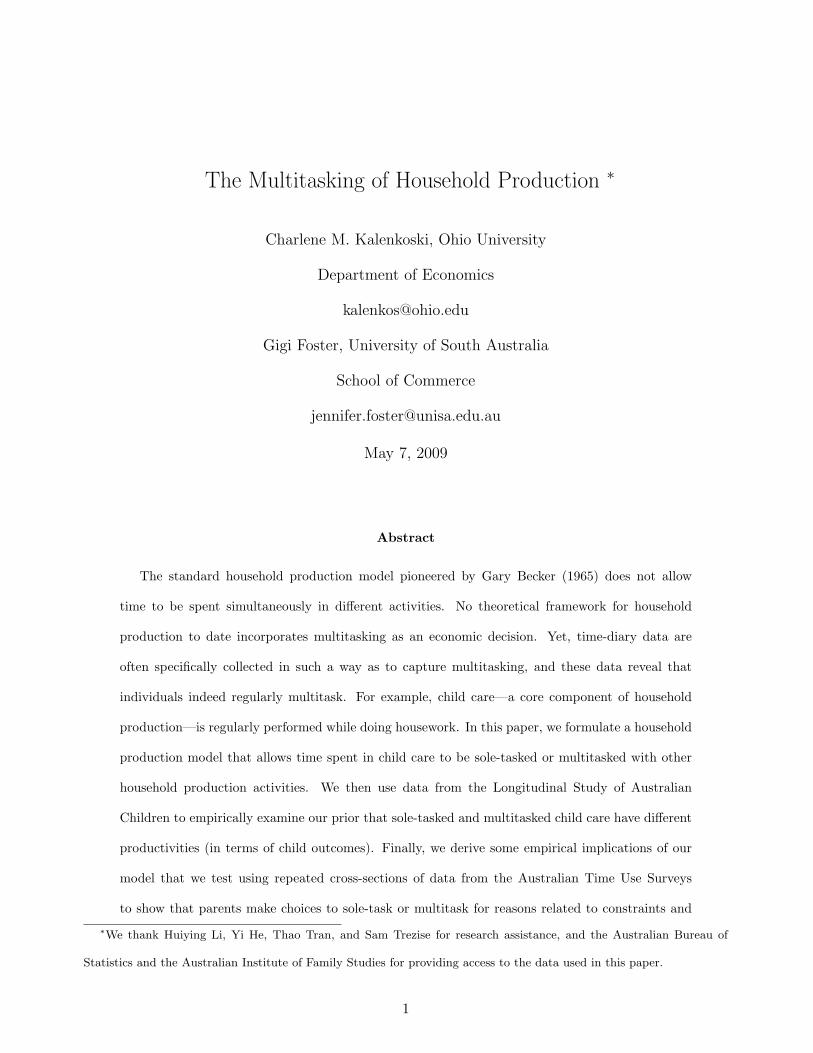
The Multitasking of Household Production ∗
Charlene M. Kalenkoski, Ohio University
Department of Economics
Gigi Foster, University of South Australia
School of Commerce
May 7, 2009
Abstract
The standard household production model pioneered by Gary Becker (1965) does not allow
time to be spent simultaneously in different activities. No theoretical framework for household
production to date incorporates multitasking as an economic decision. Yet, time-diary data are
often specifically collected in such a way as to capture multitasking, and these data reveal that
individuals indeed regularly multitask. For example, child care—a core component of household
production—is regularly performed while doing housework. In this paper, we formulate a household
production model that allows time spent in child care to be sole-tasked or multitasked with other
household production activities. We then use data from the Longitudinal Study of Australian
Children to empirically examine our prior that sole-tasked and multitasked child care have different
productivities (in terms of child outcomes). Finally, we derive some empirical implications of our
model that we test using repeated cross-sections of data from the Australian Time Use Surveys
to show that parents make choices to sole-task or multitask for reasons related to constraints and
∗We thank Huiying Li, Yi He, Thao Tran, and Sam Trezise for research assistance, and the Australian Bureau of
Statistics and the Australian Institute of Family Studies for providing access to the data used in this paper.
1

preferences, rather than randomly. Our goals are to suggest the treatment of multitasking as an
economic decision rather than as a random choice, to provide suggestive evidence that sole-tasked
and multi-tasked child care may have different impacts on children, and to help labor economists
better understand the underlying theoretical determinants of individuals’ decisions to multitask or
sole-task.
1 Introduction
The standard household production model pioneered by Gary Becker (Becker 1965) does not allow
time to be spent simultaneously in different activities. Thus, if a mother watches her child while
doing the dishes, her choice to multitask could only be mapped into the Beckerian framework if the
researcher allocated one fraction of the total minutes spent in this combined activity into child care,
and another fraction to doing the dishes. At the time Becker’s model was formulated, information
about the multitasking of household production was not available in household survey data. Since
that time, however, many national statistical agencies have undertaken detailed time-diary studies of
their populations that allow respondents to report primary, secondary, and sometimes even tertiary
activities they are performing at any given time, in the order given by the respondent.
Few time use researchers have exploited the opportunity represented by the recording of simulta-
neous activities to differentiate between sole- and multitasked time. For example, Kimmel & Connelly
(2007), in order to conform with Becker’s model, focus only on time spent in child care as a pri-
mary activity, as in their framework minutes spent in all primary activities must sum to 24 hours.
Ignoring secondary household production such as cooking and cleaning, however, seriously underesti-
mates individuals’ economic contributions (Floro & Miles 2003). More commonly, empirical analyses
of household production that use time-diary data, while relying loosely on Becker’s model to motivate
their analyses, analyze primary and secondary activities separately (e.g., Bianchi 2000, Kalenkoski,
Ribar & Stratton 2005, Kalenkoski, Ribar & Stratton 2007, Kalenkoski, Ribar & Stratton 2009).
One of the few studies that have attempted to analyze multitasked time directly is Jirjahn (2000),
2

who examines a theoretical model of multitasking in the workplace to determine whether fixed wages
or profit-sharing is the better payment scheme to reward employees who multitask. Jeong & Fishbein
(2007) examine the prevalence and patterns of multitasking among 14- to 16-year-olds and the media
and audience factors that predict such behavior. Closest in spirit to the present paper, Floro & Miles
(2003) examine the incidence and determinants of time spent in “overlapped” work activity, including
household work. They find that gender, household life cycle and composition, education, cultural
norms, employment status, and income influence the extent to which individuals (particularly women)
perform secondary work activities. Kalenkoski & Foster (2008) regress multitasked child care time on
an even more exhaustive list of demographic and other explanatory variables. Significant attention to
the nature of multitasking has also been given in the psychology literature and in the popular press.
Psychologists (e.g., Rubinstein, Meyer & Evans 2001, Levy & Pashler 2008) have found evidence that
the brain works differently during multitasking than during sole-tasking, and writers in the popular
press have suggested various causes and effects of multitasking that clearly differentiate it from sole-
tasking (e.g., Folsom 2008, Rosen 2008, Jackson 2004).
In this paper, we introduce a household production model that allows time spent in child care to
be sole-tasked or multitasked with other household production activities such as cooking and cleaning.
We then empirically examine our prior that sole-tasked and multitasked child care may have different
productivities (in terms of child outcomes) using data from the Longitudinal Study of Australian
Children (LSAC). Finally, we derive some empirical implications of our model that we test using
repeated cross-sections of data from the Australian Time Use Surveys (TUS). We find strong suggestive
evidence that multitasking by parents is not random but represents a choice under constraints, and
that multitasking preferences and decisions are significant to child outcomes. Our goals are to suggest
the treatment of multitasking in household production as an economic decision rather than a random
choice, to highlight its potential relevance to child production, and to help labor economists better
understand the underlying theoretical determinants of individuals’ decisions to multitask or sole-task.
3
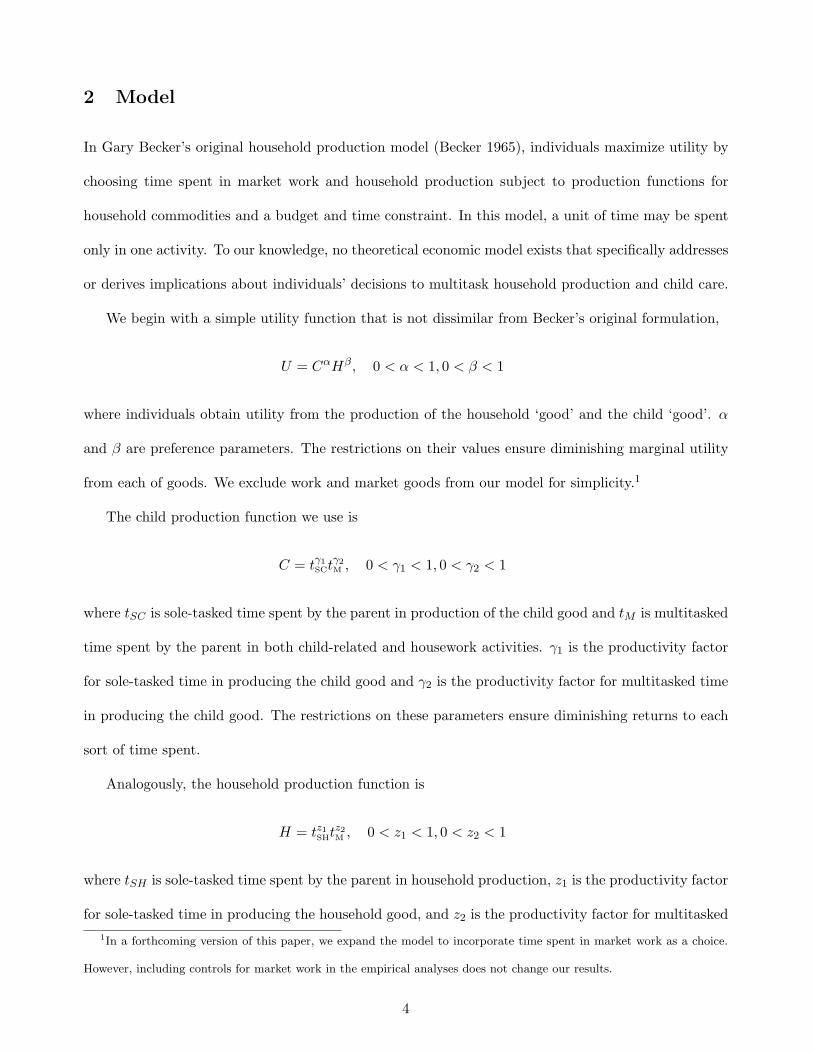
2 Model
In Gary Becker’s original household production model (Becker 1965), individuals maximize utility by
choosing time spent in market work and household production subject to production functions for
household commodities and a budget and time constraint. In this model, a unit of time may be spent
only in one activity. To our knowledge, no theoretical economic model exists that specifically addresses
or derives implications about individuals’ decisions to multitask household production and child care.
We begin with a simple utility function that is not dissimilar from Becker’s original formulation,
U = CαHβ, 0 < α < 1, 0 < β < 1
where individuals obtain utility from the production of the household ‘good’ and the child ‘good’. α
and β are preference parameters. The restrictions on their values ensure diminishing marginal utility
from each of goods. We exclude work and market goods from our model for simplicity.1
The child production function we use is
C = tγ1SCtγ2
M , 0 < γ1 < 1, 0 < γ2 < 1
where tSC is sole-tasked time spent by the parent in production of the child good and tM is multitasked
time spent by the parent in both child-related and housework activities. γ1 is the productivity factor
for sole-tasked time in producing the child good and γ2 is the productivity factor for multitasked time
in producing the child good. The restrictions on these parameters ensure diminishing returns to each
sort of time spent.
Analogously, the household production function is
H = tz1SHtz2
M , 0 < z1 < 1, 0 < z2 < 1
where tSH is sole-tasked time spent by the parent in household production, z1 is the productivity factor
for sole-tasked time in producing the household good, and z2 is the productivity factor for multitasked1In a forthcoming version of this paper, we expand the model to incorporate time spent in market work as a choice.
However, including controls for market work in the empirical analyses does not change our results.
4
time in producing the household good. The restrictions on these parameters ensure diminishing returns
to each sort of time spent.
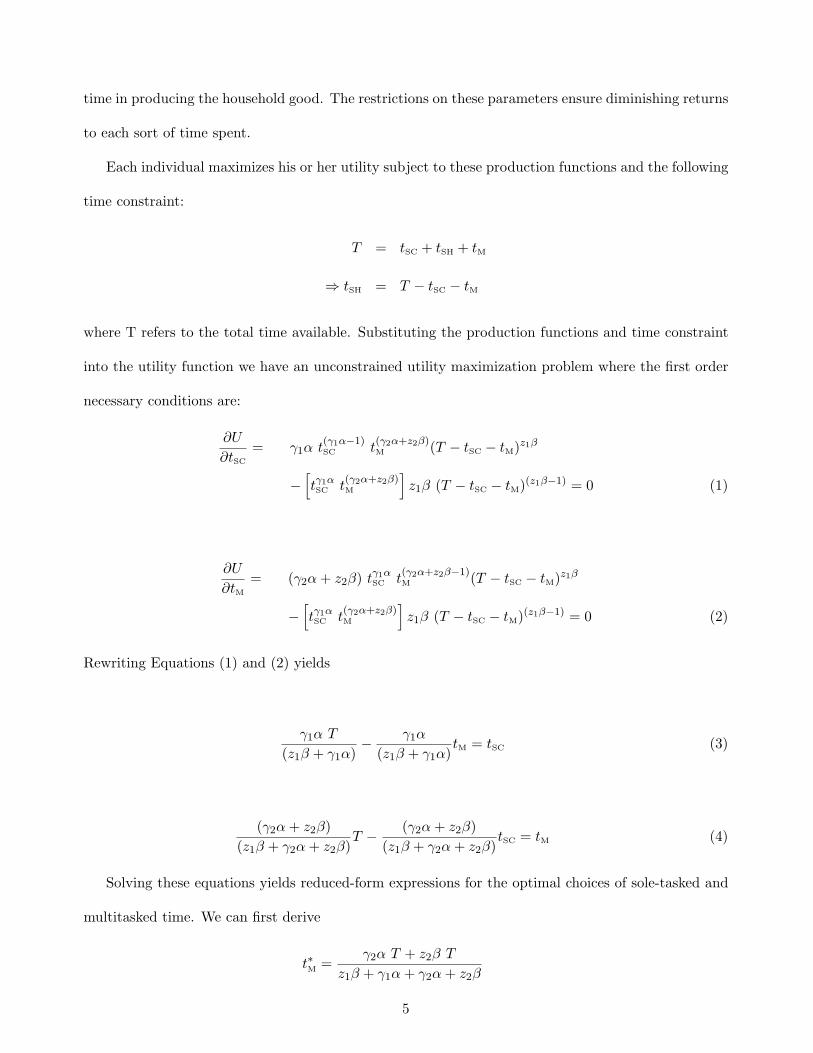
Each individual maximizes his or her utility subject to these production functions and the following
time constraint:
T = tSC + tSH + tM
⇒ tSH = T − tSC − tM
where T refers to the total time available. Substituting the production functions and time constraint
into the utility function we have an unconstrained utility maximization problem where the first order
necessary conditions are:
∂U
∂tSC
= γ1α t(γ1α−1)SC t
(γ2α+z2β)M (T − tSC − tM)z1β
−[tγ1αSC t
(γ2α+z2β)M
]z1β (T − tSC − tM)(z1β−1) = 0 (1)
∂U
∂tM= (γ2α + z2β) tγ1α
SC t(γ2α+z2β−1)M (T − tSC − tM)z1β
−[tγ1αSC t
(γ2α+z2β)M
]z1β (T − tSC − tM)(z1β−1) = 0 (2)
Rewriting Equations (1) and (2) yields
γ1α T
(z1β + γ1α)− γ1α
(z1β + γ1α)tM = tSC (3)
(γ2α + z2β)(z1β + γ2α + z2β)
T − (γ2α + z2β)(z1β + γ2α + z2β)
tSC = tM (4)
Solving these equations yields reduced-form expressions for the optimal choices of sole-tasked and
multitasked time. We can first derive
t∗M =γ2α T + z2β T
z1β + γ1α + γ2α + z2β
5

and then, substituting t∗M into equation (3), we arrive at
t∗SC =z1γ1αβ T + γ2
1α2 T
z21β
2 + 2z1γ1αβ + z1γ2αβ + z1z2β2 + γ21α2 + γ1γ2α2 + z2γ1αβ
Given these optimal values for individuals’ multitasked time and sole-tasked time, we can examine
how time allocation decisions change when productivity factors change by taking the partial derivatives
of these optimal values with respect to the productivity parameters γ1, γ2, z1, and z2.
Considering t∗M first, its partial derivative with respect to γ1 is
∂t∗M∂γ1
=− (γ2α
2 T + z2αβ T )(z1β + γ1α + γ2α + z2β)2
< 0
Thus, as we would expect, an increase in the sole-tasked child care productivity factor should reduce
multitasked child care time. In a similar fashion, the derivative of t∗M with respect to γ2 is
∂t∗M∂γ2
=z1αβ T + γ1α
2 T
(z1β + γ1α + γ2α + z2β)2> 0
implying that an increase in the multitasked child care productivity factor is expected to increase
multitasked child care time.
The partial derivative of t∗M with respect to z1 is
∂t∗M∂z1
=− (γ2αβ T + z2β
2 T )(z1β + γ1α + γ2α + z2β)2
< 0
implying that an increase in the sole-tasked housework productivity factor should reduce time spent
in multitasking. The derivative of t∗M with respect to z2 is
∂t∗M∂z2
=z1β
2 T + γ1αβ T
(z1β + γ1α + γ2α + z2β)2> 0
implying that an increase in the multitasked housework productivity factor should increase time spent
multitasking.
Turning to t∗SC, its simplified partial derivative with respect to γ1 is
∂t∗SC
∂γ1=
z31αβ3 T + 2z2
1γ1α2β2 T + z2
1γ2α2β2 T + 2z1γ1γ2α
3β T + z21z2αβ3 T
+2z1z2γ1α2β2 T + z1γ
21α3β T + γ2
1γ2α4 T + z2γ
21α3β T
(z21β
2 + 2z1γ1αβ + z1γ2αβ + z1z2β2 + γ21α2 + γ1γ2α2 + z2γ1αβ)2
> 0
6
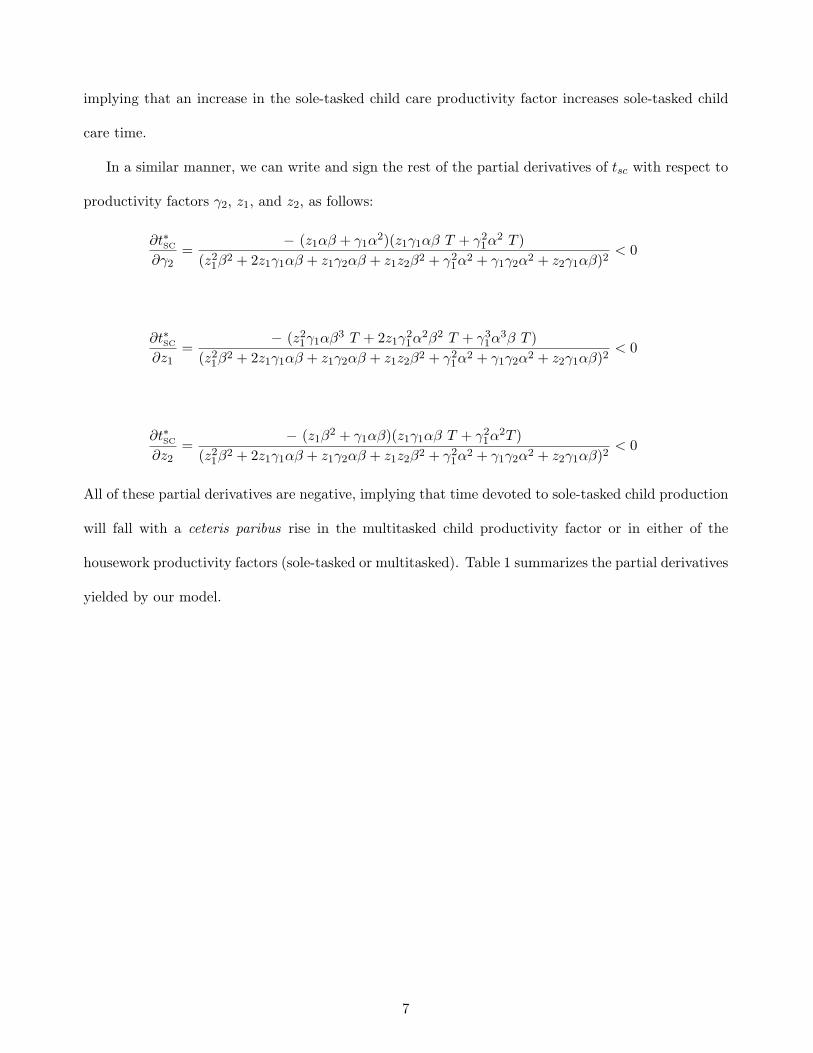
implying that an increase in the sole-tasked child care productivity factor increases sole-tasked child
care time.
In a similar manner, we can write and sign the rest of the partial derivatives of tsc with respect to
productivity factors γ2, z1, and z2, as follows:
∂t∗SC
∂γ2=
− (z1αβ + γ1α2)(z1γ1αβ T + γ2
1α2 T )(z2
1β2 + 2z1γ1αβ + z1γ2αβ + z1z2β2 + γ2
1α2 + γ1γ2α2 + z2γ1αβ)2< 0
∂t∗SC
∂z1=
− (z21γ1αβ3 T + 2z1γ
21α2β2 T + γ3
1α3β T )(z2
1β2 + 2z1γ1αβ + z1γ2αβ + z1z2β2 + γ2
1α2 + γ1γ2α2 + z2γ1αβ)2< 0
∂t∗SC
∂z2=
− (z1β2 + γ1αβ)(z1γ1αβ T + γ2
1α2T )(z2
1β2 + 2z1γ1αβ + z1γ2αβ + z1z2β2 + γ2
1α2 + γ1γ2α2 + z2γ1αβ)2< 0
All of these partial derivatives are negative, implying that time devoted to sole-tasked child production
will fall with a ceteris paribus rise in the multitasked child productivity factor or in either of the
housework productivity factors (sole-tasked or multitasked). Table 1 summarizes the partial derivatives
yielded by our model.
7

Table 1: Partial derivatives: Household production model with sole-tasked and multitasked time
∂t∂γ1
∂t∂γ2
∂t∂z1
∂t∂z2
tSC + - - -
tM - + - +
3 Data
We use data for this paper from two Australian sources. The first is the LSAC. This panel survey
of young children and their home environment focuses on inputs to child development, and includes
detailed measures of child development when children are still quite young. We use the LSAC birth-
cohort file, which provides a cross-sectional sample of children who were ages 2 to 3 years old in 2006.2
We examine measures of a variety of physical, social, and intellectual development aspects of these
children at this young age. While these data are appealing because of the availability of child outcome
measures, they do not include parental time diaries and therefore we are unable to ascertain directly
how much multitasking is done in the household where the child lives. We are still able to examine
the relationship between child outcome and type of parents’ child care time, however, by using a small
number of responses to survey questions about time use. We describe this strategy below.
The second set of data we use is drawn from two iterations (in 1997 and 2006) of the TUS. These
data do not contain child outcome measures, but each survey contains 48 hours’ worth of detailed
time-diary data on all adults in a random sample of Australian households. These time diaries allow
for primary and secondary time to be recorded, enabling us to construct a direct measure of the amount
of sole-tasked and multitasked time spent by parents in the home.
Our sample selection criteria are as follows. From the LSAC, we focus on the birth cohort from2Although the LSAC is a panel survey, the outcome measures and many of the other measures about children and
parents, including the ones regarding parental time on which we focus in this paper, differ between waves.
8

Wave 1. Our outcomes and most controls, including most measures related to parental time,3 are
drawn from the follow-up on that same cohort in Wave 2 (year 2006) when the children were 2 to 3
years old. We exclude households in which either the mother or the father of the child is studying
in any capacity. Finally, we exclude from each regression any children whose records are missing the
outcome measure being modeled or one or more of the independent variables. Our base estimation
sample contains 721 children, each of whom is from a different household.
From the TUS, we draw only households with children and only those adults in those households
who filled out complete time diaries. As is the case in our LSAC sample, we also exclude households in
which either primary adult (the householder or the spouse of the householder) is engaged in studying
in any capacity, and those for whom variables are missing. Our base estimation sample contains 1996
fathers and 2418 mothers.
4 Estimation
4.1 LSAC: Empirical Approach
Our analysis of the LSAC data proceeds as follows. First, we explore the unconditional relationships of
the following variables with our raft of child outcome measures: the frequency with which the mother
self-reports that she feels rushed (on a 1 to 5 Likert-style response scale from ‘never’ to ‘always’);
whether the parents agree with the statement “I feel that I am very good at keeping this child busy
while I am doing housework” (on a 1 to 10 Likert scale from ‘not at all how I feel’ to ‘exactly how I
feel’, measured for each parent separately); and the minutes of time that each parent reports spending
in each of two ways. Answers to these latter time use questions are not available for the vast majority
of our base estimation sample, nor do they measure actual multitasking, yet they do provide direct
measures of the time spent in active child care and the time spent doing housework—either with or
without children present—for each parent. The questions asked on the survey from which we draw3The two variables we draw from the Wave 1 survey are how good the mother and father respectively rate themselves
to be at keeping the child busy while doing housework. These variables do not appear in the Wave 2 survey.
9

this information are as follows:
• “How much time per week do you personally spend on domestic tasks such as housework, home
maintenance, shopping and cooking? Minutes”
• “How much time per week do you personally spend playing with your children, helping them
with personal care, teaching, coaching or actively supervising them, getting them to childcare,
school or other activities? Minutes”
We interpret answers to the first of these questions to be a rough proxy for the total of sole-tasked
housework plus multitasked housework and child care that the parent undertakes (i.e., tSH + tM ).
The second question asks about active or primary child care, which we take as a rough proxy for
the amount of sole-tasked child care that the parent undertakes per week (i.e., tSC). Given that we
expect no relationship between the amount of sole-tasked housework performed and the development of
children, we interpret any statistical relationship between our measure of tSH + tM and child outcomes
to reflect an underlying relationship between tM and child outcomes.
The child outcome measures that we use in this analysis are a mix of test scores and indices derived
by the Australian Institute of Family Studies (AIFS), the producers and managers of the LSAC data.
The list of measures follows. Again, each measure is taken when the child is 2 to 3 years old (all
regressions control for child’s sex and age in weeks):
• BCOI: Continuous Outcomes Index
• BLRNDOM: Learning Domain Score
• BSEDOM: Social/Emotional Domain Score
• BPHYSDOM: Physical Domain Score
• BGRAMMRK: MCDI-III Grammatical Markers
• BCOMMUN: Child’s Communication Skills
10

The BCOI score for a given child is the mean of that child’s scores on BLRNDOM, BSEDOM,
and BPHYSDOM, which themselves are general development outcome indices, compiled by AIFS, in
each of these three domains of child development.4 BGRAMMRK is the total number of ‘2’ responses
(indicating more advanced grammatical development) that parents gave on 12 questions, where for
each question, the parent selected one of two options for the way the child usually speaks (e.g., ‘Why
he run away?’ versus ‘Why did he run away?’). BCOMMUN is the mean of parental responses to
six questions aimed at assessing the child’s level of general communication skills. Responses to each
of these questions were captured on a 1 to 3 scale, with 1 representing ‘Never’, 2 ‘Sometimes’, and 3
‘Always.’ 5
After presenting the unconditional relationships between each child outcome variable and each
parental time use measure, we then run a series of regressions to explore whether the associations that
we find between child outcomes and parental time use hold up once we control for other factors likely
to affect both variables.
4.2 LSAC: Results
Table 2 provides means and standard deviations of key variables in our two LSAC estimation samples.
The first (in Column 1 of Table 2) is used for reduced-from style regressions, excluding direct parental
time measures. The second (in Column 2 of Table 2) is used when we include our direct measures of
parental time. Most variables are similarly distributed for the two samples, with mild evidence of more
parental time and better child outcomes in the larger sample.
Table 3 shows the pairwise correlations observed in the LSAC data amongst child outcome measures4Detailed information about how these indices are derived is available in LSAC Technical Paper 2 (Sanson, Misson,
Wake, Zubrick, Silburn, Rothman & Dickenson 2005).5The specific questions are: (1) ‘How often does this child carry out a simple instruction?’ (2) ‘How often does this
child ask for a question to be repeated?’ (3) ‘How often does this child follow a conversation?’ (4) ‘How often does this
child pass on a simple message?’ (5) ‘How often does this child clearly explain things?’ and (6) ‘How often does this child
use speech that is easily understood?’
11

Table 2: Means and Standard Deviations: LSAC Estimation Samples
Sample 1 Sample 2
Physical domain score 100.32 (10.24) 99.82 (12.45)
Learning domain score 101.52 (9.46) 100.74 (11.77)
Socio-emotional domain score 101.69 (9.00) 100.72 (7.36)
Continuous outcomes index 101.22 (9.57) 100.19 (12.13)
Grammar score 6.56 (3.89) 5.21 (4.16)
Communication score 2.40 (0.34) 2.34 (0.39)
Feels rushed (mother) 2.31 (0.77) 2.52 (0.96)
Good at keeping child busy (mother) 7.32 (1.95) 7.96 (1.81)
Good at keeping child busy (father) 6.22 (2.13) 6.64 (1.91)
Self-efficacy (mother) 4.03 (0.77) 3.96 (0.73)
Self-efficacy (father) 4.04 (0.76) 4.16 (0.85)
Presence of other adults 0.05 (0.23) 0 (-)
tSH + tM (mother) 14.17 (15.83) 9.88 (16.02)
tSC (mother) 11.24 (15.00) 11.08 (14.39)
tSH + tM (father) 14.95 (16.28) 10.00 (14.84)
tSC (father) 12.09 (16.90) 5.56 (11.40)
Note: Based on data from the Longitudinal Study of Australian Children. These are the two base samplesused notionally for the estimation whose results are presented in later tables. For the direct parental timequestions, fewer than 100 of the children’s records from Sample 1 have nonmissing observations. Additionally,a few observations are dropped for each sample from the calculations of means for certain outcomes, due tomissing observations on those outcomes (see observation counts in later tables).
12
(across the top of the table) and variables related to mother’s time use, for all observations for which
the given pair of variables is nonmissing. The table shows a strikingly consistent, significant, and
positive unconditional relationship evident between the degree to which a mother self-rates as being
“very good at keeping this child busy while I am doing housework” and the child’s outcomes. If we
take a mother’s answer to this question as a proxy for either the inherent productivity of multitasked
child care or the inherent productivity of multitasked housework that she faces—i.e., either γ2 or z2—
then we should expect multitasked child care and housework time to be higher for women with higher
self-ratings on this question.6 There also are some significant relationships between child outcomes
and whether a mother feels rushed, and these are mostly in the positive direction. Finally, the table
shows some statistically significant negative unconditional associations between child outcomes and
total minutes spent by the mother in child care of any sort (sole-tasked or multitasked).
Our conclusion from Table 3 is that there are relationships between a child’s outcomes and her
mother’s constraints and behavior with regard to sole-tasked and multi-tasked time use, but these
relationships may not be in the expected direction. If anything, mothers who spend less time with
their children of any sort, and mothers who may be more pressed for time and/or more likely to
multitask childcare with housework, appear to have children who score higher on developmental scales
than children of other mothers. Because these associations are only unconditional, we now proceed to
several regressions of child outcomes where a range of other aspects of the child and the household are
controlled.
Table 4 presents the results of regressions of the first three of our child outcome measures—
BPHYSDOM, BLRNDOM, and BSEDOM—on the parent time constraint, preference, and behavior
measures. Table 5 then provides the results of analogous regressions using the final three child out-
come measures—BCOI, BGRAMMRK, and BCOMMUN—as the dependent variables. In each table,
regressions on the full sample that exclude the actual parental time use measures themselves appear6The correlation between tM and answers to this question is positive as expected, although the association is based
on only 200 observations and is not statistically significant.
13

Table 3: Unconditional correlations: Longitudinal Study of Australian Children
BCOI BLRNDOM BSEDOM BPHYSDOM BGRAMMRK BCOMMUN
Mother is good at .18*** .06*** .15*** .12*** .12 .09***
keeping child busy
Frequency with which .05*** -.03 .05*** .09*** -.04** -.00
mother feels rushed
tSC -.11 -.10 -.14* .00 -.18** -.13*
(mother)
tSH + tM -.11 -.12* -.13* .01 -.18** -.13*
(mother)
Note: Based on data from the Longitudinal Study of Australian Children; each pairwise correlation is
calculated using all observations with nonmissing entries for both variables. Correlations significant at the
10%/5%/1% level are single-/double-/triple-starred.
14

Table 4: Associations of Child Outcomes with Parental Time Variables, By Outcome Type: BPHYS-
DOM, BLRNDOM, and BSEDOMDep var Physical domain Learning domain Socio-emotional domain
Panel A: Reduced-form
Feels rushed 0.91* -0.35 1.07**
(mother) (0.51) (0.46) (0.42)
Good at keeping 0.66*** 0.09 0.77***
child busy (mother) (0.20) (0.19) (0.17)
Good at keeping 0.03 -0.16 -0.15
child busy (father) (0.19) (0.17) (0.16)
Self-efficacy 1.43*** 0.56 1.52***
(mother) (0.51) (0.47) (0.43)
Self-efficacy 0.85 0.36 0.64
(father) (0.53) (0.48) (0.44)
Other adults -4.51** 1.43 -3.18**
(1.83) (1.67) (1.53)
Number of Observations 721 721 721
Adj R2 .0378 .0601 .1323
Panel B: Production model
tSH + tM 0.73 -0.00 0.10
(mother) (0.67) (0.28) (0.39)
tSC -0.62 0.24 -0.25
(mother) (0.91) (0.38) (0.53)
tSH + tM -0.53 -0.70*** -0.14
(father) (0.36) (0.15) (0.21)
tSC -0.46 -0.19 -0.12
(father) (0.41) (0.17) (0.24)
Number of Observations 25 25 25
Adj R2 -.1289 .7841 -.0996
Note: Based on data from the Longitudinal Study of Australian Children. Regressions reported in Panel Aalso include child’s age in weeks, number of siblings, log of household income, dummies for unemployment offather, labor force participation of mother and part-time working status of mother, dummies for whether alanguage other than English is spoken in the home and whether a non-English language is regularly spokento the child, the ages of both mother and father, an array of dummies for mother’s smoking status andmother’s highest education level achieved, dummies for whether the child enjoys child care, whether thefamily finances are reported to be in good condition, and whether the child is disabled, the age in weeks atwhich the child stopped breastfeeding, the ages of the youngest and oldest children in the household, andchild gender. Regressions reported in Panel B also include all controls shown in Panel A except for ‘otheradults’; log of household income, the ages of the youngest and oldest children in the household, child’s agein weeks, the ages of both mother and father, a dummy for the labor force participation of the mother, andchild gender. Estimates significant at the 10%/5%/1% level are single-/double-/triple-starred.
15
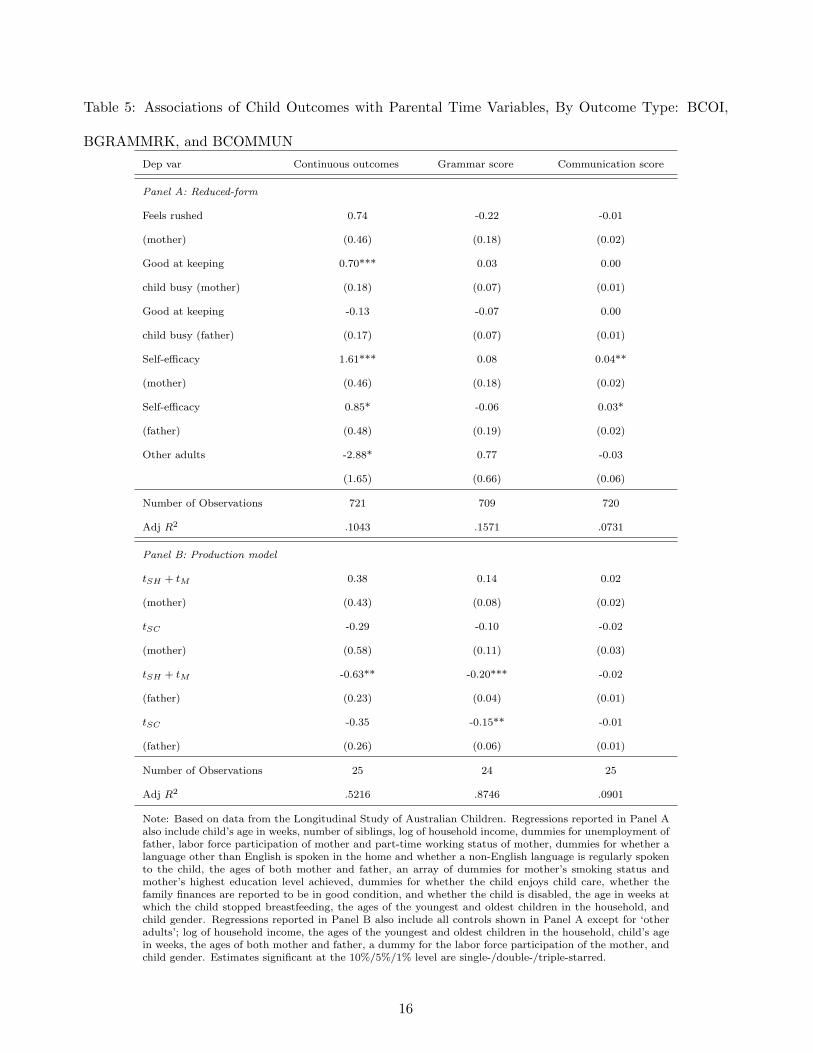
Table 5: Associations of Child Outcomes with Parental Time Variables, By Outcome Type: BCOI,
BGRAMMRK, and BCOMMUNDep var Continuous outcomes Grammar score Communication score
Panel A: Reduced-form
Feels rushed 0.74 -0.22 -0.01
(mother) (0.46) (0.18) (0.02)
Good at keeping 0.70*** 0.03 0.00
child busy (mother) (0.18) (0.07) (0.01)
Good at keeping -0.13 -0.07 0.00
child busy (father) (0.17) (0.07) (0.01)
Self-efficacy 1.61*** 0.08 0.04**
(mother) (0.46) (0.18) (0.02)
Self-efficacy 0.85* -0.06 0.03*
(father) (0.48) (0.19) (0.02)
Other adults -2.88* 0.77 -0.03
(1.65) (0.66) (0.06)
Number of Observations 721 709 720
Adj R2 .1043 .1571 .0731
Panel B: Production model
tSH + tM 0.38 0.14 0.02
(mother) (0.43) (0.08) (0.02)
tSC -0.29 -0.10 -0.02
(mother) (0.58) (0.11) (0.03)
tSH + tM -0.63** -0.20*** -0.02
(father) (0.23) (0.04) (0.01)
tSC -0.35 -0.15** -0.01
(father) (0.26) (0.06) (0.01)
Number of Observations 25 24 25
Adj R2 .5216 .8746 .0901
Note: Based on data from the Longitudinal Study of Australian Children. Regressions reported in Panel Aalso include child’s age in weeks, number of siblings, log of household income, dummies for unemployment offather, labor force participation of mother and part-time working status of mother, dummies for whether alanguage other than English is spoken in the home and whether a non-English language is regularly spokento the child, the ages of both mother and father, an array of dummies for mother’s smoking status andmother’s highest education level achieved, dummies for whether the child enjoys child care, whether thefamily finances are reported to be in good condition, and whether the child is disabled, the age in weeks atwhich the child stopped breastfeeding, the ages of the youngest and oldest children in the household, andchild gender. Regressions reported in Panel B also include all controls shown in Panel A except for ‘otheradults’; log of household income, the ages of the youngest and oldest children in the household, child’s agein weeks, the ages of both mother and father, a dummy for the labor force participation of the mother, andchild gender. Estimates significant at the 10%/5%/1% level are single-/double-/triple-starred.
16

in Panel A, and results from regressions on the smaller sample that include actual parental time use
behavior appear in Panel B. Regressions in both panels include an array of control variables describing
the household, the parents, and the children. In addition to the time use variables described above and
a dummy for the presence of others in the household over age 15, two other variables of interest whose
results are shown in the tables are the mother’s and father’s responses respectively to the question,
‘Overall, as a parent, do you feel that you are...’ with answer options as follows: 1=Not very good at
being a parent; 2=A person who has some trouble being a parent; 3=An average parent; 4=A better
than average parent; or 5=A very good parent. Additional controls are listed in the footnotes to each
table.
In Panel A of both tables, we see evidence of a positive relationship for some child outcome mea-
sures, even in the presence of controls, between child outcomes and both a mother’s feeling of being
rushed and her self-rating as being good at keeping the child busy while doing housework. Children’s
overall rating on the Continuous Outcomes measure, their social and emotional development, their
physical development, and their grammatical markers are all higher with increases in one or both of
these maternal time use measures. Panel B shows that actual maternal time spent with children,
controlling for these productivity and constraint variables, is not statistically associated with child
outcomes. By contrast, several child outcomes (learning domain scores, continuous outcomes index
scores, and grammar scores) are statistically associated—negatively—with either or both of fathers’
time use variables. Fathers’ multitasked housework and child care time is more robustly negatively
associated with child outcomes than is fathers’ sole-tasked child care time.7
We conclude from these results that child outcomes are statistically associated with aspects of
parental preferences, constraints, and behavior related to the multitasking of child care and housework
in the home. We now turn to far more detailed time-diary evidence to provide some empirical validation7Our controls for female gender and age of the child in weeks indicate that in every outcome equation, girls are as
developed as or more developed than boys, and older children are as developed as or more developed than younger
children.
17

for our model of household production.
4.3 TUS: Empirical approach
The TUS provide detailed time diaries that enable respondents to record both primary and secondary
uses of time for all adults in each sampled household. We use these diaries to construct measures of the
two key types of time use that appear in our model: sole-tasked child care time (time spent only doing
child care) and multitasked child care and housework time, where the parent reports being engaged
in both child care and housework. We regress sole-tasked child care time and multitasking time on
a number of proxies for the productivity of multitasked time, which our model suggests affect time
use decisions. In particular, we include four dummy variables that capture the presence of household
equipment that we believe are reasonably related to the productivity of multitasked or sole-tasked
time. These dummy variables capture the presence in the household of a dishwasher, a clothes dryer,
a deep freezer, and a microwave oven. We also include some other variables that may affect either the
productivity of multitasked or sole-tasked time, or the extent to which the time use decisions of the
parent are constrained (we would expect that, the greater the degree of constraint, the less sole-tasked
time and/or the more multitasked time that would be spent). These variables include the degree to
which the respondent reports feeling ‘rushed’, a dummy for the presence of other people 15 years of
age or older (most of whom are under the age of 25) in the household, dummies for the presence of
disabled children or adults in the household, the number of women in the household, and whether the
parent is single.
We also include the following variables in every regression: age of the parent, a dummy variable
for non-English language spoken in the home, the number of individuals in the household in different
age ranges, the number of dependent children in the household, the age of youngest dependent child
in the household, occupation and industry dummies for the individual, the number of weekend days
included in the time window, and year-by-quarter dummies.
18

Table 6: Means and Standard Deviations: Australian TUS DataFathers only Mothers only
1997 2006 1997 2006
Minutes in sole-tasked C 17.02 13.33 70.44 45.25
(50.13) (43.20) (128.58) (103.97)
Minutes in sole-tasked H 2.52 3.99 10.46 8.63
(18.10) (20.52) (29.54) (25.19)
Minutes in multi-tasked C and H 26.06 80.73 117.39 169.80
(67.56) (137.22) (158.68) (226.40)
Minutes in labor market tasks 672.65 560.68 247.01 261.88
(536.58) (542.45) (380.62) (379.63)
Feels rushed (0 to 5 scale) 2.43 2.20 2.23 2.12
(1.07) (1.09) (1.01) (0.98)
Count of aids in HH 2.57 2.91 2.50 2.81
(1.10) (0.95) (1.09) (0.99)
HH has a microwave .8762 .9743 .8647 .9680
HH has a freezer .6004 .5428 .5744 .5212
HH has a dryer .7220 .7661 .7045 .74
HH has a dishwasher .3876 .6248 .3587 .5772
Other adults present in HH .3058 .4943 .2787 .4689
Childcare hard to find .2287 .1920 .2386 .1806
Number of Observations 921 1075 1105 1313
Note: Based on data from the Australian Time Use Surveys. All means are
weighted at the household level using weights provided by the Australian Bu-
reau of Statistics. The standard deviation of each continuous variable appears in
parentheses below the variable’s mean.
19

Table 7: Unconditional correlations: Australian TUS Data (mothers only)
Panel A: 1997
tM tSC Microwave Freezer Dryer
tM 1.00
tSC .48*** 1.00
Microwave .00 .02 1.00
Freezer -.03 -.06 .16*** 1.00
Dryer .03 .02 .19*** .17*** 1.00
Dishwasher .03 .02 .14*** .10*** .28***
Panel B: 2006
tM tSC Microwave Freezer Dryer
tM 1.00
tSC .34*** 1.00
Microwave -.04 .03 1.00
Freezer -.07*** -.07** .09*** 1.00
Dryer -.01 -.02 .15*** .22*** 1.00
Dishwasher -.02 -.02 .10*** .01 .24***
Note: Based on data from the Australian Time Use Surveys; only
mothers are included. Correlations significant at the 10%/5%/1%
level are single-/double-/triple-starred.
20

4.4 TUS: Results
Descriptive statistics for the TUS data are shown in Table 6. As we expect, mothers spend more
minutes in every type of activity being modeled than do fathers. We also see a steep rise in multitasked
housework and childcare from 1997 to 2006, for both genders, and a concomitant decline in sole-tasked
child care. The incidence of every type of household aid except deep freezers also rises from 1997 to
2006.
Table 7 shows unconditional associations, in each year, amongst our maternal time use measures
and our household aid dummies. As expected, the presence of one household aid is significantly
associated with the presence of every other aid. We see few unconditional associations between time
use and household aids, with two exceptions: the negative associations in 2006 between having a
deep freezer and both multitasked time and sole-tasked child care time. Thinking back to the results
presented in Table 1, this may indicate that having a deep freezer reflects a higher sole-tasked housework
productivity factor. This may be due to the ability of mothers with deep freezers to cook and freeze
large batches of food in concentrated sessions during which they are less likely to also undertake child
care. Table 7 also shows a positive relationship between tSC and tM . This may suggest cross-household
variation in the total factor productivity of household production.
Results by parental gender from regressing each type of time against our household aid dummies
and a raft of controls appear in Table 8. We show results using only fathers in Columns 1 and 2 of this
table, and results using only mothers in Columns 3 and 4. Considering the results of our household aid
variables first, we see a strong negative relationship between the presence of a microwave oven in the
home and mothers’ time spent multitasking child care and housework. From our model’s implications
as presented in Table 1, this result suggests that adding a microwave oven to a household may increase
that household’s productivity factor of sole-tasked housework time. This may be because mothers who
use a microwave to cook are able to spend less time preparing the same meal as could be prepared using
a conventional oven, but the preparation requires more focused attention in the form of turning the
food, setting and stopping the timer, alternating foods in and out of the oven over a short space of time,
21

and the like. This implies that watching children at the same time is less feasible. The presence of a
dishwasher, by contrast, is statistically positively associated with mothers’ multitasked time, suggesting
that households with a dishwasher may have a higher multitasked productivity of housework and child
care than other households. This may be because the type of work that a dishwasher enables mothers to
substitute towards (loading and unloading the dishwasher), is more easily able to be multitasked with
child care than traditional dishwashing during which the mother must face the sink and cannot easily
look behind herself to engage with children. With the presence of the additional control variables in
these regressions, the previous unconditional relationship between maternal time and the presence of a
freezer is no longer present, although there is evidence in Column 2 that the presence of a clothesdryer
works as an increase in the multi-tasked housework productivity factor, z2.
Table 8 also shows a very strong and robust negative relationship between the presence of other
adults in the household and both sole-tasked child care time and multitasked time, suggesting that
other adults constitute a powerful enhancement to the sole-tasked housework productivity factor in
a household. This is likely to be because such adults provide additional hands to do both household
and child care work, removing time constraints on parents. Feeling rushed is negatively associated
with sole-tasked child care for mothers, indicating that this feeling picks up the relative productivity
of multitasked time compared to sole-tasked time. Single mothers spend significantly more time than
married mothers engaged in multitasking of child care and housework, but there is no difference by
mother’s marital status in sole-tasked time spent. Finally, if external child care is hard to find, then
parents (and especially mothers) spend more time in both sole-tasked and multitasked childcare, as
we expect. Additional results not shown on the table include a positive association of sole-tasked child
care time with the presence of more dependent children (though additional children is not associated
with total multitasked time); and negative pressure on both sole-tasked and multitasked child care time
as the youngest child in the household grows in age. Conditional on the other controls we include, the
presence of a disabled child, the presence of a disabled adult, and the count of women in the household
are insignificant in these equations.
22
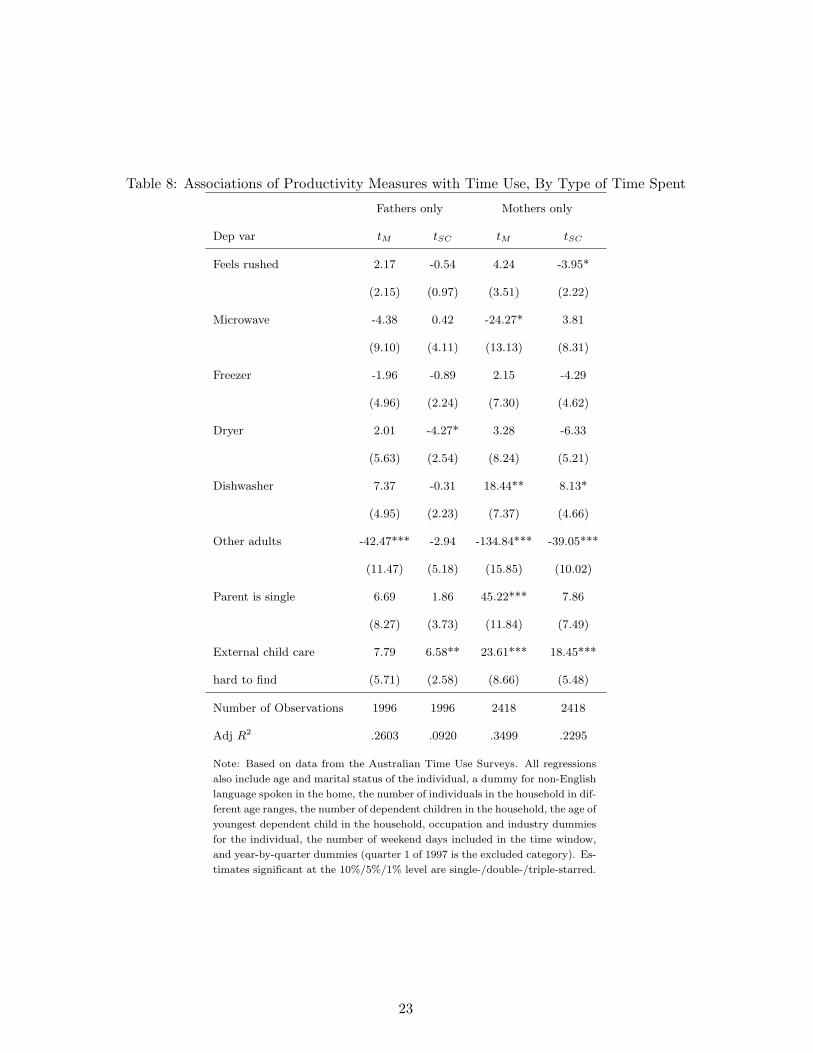
Table 8: Associations of Productivity Measures with Time Use, By Type of Time Spent
Fathers only Mothers only
Dep var tM tSC tM tSC
Feels rushed 2.17 -0.54 4.24 -3.95*
(2.15) (0.97) (3.51) (2.22)
Microwave -4.38 0.42 -24.27* 3.81
(9.10) (4.11) (13.13) (8.31)
Freezer -1.96 -0.89 2.15 -4.29
(4.96) (2.24) (7.30) (4.62)
Dryer 2.01 -4.27* 3.28 -6.33
(5.63) (2.54) (8.24) (5.21)
Dishwasher 7.37 -0.31 18.44** 8.13*
(4.95) (2.23) (7.37) (4.66)
Other adults -42.47*** -2.94 -134.84*** -39.05***
(11.47) (5.18) (15.85) (10.02)
Parent is single 6.69 1.86 45.22*** 7.86
(8.27) (3.73) (11.84) (7.49)
External child care 7.79 6.58** 23.61*** 18.45***
hard to find (5.71) (2.58) (8.66) (5.48)
Number of Observations 1996 1996 2418 2418
Adj R2 .2603 .0920 .3499 .2295
Note: Based on data from the Australian Time Use Surveys. All regressions
also include age and marital status of the individual, a dummy for non-English
language spoken in the home, the number of individuals in the household in dif-
ferent age ranges, the number of dependent children in the household, the age of
youngest dependent child in the household, occupation and industry dummies
for the individual, the number of weekend days included in the time window,
and year-by-quarter dummies (quarter 1 of 1997 is the excluded category). Es-
timates significant at the 10%/5%/1% level are single-/double-/triple-starred.
23
5 Conclusion
This paper is motivated by the fact that children cannot be “turned off” while parents spend time
doing housework, and yet existing models of household production cannot accommodate this basic
fact. We introduce a household production model in the spirit of Becker (1965) that allows time
spent in child care to be sole-tasked or multitasked with other household production activities such
as cooking and cleaning. We use this model to derive implications about the relationship between
productivity parameters in the household good and child good production functions and the optimal
amount of time parents would spend in multitasked and sole-tasked production. We then provide
suggestive evidence based on data from the LSAC that sole-tasked and multitasked child care may
have different productivities in terms of an array of child developmental outcomes. Finally, we test
the empirical implications of our model using two cross-sections of data from the TUS and find that
multitasking by parents does respond to household productivity parameters—specifically, whether and
what sort of labor- and time-saving devices are found in the home environment. Our evidence supports
the treatment of multitasking in household production as an economic decision rather than a random
choice, and one that has the potential to impact child development.
Based on the results in this paper, we believe further research in this vein would be fruitful. Linked
data on household and child productivity parameters, actual parental time allocation choices, and child
outcomes would greatly assist research in this area.
24

References
Becker, G. (1965), ‘A theory of the allocation of time’, The Economic Journal 75, 493–517.
Bianchi, S. M. (2000), ‘Maternal employment and time with children: Dramatic change or surprising
continuity?’, Demography 37.
Floro, M. S. & Miles, M. (2003), ‘Time use, work and overlapping activities: Evidence from Australia’,
Cambridge Journal of Economics 27.
Folsom, R. (2008), ‘Multitasking mania’, Corporate Insights Spring.
Jackson, M. (2004), ‘Pressured to multitask, workers juggle a fragmented existence’, The Boston Globe
September 26, 2004.
Jeong, S.-H. & Fishbein, M. (2007), ‘Predictors of multitasking with media: Media factors and audience
factors’, Media Psychology 10.
Jirjahn, U. (2000), ‘Incentives for multitasking: Fixed wages or profit-sharing?’, Economic Analysis
3, 137–148.
Kalenkoski, C. M. & Foster, G. (2008), ‘The quality of time spent with children in Australian house-
holds’, Review of Economics of the Household 6, 243–266.
Kalenkoski, C., Ribar, D. & Stratton, L. S. (2005), ‘Parental child care in single parent, cohabiting,
and married couple families: Time diary evidence from the United Kingdom’, American Economic
Review 95, 194–198.
Kalenkoski, C., Ribar, D. & Stratton, L. S. (2007), ‘The effect of family structure on parents’ child
care time in the United States and the United Kingdom’, Review of Economics of the Household
5, 353–384.
25

Kalenkoski, C., Ribar, D. & Stratton, L. S. (2009), ‘The influence of wages on parents’ allocations of
time to child care and market work in the United Kingdom’, Journal of Population Economics
22, 399–419.
Kimmel, J. & Connelly, R. (2007), ‘Mothers’ time choices: Caregiving, leisure, home production, and
paid work’, Journal of Human Resources 42, 642–681.
Levy, J. & Pashler, H. (2008), ‘Task prioritisation in multitasking during driving: Opportunity to abort
a concurrent task does not insulate braking responses from dual-task slowing’, Applied Cognitive
Psychology 22.
Rosen, C. (2008), ‘The myth of multitasking’, The New Atlantis 5, 105–110.
Rubinstein, J. S., Meyer, D. E. & Evans, J. E. (2001), ‘Executive control of cognitive processes in task
switching’, Journal of Experimental Psychology: Human Perception and Performance 27(4), 763–
797.
Sanson, A., Misson, S., Wake, M., Zubrick, S. R., Silburn, S., Rothman, S. & Dickenson, J. (2005),
Summarizing children’s wellbeing: The LSAC outcome index, Technical report. LSAC Technical
Paper #2, Australian Institute of Family Studies.
26
![Cognitive Predictors of a Common Multitasking Ability ...mjkane/pubs/Redick et al 2016, JEPG [multitasking].pdfCognitive Predictors of a Common Multitasking Ability: Contributions](https://img.pdfslide.us/doc/110x75/5af43c547f8b9a74448c98a4/cognitive-predictors-of-a-common-multitasking-ability-mjkanepubsredick-et.jpg)