Embed Size (px)
Citation preview
THE MTA BLUE RIBBON COMMISSION ON SUSTAINABILITY
TRACTION POWER REPORT OCTOBER 29, 2008 (ORIGINAL) FEBRUARY 25, 2009 (UPDATE) PREPARED FOR:
METROPOLITAN TRANSPORTATION AUTHORITY (MTA)
The MTA Blue Ribbon Commission on Sustainability: Traction Power
- 1 -
I. Executive Summary ................................................................................................. 2 II. Introduction and Approach ....................................................................................... 3
A. Regenerative Braking ....................................................................................... 4 B. Mass Reduction ................................................................................................ 4
III. Approach.................................................................................................................. 5 IV. Analytical Results..................................................................................................... 6
A. Regenerative Energy Techniques..................................................................... 6 B. Mass Reduction Techniques to Reduce Traction Energy Consumption ........... 8
V. Next Steps ............................................................................................................. 10 Appendix 1- Glossary of terms used in Figures 2 and 5................................................ 12
1. Mass Impact.................................................................................................... 12 2. Volume Required ............................................................................................ 12 3. Annual Energy Impact..................................................................................... 12 4. Cost Equivalent Energy Impact....................................................................... 12 5. Technology Maturity........................................................................................ 12 6. Ease of Implementation .................................................................................. 12 7. System Cost.................................................................................................... 12 8. Payback Period............................................................................................... 13
Appendix 2- Regenerative Energy Technique Definitions ............................................. 14 Appendix 3- Storage of Regenerative Energy ............................................................... 16
The MTA Blue Ribbon Commission on Sustainability: Traction Power
- 2 -
Traction Power Energy Analysis
I. Executive Summary The New York Metropolitan Transportation Authority (MTA) traction power use is significant. Traction power alone comprises approximately 2150 GWh per year, at a electricity cost of approximately $237 M annually. MTA NYC Transit consumes about 80% (1715 GWh) of the annual MTA traction power usage. Technologies and other innovative operating techniques to reduce this energy consumption (and subsequent significant CO2 emissions) are examined. The methods utilized to reduce traction energy consumption are broken down into two categories:
Regenerative energy management techniques Mass reduction of train car components
Regenerative energy management techniques include on-board energy storage, trackside energy storage, operational enhancements such as start/stop synchronization, and software modifications for train cars to better utilize regenerated energy. Mass reduction techniques include elimination of redundant components, substituting lighter materials such as aluminum for steel and developing innovative design optimization techniques to enable identical structural performance with reduced weight.
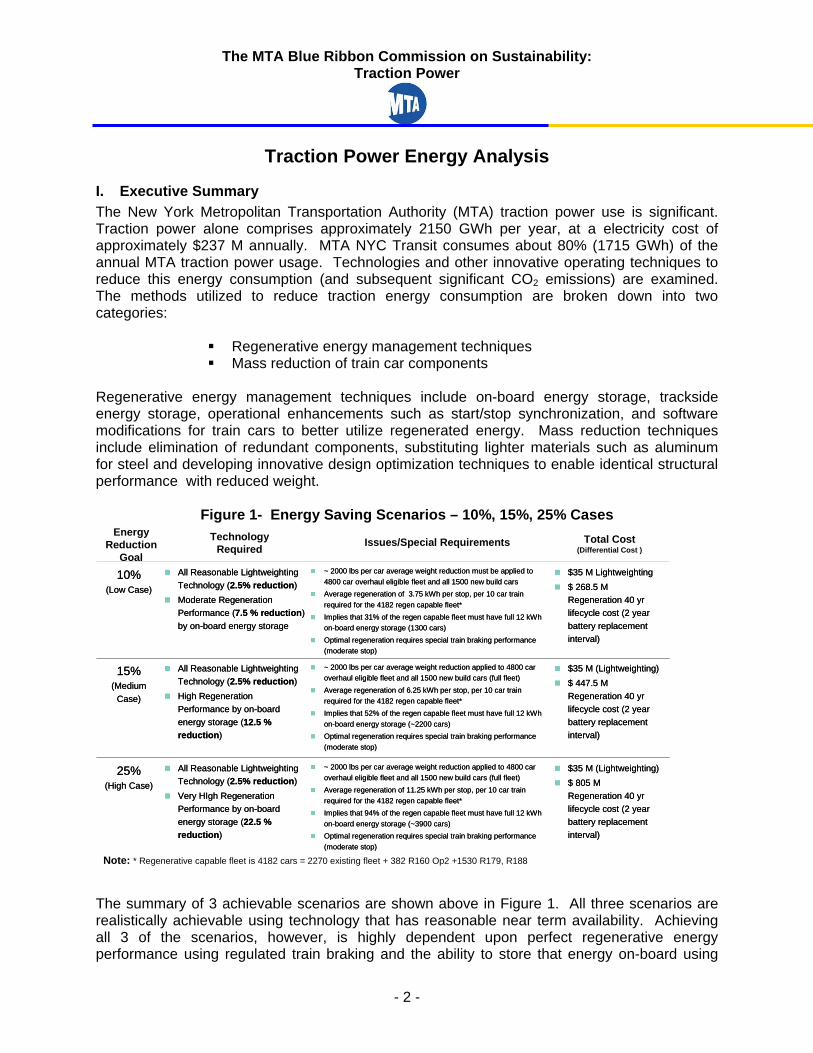
Figure 1- Energy Saving Scenarios – 10%, 15%, 25% Cases
~ 2000 lbs per car average weight reduction applied to 4800 car overhaul eligible fleet and all 1500 new build cars (full fleet)Average regeneration of 11.25 kWh per stop, per 10 car train required for the 4182 regen capable fleet* Implies that 94% of the regen capable fleet must have full 12 kWh on-board energy storage (~3900 cars)Optimal regeneration requires special train braking performance (moderate stop)
~ 2000 lbs per car average weight reduction applied to 4800 car overhaul eligible fleet and all 1500 new build cars (full fleet)Average regeneration of 6.25 kWh per stop, per 10 car train required for the 4182 regen capable fleet* Implies that 52% of the regen capable fleet must have full 12 kWh on-board energy storage (~2200 cars)Optimal regeneration requires special train braking performance (moderate stop)
~ 2000 lbs per car average weight reduction must be applied to 4800 car overhaul eligible fleet and all 1500 new build cars Average regeneration of 3.75 kWh per stop, per 10 car train required for the 4182 regen capable fleet* Implies that 31% of the regen capable fleet must have full 12 kWh on-board energy storage (1300 cars)Optimal regeneration requires special train braking performance (moderate stop)
All Reasonable LightweightingTechnology (2.5% reduction)Very HIgh Regeneration Performance by on-board energy storage (22.5 % reduction)
All Reasonable LightweightingTechnology (2.5% reduction)High Regeneration Performance by on-board energy storage (12.5 % reduction)
All Reasonable LightweightingTechnology (2.5% reduction)Moderate Regeneration Performance (7.5 % reduction) by on-board energy storage
$35 M (Lightweighting)$ 447.5 MRegeneration 40 yr lifecycle cost (2 year battery replacement interval)
15%(Medium
Case)
$35 M (Lightweighting)$ 805 MRegeneration 40 yr lifecycle cost (2 year battery replacement interval)
25%(High Case)
$35 M Lightweighting$ 268.5 MRegeneration 40 yr lifecycle cost (2 year battery replacement interval)
10%(Low Case)
Energy Reduction
Goal
Technology Required Issues/Special Requirements Total Cost
(Differential Cost )
Note: * Regenerative capable fleet is 4182 cars = 2270 existing fleet + 382 R160 Op2 +1530 R179, R188
The summary of 3 achievable scenarios are shown above in Figure 1. All three scenarios are realistically achievable using technology that has reasonable near term availability. Achieving all 3 of the scenarios, however, is highly dependent upon perfect regenerative energy performance using regulated train braking and the ability to store that energy on-board using
The MTA Blue Ribbon Commission on Sustainability: Traction Power
- 3 -
lithium battery technology with best in class energy and power density. Further detail is specified in the appendix.
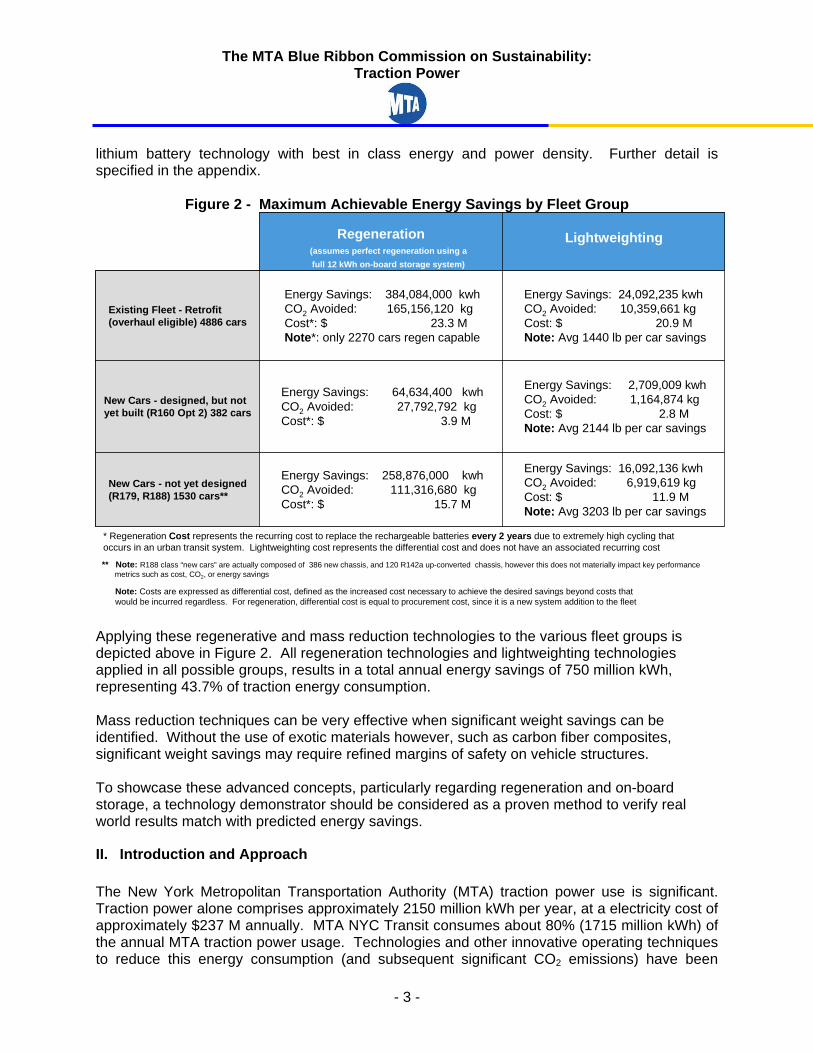
Figure 2 - Maximum Achievable Energy Savings by Fleet Group
Energy Savings: 16,092,136 kwhCO2 Avoided: 6,919,619 kg Cost: $ 11.9 MNote: Avg 3203 lb per car savings
Energy Savings: 258,876,000 kwhCO2 Avoided: 111,316,680 kgCost*: $ 15.7 M
New Cars - not yet designed (R179, R188) 1530 cars**
Energy Savings: 2,709,009 kwhCO2 Avoided: 1,164,874 kgCost: $ 2.8 MNote: Avg 2144 lb per car savings
Energy Savings: 64,634,400 kwhCO2 Avoided: 27,792,792 kgCost*: $ 3.9 M
New Cars - designed, but not yet built (R160 Opt 2) 382 cars
Energy Savings: 24,092,235 kwhCO2 Avoided: 10,359,661 kgCost: $ 20.9 MNote: Avg 1440 lb per car savings
Lightweighting
Energy Savings: 384,084,000 kwhCO2 Avoided: 165,156,120 kgCost*: $ 23.3 MNote*: only 2270 cars regen capable
Regeneration
Existing Fleet - Retrofit (overhaul eligible) 4886 cars
(assumes perfect regeneration using a full 12 kWh on-board storage system)
Note: Costs are expressed as differential cost, defined as the increased cost necessary to achieve the desired savings beyond costs that would be incurred regardless. For regeneration, differential cost is equal to procurement cost, since it is a new system addition to the fleet
* Regeneration Cost represents the recurring cost to replace the rechargeable batteries every 2 years due to extremely high cycling that occurs in an urban transit system. Lightweighting cost represents the differential cost and does not have an associated recurring cost
** Note: R188 class “new cars” are actually composed of 386 new chassis, and 120 R142a up-converted chassis, however this does not materially impact key performance metrics such as cost, CO2, or energy savings
Applying these regenerative and mass reduction technologies to the various fleet groups is depicted above in Figure 2. All regeneration technologies and lightweighting technologies applied in all possible groups, results in a total annual energy savings of 750 million kWh, representing 43.7% of traction energy consumption. Mass reduction techniques can be very effective when significant weight savings can be identified. Without the use of exotic materials however, such as carbon fiber composites, significant weight savings may require refined margins of safety on vehicle structures. To showcase these advanced concepts, particularly regarding regeneration and on-board storage, a technology demonstrator should be considered as a proven method to verify real world results match with predicted energy savings.
II. Introduction and Approach The New York Metropolitan Transportation Authority (MTA) traction power use is significant. Traction power alone comprises approximately 2150 million kWh per year, at a electricity cost of approximately $237 M annually. MTA NYC Transit consumes about 80% (1715 million kWh) of the annual MTA traction power usage. Technologies and other innovative operating techniques to reduce this energy consumption (and subsequent significant CO2 emissions) have been
The MTA Blue Ribbon Commission on Sustainability: Traction Power
- 4 -
identified by NY MTA Smart Fleets Taskforce. The methods utilized to reduce traction energy consumption are broken down into two categories:
Regenerative energy management techniques Mass reduction of train car components
This work estimates the energy savings potential of these approaches by mapping the technical potential against MTA’s capital plan for the purchase of new cars and major overhaul schedules to estimate the potential for retrofit technologies.
A. Regenerative Braking Regenerative braking is a concept that has been utilized in a variety of industrial settings to reduce energy consumption. In the automotive space, regenerative braking has been used in vehicles for over 10 years providing significant energy reduction, particularly in high start and stop cycling in urban settings. Industrial applications (i.e. port operations) of regenerative braking have also included crane and elevator operations involving lifting and lowering heavy containers. In this industrial scenario, regenerative energy is captured during the lowering process, thus reducing potential wasted energy input during the raising process. On-board energy systems are also useful when performing regenerative braking to immediately store the energy where it is created, thus reducing transmission losses and optimizing energy transfer. Energy storage systems analyzed were selected based upon a reasonable expectation of near term availability and reasonable operational history. Fuel cell storage, super-conducting energy rings, and other more exotic concepts were not analyzed because of the extremely high cost and unproven operational history. In operating a transit system, operational concepts can have significant impacts on energy consumption. For example, organizing bus routes that consist of right turns only and reducing schedules during off-peak hours are operational concepts that impact energy consumption. In a rail system, one operational concept when combined with regenerative energy systems, is synchronizing the arrival and departure of trains to allow the arriving train to accelerate the departing train. Operational concepts could also include software modification to improve regenerative efficiency.
B. Mass Reduction Mass reduction techniques have been applied in transportation for a number of years, particularly in aerospace applications where aircraft weight is directly proportional to range and fuel consumption. The premium on performance in aerospace applications, particularly military applications, sometimes creates situations where mass reduction is still undertaken, despite a lack of economic justification, to meet key performance parameters such as range, fuel consumption or environmental impact. Historically, ground vehicles, such as rail cars, have faced the opposite paradigm wherein economics and safety considerations have trumped fuel savings derived from mass reduction approaches. Therefore, such approaches have received relatively less development or implementation. This, however, is changing as energy costs rise along with increasing concerns over CO2 emissions from fossil fuel based energy production.
The MTA Blue Ribbon Commission on Sustainability: Traction Power
- 5 -
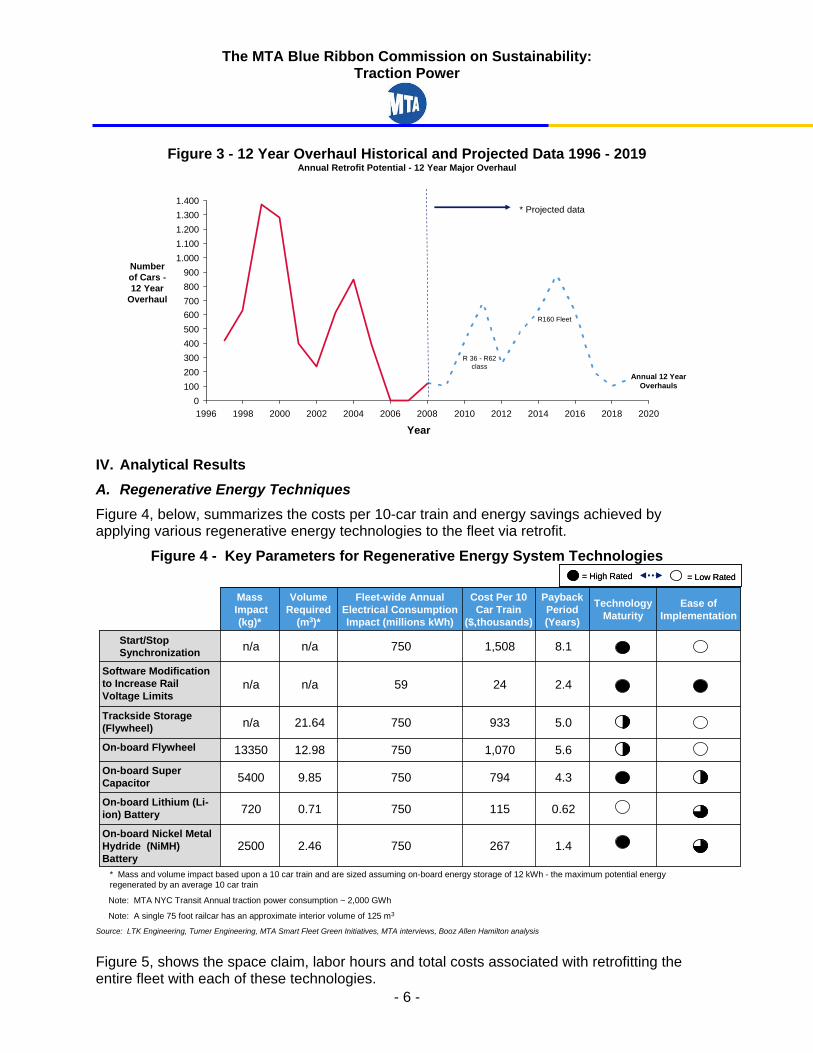
III. Approach With respect to both light weighting and regenerative braking, analysis focused on two paths by which MTA could implement energy savings technologies: 1) through the purchase of new cars as outlined in the capital acquisition plan and 2) through retrofits performed during the regularly scheduled fleet overall process (all MTA cars are given a major overhaul at 12 years). Analysis of the budget documents showed that MTA plans to purchase 600 new cars through 2015. With respect to retrofits, Figure 3 show the planned fleet 12-year overhaul schedule out to 2019. Roughly 4600 cars will have major overhauls between 2008 and 2019. Based on discussions with MTA, there is no physical limit to overhauling the entire fleet of 6485 transit cars in this time frame. Also, considering that the number of overhaul eligible cars is only 4800, it is assumed to be reasonable that all retrofits could be performed in this period. Therefore, the analysis assumes that all technologies are available for retrofitting and can be applied to the entire fleet of 4800 overhaul eligible cars and 1912 new cars (R160 Option 2, R179, R188). Modeling results are also highly dependent upon the MTA operational model that was developed for this analysis. It is based upon the assumption that the NYC Transit fleet of 6485 cars makes 91,161, 720 stops per year. Actual variations from this calculated value would impact total annual energy impact results. Costs are expressed as differential cost. Differential cost is defined as the incremental cost of the lightweight component beyond its original cost. For example, if a lightweight door cost $2000 each, and the original door cost $1500 each, then the differential cost to achieve the mass savings is $500. There is a great deal of complexity around just how to configure an on-board energy storage system. This report bases its analysis around a 12 kWh storage system. This is the maximum regenerative energy possible on the NYC Transit system per stop, per 10 car train. For reference, an average start/stop cycle consumes about 23 kWh per 10 car train. Note that roughly 75% of the fleet is operated as 10-car trains with 25% (roughly 1600 cars) operated as 8-car trains.
The MTA Blue Ribbon Commission on Sustainability: Traction Power
- 6 -
Figure 3 - 12 Year Overhaul Historical and Projected Data 1996 - 2019 Annual Retrofit Potential - 12 Year Major Overhaul
Year
Numberof Cars -12 Year
Overhaul
1996 1998 2000 2002 2004 2006 2008 2010 2012 2014 2016 2018 20200
1.100
300
800
1.400
600
100
1.000
700
500
200
1.200
400
900
1.300 * Projected data
Annual 12 Year Overhauls
R160 Fleet
R 36 - R62 class
IV. Analytical Results A. Regenerative Energy Techniques Figure 4, below, summarizes the costs per 10-car train and energy savings achieved by applying various regenerative energy technologies to the fleet via retrofit.
Figure 4 - Key Parameters for Regenerative Energy System Technologies
Technology Maturity
1.4
0.62
4.3
5.6
5.0
2.4
8.1
Payback Period(Years)
2.46
0.71
9.85
12.98
21.64
n/a
n/a
Volume Required
(m3)*
1,07075013350On-board Flywheel
933750n/aTrackside Storage (Flywheel)
2459n/aSoftware Modification to Increase Rail Voltage Limits
2677502500On-board Nickel Metal Hydride (NiMH) Battery
115750720On-board Lithium (Li-ion) Battery
7947505400On-board Super Capacitor
Ease of Implementation
n/a
MassImpact (kg)*
1,508
Cost Per 10 Car Train
($,thousands)
750
Fleet-wide Annual Electrical Consumption Impact (millions kWh)
Start/Stop Synchronization
Source: LTK Engineering, Turner Engineering, MTA Smart Fleet Green Initiatives, MTA interviews, Booz Allen Hamilton analysis
* Mass and volume impact based upon a 10 car train and are sized assuming on-board energy storage of 12 kWh - the maximum potential energy regenerated by an average 10 car train
Note: MTA NYC Transit Annual traction power consumption ~ 2,000 GWh
Note: A single 75 foot railcar has an approximate interior volume of 125 m3
= High Rated = Low Rated = High Rated = Low Rated
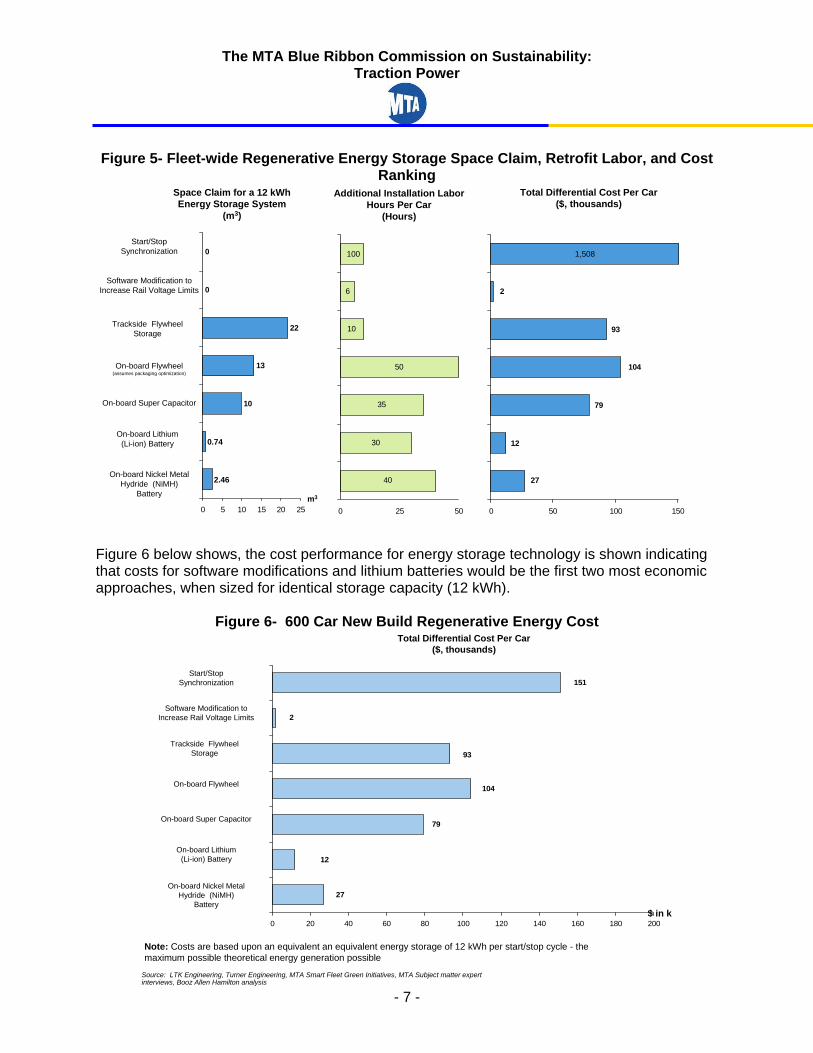
Figure 5, shows the space claim, labor hours and total costs associated with retrofitting the entire fleet with each of these technologies.
The MTA Blue Ribbon Commission on Sustainability: Traction Power
- 7 -
Figure 5- Fleet-wide Regenerative Energy Storage Space Claim, Retrofit Labor, and Cost Ranking
Total Differential Cost Per Car ($, thousands)
Additional Installation Labor Hours Per Car
(Hours)
10
13
22
0
0
0 5 10 15 20 25
0.74
2.46
m3
On-board Lithium (Li-ion) Battery
On-board Nickel Metal Hydride (NiMH)
Battery
On-board Super Capacitor
Start/Stop Synchronization
Software Modification to Increase Rail Voltage Limits
Trackside Flywheel Storage
On-board Flywheel (assumes packaging optimization)
Space Claim for a 12 kWh Energy Storage System
(m3)
6
10
50
35
30
40
0 25 50
100
79
104
93
27
12
2
0 50 100 15
1,508
0
Figure 6 below shows, the cost performance for energy storage technology is shown indicating that costs for software modifications and lithium batteries would be the first two most economic approaches, when sized for identical storage capacity (12 kWh).
Figure 6- 600 Car New Build Regenerative Energy CostTotal Differential Cost Per Car
($, thousands)
On-board Lithium (Li-ion) Battery
On-board Nickel Metal Hydride (NiMH)
Battery
On-board Super Capacitor
Start/Stop Synchronization
Software Modification to Increase Rail Voltage Limits
Trackside Flywheel Storage
On-board Flywheel
Note: Costs are based upon an equivalent an equivalent energy storage of 12 kWh per start/stop cycle - the maximum possible theoretical energy generation possible
Source: LTK Engineering, Turner Engineering, MTA Smart Fleet Green Initiatives, MTA Subject matter expert interviews, Booz Allen Hamilton analysis
151
2
93
104
79
12
27
0 20 40 60 80 100 120 140 160 180 200$ in k
The MTA Blue Ribbon Commission on Sustainability: Traction Power
- 8 -
Some energy storage technologies (on-board flywheel) have already been shown to be unviable through MTA demonstrations and are depicted for reference only – not as recommended options. Lithium battery technology is not yet commercially available as an integrated bolt-on component for rail car applications, but may become so over the next 5 years due to the extensive development effort driven primarily by automotive hybrid applications. Large commercial availability of non-rail systems is about 2 years away, after which rail integrators could develop and test transit qualified modules. Stop-start synchronization is impractical to implement. Software modification to increase rail voltage is currently under review by MTA with preliminary planning underway to implement. While both NiMH batteries and supercapacitors require MTA-specific analysis prior to implementation, they are commercially available at this time. On-board storage technologies are mutually exclusive. One typically would not use both supercapacitors and NiMH batteries on the same car, but instead use one or the other technology. NiMH batteries offer better cost performance than supercapacitors. NiMH battery cycle limitations would also require multiple battery replacements per year, and Lithium battery technology represents best in class energy storage performance (capacity, power density, cycle life) and due to the high cycle operation common in a transit system, would be the only solution with reasonable economics over a 40 year lifecycle. Also, as the two year recommended replacement interval occurs, lithium batteries experience a graceful degradation of capacity loss, eventually leading to zero energy storage capacity.
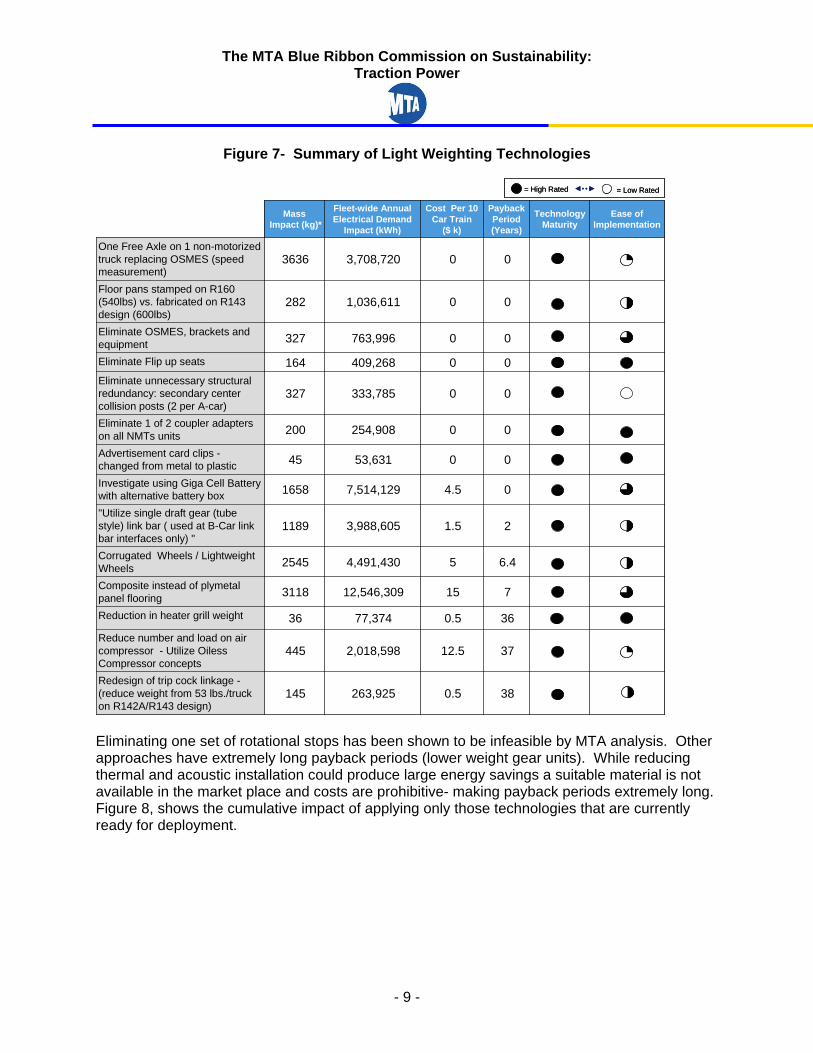
B. Mass Reduction Techniques to Reduce Traction Energy Consumption Mass reduction techniques are also capable of reducing annual electrical traction energy demands, but at a much lower level than regenerative energy and storage techniques. MTA has already deployed weight saving technologies across the fleet such as corrugated wheels, modified trip cock linkages, and elimination of redundant coupler adapters. These modifications are estimated to produce over 11 million kWh in annual electricity savings. In Figure 7 below, mass reduction technologies yet to be deployed are shown. Note that payback periods are extremely high in specific cases due to the high cost of implementing the modifications and only moderate weight savings. In addition to economic payback concerns, mass reduction modification can often have related operational, safety and environmental benefits. For example, the oiless air compressor is both lighter in weight and significantly reduces the amount of oily compressed air that is released into the environment.
The MTA Blue Ribbon Commission on Sustainability: Traction Power
- 9 -
Figure 7- Summary of Light Weighting Technologies
Source: LTK Engineering, Turner Engineering, MTA Smart Fleet Green Initiatives, Booz Allen Hamilton analysis
* Mass and volume impact based upon a 10 car train
3712.52,018,598445Reduce number and load on air compressor - Utilize OilessCompressor concepts
04.57,514,1291658Investigate using Giga Cell Battery with alternative battery box
00254,908200Eliminate 1 of 2 coupler adapters on all NMTs units
003,708,7203636One Free Axle on 1 non-motorized truck replacing OSMES (speed measurement)
001,036,611282Floor pans stamped on R160 (540lbs) vs. fabricated on R143 design (600lbs)
Technology Maturity
71512,546,3093118Composite instead of plymetalpanel flooring
360.577,37436Reduction in heater grill weight
380.5263,925145Redesign of trip cock linkage -(reduce weight from 53 lbs./truck on R142A/R143 design)
6.454,491,4302545Corrugated Wheels / Lightweight Wheels
2
0
0
0
0
Payback Period(Years)
0763,996327Eliminate OSMES, brackets and equipment
1.53,988,6051189"Utilize single draft gear (tube style) link bar ( used at B-Car link bar interfaces only) "
053,63145Advertisement card clips -changed from metal to plastic
0333,785327Eliminate unnecessary structural redundancy: secondary center collision posts (2 per A-car)
0409,268164Eliminate Flip up seats
Ease of Implementation
MassImpact (kg)*
Cost Per 10 Car Train
($ k)
Fleet-wide Annual Electrical Demand
Impact (kWh)
= High Rated = Low Rated = High Rated = Low Rated
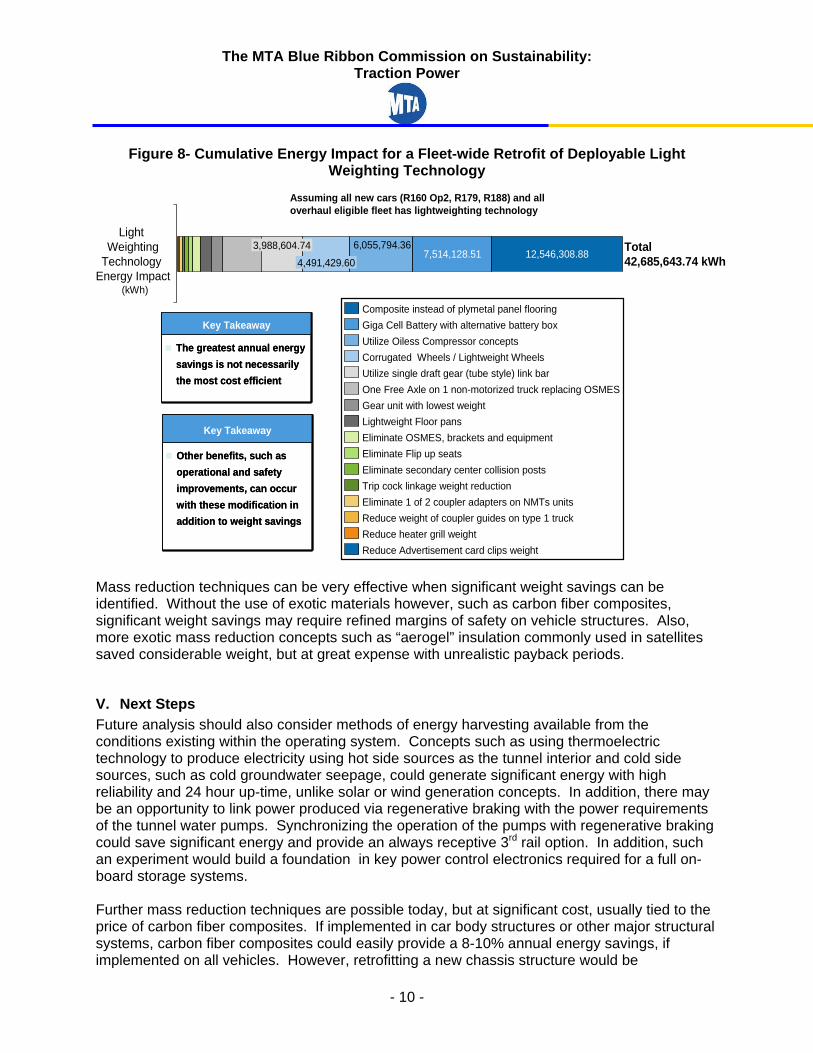
Eliminating one set of rotational stops has been shown to be infeasible by MTA analysis. Other approaches have extremely long payback periods (lower weight gear units). While reducing thermal and acoustic installation could produce large energy savings a suitable material is not available in the market place and costs are prohibitive- making payback periods extremely long. Figure 8, shows the cumulative impact of applying only those technologies that are currently ready for deployment.
The MTA Blue Ribbon Commission on Sustainability: Traction Power
- 10 -
Figure 8- Cumulative Energy Impact for a Fleet-wide Retrofit of Deployable Light Weighting Technology
6,055,794.367,514,128.51
4,491,429.60
Utilize single draft gear (tube style) link bar
3,988,604.74 Total42,685,643.74 kWh
Light Weighting
Technology Energy Impact
12,546,308.88
Composite instead of plymetal panel flooringGiga Cell Battery with alternative battery boxUtilize Oiless Compressor concepts Corrugated Wheels / Lightweight Wheels
One Free Axle on 1 non-motorized truck replacing OSMESGear unit with lowest weightLightweight Floor pans Eliminate OSMES, brackets and equipmentEliminate Flip up seatsEliminate secondary center collision postsTrip cock linkage weight reductionEliminate 1 of 2 coupler adapters on NMTs unitsReduce weight of coupler guides on type 1 truckReduce heater grill weightReduce Advertisement card clips weight
Assuming all new cars (R160 Op2, R179, R188) and all overhaul eligible fleet has lightweighting technology
(kWh)
The greatest annual energy savings is not necessarily the most cost efficient
Key Takeaway
The greatest annual energy savings is not necessarily the most cost efficient
Key Takeaway
Other benefits, such as operational and safety improvements, can occur with these modification in addition to weight savings
Key Takeaway
Other benefits, such as operational and safety improvements, can occur with these modification in addition to weight savings
Key Takeaway
Mass reduction techniques can be very effective when significant weight savings can be identified. Without the use of exotic materials however, such as carbon fiber composites, significant weight savings may require refined margins of safety on vehicle structures. Also, more exotic mass reduction concepts such as “aerogel” insulation commonly used in satellites saved considerable weight, but at great expense with unrealistic payback periods.
V. Next Steps Future analysis should also consider methods of energy harvesting available from the conditions existing within the operating system. Concepts such as using thermoelectric technology to produce electricity using hot side sources as the tunnel interior and cold side sources, such as cold groundwater seepage, could generate significant energy with high reliability and 24 hour up-time, unlike solar or wind generation concepts. In addition, there may be an opportunity to link power produced via regenerative braking with the power requirements of the tunnel water pumps. Synchronizing the operation of the pumps with regenerative braking could save significant energy and provide an always receptive 3rd rail option. In addition, such an experiment would build a foundation in key power control electronics required for a full on-board storage systems. Further mass reduction techniques are possible today, but at significant cost, usually tied to the price of carbon fiber composites. If implemented in car body structures or other major structural systems, carbon fiber composites could easily provide a 8-10% annual energy savings, if implemented on all vehicles. However, retrofitting a new chassis structure would be

The MTA Blue Ribbon Commission on Sustainability: Traction Power
- 11 -
prohibitively time consuming and expensive. Composite chassis structures are more ideal for new build. When carbon fiber pricing is reduced, further significant mass reduction will be possible. However, as composites become less costly, significant energy savings can be obtained at . Also, as energy storage and regeneration technologies improve, it may be possible to capture greater energy than is possible with current systems. Technologies such as switched reluctance combined motor/generators may provide further energy savings at low cost.
The MTA Blue Ribbon Commission on Sustainability: Traction Power
- 12 -
Appendix 1- Glossary of terms used in Figures 2 and 5
We approached the problem using a set of factors as key performance parameters. The key parameters are mass impact, volume required, annual energy impact, cost equivalent energy impact, technology maturity, implementation difficulty, system cost, and payback period. 1. Mass Impact The mass impact represents the reduction in mass possible through light weighting technology and concepts, as applied to a standard 10 car train. In some cases, the mass impacts are estimated due to the lack of fully developed technology specifications because the technology may still be in the experimental/laboratory phase. 2. Volume Required The volume required represents the space claim necessary to support an on-board energy storage system. Cubic meters is used as the unit of measure. In some cases, the volume impacts are estimated due to the lack of fully developed technology specifications because the technology may still be in the experimental/laboratory phase. 3. Annual Energy Impact The annual energy impact represents the amount of energy in kWh that is saved from the application of innovative technological and operational concepts. 4. Cost Equivalent Energy Impact The annual energy impact possible from applying an equivalent dollar amount to a standard 10 car train. 5. Technology Maturity Technology maturity represents the position of the technology on the development lifecycle. For instance, lithium batteries are not yet available commercially available in sizes and configurations suitable for rail car applications- this technology would be rated at the lowest level of maturity. 6. Ease of Implementation Ease of implementation represents the degree of challenges that are likely to occur with each energy saving concept. For example, the start and stop synchronization is known to have a practically insurmountable implementation difficulty due to the increases in headway time and reduction in rush hour capacity- this technology would be rated at the lowest level of ease of implementation. 7. System Cost System cost represents the “all-in” cost of development, procurement and retrofit. For many of the energy storage and mass reduction techniques, significant development costs are necessary to actually implement these concepts. The cost estimates for development and procurement are based upon best estimates available in literature, MTA reports, and
The MTA Blue Ribbon Commission on Sustainability: Traction Power
- 13 -
discussions with transportation experts. Retrofit costs are based upon fully burdened labor costs obtained from the MTA and labor hours based upon the 12 year Scheduled Maintenance System (SMS) overhaul plan. 8. Payback Period Payback period represents the time necessary for the system cost to be recovered by the energy savings created by each respective system, expressed in years. Energy value is calculated at $0.11 per kWh. This is a blended rate calculated from NYPA utility bills and accounts for both actual power as well as demand charges.
The MTA Blue Ribbon Commission on Sustainability: Traction Power
- 14 -
Appendix 2- Regenerative Energy Technique Definitions
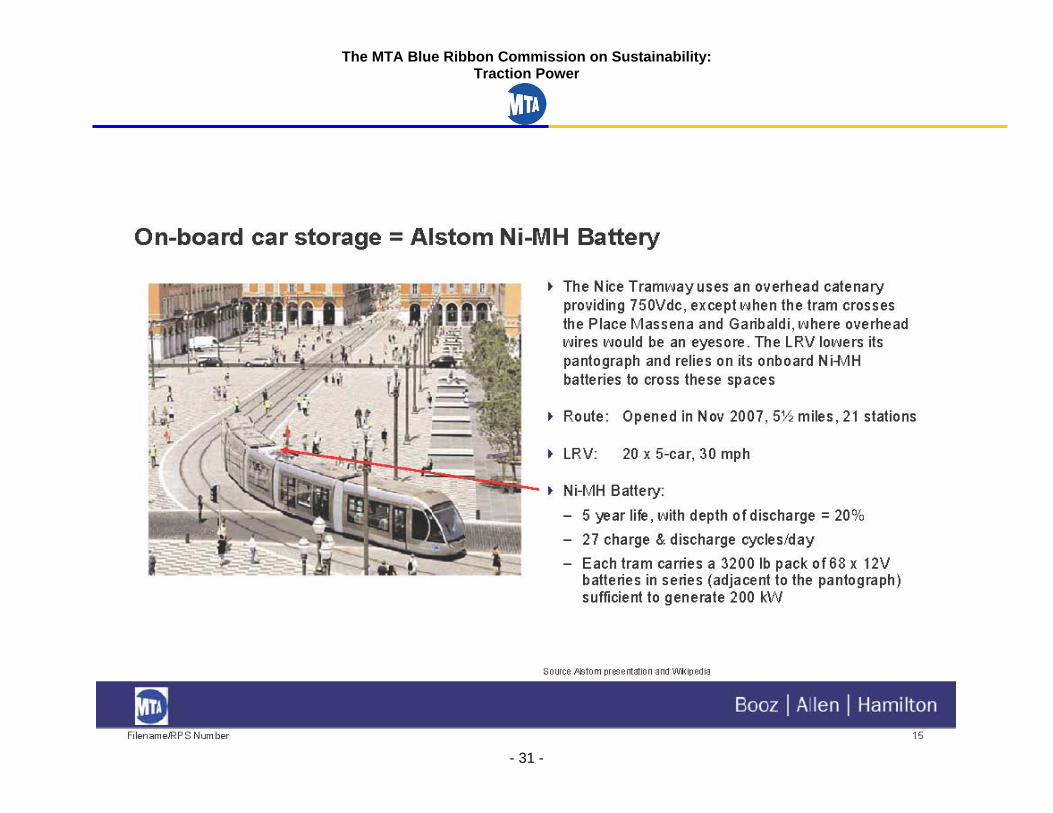
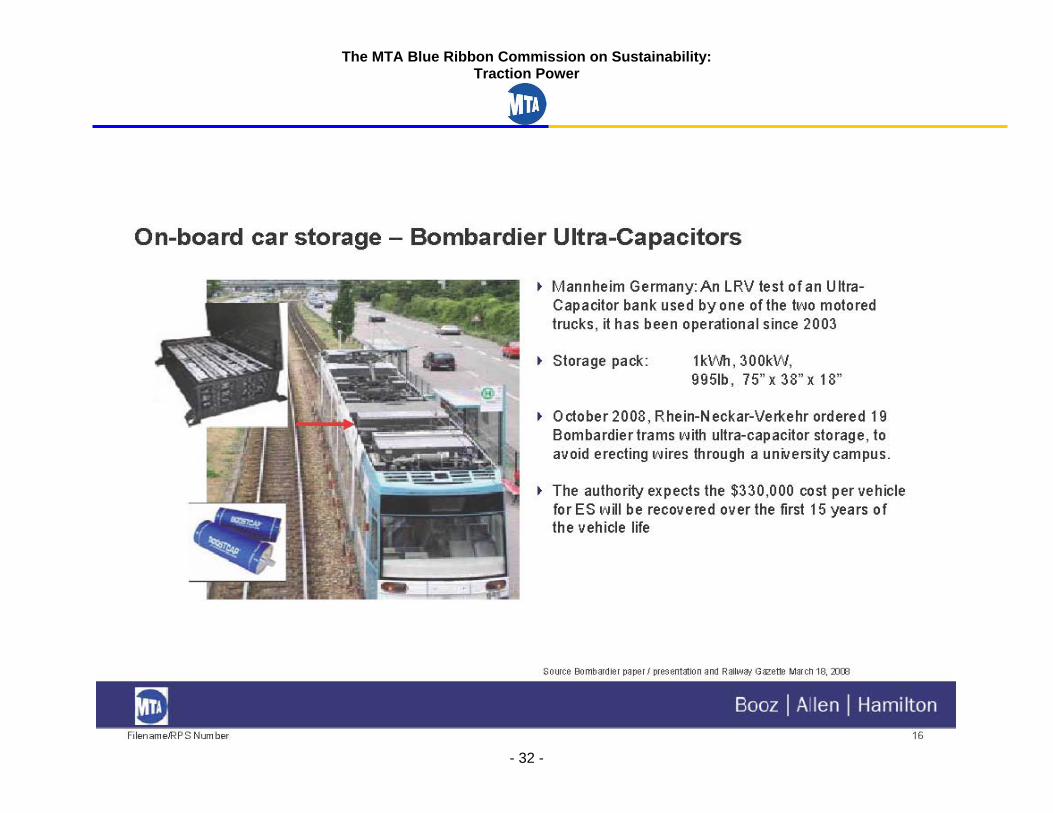
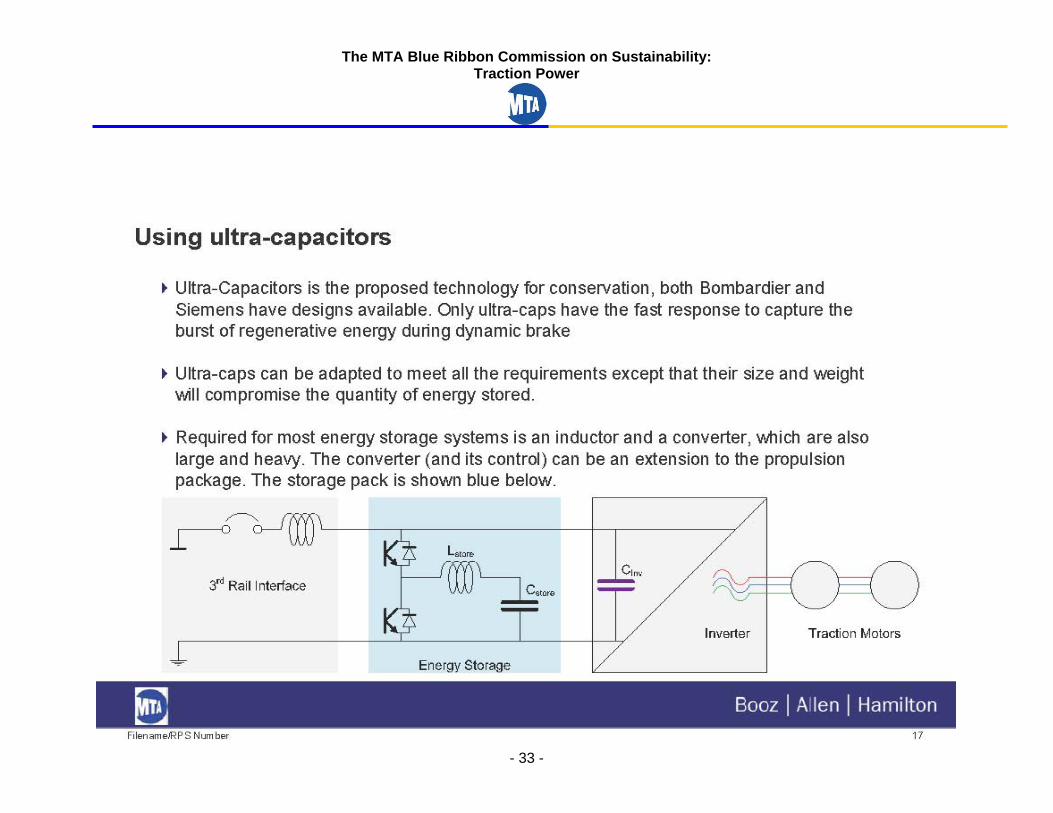
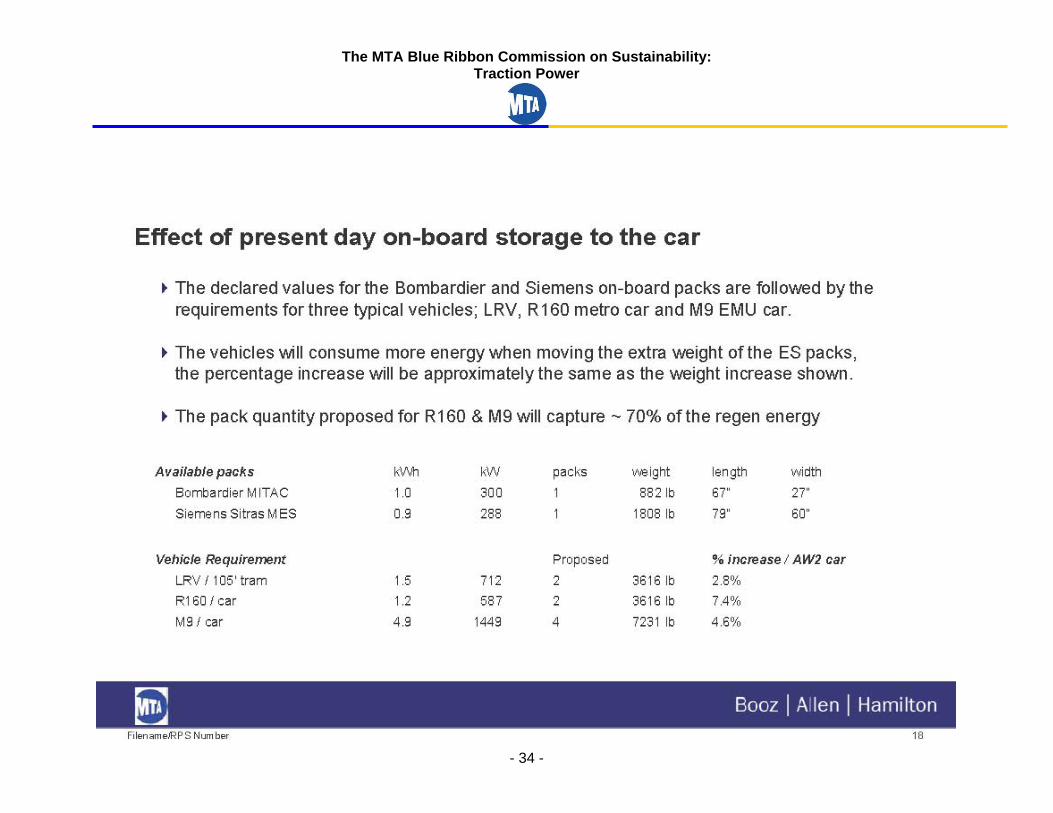
Start/Stop Synchronization: A theoretical concept where trains would not be allowed to leave a station until another in the vicinity was slowing down at the same time. The technique attempts to match the electrical generation from the stopping train with the electrical demand from an accelerating train. Software Modification to Increase Rail Voltage Limits: Propulsion system software would be modified to allow higher voltage limits on the third rail in excess of 690 V. Current software ramps down voltage starting at 650V and fully stops energy regeneration at 690V, at the exact moment energy regeneration is greatest, thus reducing optimal regenerative operating conditions. Some limited hardware modifications may be necessary to implement this software modification, particularly in substations, on-board train inverters, and DC motor drives. Trains would also be programmed to brake at the optimal braking rate to regenerate maximum energy, which is not at maximum brake, but a moderate level that provides a greater time period for energy generation. Physically, this is required to optimally match the regenerative limits of the AC motors with the train mass. In other words, maximum energy generation could also occur at full service brake, but this would require much larger AC motors and inverter systems than currently installed. Trackside Storage: Trackside storage refers to directing energy that is regenerated by a braking train into the 3rd rail, and then directly into a trackside storage system to capture the energy. This technique is particularly effective when other accelerating trains are not in the vicinity of the regenerating train. On-board Supercapacitor: A supercapacitor absorbs the regenerated energy from the train and stores the energy in the form of accumulated charge in a high performance capacitor bank of charged surfaces. It behaves similarly to a battery in that it stores electricity, but supercapacitors discharge power (and recharges) much faster than a battery. The high disharge rate allows better acceleration of rail cars on a city transportation system. For modeling purposes, the Bombardier MITRAC Energy Saver supercapacitor is used for performance calculations. On-board NiMH (Nickel Metal Hydride) Battery: A NiMH battery receives the regenerated energy from the train car and stores it as chemical energy. NiMH batteries have moderate energy density and moderate power density (ability to accept charge at a high rate). NiMH batteries weigh more than Li batteries, but less than lead acid batteries. For modeling purposes, the Cobasys NiMHax 336-70 battery pack is used for performance calculations. This battery represents a best in class nickel metal hydride battery with robust packaging and reasonable near term availability. On-board Lithium Battery: A lithium battery receives the regenerated energy from the train car and stores it as chemical energy. The primary benefit of the lithium battery is greater energy density and greater power density than other battery technologies. This makes it a good fit for high cycle operation on a city transportation system. Lithium batteries are also lighter than NiMH batteries, but cost significantly more. For modeling purposes, the A123 Systems/Continental GM Volt pre-production battery pack is used for performance calculations

The MTA Blue Ribbon Commission on Sustainability: Traction Power
- 15 -
– representing a best in class lithium storage system with robust packaging and reasonable near term availability.
The MTA Blue Ribbon Commission on Sustainability: Traction Power
- 16 -
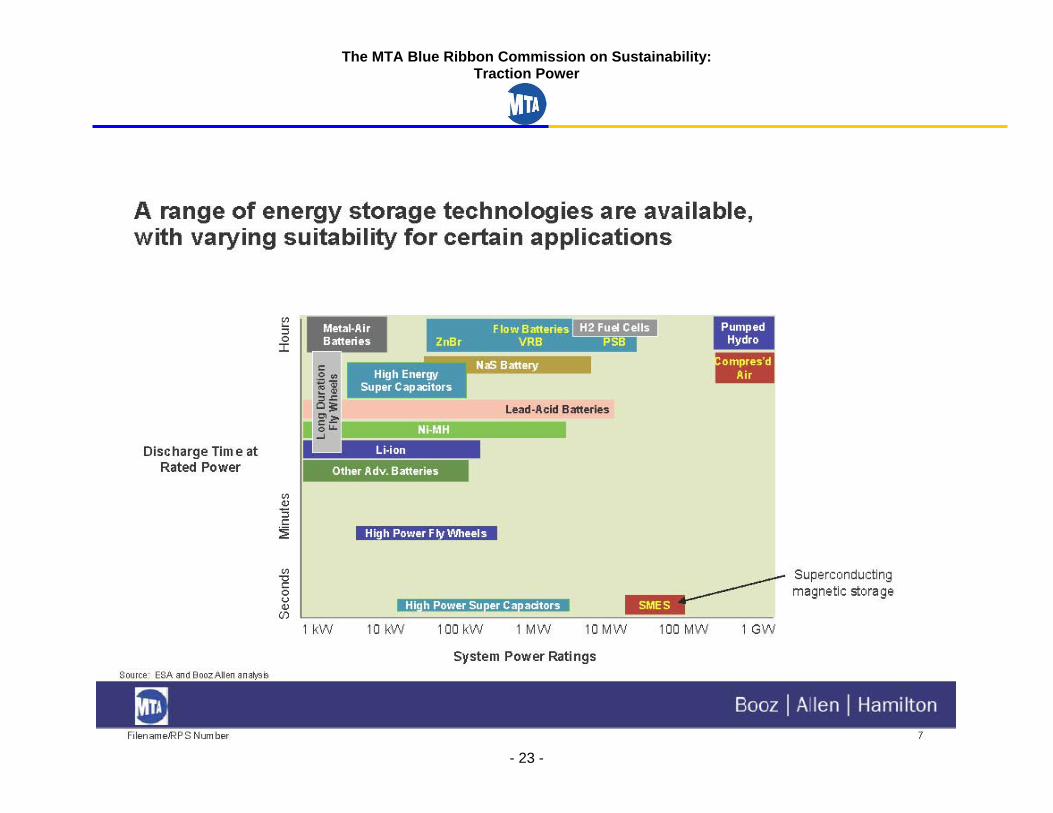
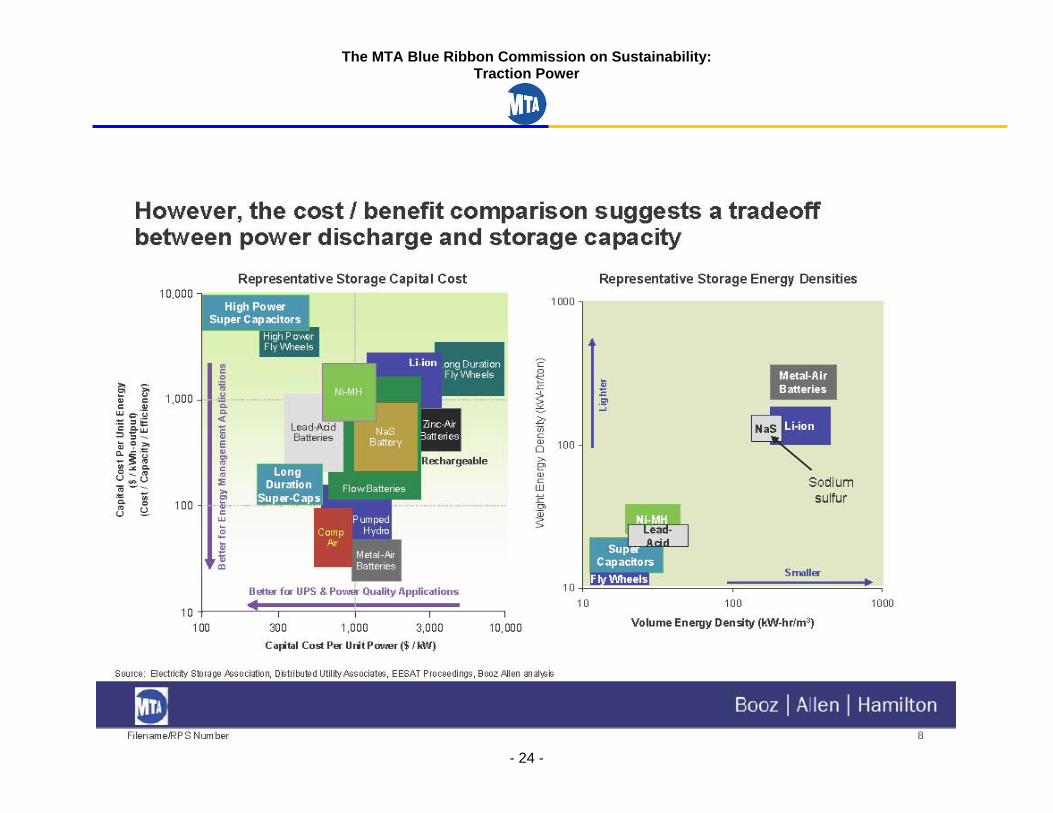
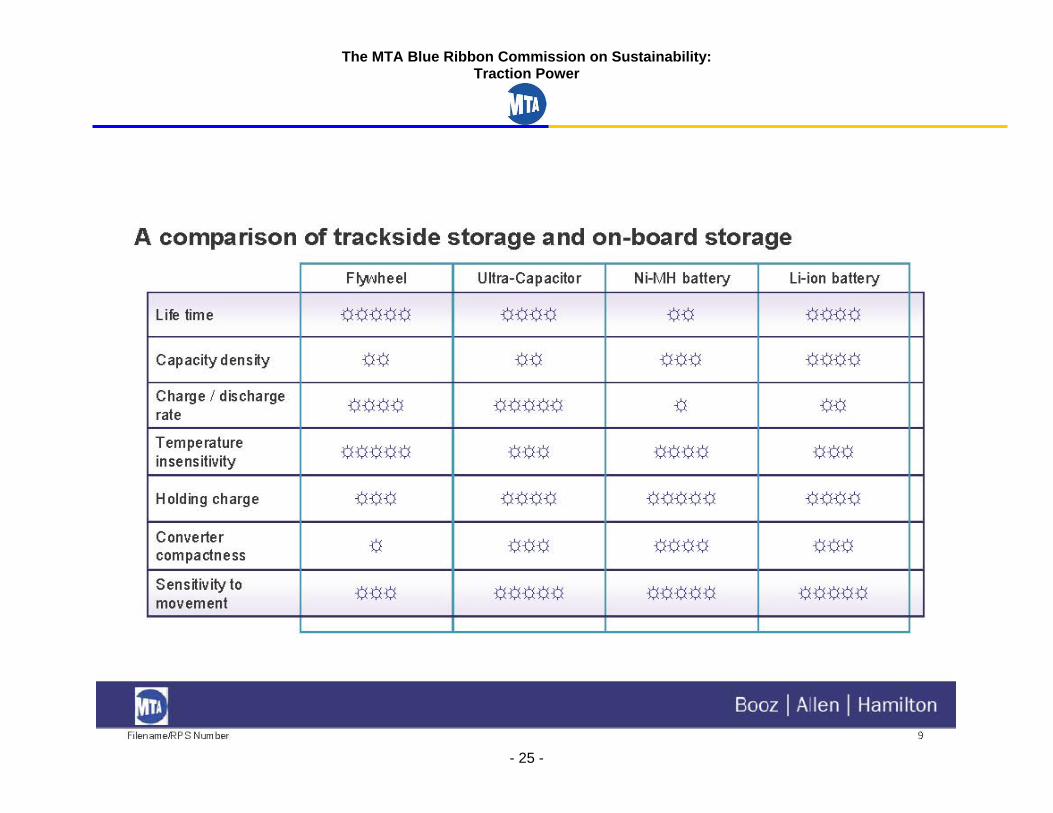
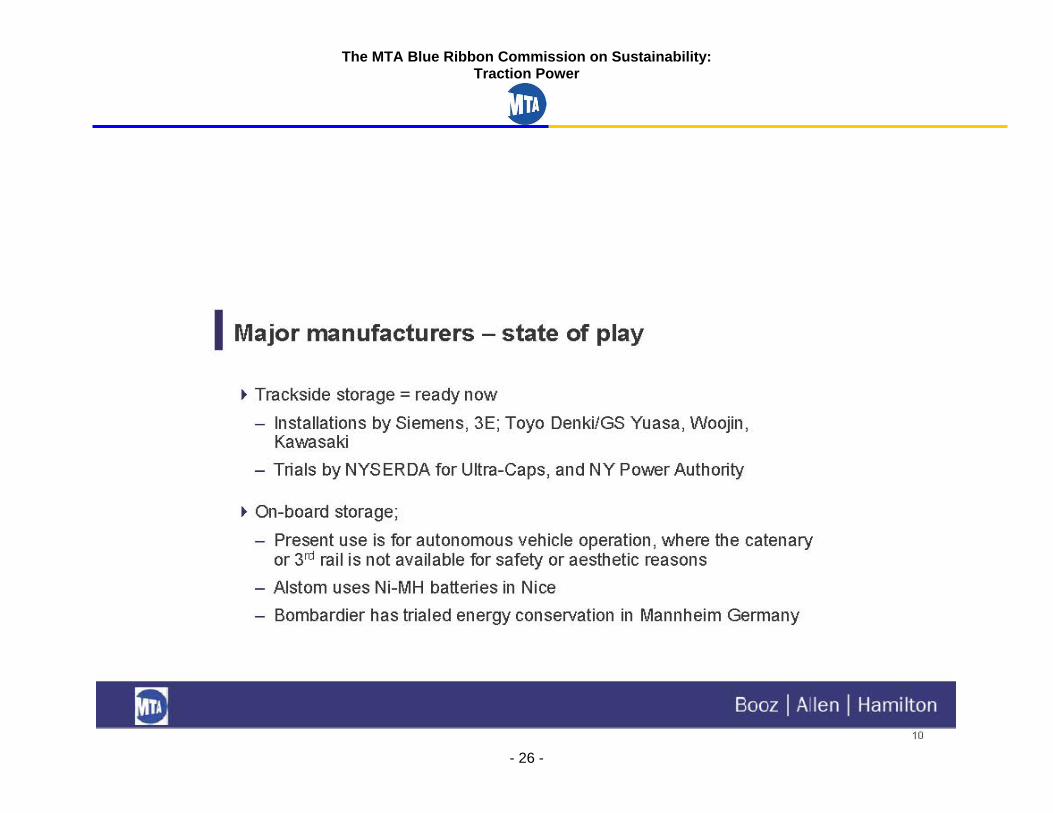
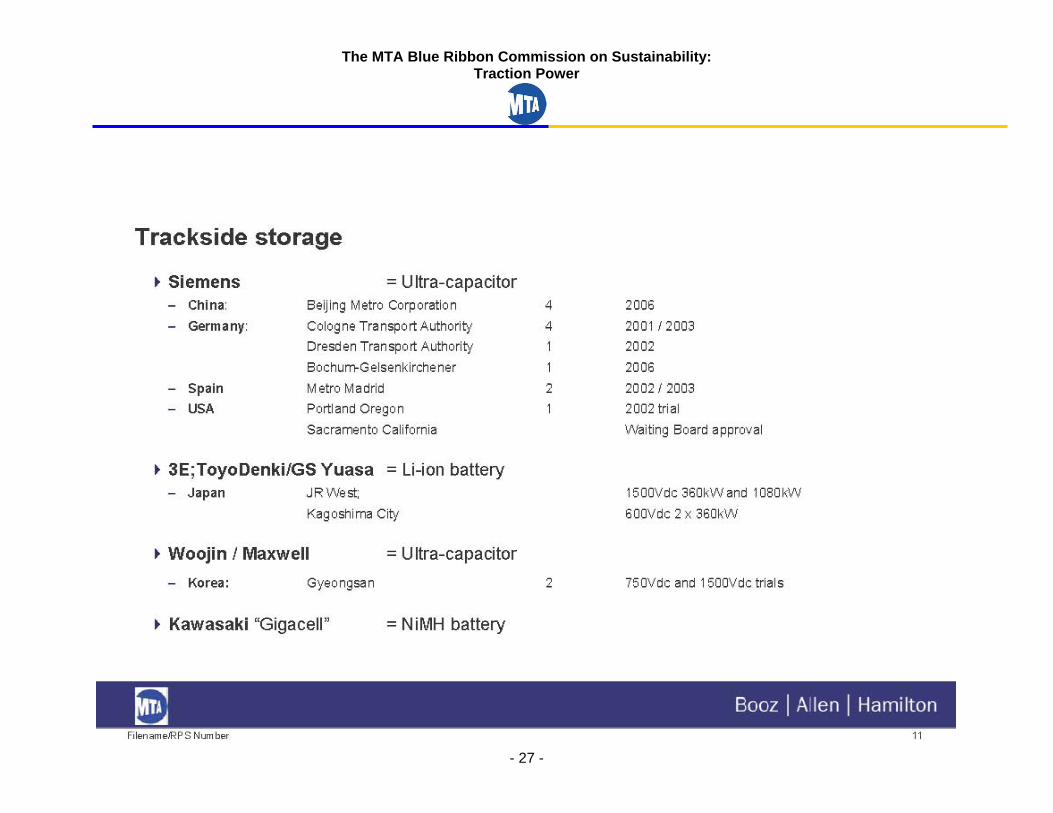
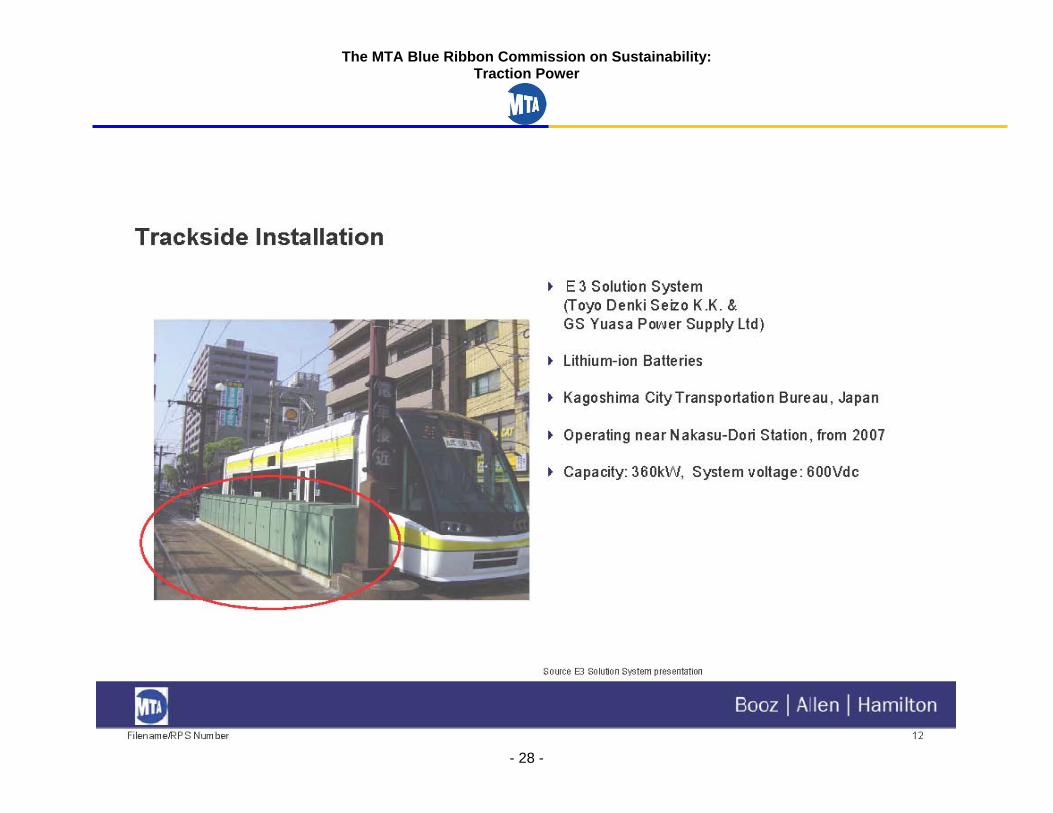
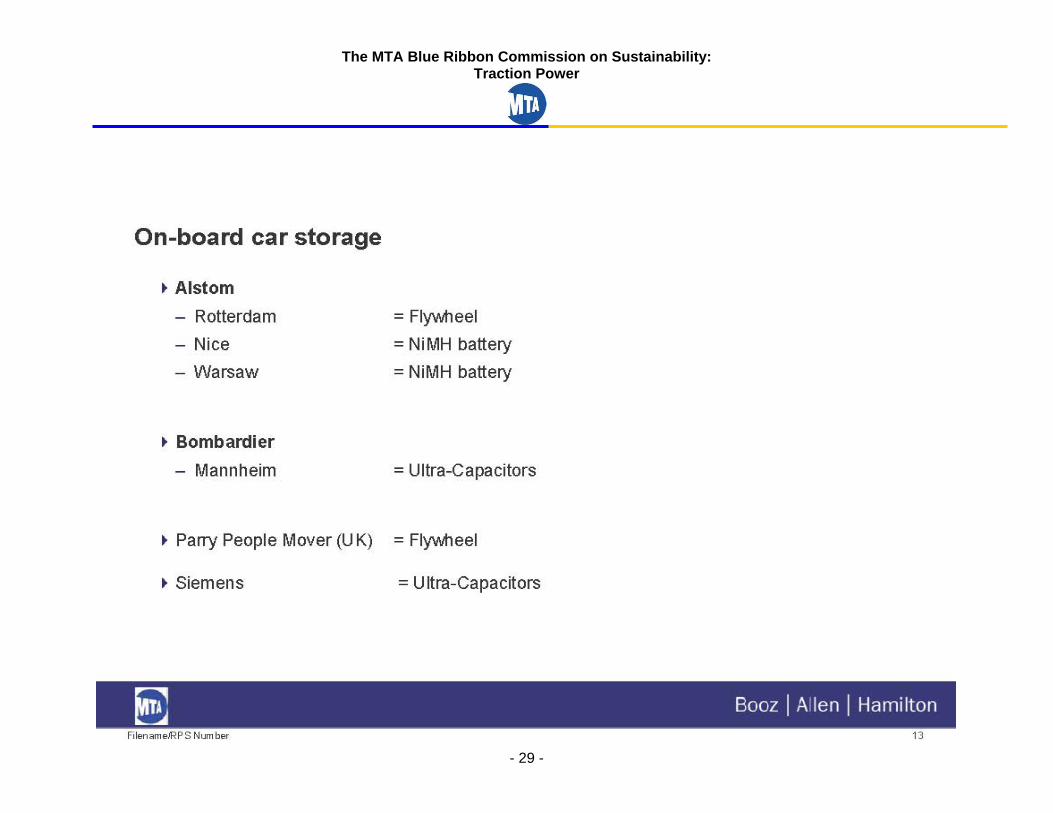
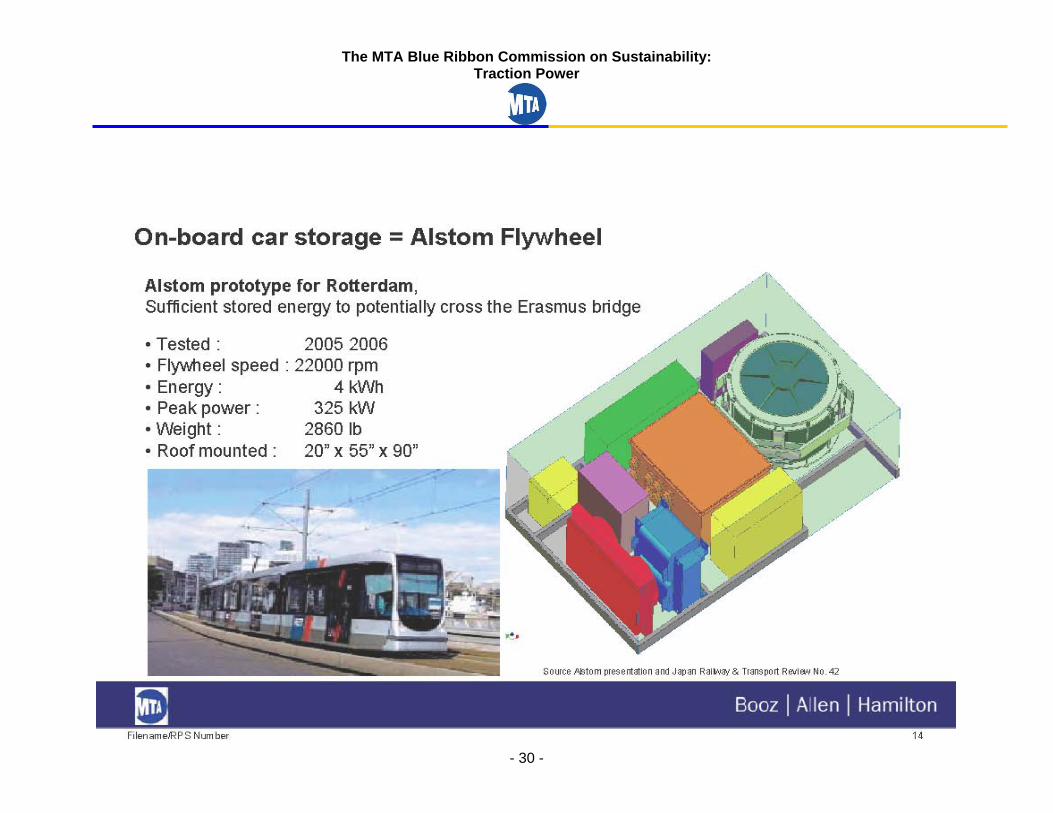
Appendix 3- Storage of Regenerative Energy
The MTA Blue Ribbon Commission on Sustainability: Traction Power
- 17 -
The MTA Blue Ribbon Commission on Sustainability: Traction Power
- 18 -
The MTA Blue Ribbon Commission on Sustainability: Traction Power
- 19 -
The MTA Blue Ribbon Commission on Sustainability: Traction Power
- 20 -
The MTA Blue Ribbon Commission on Sustainability: Traction Power
- 21 -
The MTA Blue Ribbon Commission on Sustainability: Traction Power
- 22 -
The MTA Blue Ribbon Commission on Sustainability: Traction Power
- 23 -
The MTA Blue Ribbon Commission on Sustainability: Traction Power
- 24 -
The MTA Blue Ribbon Commission on Sustainability: Traction Power
- 25 -
The MTA Blue Ribbon Commission on Sustainability: Traction Power
- 26 -
The MTA Blue Ribbon Commission on Sustainability: Traction Power
- 27 -
The MTA Blue Ribbon Commission on Sustainability: Traction Power
- 28 -
The MTA Blue Ribbon Commission on Sustainability: Traction Power
- 29 -
The MTA Blue Ribbon Commission on Sustainability: Traction Power
- 30 -
The MTA Blue Ribbon Commission on Sustainability: Traction Power
- 31 -
The MTA Blue Ribbon Commission on Sustainability: Traction Power
- 32 -
The MTA Blue Ribbon Commission on Sustainability: Traction Power
- 33 -
The MTA Blue Ribbon Commission on Sustainability: Traction Power
- 34 -
The MTA Blue Ribbon Commission on Sustainability: Traction Power
- 35 -
The MTA Blue Ribbon Commission on Sustainability: Traction Power
- 36 -
The MTA Blue Ribbon Commission on Sustainability: Traction Power
- 37 -
The MTA Blue Ribbon Commission on Sustainability: Traction Power
- 38 -

![MTA - Unopomp · TM01 8522 0300 MTA 3 MTA 4 L[mm] 35 45 TM01 8657 0600 TM01 8658 0600 TM01 9076 1000 10 L 10 125 45 Min. 20 mm General data MTA. 6 Technical data MTA 3 MTA 4 ... 105](https://img.pdfslide.us/doc/110x75/5be789d309d3f246788ca2ff/mta-tm01-8522-0300-mta-3-mta-4-lmm-35-45-tm01-8657-0600-tm01-8658-0600-tm01.jpg)