Embed Size (px)
Citation preview
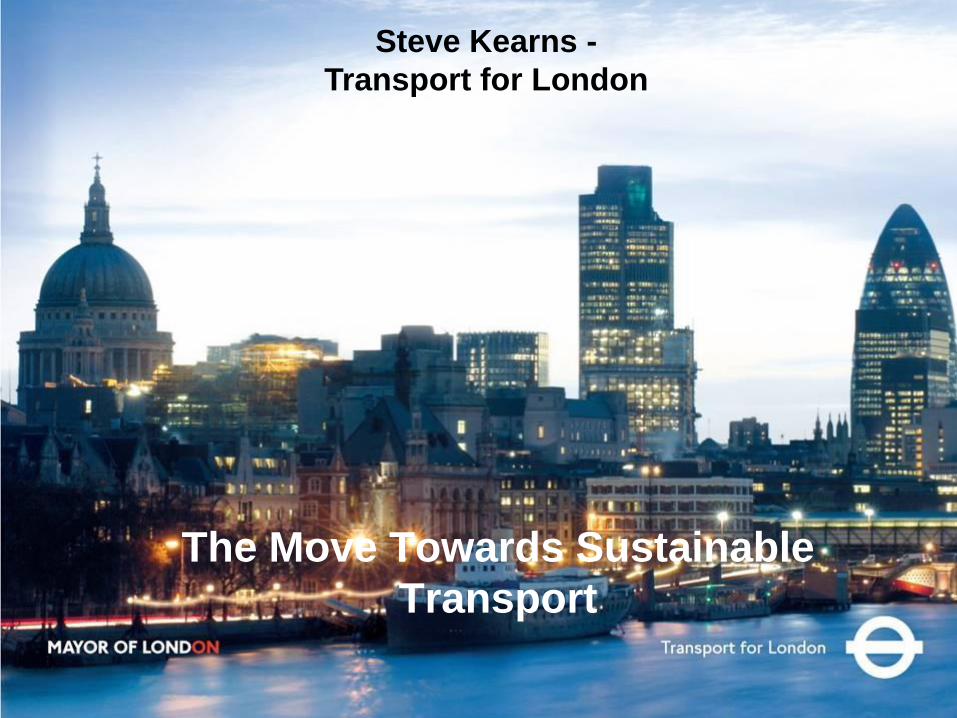
The Move Towards Sustainable
Transport
Steve Kearns -
Transport for London
2
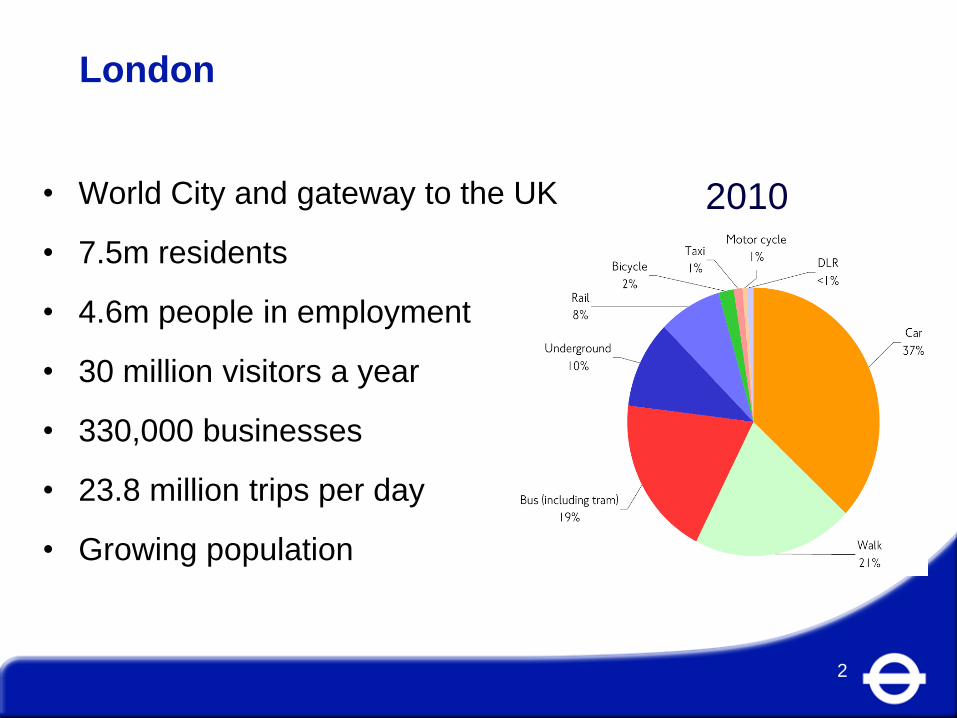
London
• World City and gateway to the UK
• 7.5m residents
• 4.6m people in employment
• 30 million visitors a year
• 330,000 businesses
• 23.8 million trips per day
• Growing population
2010
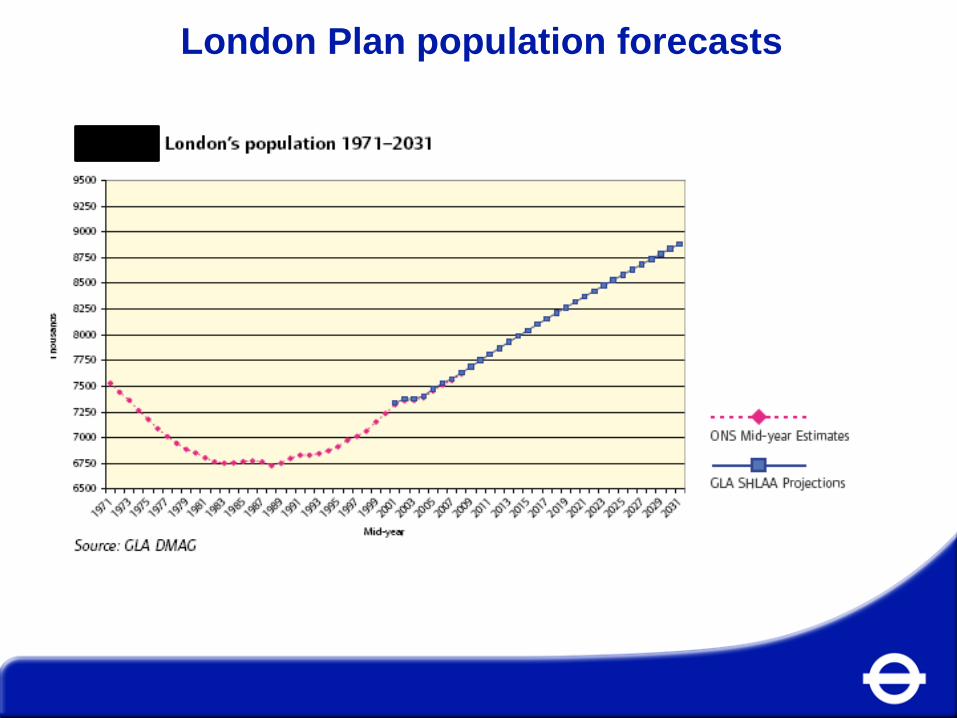
London Plan population forecasts
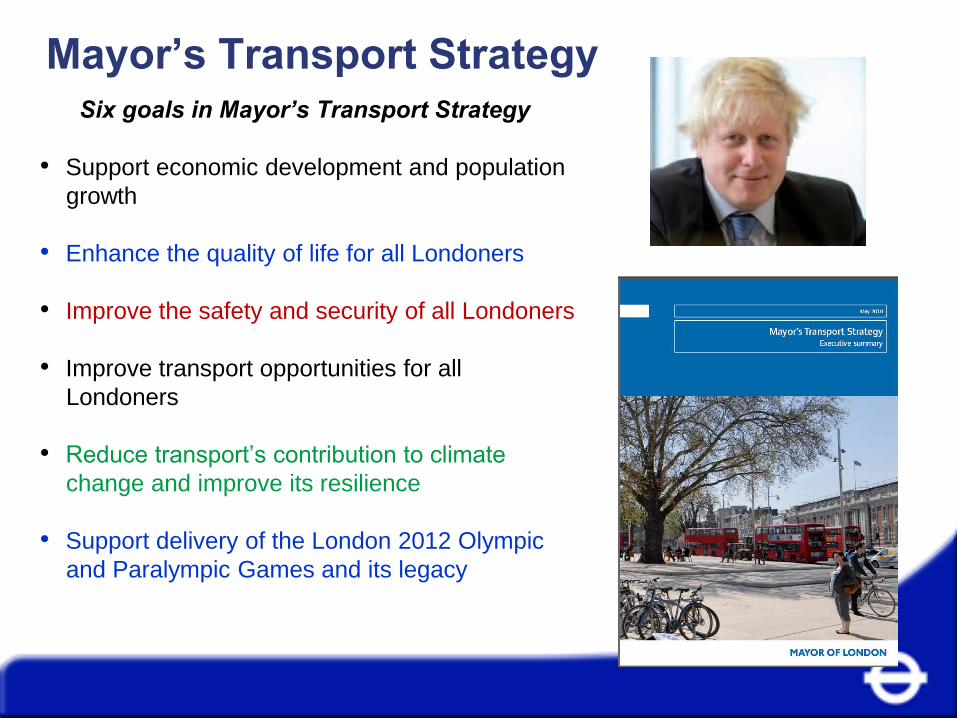
Mayor’s Transport Strategy
4
Contents
• London Context – Mayor’s Transport
Strategy
• Congestion Charging in London
• London – Managing Road Network
Six goals in Mayor’s Transport Strategy
• Support economic development and population
growth
• Enhance the quality of life for all Londoners
• Improve the safety and security of all Londoners
• Improve transport opportunities for all
Londoners
• Reduce transport’s contribution to climate
change and improve its resilience
• Support delivery of the London 2012 Olympic
and Paralympic Games and its legacy
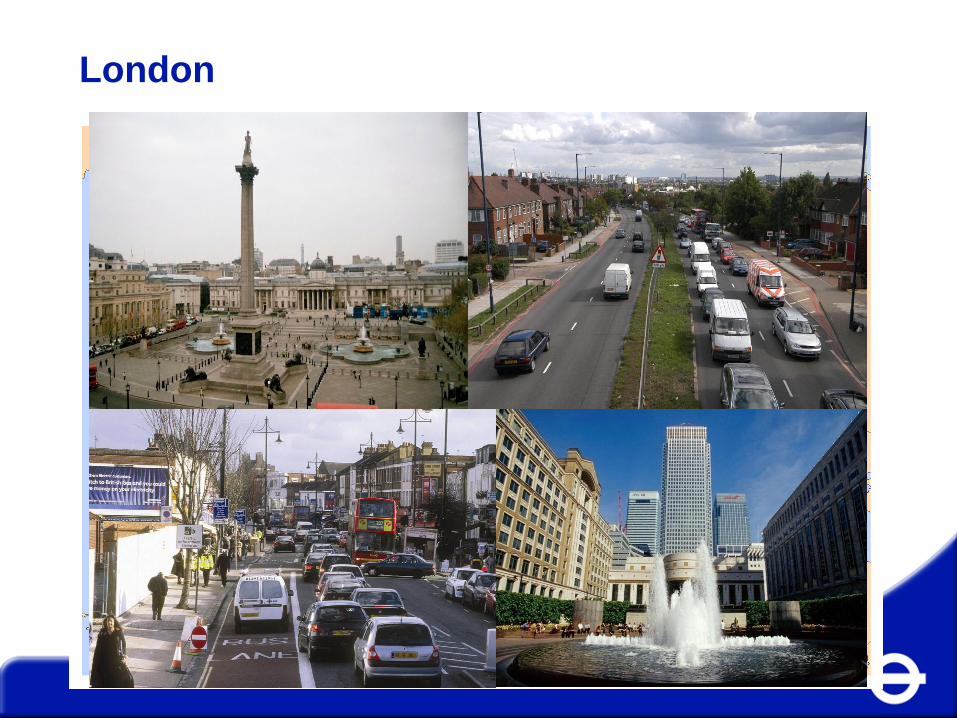
London
5
London
Central London
Docklands
Suburban London
Uxbridge Road
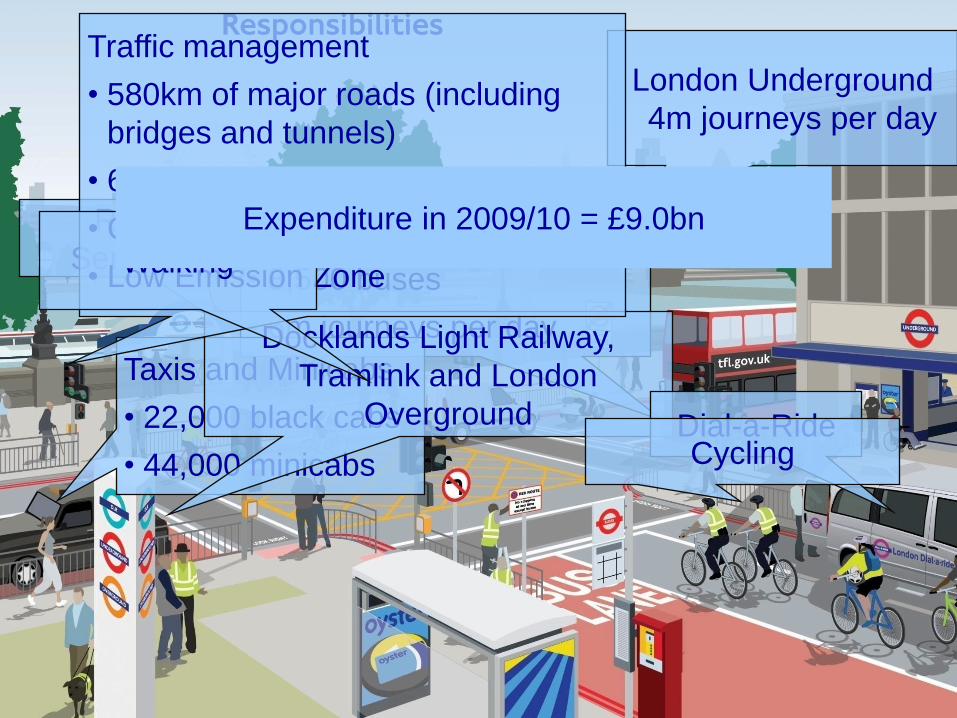
• 580km of major roads
• 6,000 traffic signals
• Bridges and tunnels
• Congestion Charging
Scheme
London Underground
4m journeys per day
Responsibilities
London Buses
• 8,500 buses
• 6m journeys per day
Taxis and Minicabs
• 22,000 black cabs
• 44,000 minicabs
River
Services
Docklands Light Railway,
Tramlink and London
Overground Dial-a-Ride
Traffic management
• 580km of major roads (including
bridges and tunnels)
• 6,000 traffic signals
• Congestion Charging Scheme
• Low Emission Zone
Cycling
Walking
Expenditure in 2009/10 = £9.0bn
Page 7
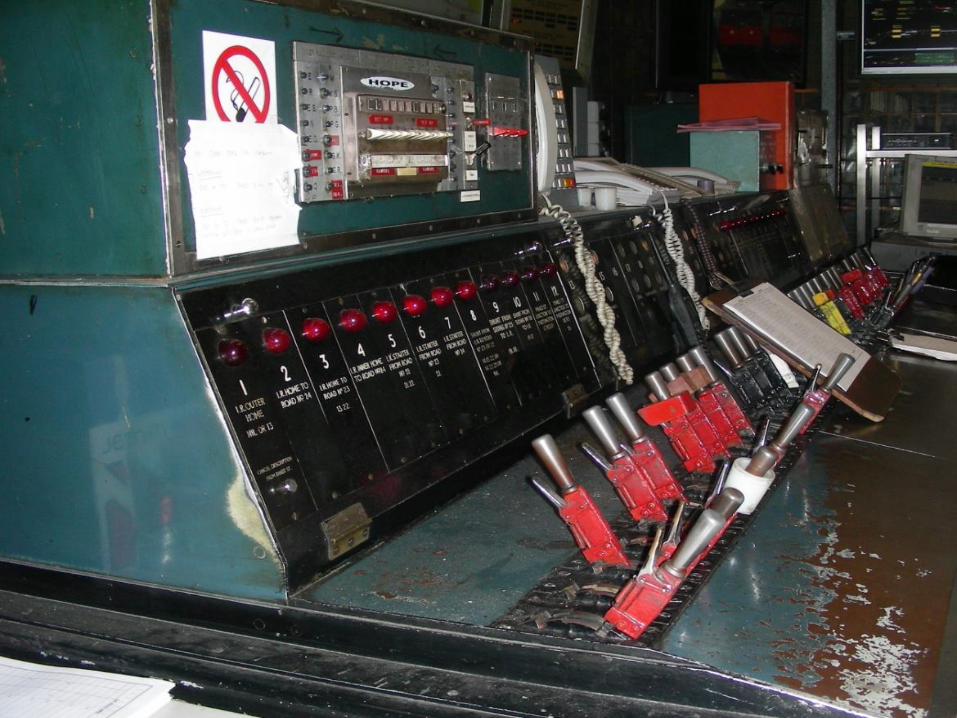
Edgware Road Signal Cabin, 1926
13
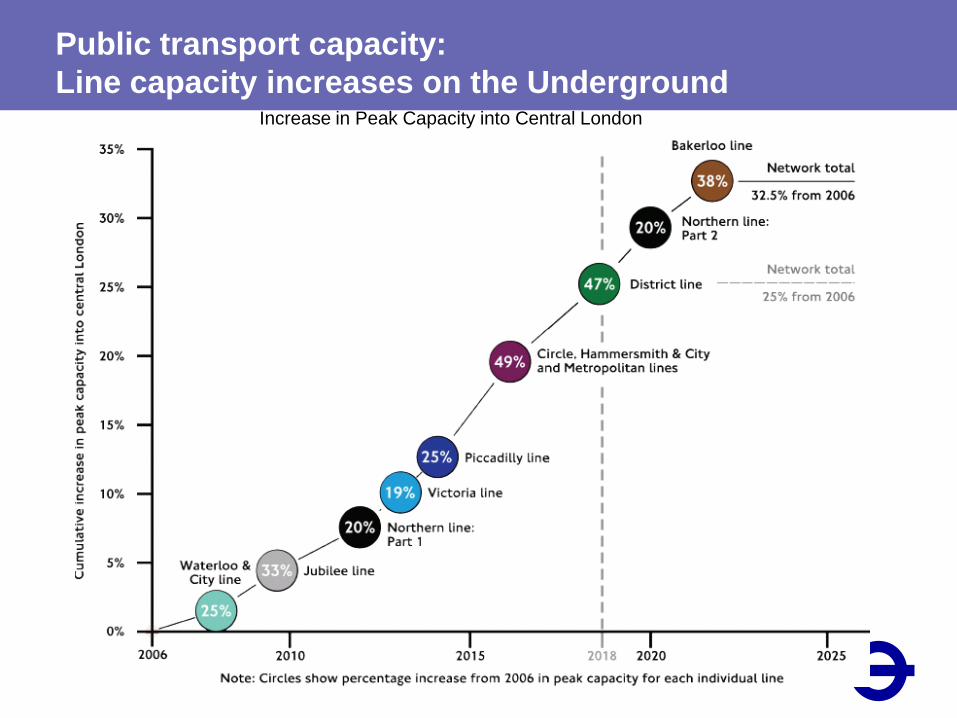
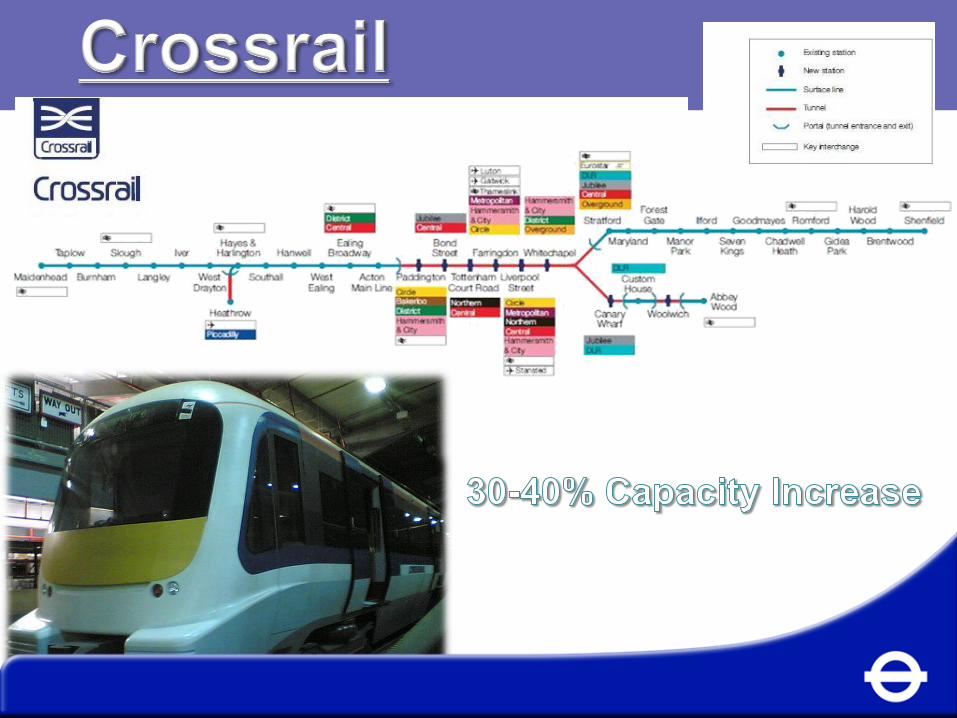
Public transport capacity:
Line capacity increases on the Underground Increase in Peak Capacity into Central London
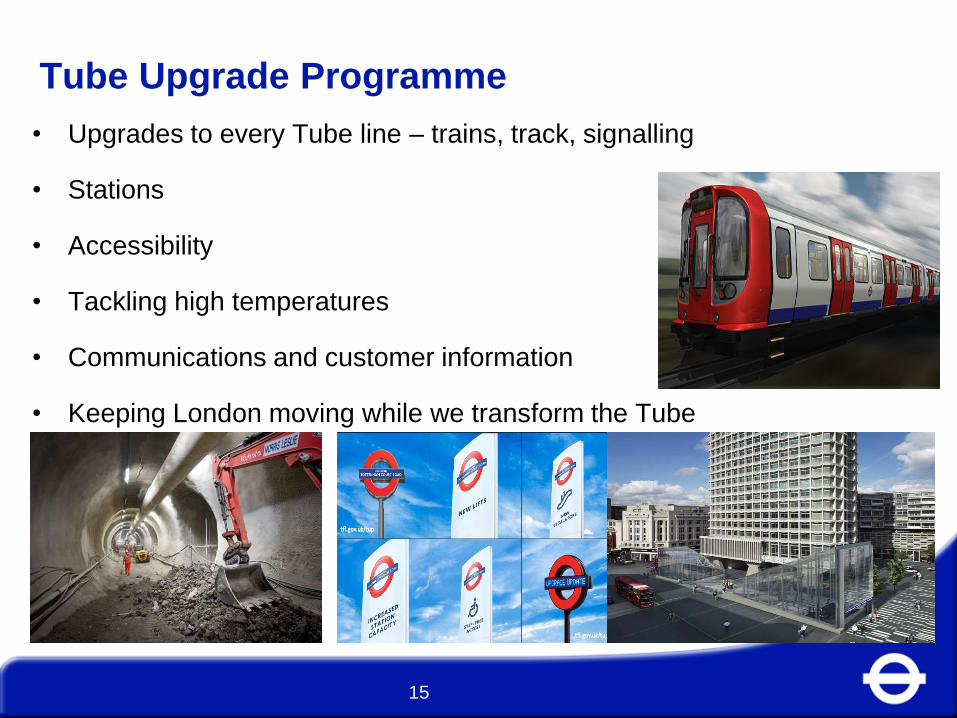
Tube Upgrade Programme
• Upgrades to every Tube line – trains, track, signalling
• Stations
• Accessibility
• Tackling high temperatures
• Communications and customer information
• Keeping London moving while we transform the Tube
15
16
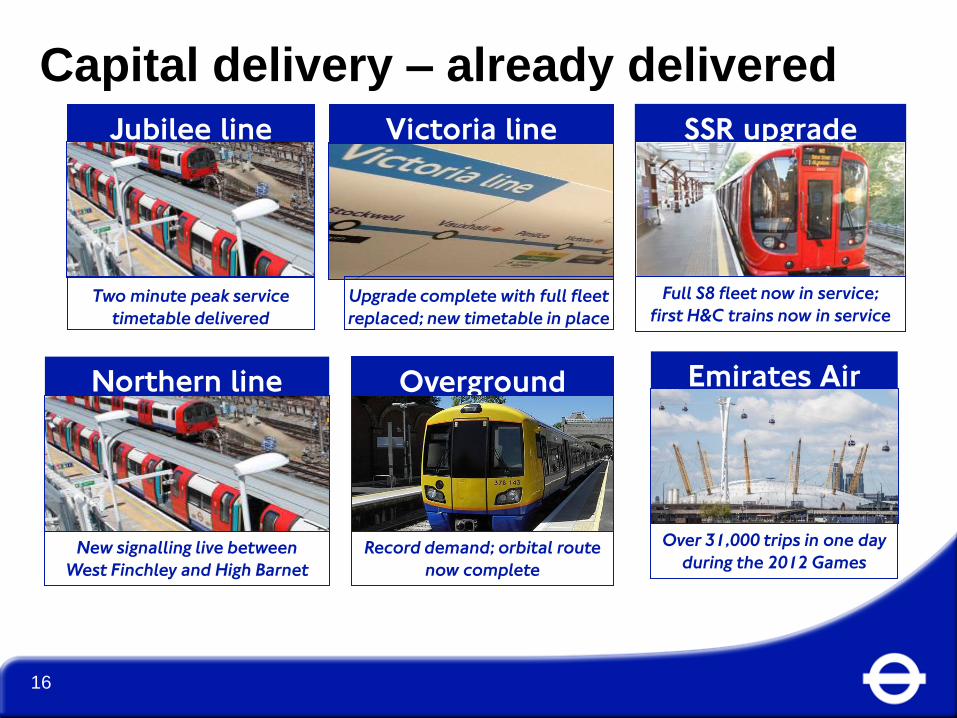
Capital delivery – already delivered
Jubilee line
upgrade
Victoria line
upgrade
SSR upgrade
Northern line
upgrade
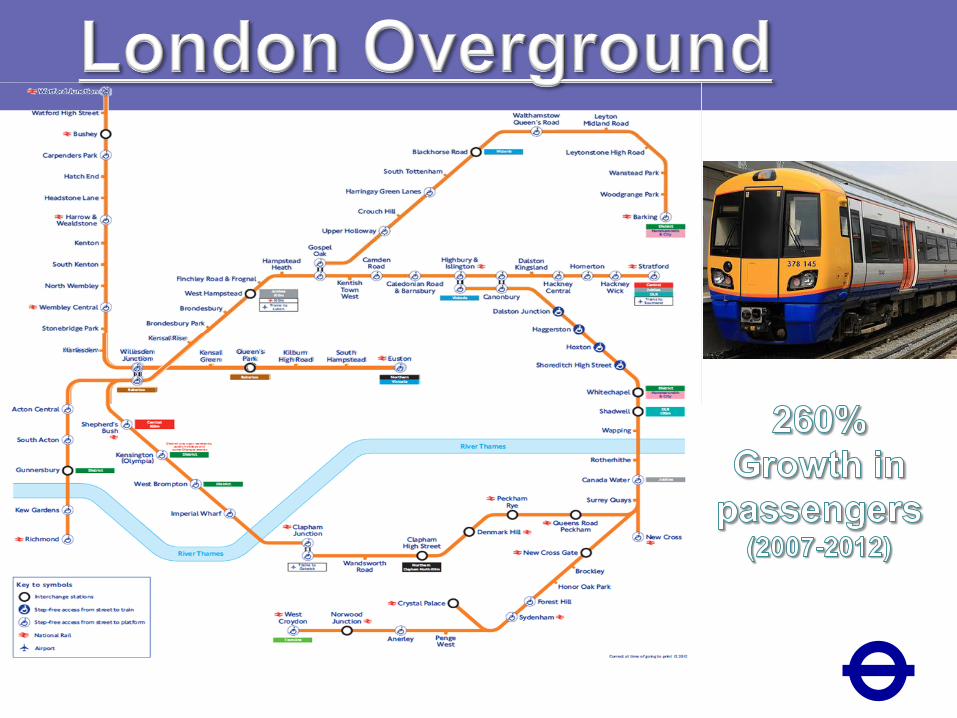
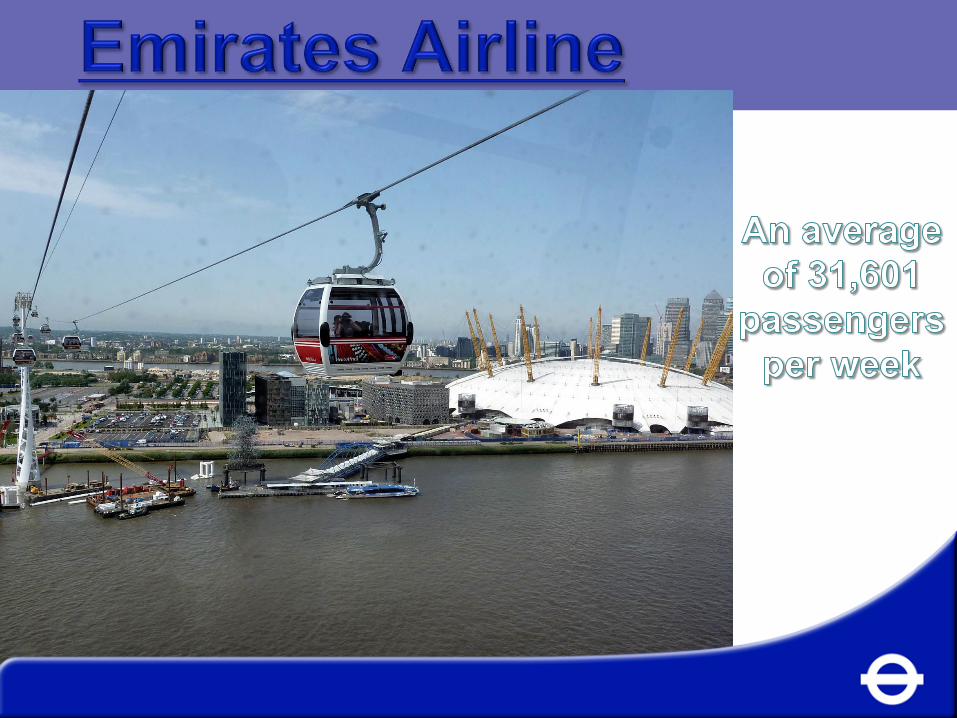
Overground Emirates Air
Line
Full S8 fleet now in service;
first H&C trains now in service
Record demand; orbital route
now complete
Over 31,000 trips in one day
during the 2012 Games
Upgrade complete with full fleet
replaced; new timetable in place
New signalling live between
West Finchley and High Barnet
Two minute peak service
timetable delivered
17
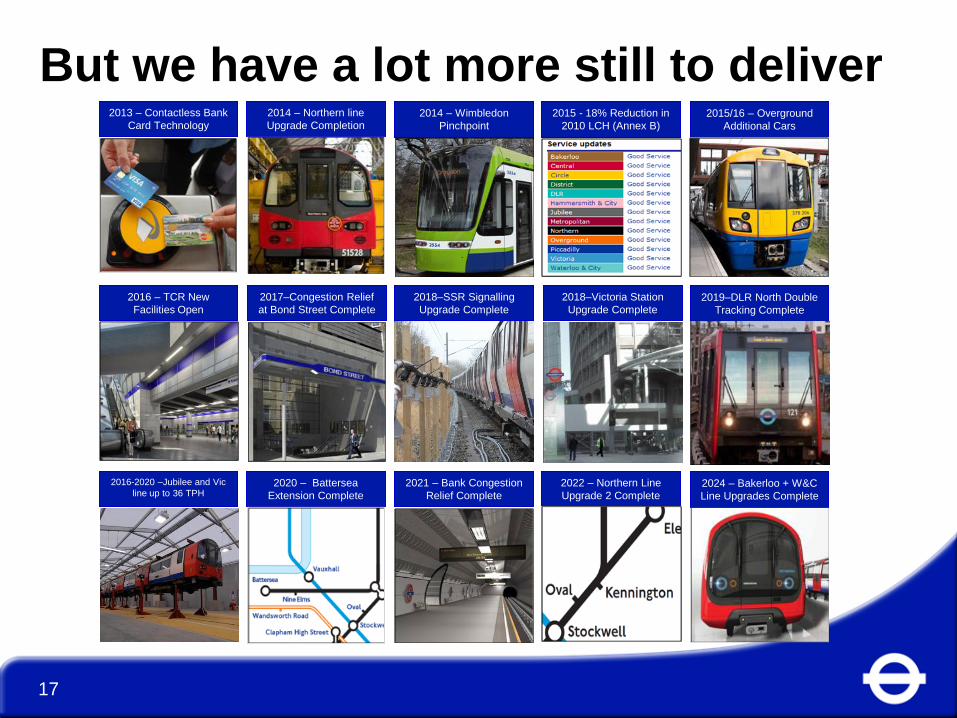
But we have a lot more still to deliver 2013 – Contactless Bank
Card Technology
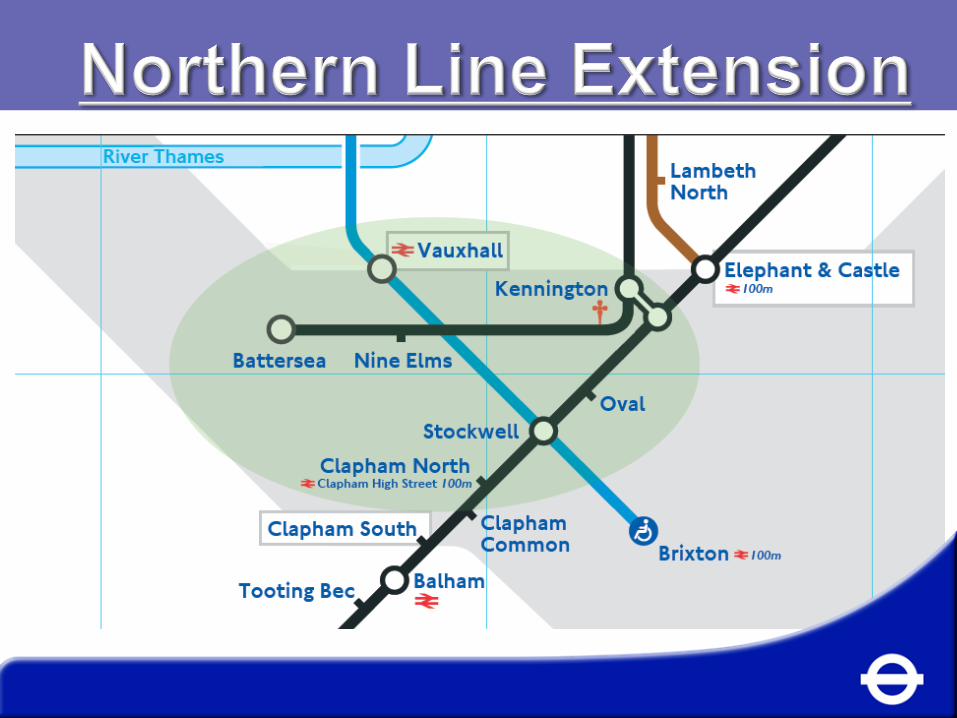
2014 – Northern line
Upgrade Completion 2014 – Wimbledon
Pinchpoint
2015 - 18% Reduction in
2010 LCH (Annex B)
2015/16 – Overground
Additional Cars
2016 – TCR New
Facilities Open 2019–DLR North Double
Tracking Complete
2016-2020 –Jubilee and Vic
line up to 36 TPH 2020 – Battersea
Extension Complete
2021 – Bank Congestion
Relief Complete
2022 – Northern Line
Upgrade 2 Complete 2024 – Bakerloo + W&C
Line Upgrades Complete
2017–Congestion Relief
at Bond Street Complete
2018–SSR Signalling
Upgrade Complete
2018–Victoria Station
Upgrade Complete
Performance
• 2011/12 – best ever Tube performance despite carrying more
passengers than ever before
• Reliability – 40% reduction in delay since 2007/08 (measured by LCH)
• Customer satisfaction – best ever results in 2011/12 – score of 80 (85
during Games)
• Volume of service – running more trains than ever before - 72.4m train
km in 2011/12
• Focus on predicting and preventing failures; responding more quickly to
problems; and rolling out better equipment
• Mayoral commitment to reducing delays by a further 30% by 2015
18
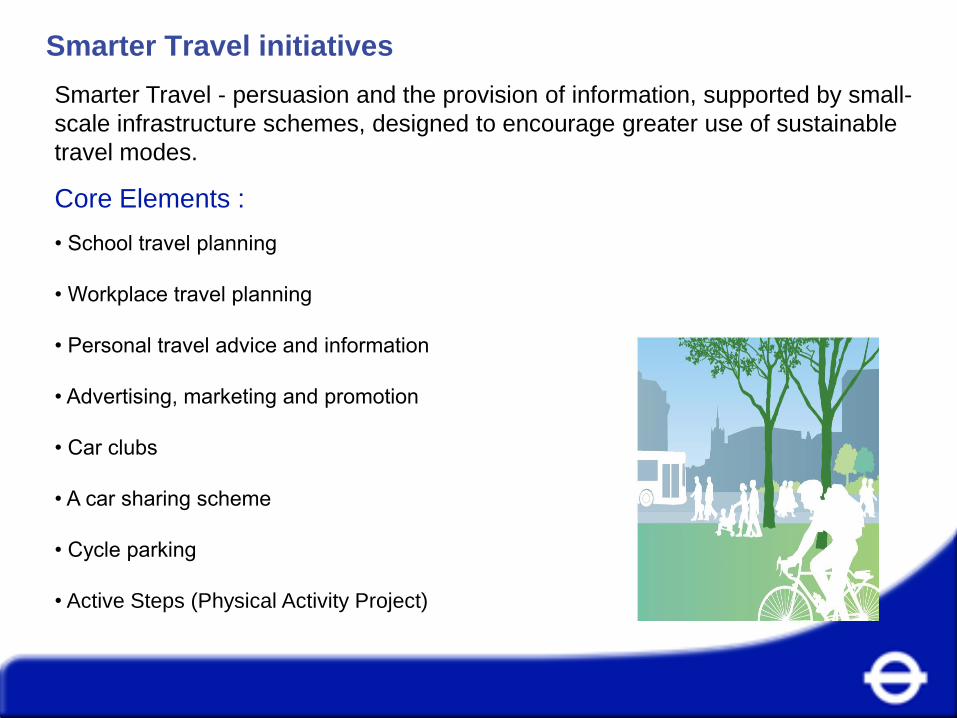
Smarter Travel initiatives
19
Contents
• London Context – Mayor’s Transport
Strategy
• Congestion Charging in London
• London – Managing Road Network
Smarter Travel - persuasion and the provision of information, supported by small-
scale infrastructure schemes, designed to encourage greater use of sustainable
travel modes.
Core Elements :
• School travel planning
• Workplace travel planning
• Personal travel advice and information
• Advertising, marketing and promotion
• Car clubs
• A car sharing scheme
• Cycle parking
• Active Steps (Physical Activity Project)
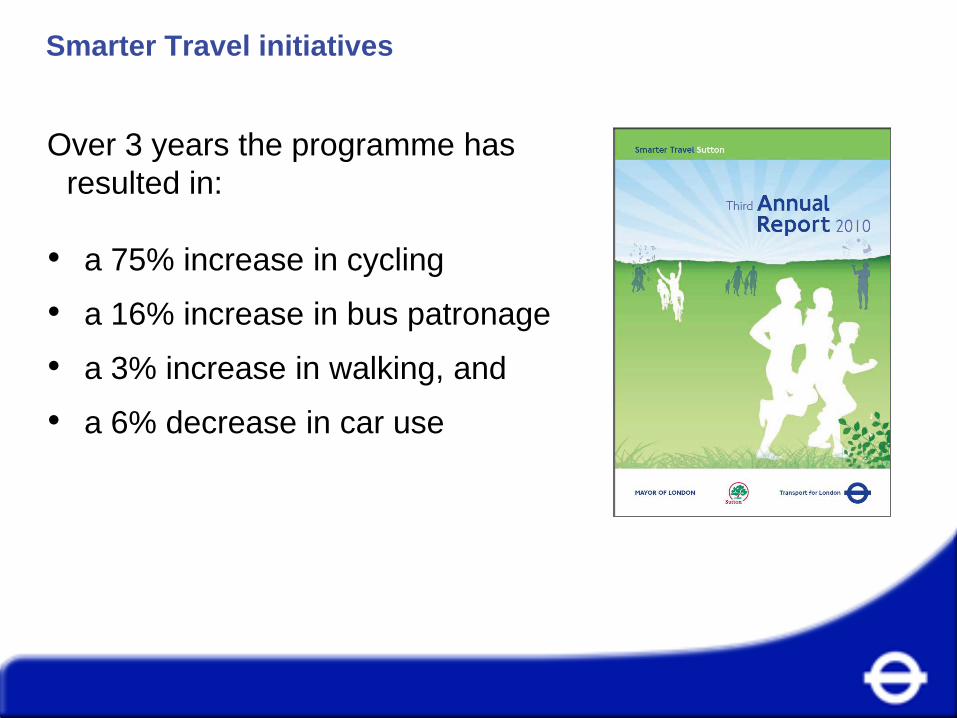
Smarter Travel initiatives
20
Contents
• London Context – Mayor’s Transport
Strategy
• Congestion Charging in London
• London – Managing Road Network
Over 3 years the programme has
resulted in:
• a 75% increase in cycling
• a 16% increase in bus patronage
• a 3% increase in walking, and
• a 6% decrease in car use
21
Contents
• London Context – Mayor’s Transport
Strategy
• Congestion Charging in London
• London – Managing Road Network
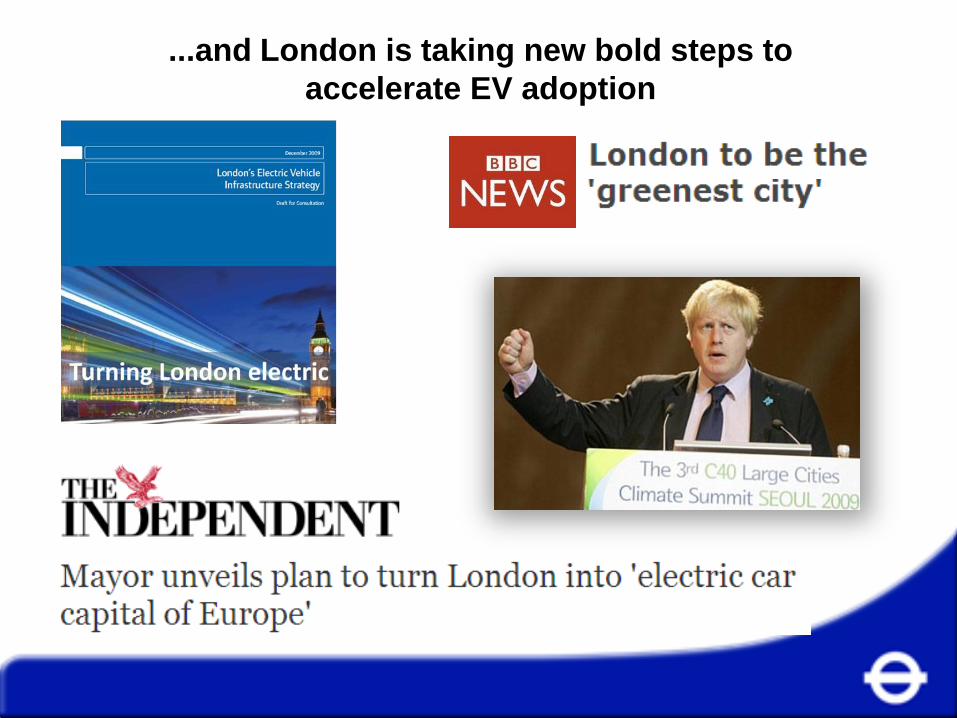
...and London is taking new bold steps to
accelerate EV adoption
22
Contents
• London Context – Mayor’s Transport
Strategy
• Congestion Charging in London
• London – Managing Road Network
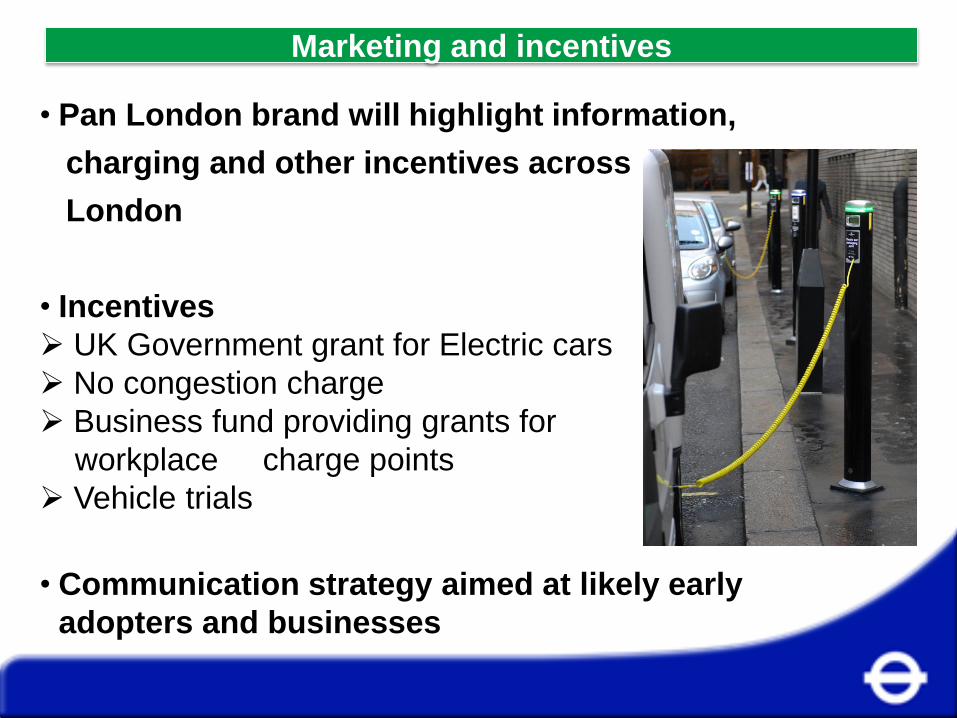
Marketing and incentives
• Pan London brand will highlight information,
charging and other incentives across
London
• Incentives
UK Government grant for Electric cars
No congestion charge
Business fund providing grants for
workplace charge points
Vehicle trials
• Communication strategy aimed at likely early
adopters and businesses
23
Contents
• London Context – Mayor’s Transport
Strategy
• Congestion Charging in London
• London – Managing Road Network
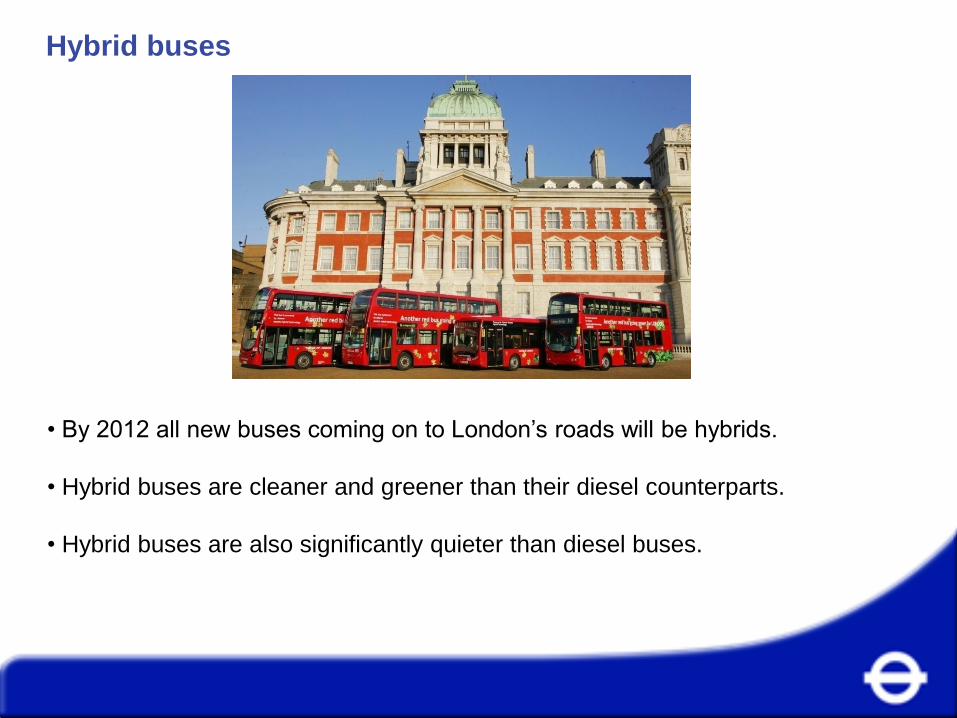
Hybrid buses
• By 2012 all new buses coming on to London’s roads will be hybrids.
• Hybrid buses are cleaner and greener than their diesel counterparts.
• Hybrid buses are also significantly quieter than diesel buses.
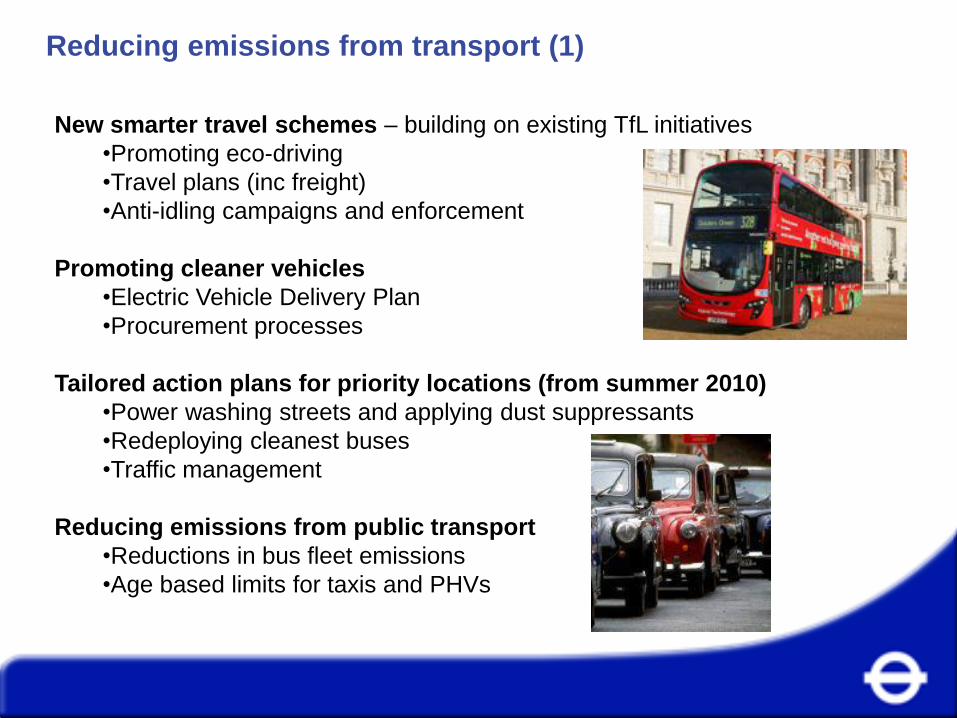
Reducing emissions from transport (1)
24
Contents
• London Context – Mayor’s Transport
Strategy
• Congestion Charging in London
• London – Managing Road Network
New smarter travel schemes – building on existing TfL initiatives
•Promoting eco-driving
•Travel plans (inc freight)
•Anti-idling campaigns and enforcement
Promoting cleaner vehicles
•Electric Vehicle Delivery Plan
•Procurement processes
Tailored action plans for priority locations (from summer 2010)
•Power washing streets and applying dust suppressants
•Redeploying cleanest buses
•Traffic management
Reducing emissions from public transport
•Reductions in bus fleet emissions
•Age based limits for taxis and PHVs
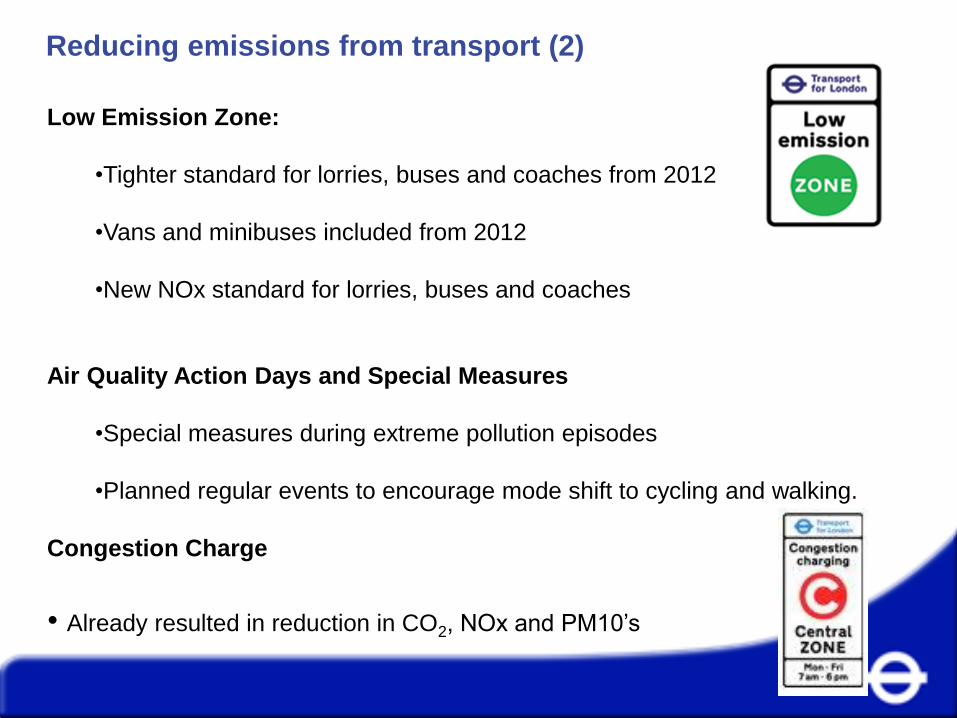
Reducing emissions from transport (2)
25
Contents
• London Context – Mayor’s Transport
Strategy
• Congestion Charging in London
• London – Managing Road Network
Low Emission Zone:
•Tighter standard for lorries, buses and coaches from 2012
•Vans and minibuses included from 2012
•New NOx standard for lorries, buses and coaches
Air Quality Action Days and Special Measures
•Special measures during extreme pollution episodes
•Planned regular events to encourage mode shift to cycling and walking.
Congestion Charge
• Already resulted in reduction in CO2, NOx and PM10’s
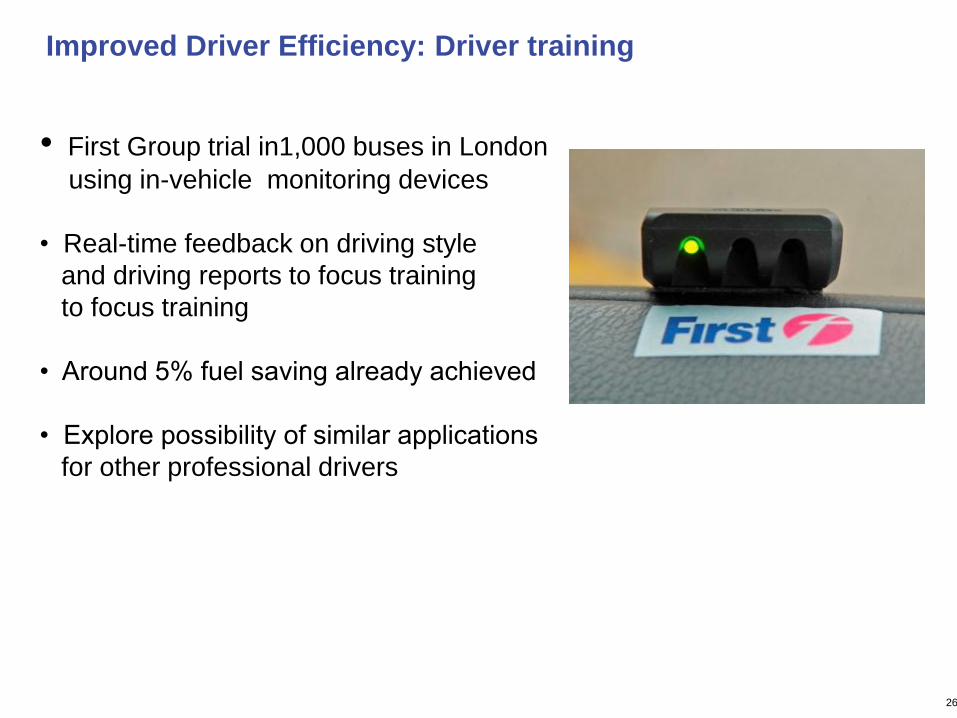
Improved Driver Efficiency: Driver training
26 Contents
• London Context – Mayor’s Transport
Strategy
• Congestion Charging in London
• London – Managing Road Network
• First Group trial in1,000 buses in London
using in-vehicle monitoring devices
• Real-time feedback on driving style
and driving reports to focus training
to focus training
• Around 5% fuel saving already achieved
• Explore possibility of similar applications
for other professional drivers
27
Contents
• London Context – Mayor’s Transport
Strategy
• Congestion Charging in London
• London – Managing Road Network
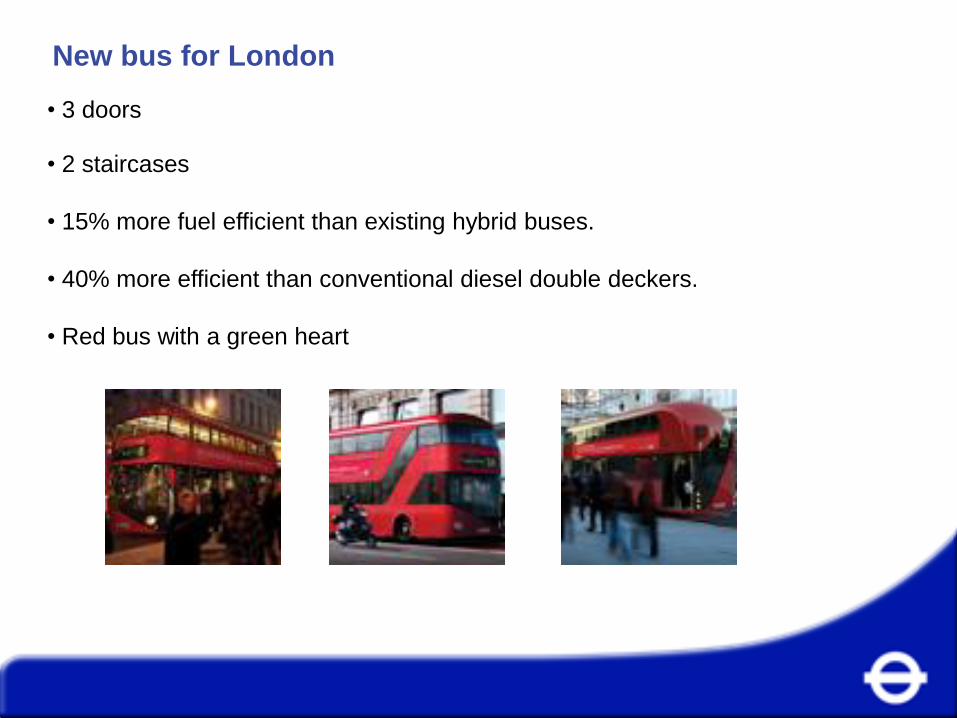
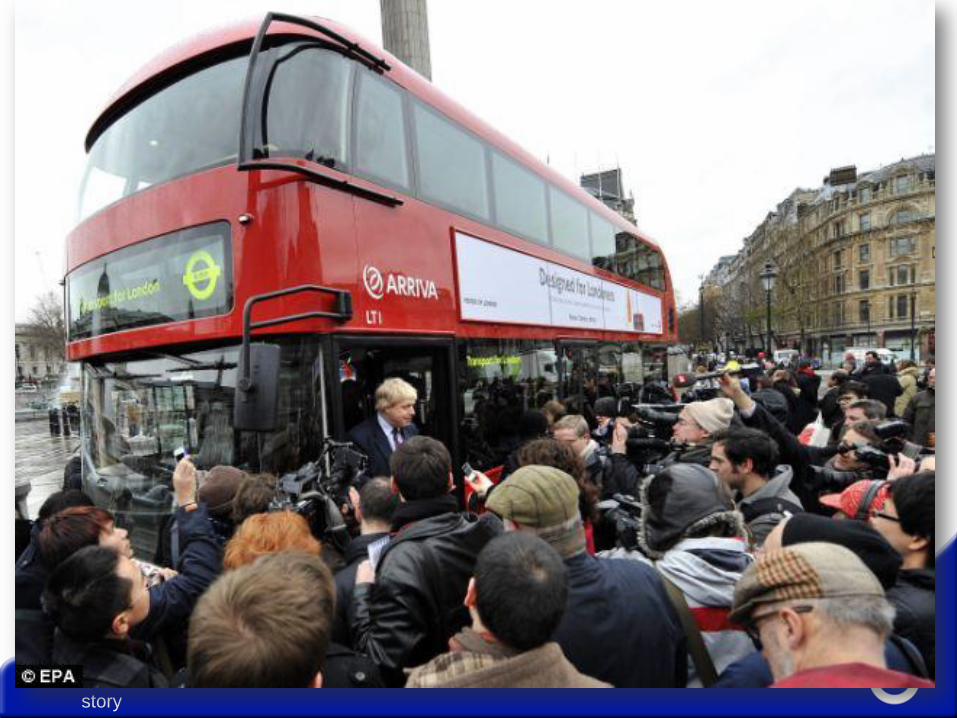
New bus for London
• 3 doors
• 2 staircases
• 15% more fuel efficient than existing hybrid buses.
• 40% more efficient than conventional diesel double deckers.
• Red bus with a green heart
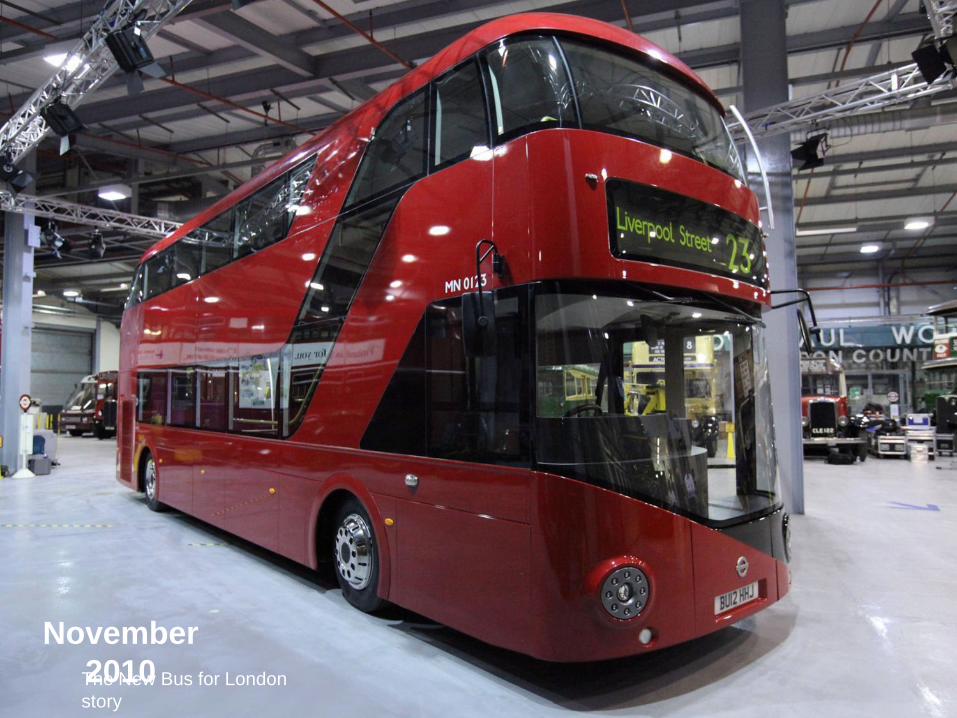
The New Bus for London
story
November
2010
The New Bus for London
story
© TfL 2011
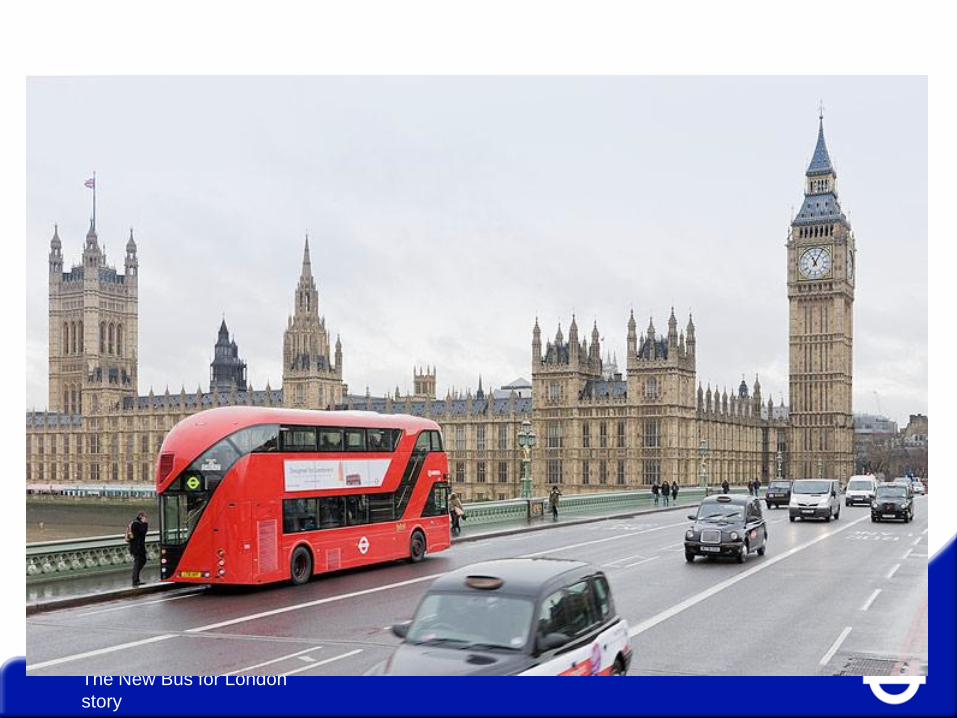
The New Bus for London
story
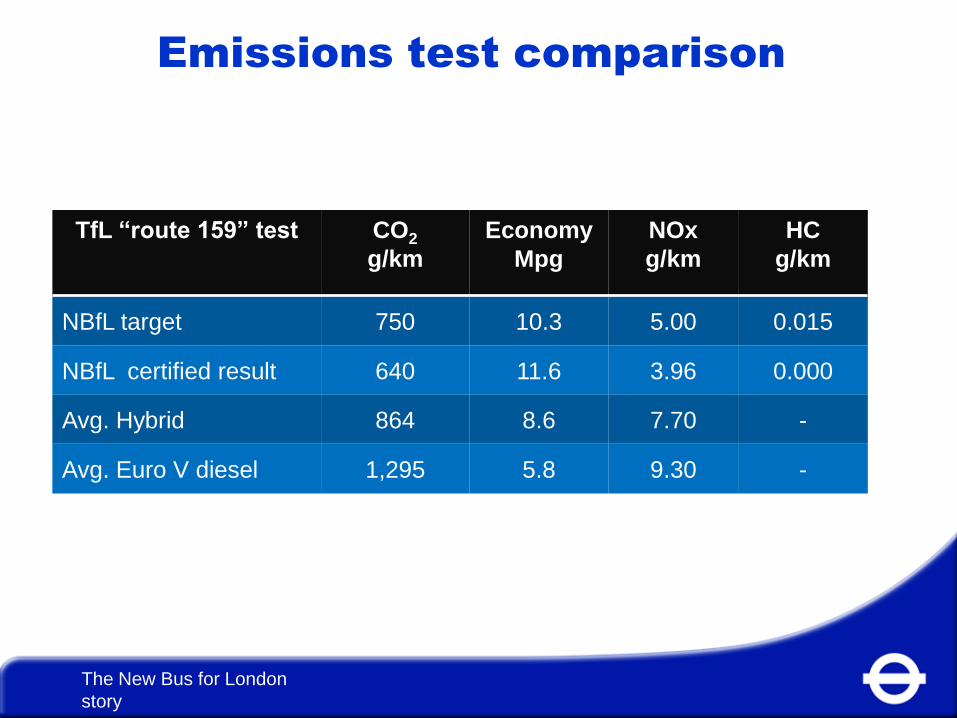
Emissions test comparison
TfL “route 159” test CO2
g/km
Economy
Mpg
NOx
g/km
HC
g/km
NBfL target 750 10.3 5.00 0.015
NBfL certified result 640 11.6 3.96 0.000
Avg. Hybrid 864 8.6 7.70 -
Avg. Euro V diesel 1,295 5.8 9.30 -
The New Bus for London
story

© TfL 2012 The New Bus for London story
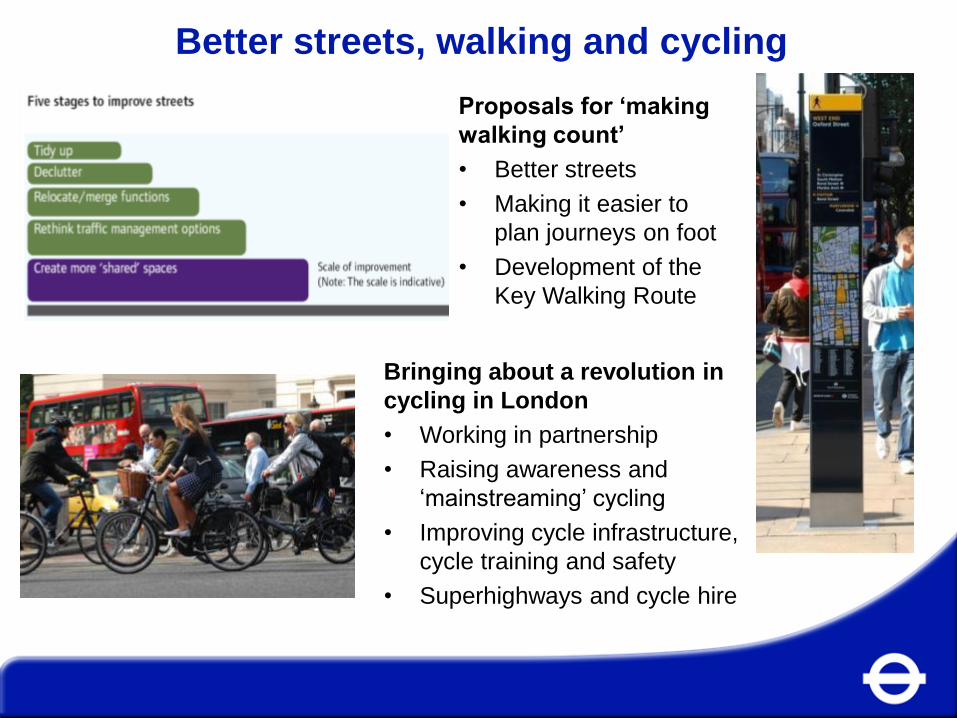
Better streets, walking and cycling
Proposals for ‘making
walking count’
• Better streets
• Making it easier to
plan journeys on foot
• Development of the
Key Walking Route
approach
Bringing about a revolution in
cycling in London
• Working in partnership
• Raising awareness and
‘mainstreaming’ cycling
• Improving cycle infrastructure,
cycle training and safety
• Superhighways and cycle hire
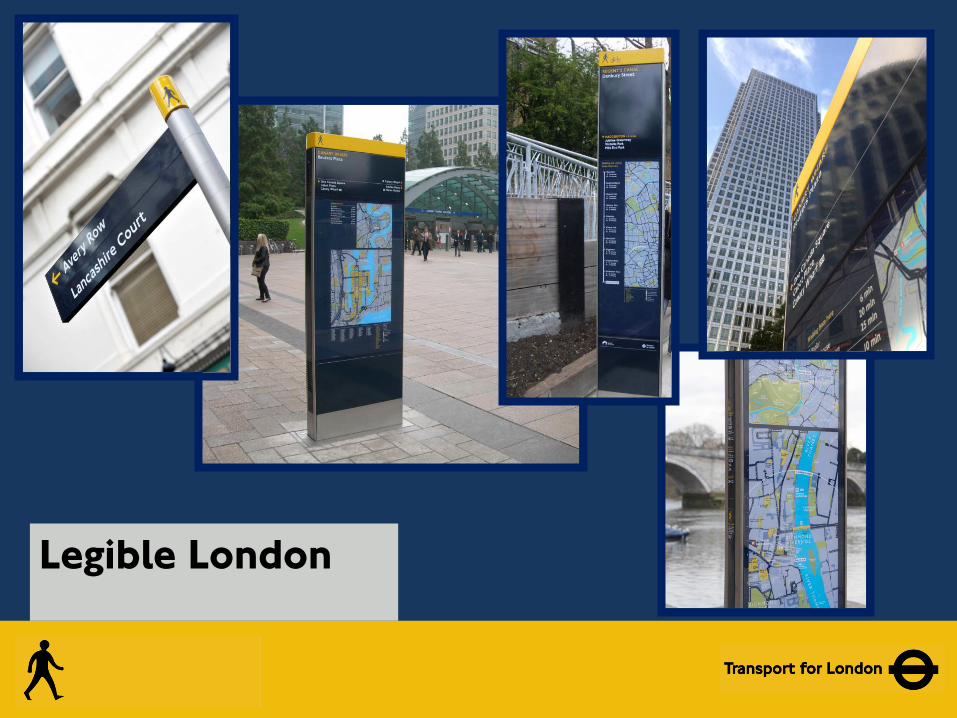
Legible London
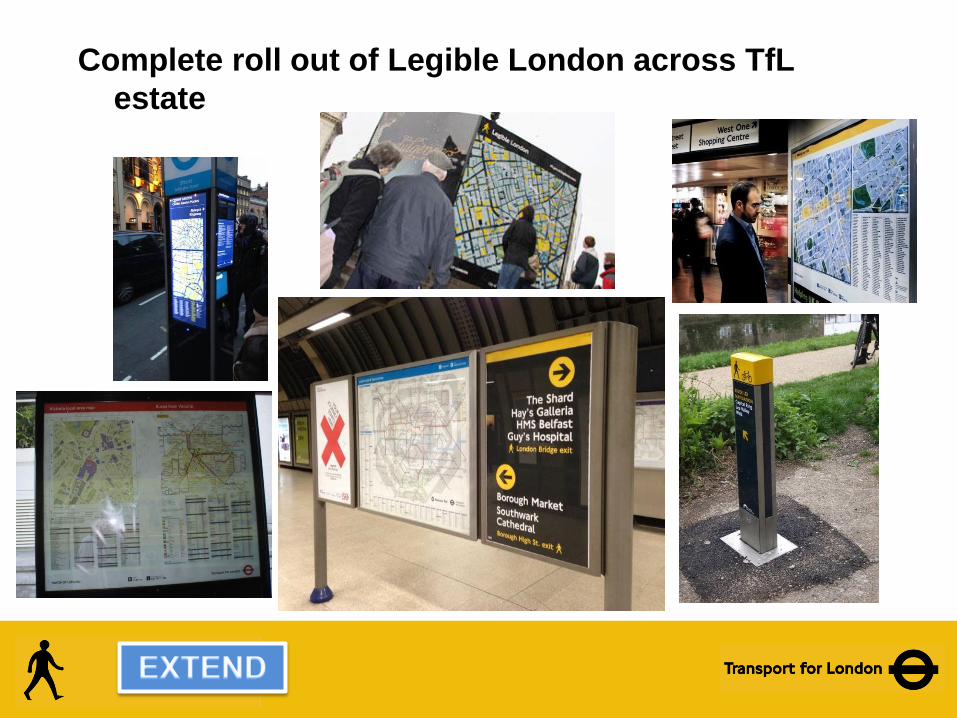
Complete roll out of Legible London across TfL
estate
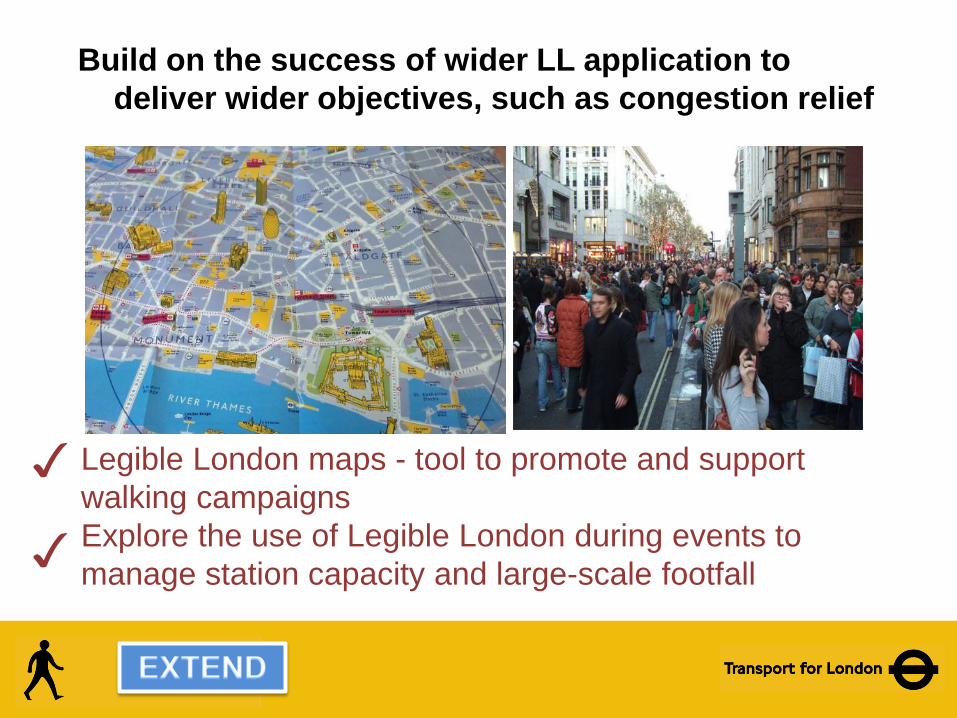
Build on the success of wider LL application to
deliver wider objectives, such as congestion relief
Legible London maps - tool to promote and support
walking campaigns
Explore the use of Legible London during events to
manage station capacity and large-scale footfall
✓
✓
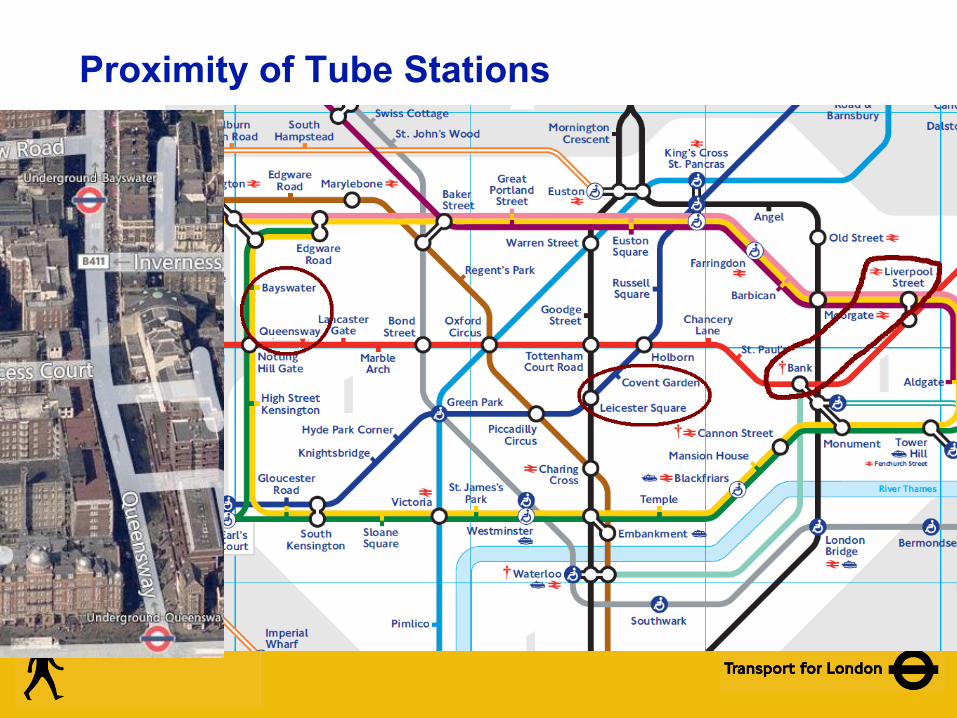
Proximity of Tube Stations
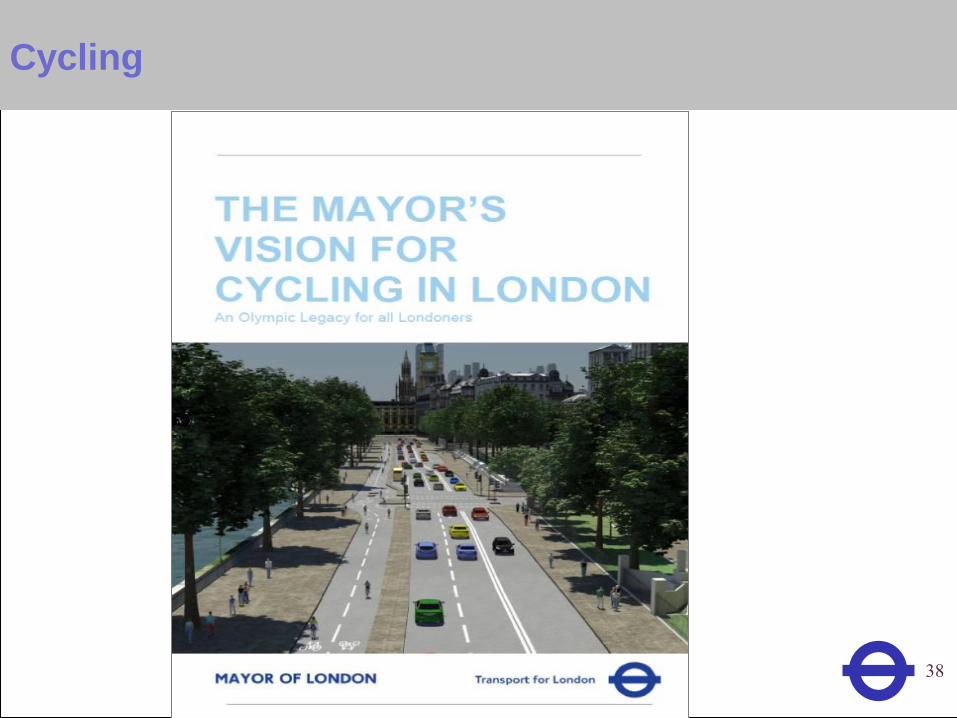
Heading Cycling
38
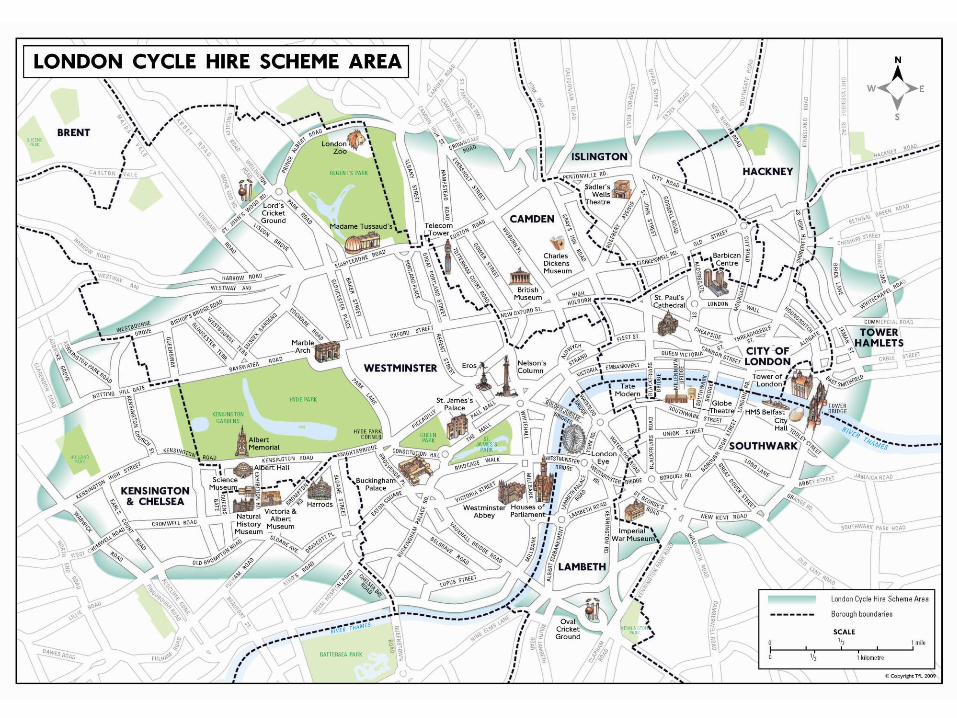
London Scheme Area
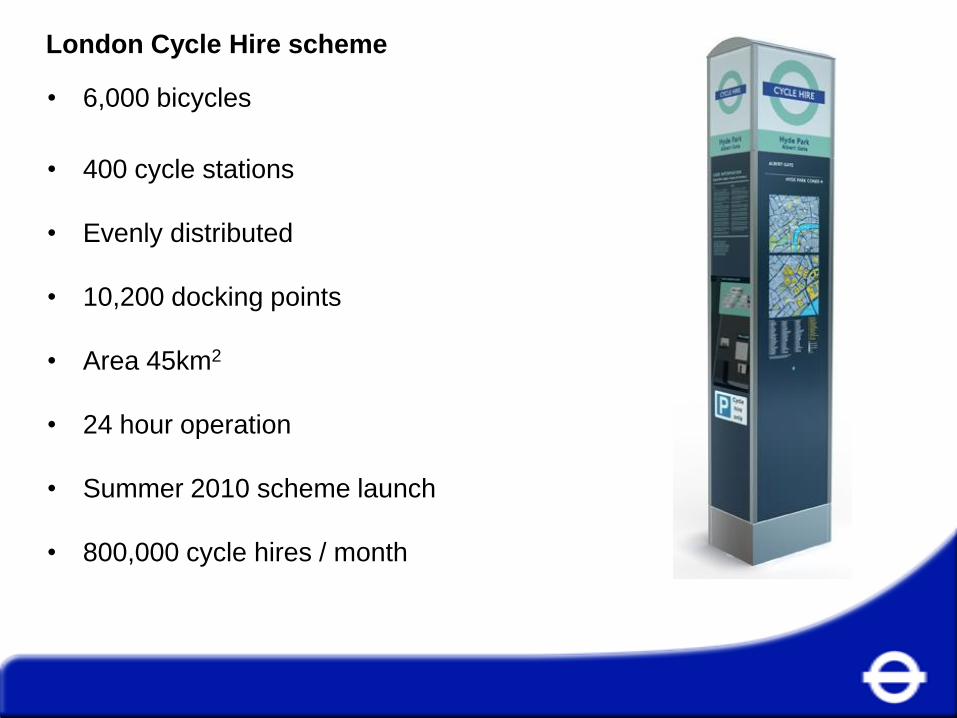
London Cycle Hire scheme
40
Contents
• London Context – Mayor’s Transport
Strategy
• Congestion Charging in London
• London – Managing Road Network
• 6,000 bicycles
• 400 cycle stations
• Evenly distributed
• 10,200 docking points
• Area 45km2
• 24 hour operation
• Summer 2010 scheme launch
• 800,000 cycle hires / month
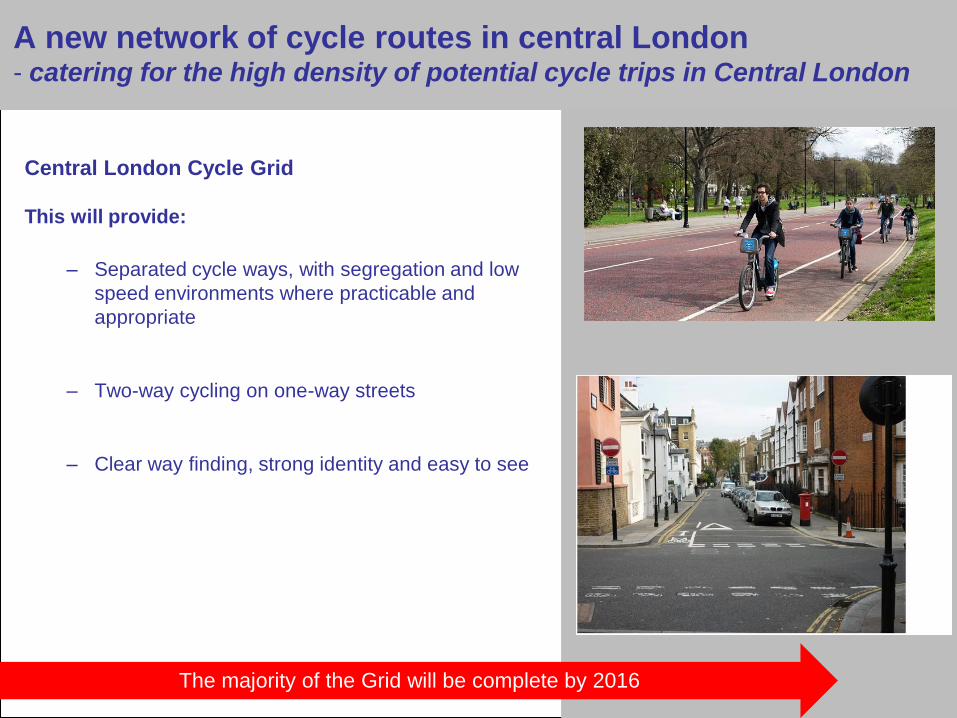
Heading A new network of cycle routes in central London - catering for the high density of potential cycle trips in Central London
Central London Cycle Grid
This will provide:
– Separated cycle ways, with segregation and low
speed environments where practicable and
appropriate
– Two-way cycling on one-way streets
– Clear way finding, strong identity and easy to see
41 The majority of the Grid will be complete by 2016
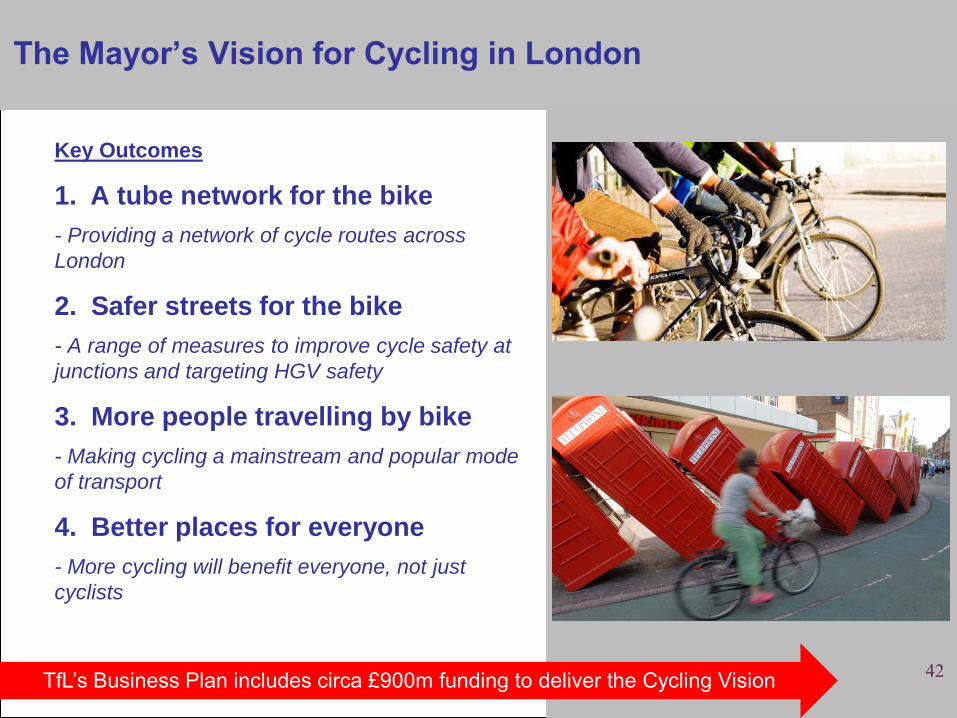
Heading The Mayor’s Vision for Cycling in London
Key Outcomes
1. A tube network for the bike
- Providing a network of cycle routes across
London
2. Safer streets for the bike
- A range of measures to improve cycle safety at
junctions and targeting HGV safety
3. More people travelling by bike
- Making cycling a mainstream and popular mode
of transport
4. Better places for everyone
- More cycling will benefit everyone, not just
cyclists
42 TfL’s Business Plan includes circa £900m funding to deliver the Cycling Vision
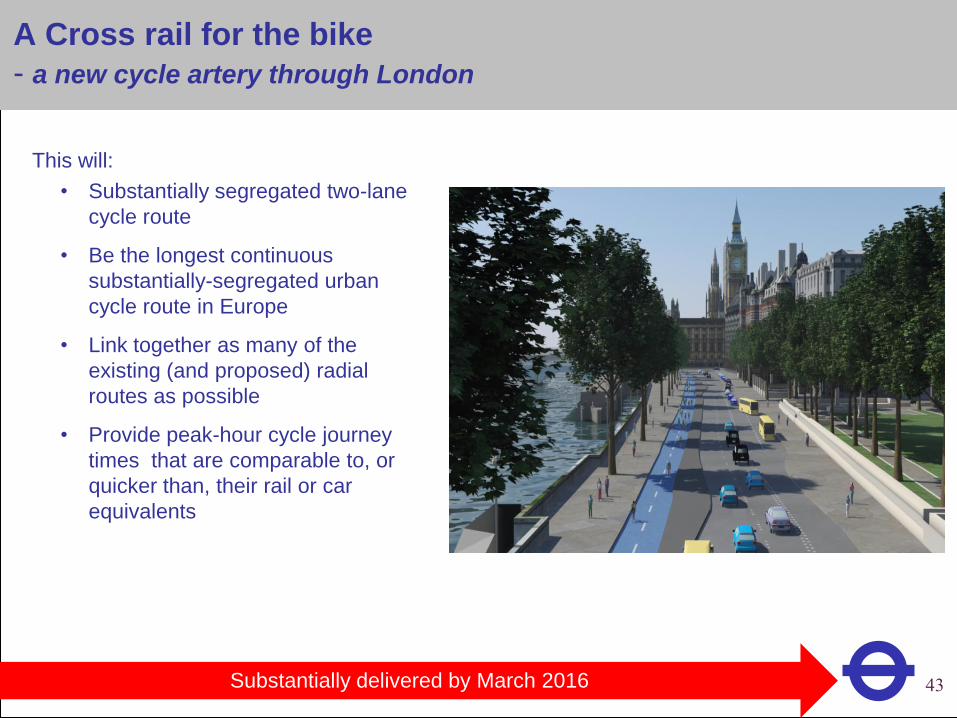
Heading A Cross rail for the bike
- a new cycle artery through London
This will:
• Substantially segregated two-lane
cycle route
• Be the longest continuous
substantially-segregated urban
cycle route in Europe
• Link together as many of the
existing (and proposed) radial
routes as possible
• Provide peak-hour cycle journey
times that are comparable to, or
quicker than, their rail or car
equivalents
Substantially delivered by March 2016 43
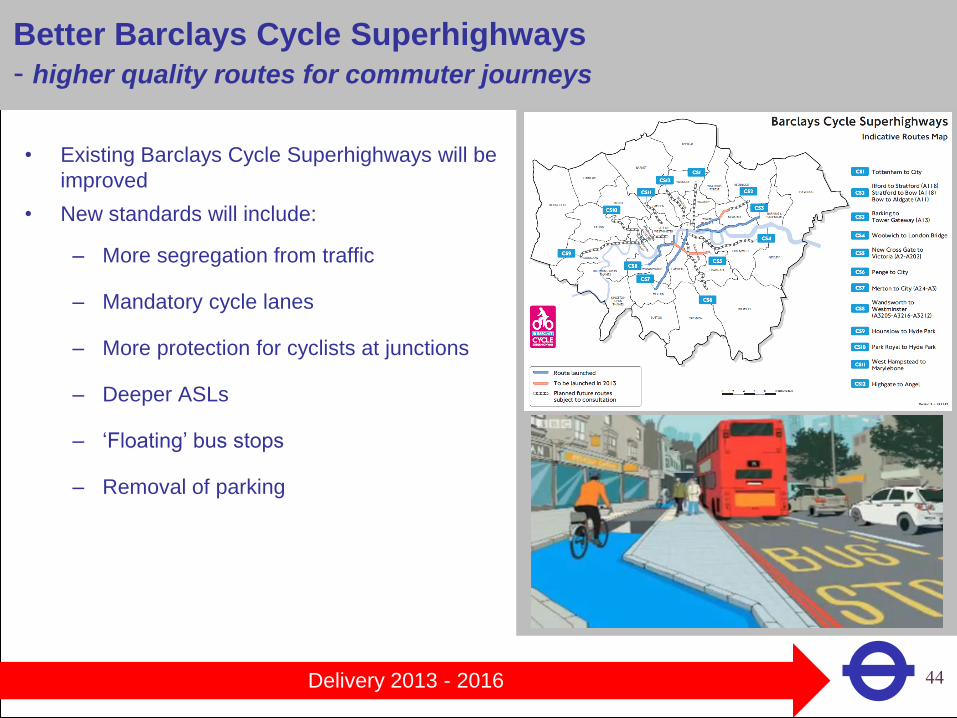
Heading Better Barclays Cycle Superhighways
- higher quality routes for commuter journeys
• Existing Barclays Cycle Superhighways will be
improved
• New standards will include:
– More segregation from traffic
– Mandatory cycle lanes
– More protection for cyclists at junctions
– Deeper ASLs
– ‘Floating’ bus stops
– Removal of parking
44 Delivery 2013 - 2016
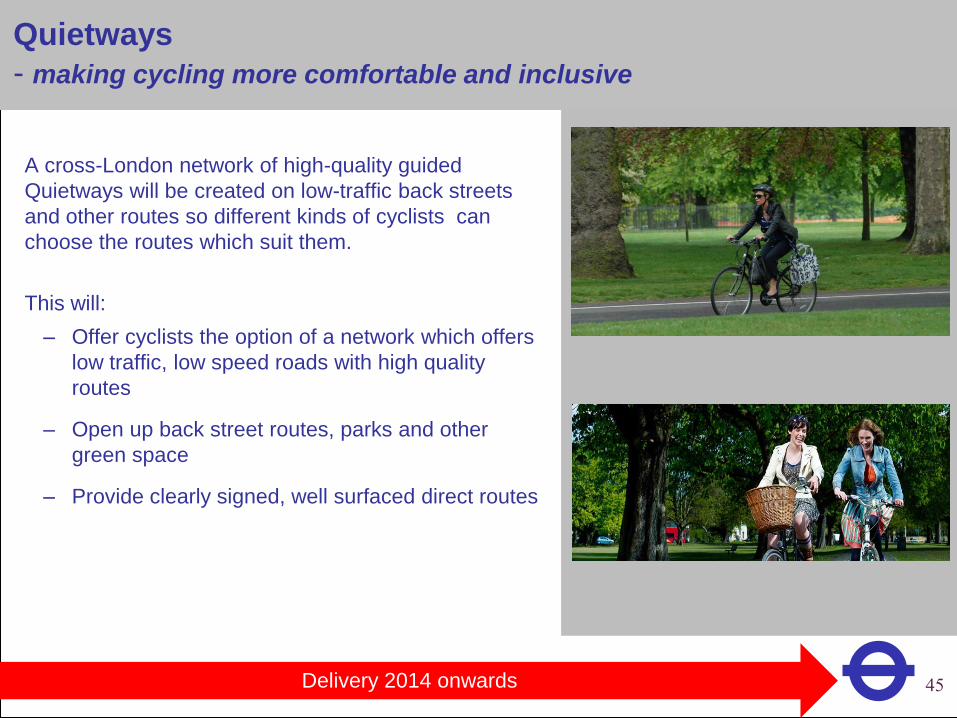
Heading Quietways
- making cycling more comfortable and inclusive
A cross-London network of high-quality guided
Quietways will be created on low-traffic back streets
and other routes so different kinds of cyclists can
choose the routes which suit them.
This will:
– Offer cyclists the option of a network which offers
low traffic, low speed roads with high quality
routes
– Open up back street routes, parks and other
green space
– Provide clearly signed, well surfaced direct routes
45 Delivery 2014 onwards
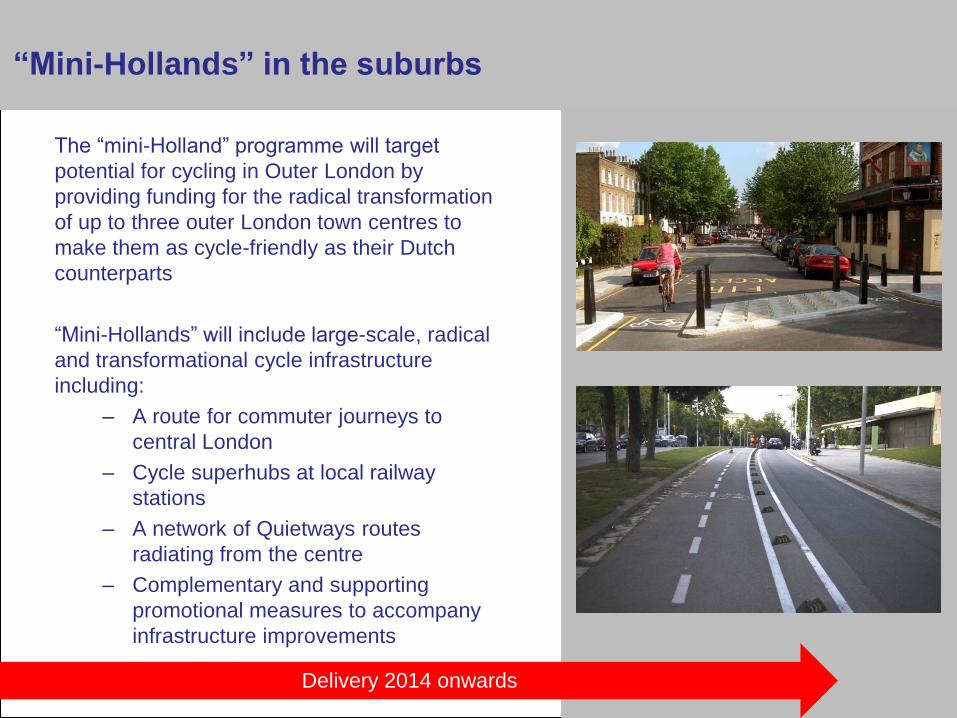
Heading “Mini-Hollands” in the suburbs
The “mini-Holland” programme will target
potential for cycling in Outer London by
providing funding for the radical transformation
of up to three outer London town centres to
make them as cycle-friendly as their Dutch
counterparts
“Mini-Hollands” will include large-scale, radical
and transformational cycle infrastructure
including:
– A route for commuter journeys to
central London
– Cycle superhubs at local railway
stations
– A network of Quietways routes
radiating from the centre
– Complementary and supporting
promotional measures to accompany
infrastructure improvements
46 Delivery 2014 onwards
Heading
47
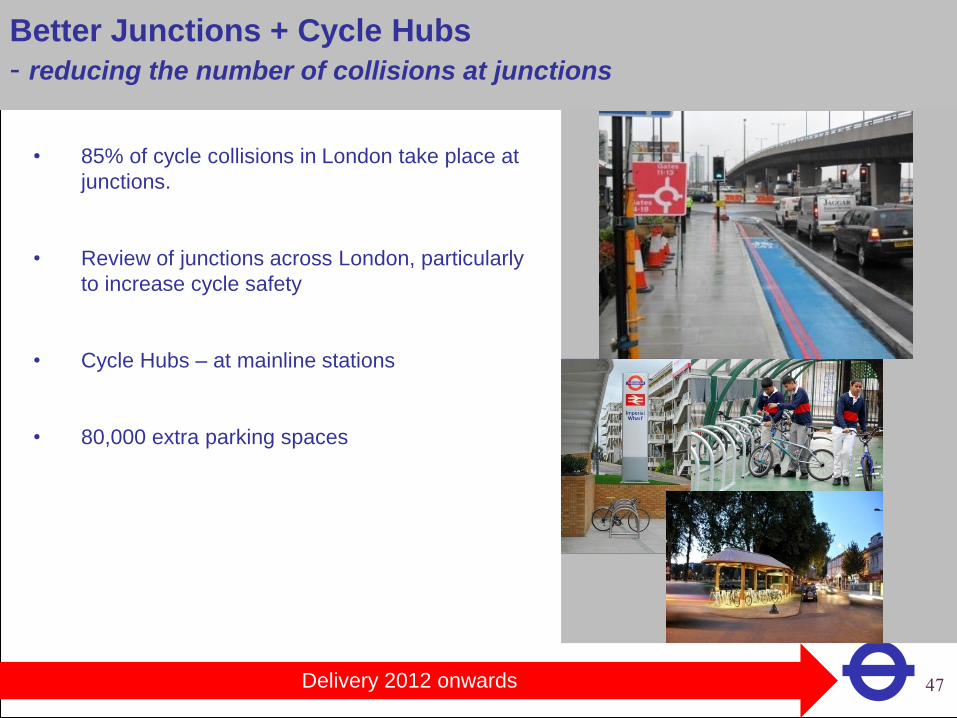
Better Junctions + Cycle Hubs
- reducing the number of collisions at junctions
• 85% of cycle collisions in London take place at
junctions.
• Review of junctions across London, particularly
to increase cycle safety
• Cycle Hubs – at mainline stations
• 80,000 extra parking spaces
Delivery 2012 onwards
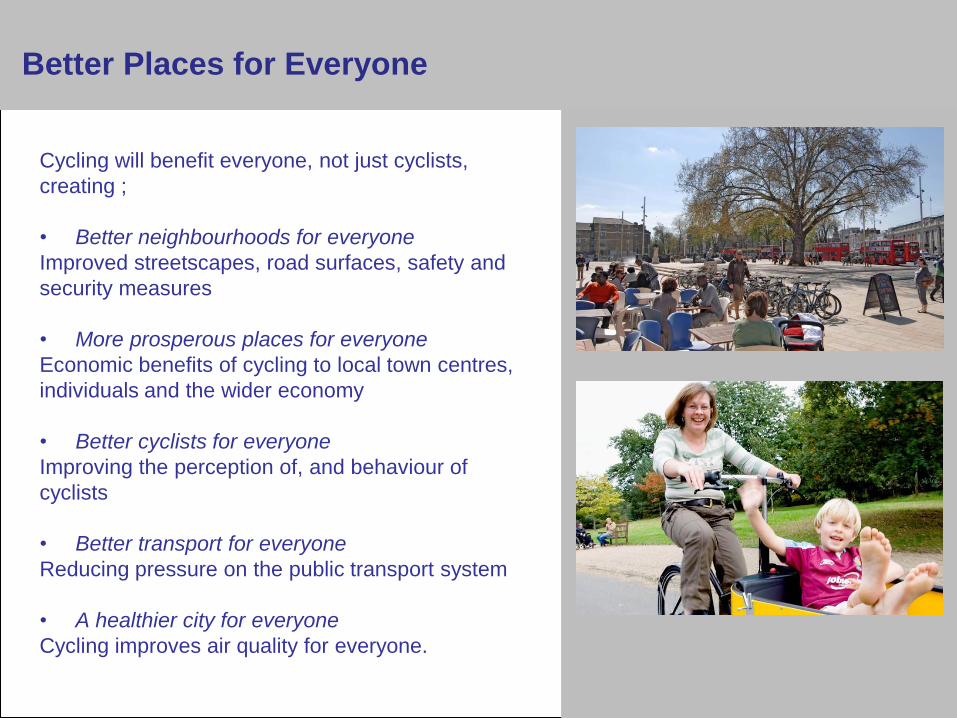
Heading Better Places for Everyone
48
Cycling will benefit everyone, not just cyclists,
creating ;
• Better neighbourhoods for everyone
Improved streetscapes, road surfaces, safety and
security measures
• More prosperous places for everyone
Economic benefits of cycling to local town centres,
individuals and the wider economy
• Better cyclists for everyone
Improving the perception of, and behaviour of
cyclists
• Better transport for everyone
Reducing pressure on the public transport system
• A healthier city for everyone
Cycling improves air quality for everyone.
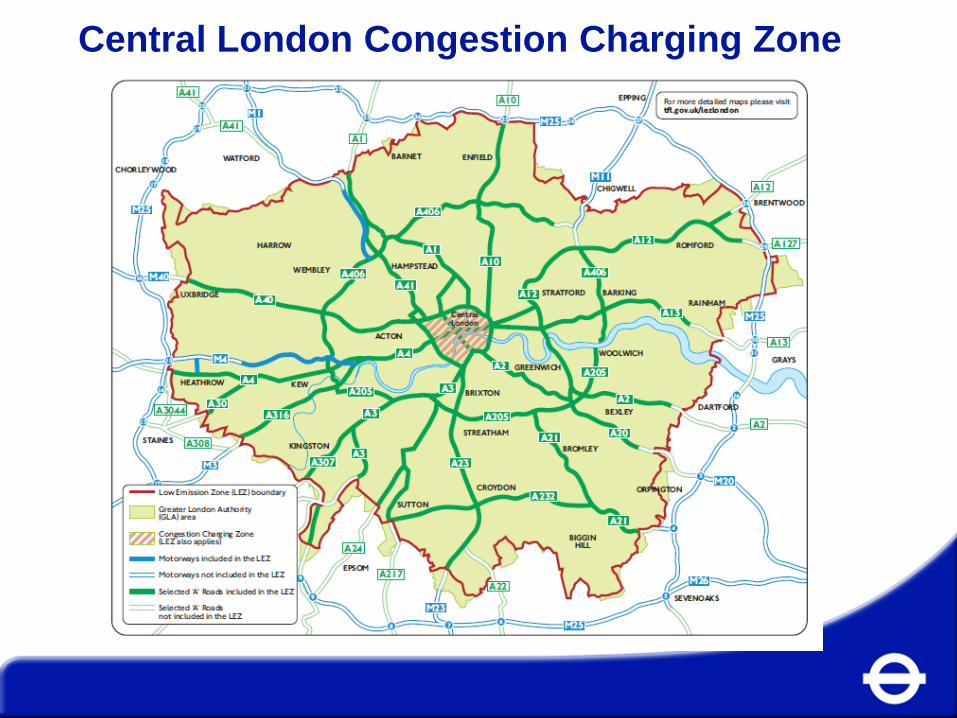
Central London Congestion Charging Zone

50
London’s transport problems
51
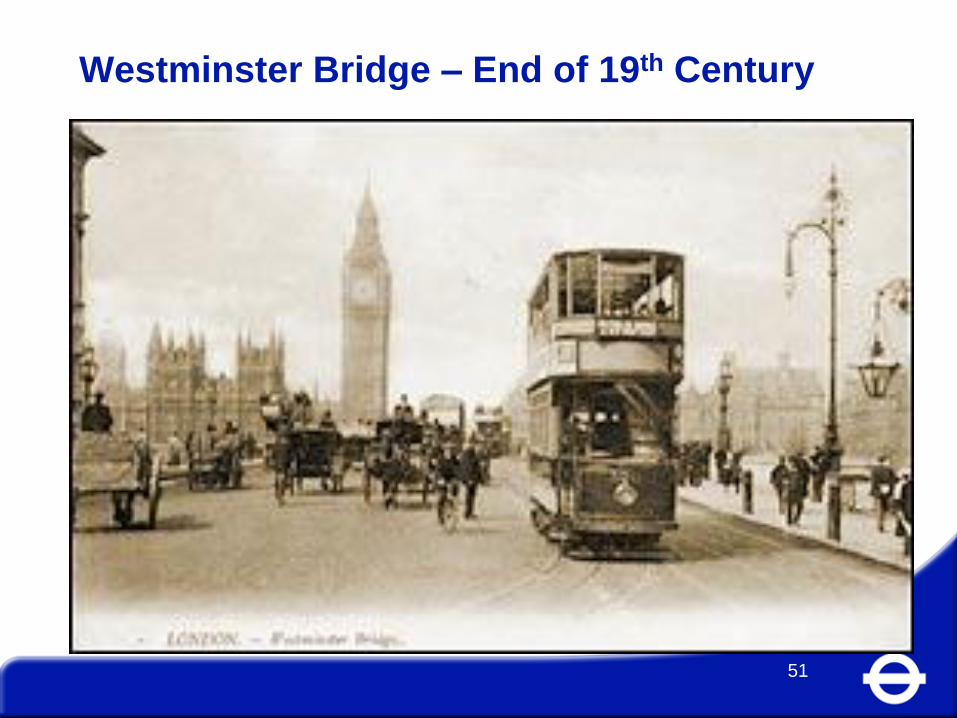
Westminster Bridge – End of 19th Century
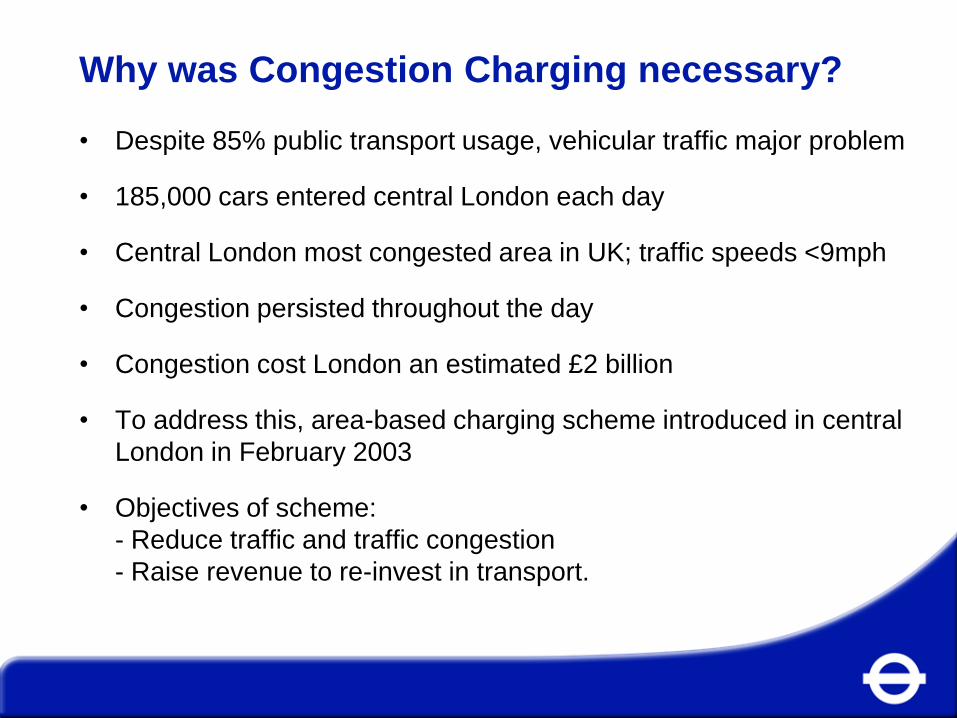
Why was Congestion Charging necessary?
• Despite 85% public transport usage, vehicular traffic major problem
• 185,000 cars entered central London each day
• Central London most congested area in UK; traffic speeds <9mph
• Congestion persisted throughout the day
• Congestion cost London an estimated £2 billion
• To address this, area-based charging scheme introduced in central
London in February 2003
• Objectives of scheme:
- Reduce traffic and traffic congestion
- Raise revenue to re-invest in transport.
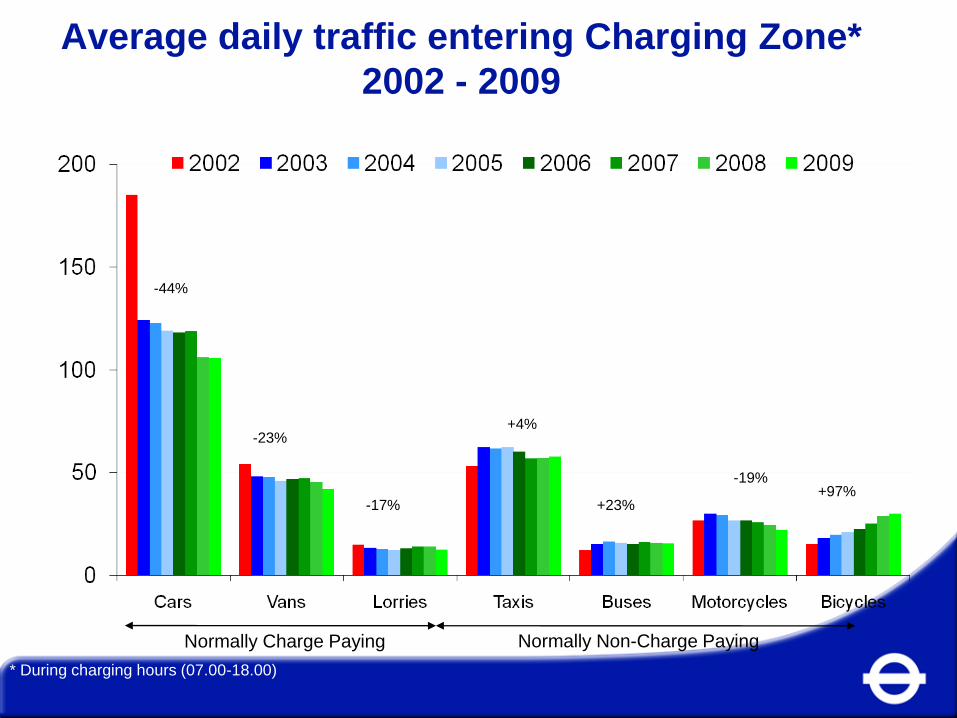
Average daily traffic entering Charging Zone*
2002 - 2009
Normally Charge Paying Normally Non-Charge Paying
* During charging hours (07.00-18.00)
-23%
-44%
-17%
+4%
+23%
-19% +97%
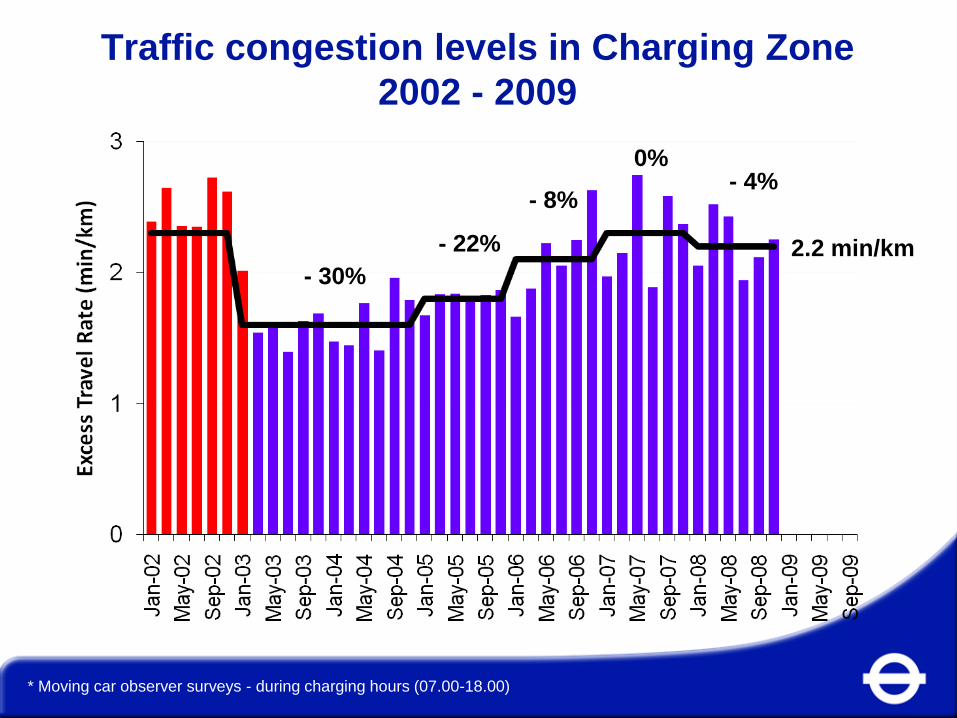
Traffic congestion levels in Charging Zone
2002 - 2009
* Moving car observer surveys - during charging hours (07.00-18.00)
- 30%
- 22%
- 8%
0% - 4%
2.2 min/km
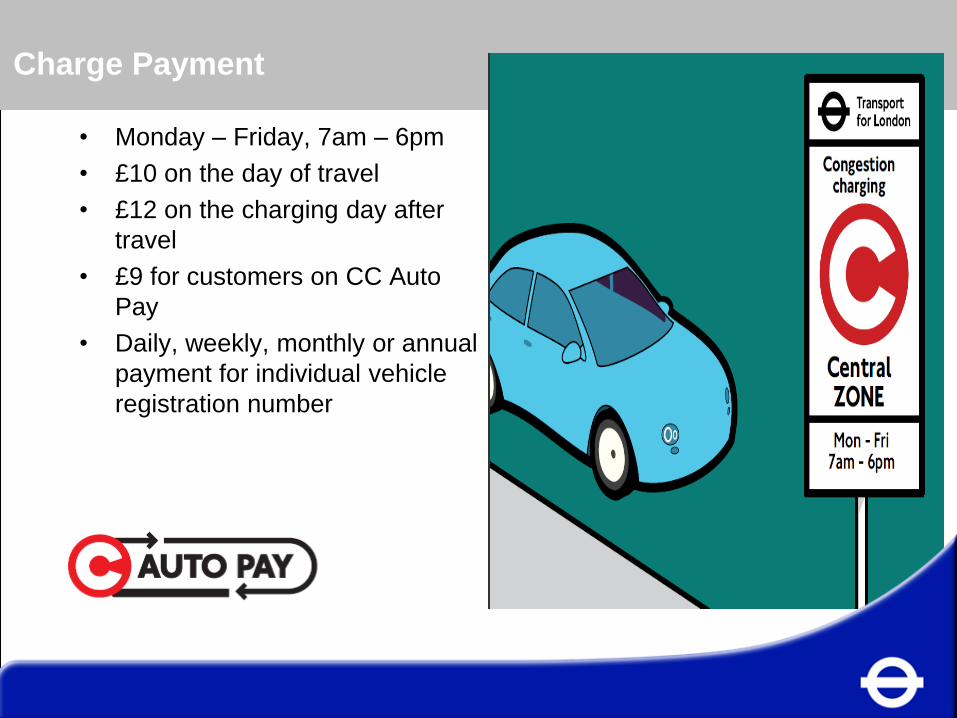
Heading Charge Payment
• Monday – Friday, 7am – 6pm
• £10 on the day of travel
• £12 on the charging day after
travel
• £9 for customers on CC Auto
Pay
• Daily, weekly, monthly or annual
payment for individual vehicle
registration number
Heading Payment Channels
• Pay online at www.cclondon.com
• Pay by mobile phone text message
• Pay at selected shops and petrol stations
• Pay by phone on 0845 900 1234
• Pay by post
• CC Auto Pay
• Fleet Auto Pay
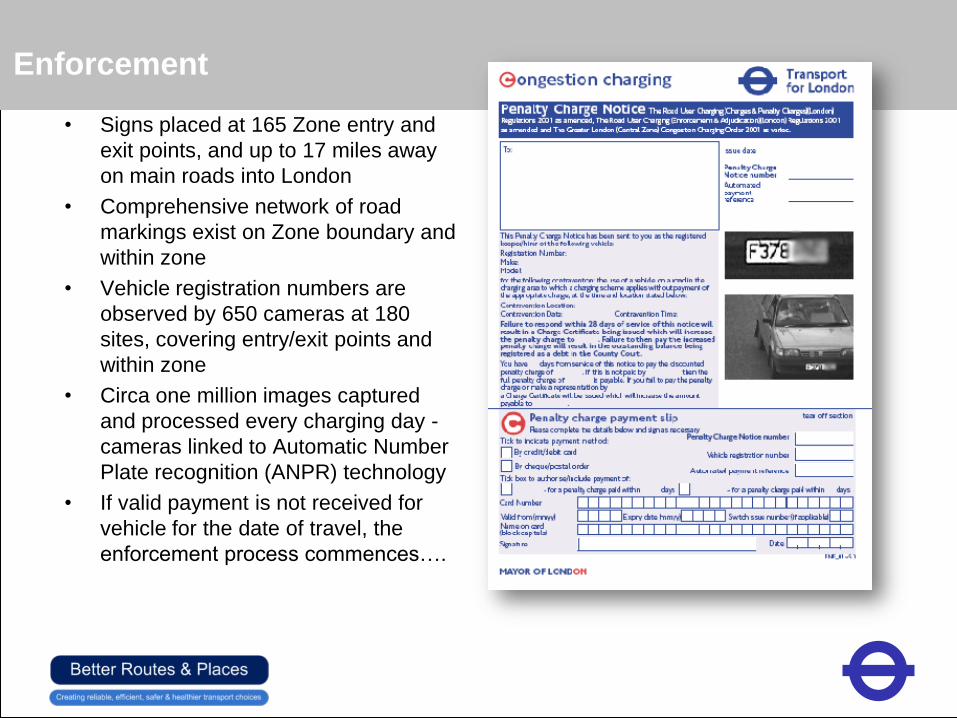
Heading Enforcement
• Signs placed at 165 Zone entry and
exit points, and up to 17 miles away
on main roads into London
• Comprehensive network of road
markings exist on Zone boundary and
within zone
• Vehicle registration numbers are
observed by 650 cameras at 180
sites, covering entry/exit points and
within zone
• Circa one million images captured
and processed every charging day -
cameras linked to Automatic Number
Plate recognition (ANPR) technology
• If valid payment is not received for
vehicle for the date of travel, the
enforcement process commences….
Complementary Transport Measures
Introduction of scheme accompanied by measures designed to
make public transport and other alternatives to car travel easier,
cheaper, faster and more reliable:
• Substantial increase in bus capacity into and around Zone
• Freeze in public transport fares
• Better information for public transport users
• Frequency improvements on train & Underground services
into Zone
• Traffic management measures on diversion routes and roads
around Zone.
Other Impacts
• Economy
– Broadly neutral impact overall on business
• Environment
– Congestion Charging directly responsible for reductions of
traffic emissions inside Zone equating to 8% of NOx, 7% of
PM10 and 16% of CO2
• Road safety
– Reduced numbers of cars have led to less personal injury
road accidents in the central zone
• Net revenues
– In 2010/11 Congestion Charging raised £169 million to be
spent on other transport initiatives within London.
60
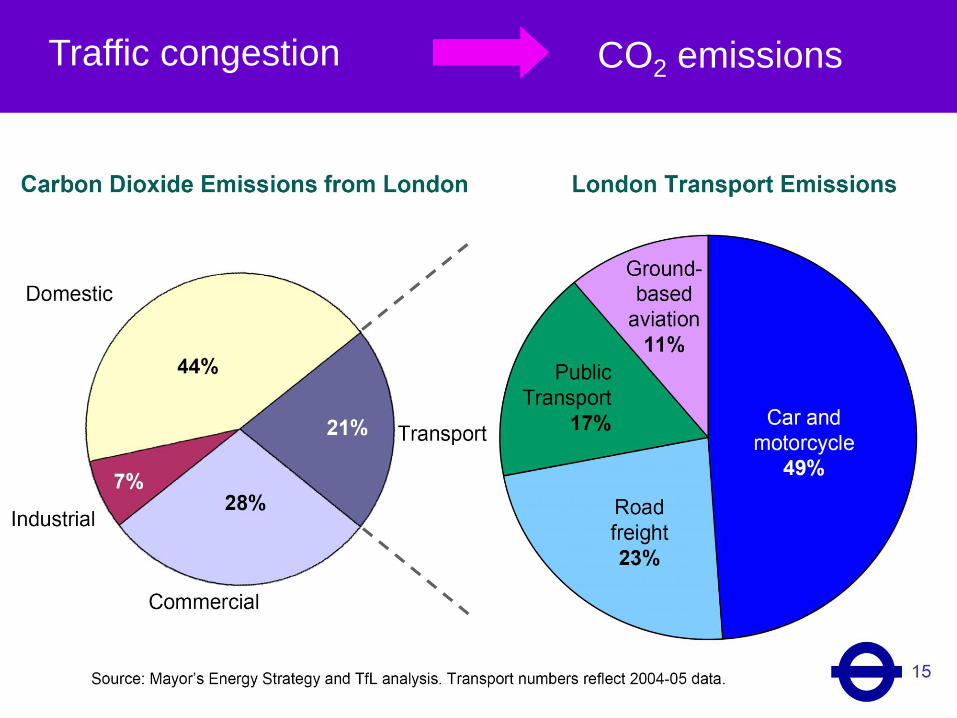
A
a Traffic congestion CO2 emissions
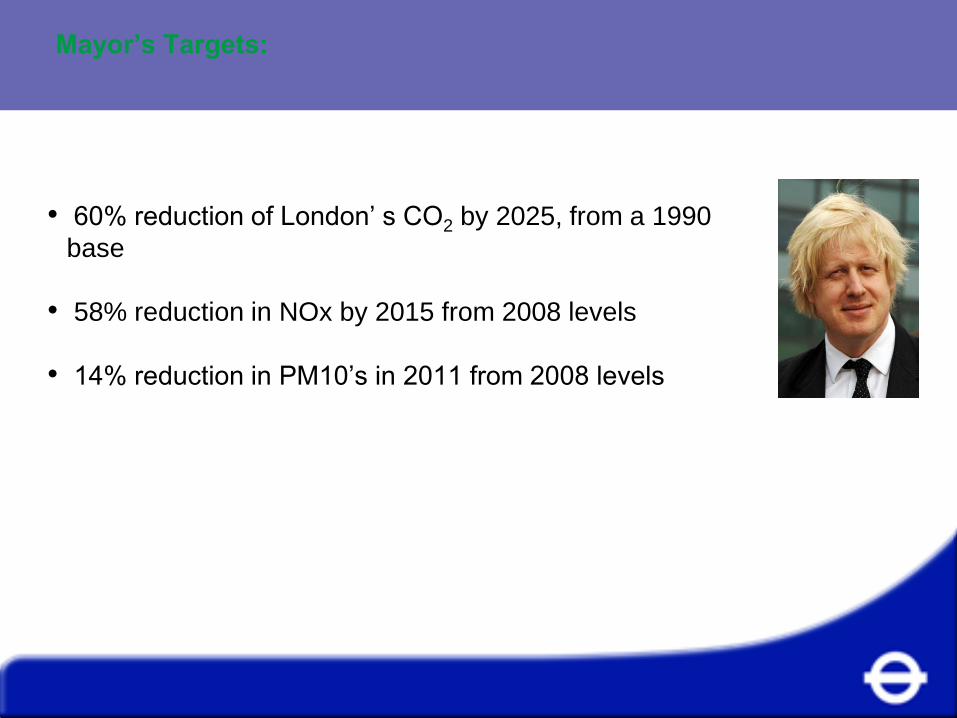
Mayor’s Targets:
61
Contents
• London Context – Mayor’s Transport
Strategy
• Congestion Charging in London
• London – Managing Road Network
• 60% reduction of London’ s CO2 by 2025, from a 1990
base
• 58% reduction in NOx by 2015 from 2008 levels
• 14% reduction in PM10’s in 2011 from 2008 levels
62
Contents
• London Context – Mayor’s Transport
Strategy
• Congestion Charging in London
• London – Managing Road Network
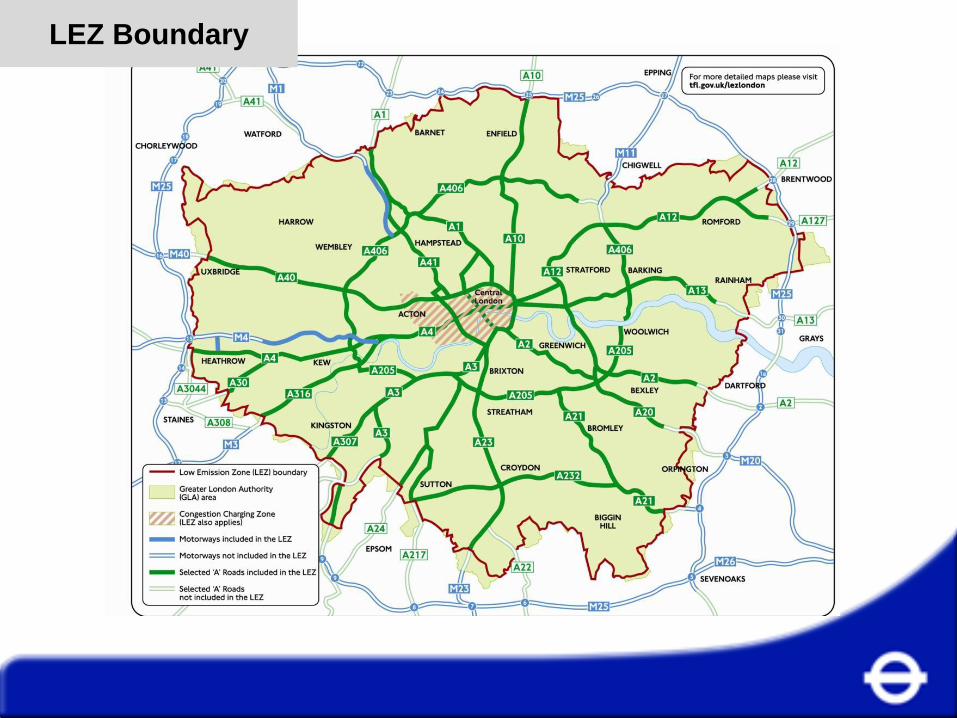
LEZ Boundary
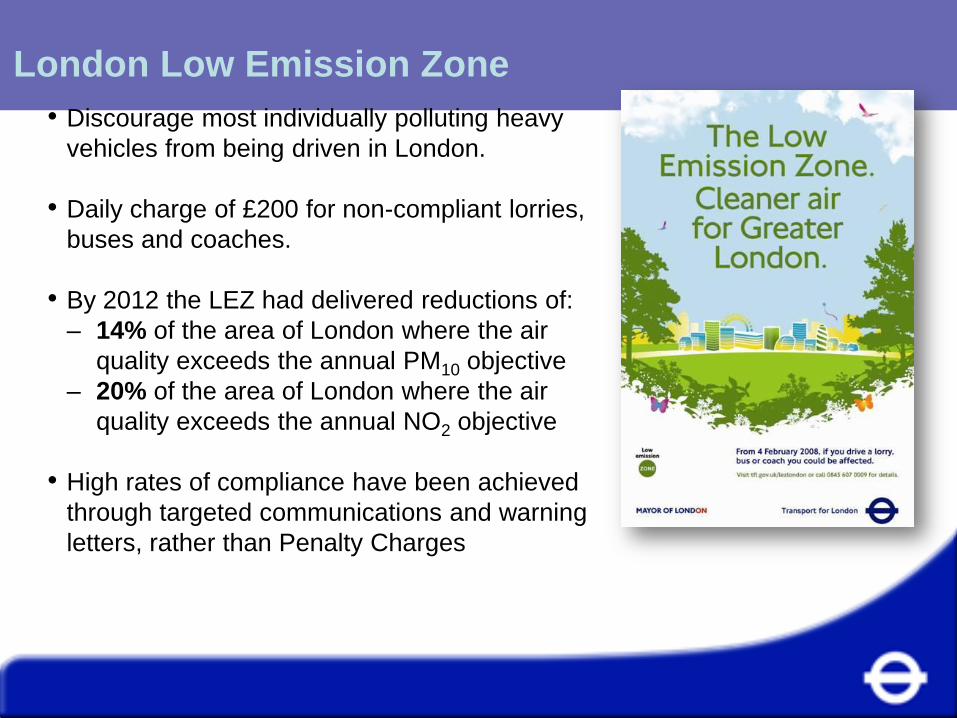
London Low Emission Zone
63
Contents
• London Context – Mayor’s Transport
Strategy
• Congestion Charging in London
• London – Managing Road Network
• Discourage most individually polluting heavy
vehicles from being driven in London.
• Daily charge of £200 for non-compliant lorries,
buses and coaches.
• By 2012 the LEZ had delivered reductions of:
– 14% of the area of London where the air
quality exceeds the annual PM10 objective
– 20% of the area of London where the air
quality exceeds the annual NO2 objective
• High rates of compliance have been achieved
through targeted communications and warning
letters, rather than Penalty Charges
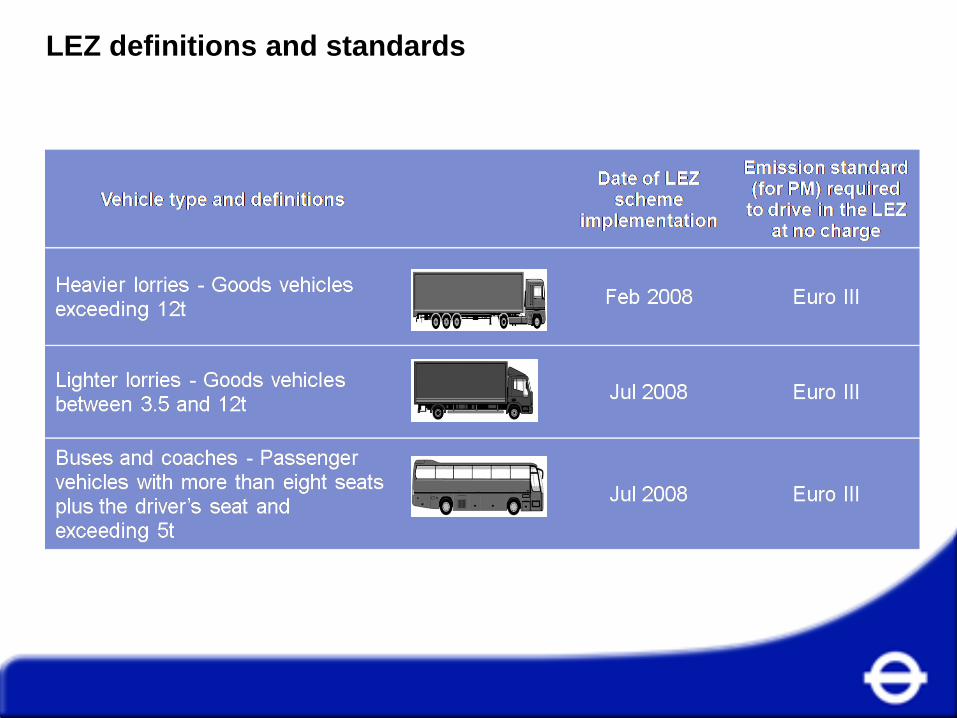
LEZ definitions and standards
64
Contents
• London Context – Mayor’s Transport
Strategy
• Congestion Charging in London
• London – Managing Road Network
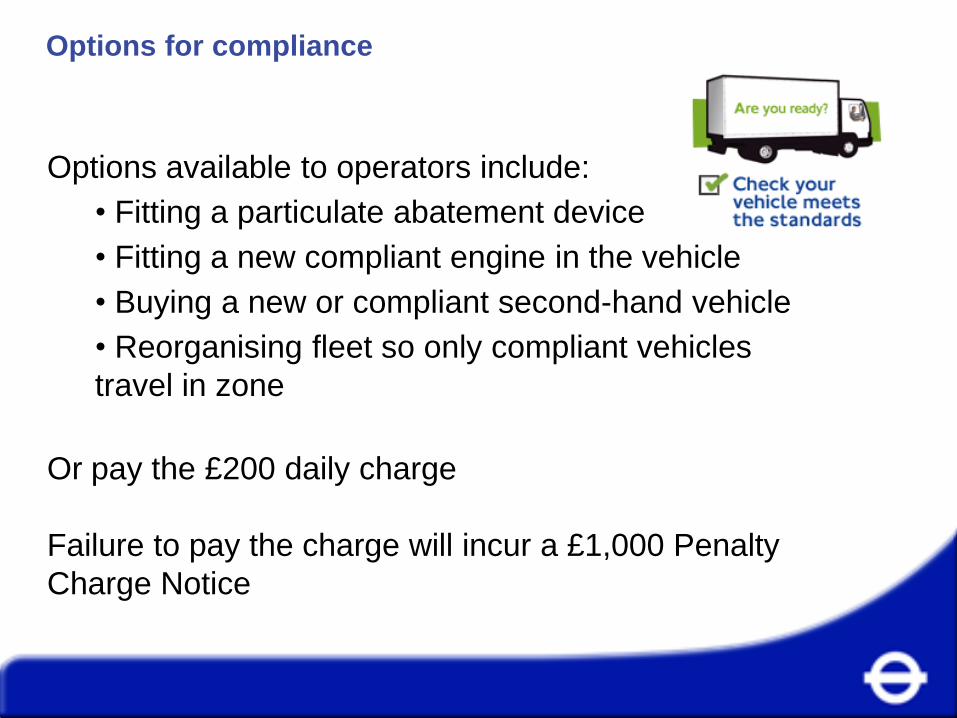
Options for compliance
65
Contents
• London Context – Mayor’s Transport
Strategy
• Congestion Charging in London
• London – Managing Road Network
Options available to operators include:
• Fitting a particulate abatement device
• Fitting a new compliant engine in the vehicle
• Buying a new or compliant second-hand vehicle
• Reorganising fleet so only compliant vehicles
travel in zone
Or pay the £200 daily charge
Failure to pay the charge will incur a £1,000 Penalty
Charge Notice
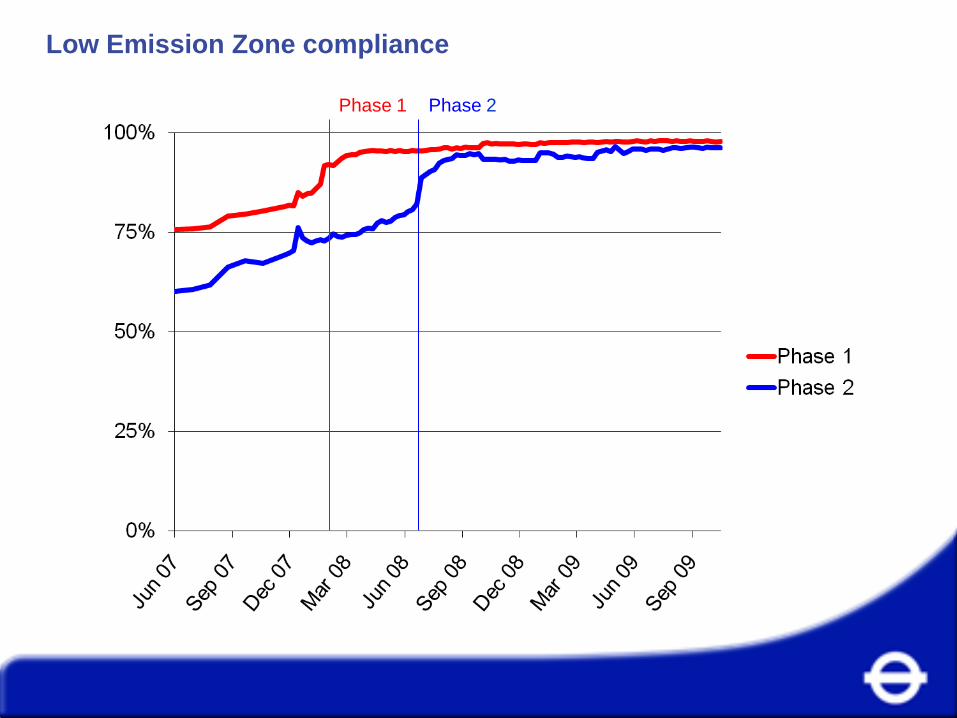
Low Emission Zone compliance
66
Contents
• London Context – Mayor’s Transport
Strategy
• Congestion Charging in London
• London – Managing Road Network
Phase 1 Phase 2
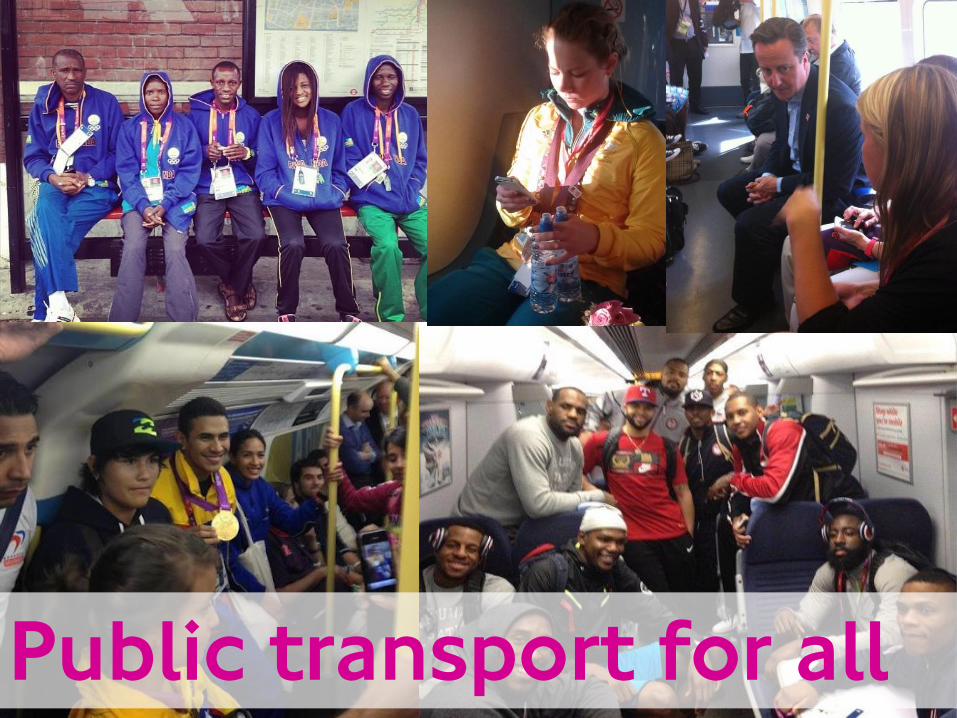
Games-time travel planning
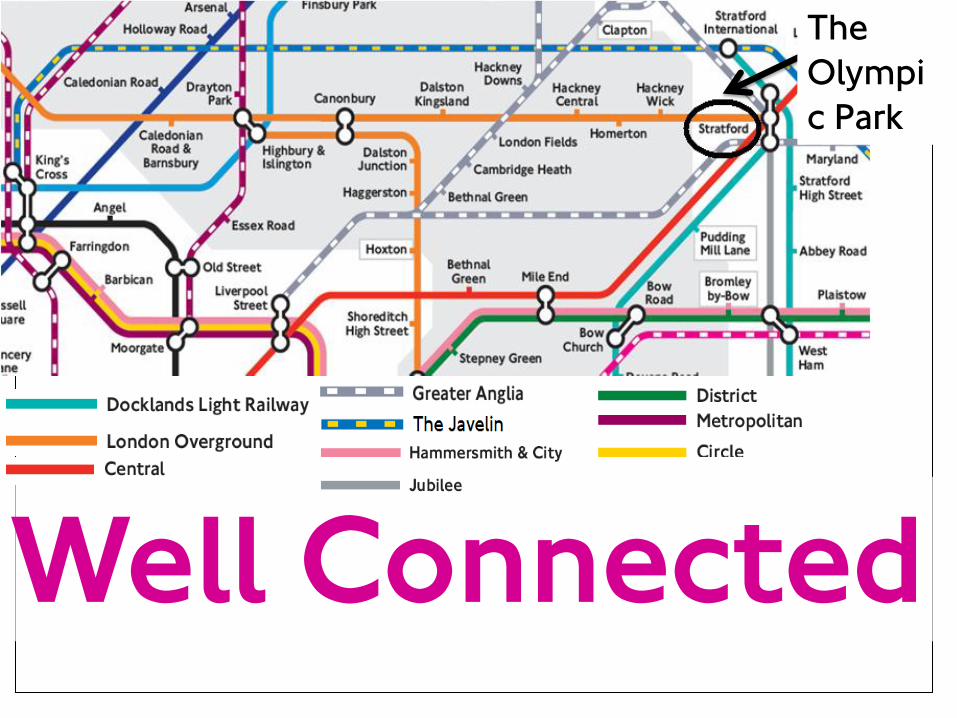
The
Olympi
c Park
Well Connected
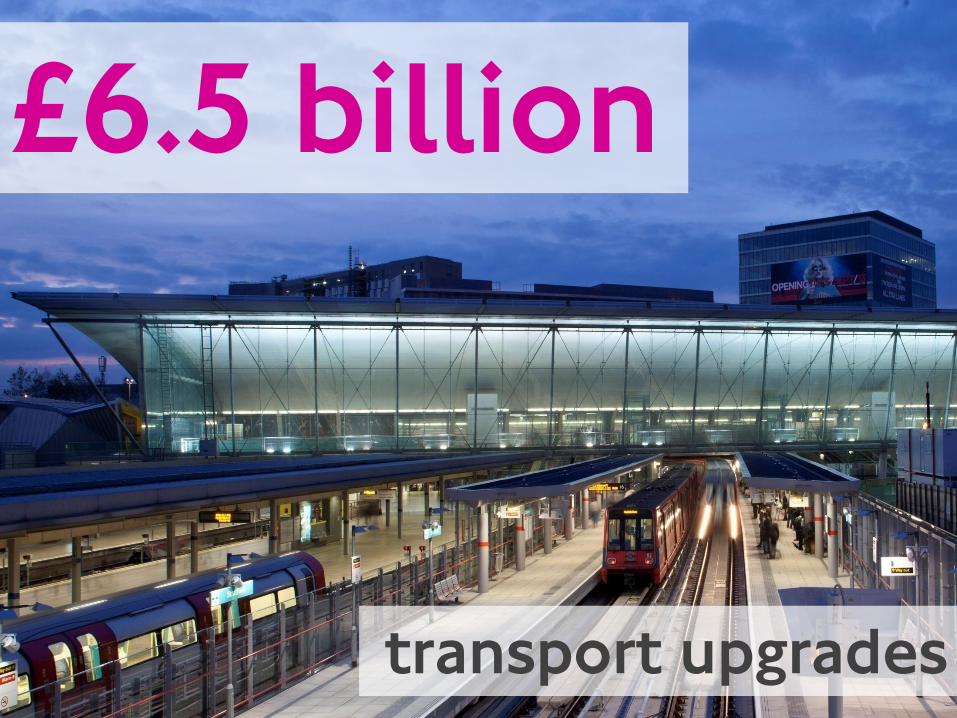
£6.5 billion
transport upgrades
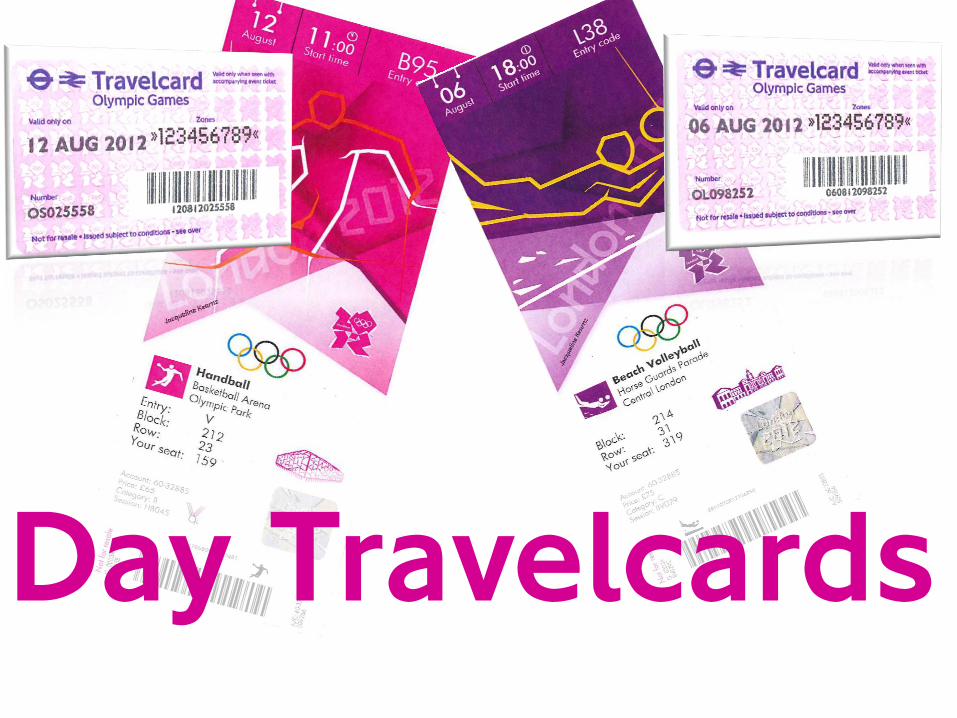
Day Travelcards
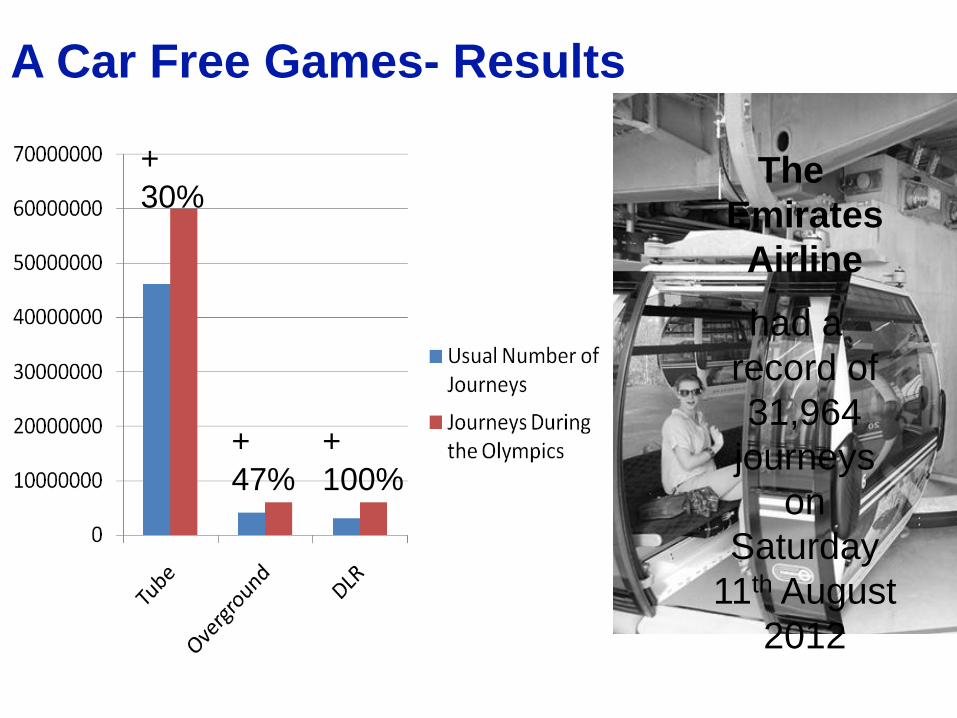
A Car Free Games- Results
+
30% The
Emirates
Airline
had a
record of
31,964
journeys
on
Saturday
11th August
2012
+
47%
+
100%
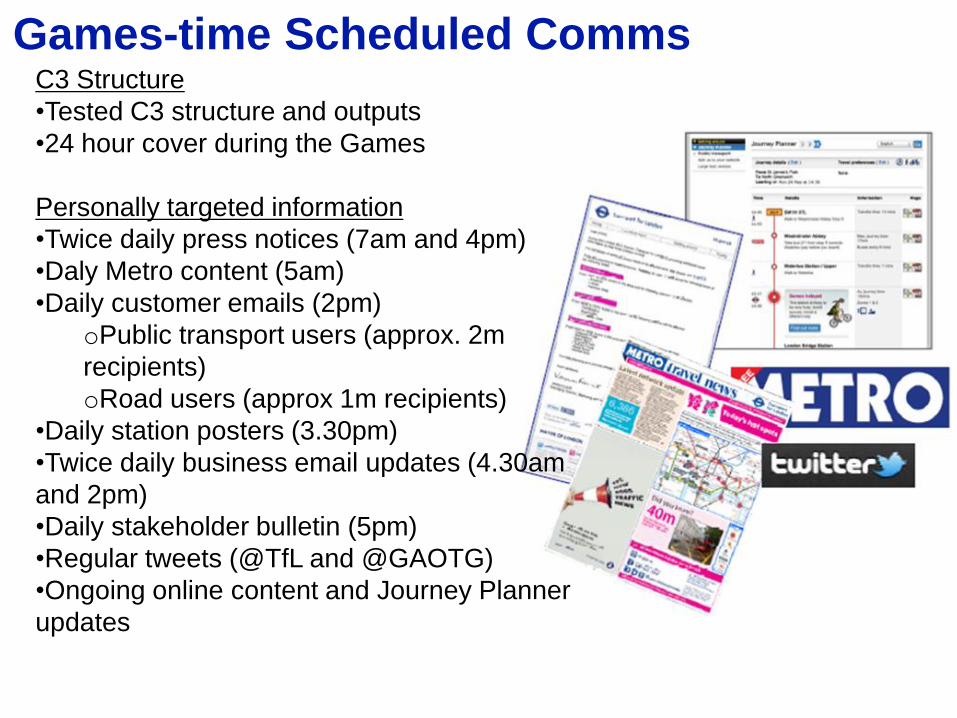
C3 Structure
•Tested C3 structure and outputs
•24 hour cover during the Games
Personally targeted information
•Twice daily press notices (7am and 4pm)
•Daly Metro content (5am)
•Daily customer emails (2pm)
oPublic transport users (approx. 2m
recipients)
oRoad users (approx 1m recipients)
•Daily station posters (3.30pm)
•Twice daily business email updates (4.30am
and 2pm)
•Daily stakeholder bulletin (5pm)
•Regular tweets (@TfL and @GAOTG)
•Ongoing online content and Journey Planner
updates
Games-time Scheduled Comms

However not everything went to plan...
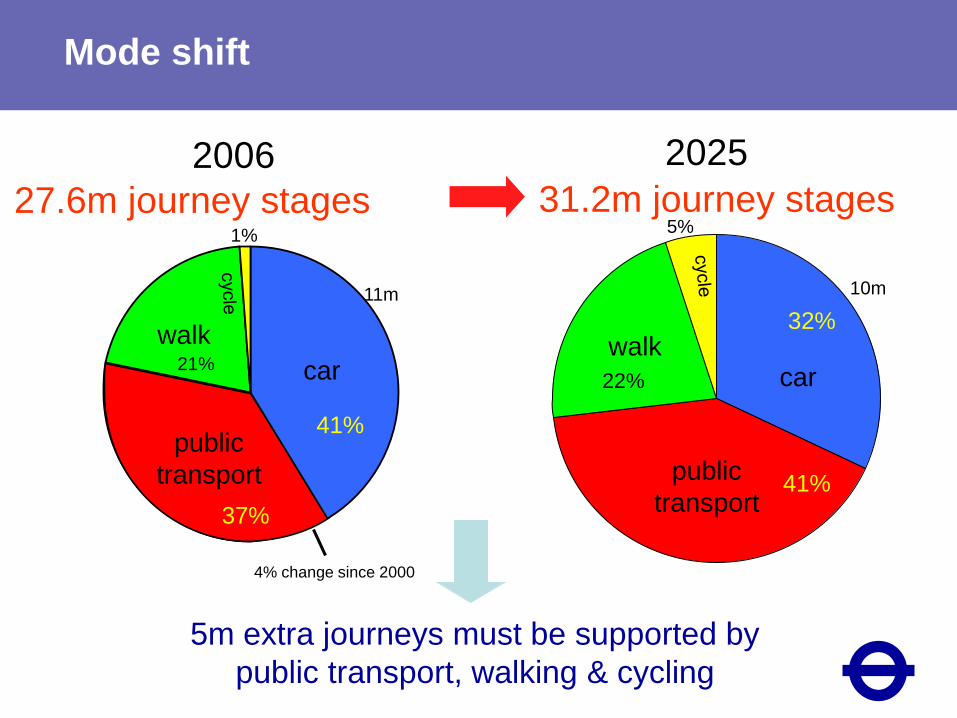
Mode shift
2006 2025
public
transport
car
walk
public
transport
car
27.6m journey stages 31.2m journey stages
37%
41%
41%
32% walk
22% 21%
5m extra journeys must be supported by
public transport, walking & cycling
11m 10m
1% 5%
4% change since 2000
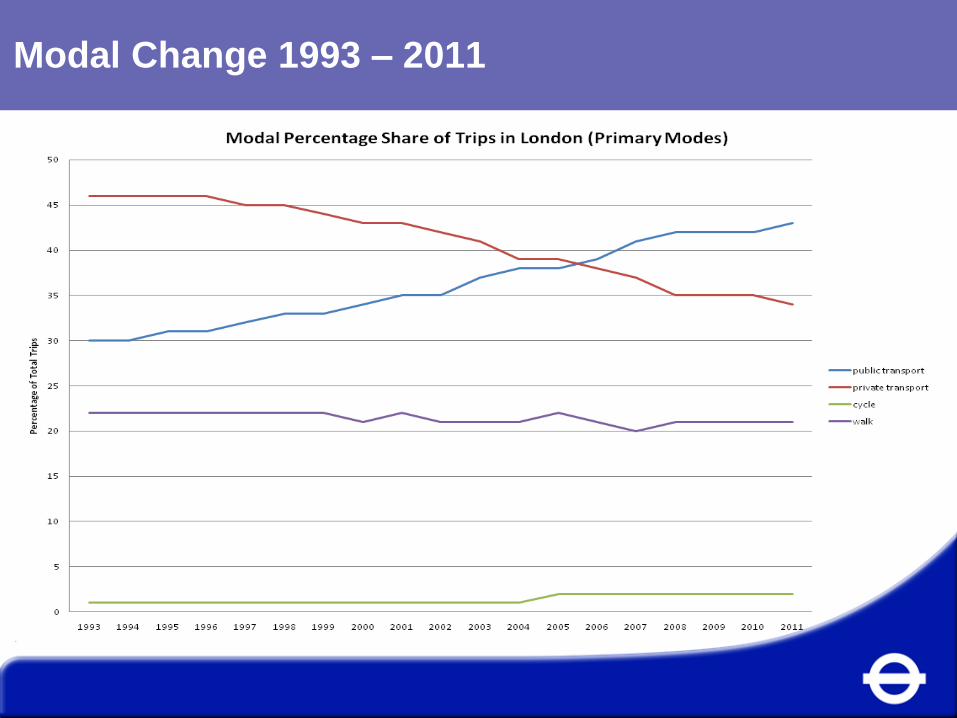
Modal Change 1993 – 2011
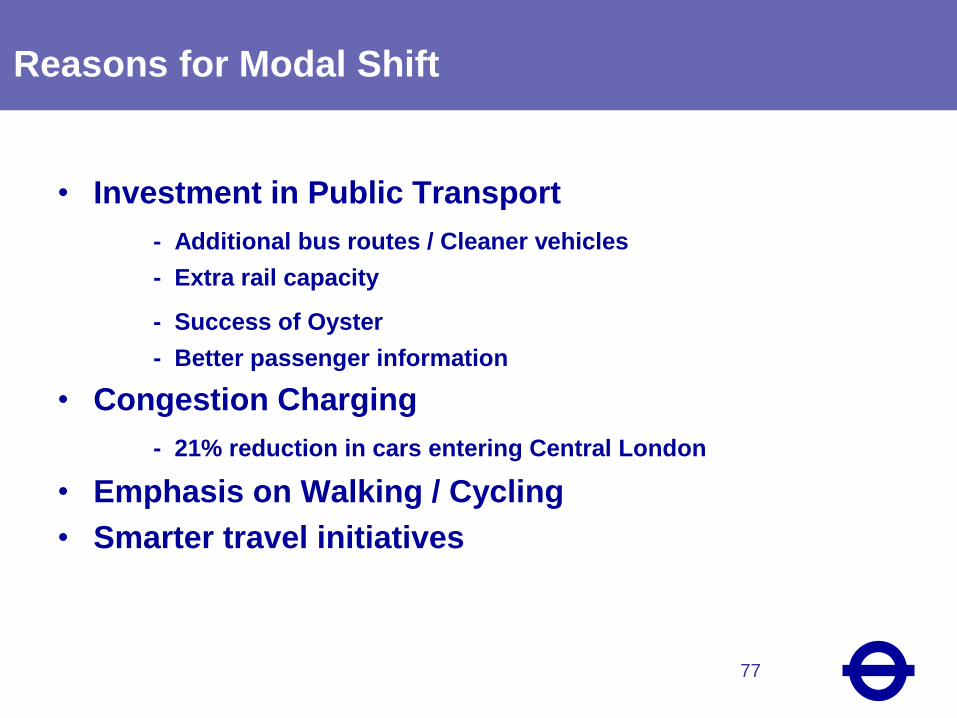
Reasons for Modal Shift
• Investment in Public Transport
- Additional bus routes / Cleaner vehicles
- Extra rail capacity
- Success of Oyster
- Better passenger information
• Congestion Charging
- 21% reduction in cars entering Central London
• Emphasis on Walking / Cycling
• Smarter travel initiatives
77