Embed Size (px)
Citation preview

RESEARCH BASED SOLUTIONS
The Motueka ICM Programme
The River Plume Ecosystem
Paul GillespieCommunity Reference Group
Presentation28 April 2009

INTEGRATED COASTAL MANAGEMENT
GOAL: to develop a “river plume ecosystem” (RPE) concept for evaluating and managing catchment-sea linkages
ICM frameworkLarge plume-affected areaRe-defined catchment areaExpansion of spatial scale to address multi-plume effects
173.00 173.10 173.20
41.15
41.05
40.95
40.85
Surface Salinity
173.00 173.10 173.20
41.15
41.05
40.95
40.85
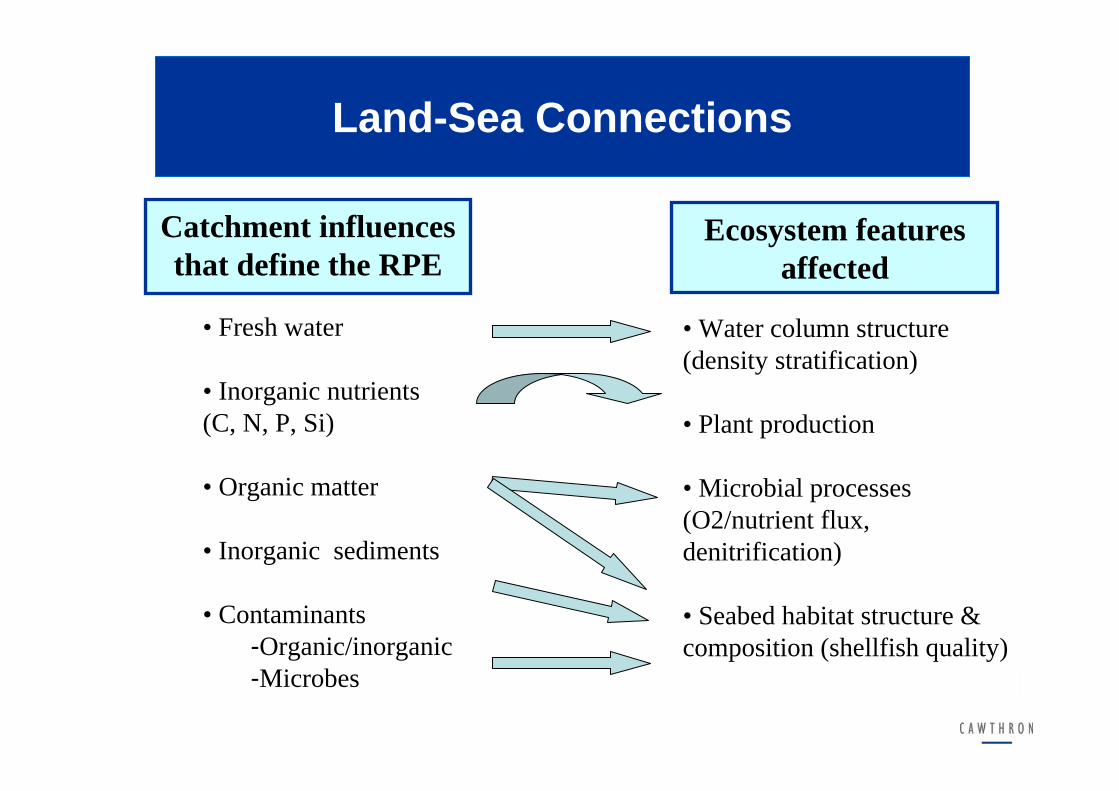
Land-Sea Connections
• Fresh water
• Inorganic nutrients (C, N, P, Si)
• Organic matter
• Inorganic sediments
• Contaminants -Organic/inorganic-Microbes
• Water column structure (density stratification)
• Plant production
• Microbial processes (O2/nutrient flux, denitrification)
• Seabed habitat structure & composition (shellfish quality)
Catchment influences that define the RPE
Ecosystem features affected
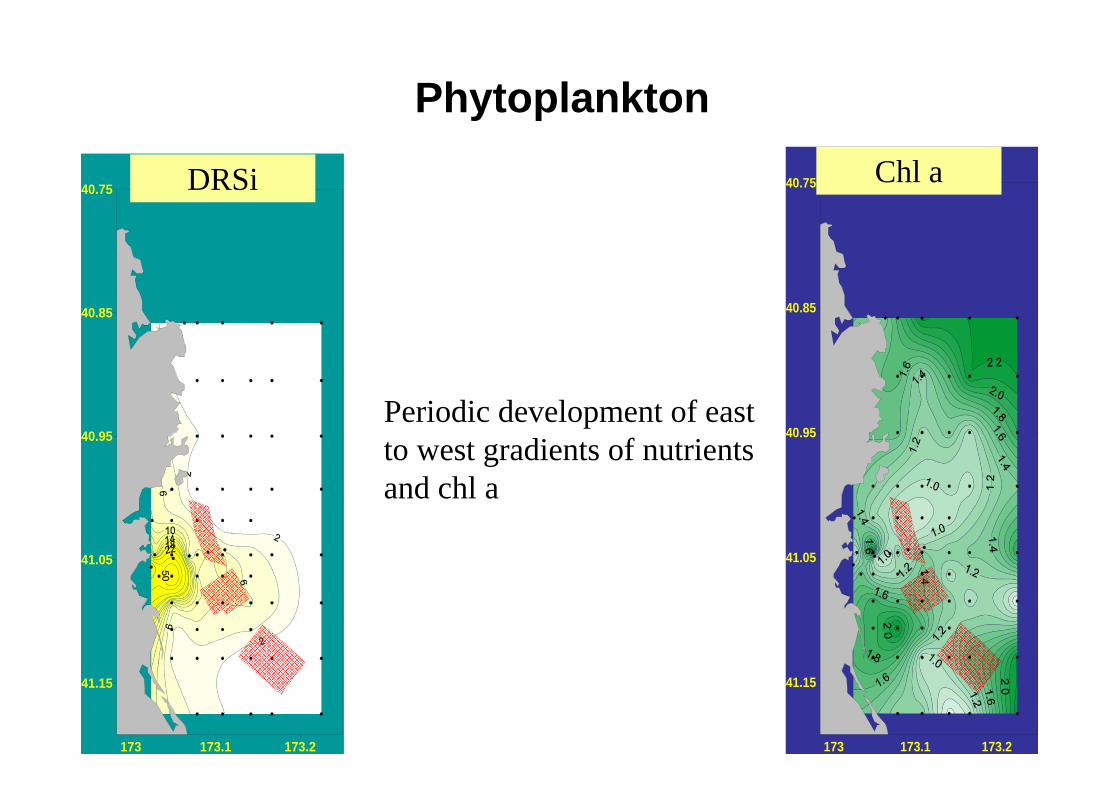
Phytoplankton
Periodic development of east to west gradients of nutrients and chl a
173 173.1 173.2
9-10 May 2001
41.15
41.05
40.95
40.85
40.75
173 173.1 173.2
9-10 May 2001
41.15
41.05
40.95
40.85
40.75DRSi Chl a
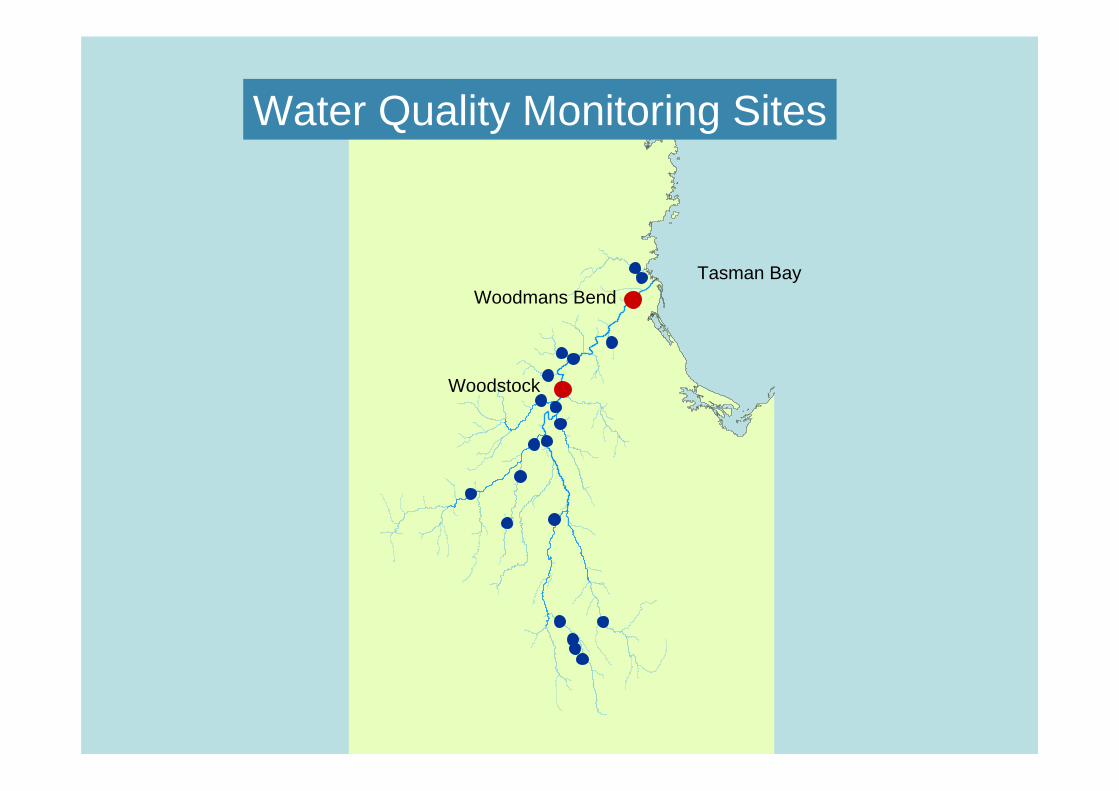
Woodstock
Woodmans BendTasman Bay
Water Quality Monitoring Sites
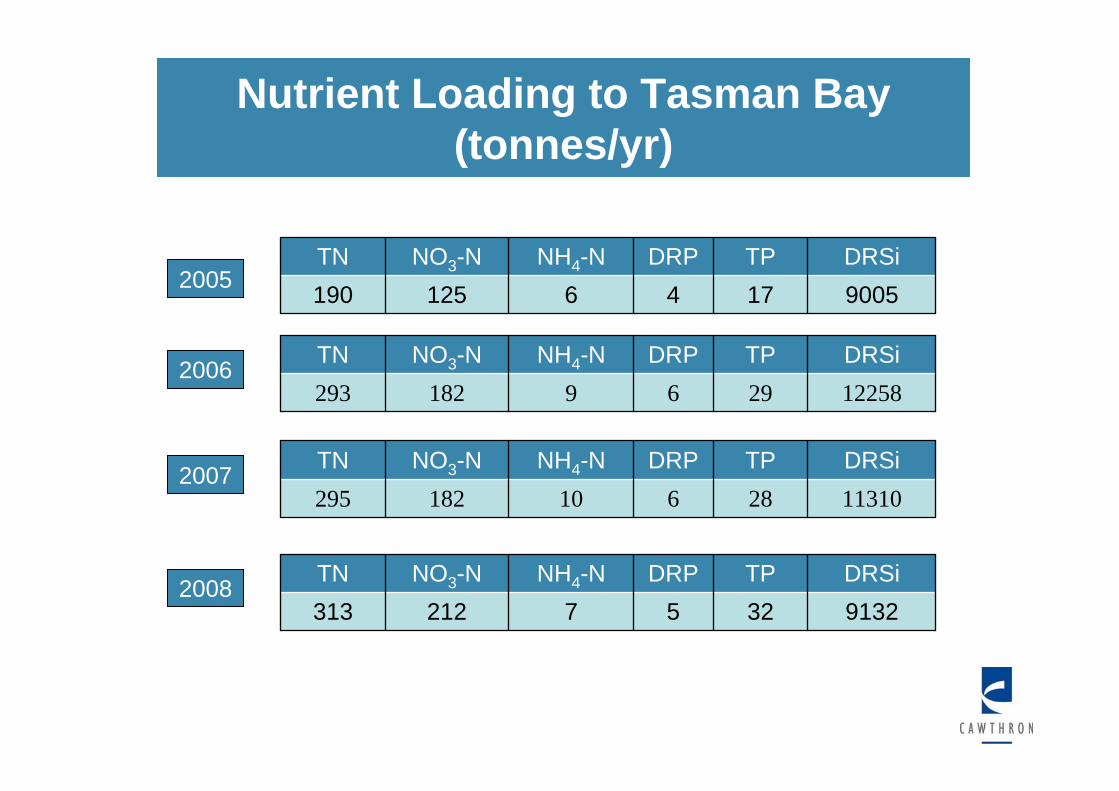
Nutrient Loading to Tasman Bay (tonnes/yr)
122582969182293DRSiTPDRPNH4-NNO3-NTN
91323257212313DRSiTPDRPNH4-NNO3-NTN
90051746125190DRSiTPDRPNH4-NNO3-NTN
2005
2006
2007
2008
1131028610182295DRSiTPDRPNH4-NNO3-NTN
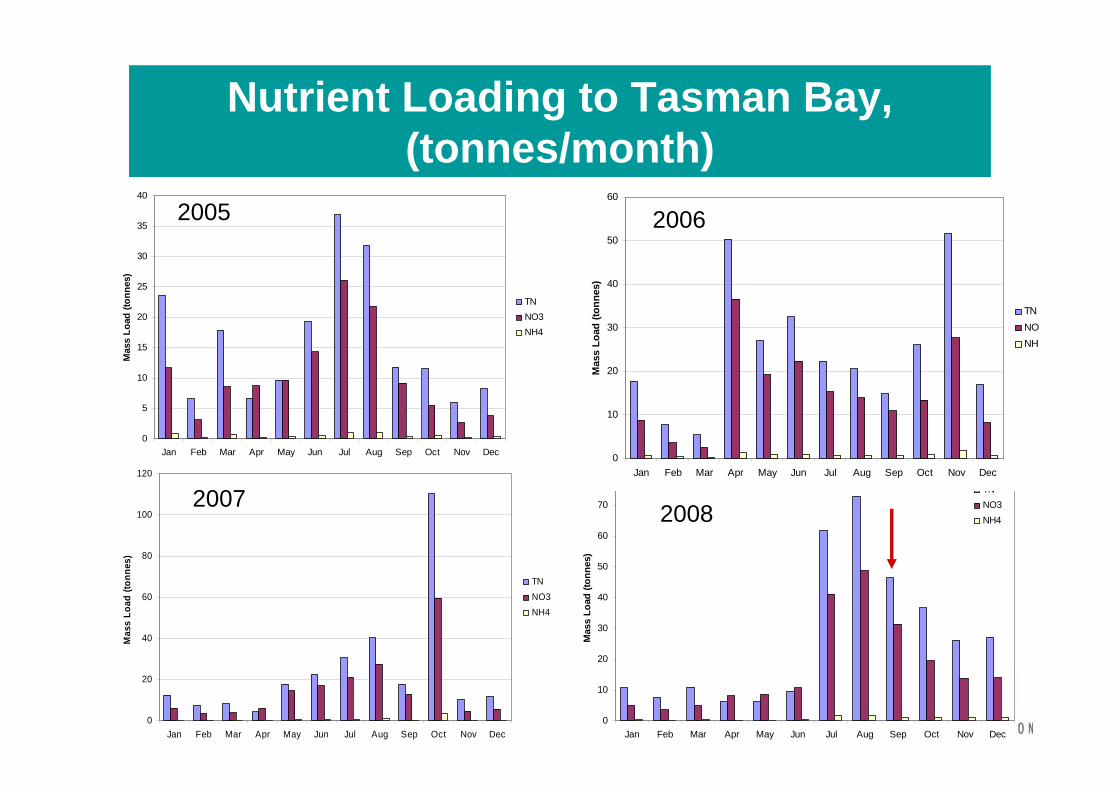
Nutrient Loading to Tasman Bay, (tonnes/month)
0
5
10
15
20
25
30
35
40
Jan Feb Mar Apr May Jun Jul Aug Sep Oct Nov Dec
Mas
s Lo
ad (t
onne
s)
TNNO3NH4
0
20
40
60
80
100
120
Jan Feb Mar Apr May Jun Jul Aug Sep Oct Nov Dec
Mas
s Lo
ad (t
onne
s)
TNNO3NH4
2005
2007
0
10
20
30
40
50
60
70
80
Jan Feb Mar Apr May Jun Jul Aug Sep Oct Nov Dec
Mas
s Lo
ad (t
onne
s)
TNNO3NH42008
0
10
20
30
40
50
60
Jan Feb Mar Apr May Jun Jul Aug Sep Oct Nov Dec
Mas
s Lo
ad (t
onne
s)
TNNONH4
2006
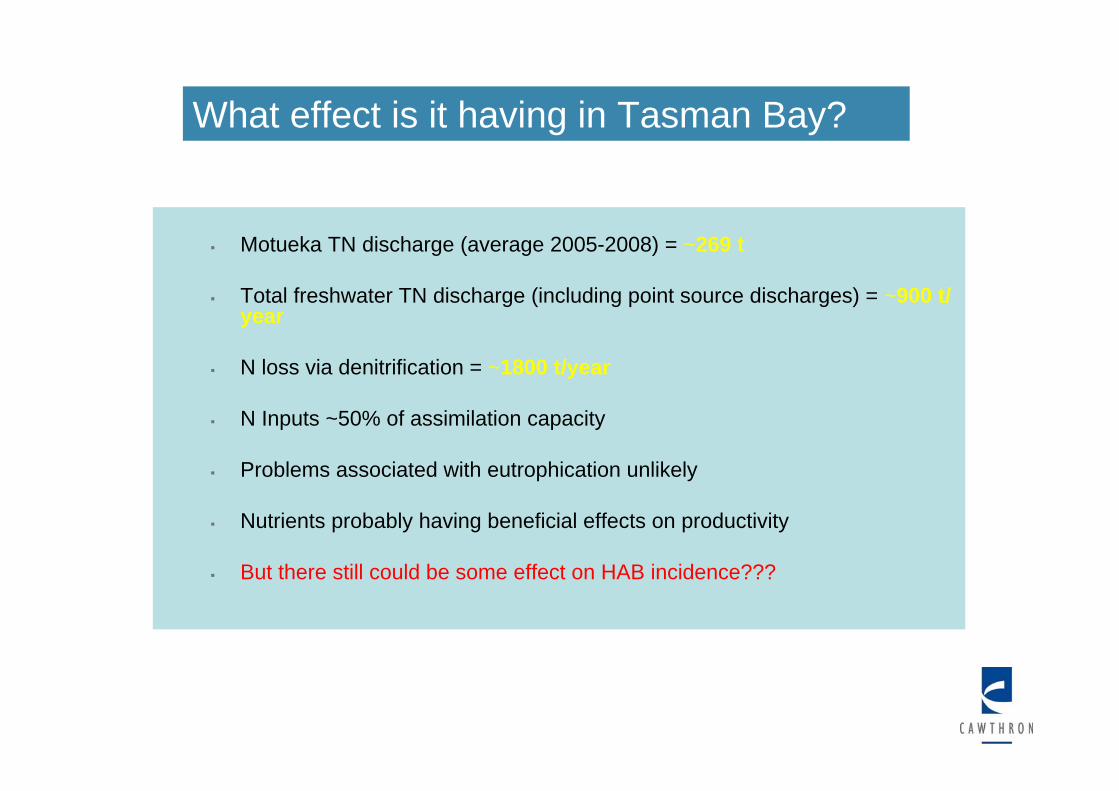
What effect is it having in Tasman Bay?
Motueka TN discharge (average 2005-2008) = ~269 t
Total freshwater TN discharge (including point source discharges) = ~900 t/ year
N loss via denitrification = ~1800 t/year
N Inputs ~50% of assimilation capacity
Problems associated with eutrophication unlikely
Nutrients probably having beneficial effects on productivity
But there still could be some effect on HAB incidence???
What effect is it having in Tasman Bay?
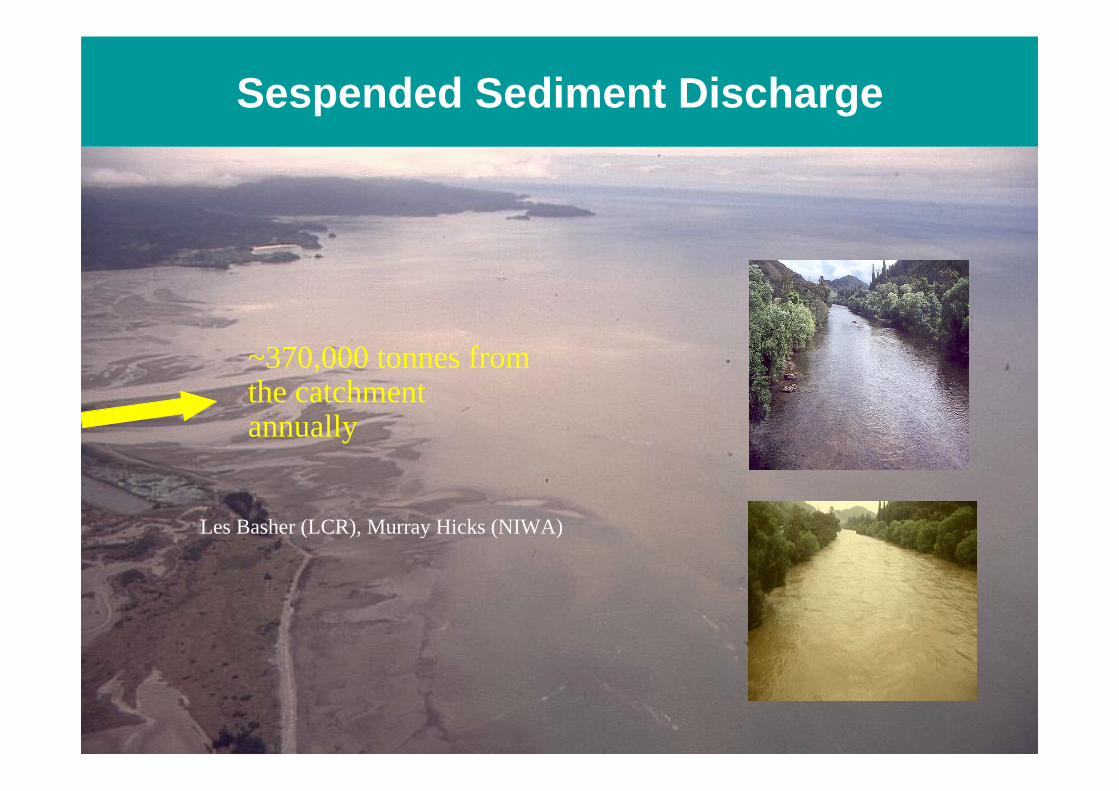
Sespended Sediment Discharge
~370,000 tonnes from the catchment annually
Les Basher (LCR), Murray Hicks (NIWA)
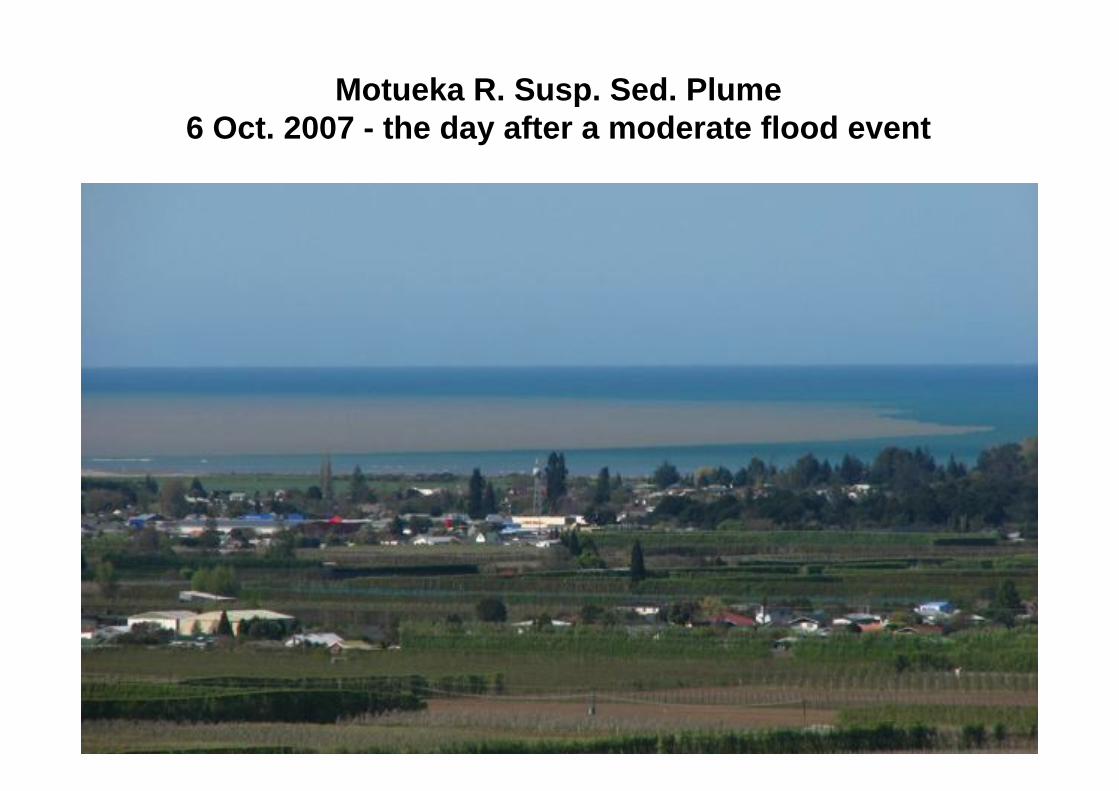
Motueka R. Susp. Sed. Plume6 Oct. 2007 - the day after a moderate flood event

Waimea River plume 25 Jan 2009 -no rain
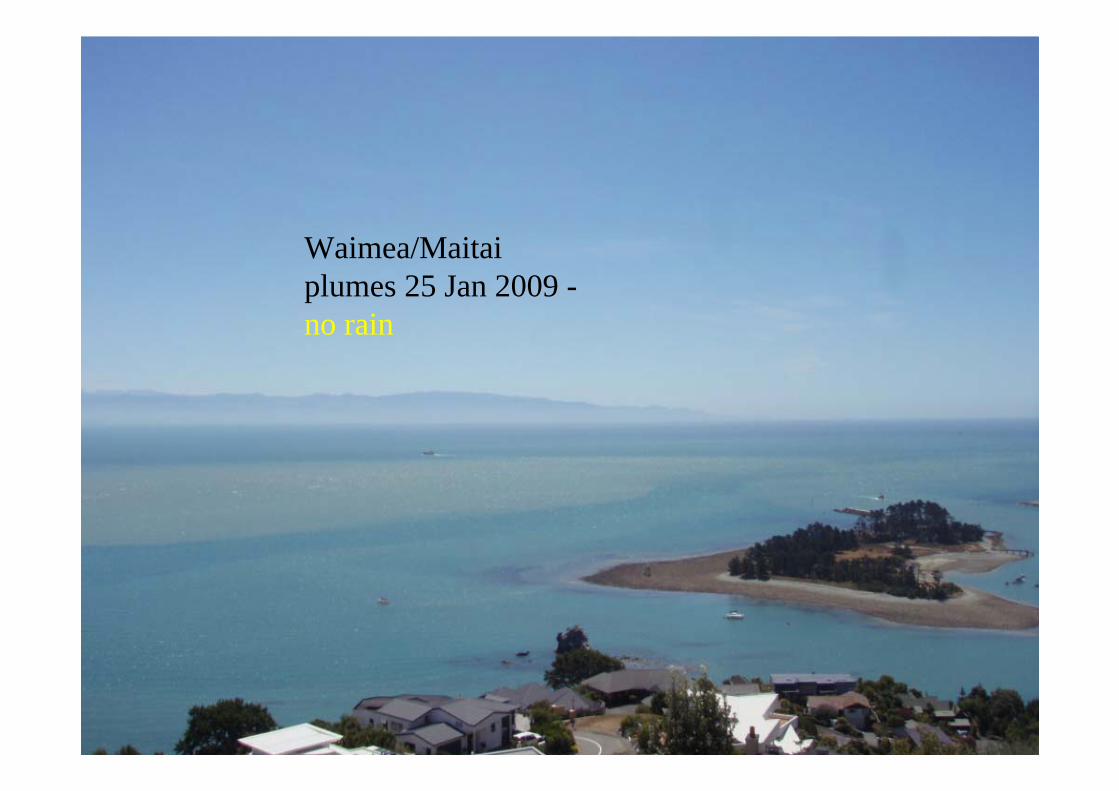
Waimea/Maitaiplumes 25 Jan 2009 -no rain
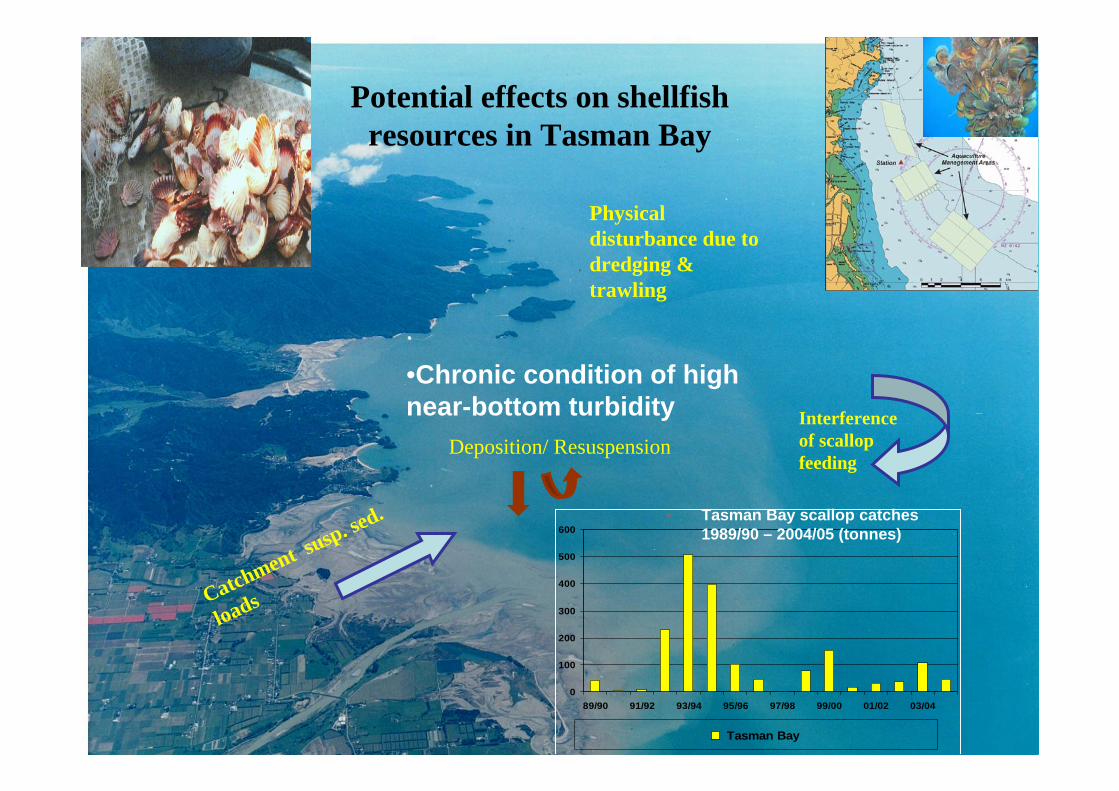
Potential effects on shellfish resources in Tasman Bay
•Chronic condition of high near-bottom turbidity
Catchment susp. sed.
loads
Physical disturbance due to dredging & trawling
Deposition/ Resuspension
0
100
200
300
400
500
600
89/90 91/92 93/94 95/96 97/98 99/00 01/02 03/04
Tasman Bay
Tasman Bay scallop catches 1989/90 – 2004/05 (tonnes)
Interference of scallop feeding

What do scallops eat?
Scallops more sensitive to inorganic SS than mussels
Phytoplankton Benthic diatoms
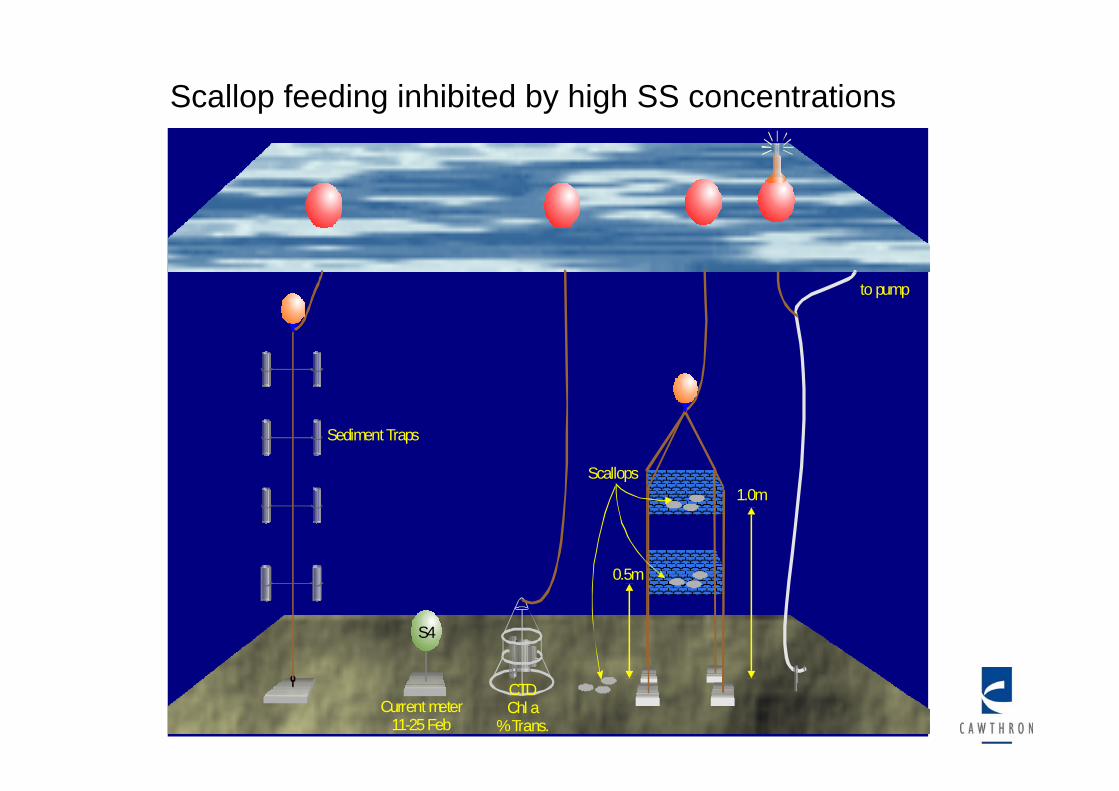
to pump
0.5m
1.0mScallops
CTDChl a
% Trans.
S4
Current meter11-25 Feb
Sediment Traps
Scallop feeding inhibited by high SS concentrations
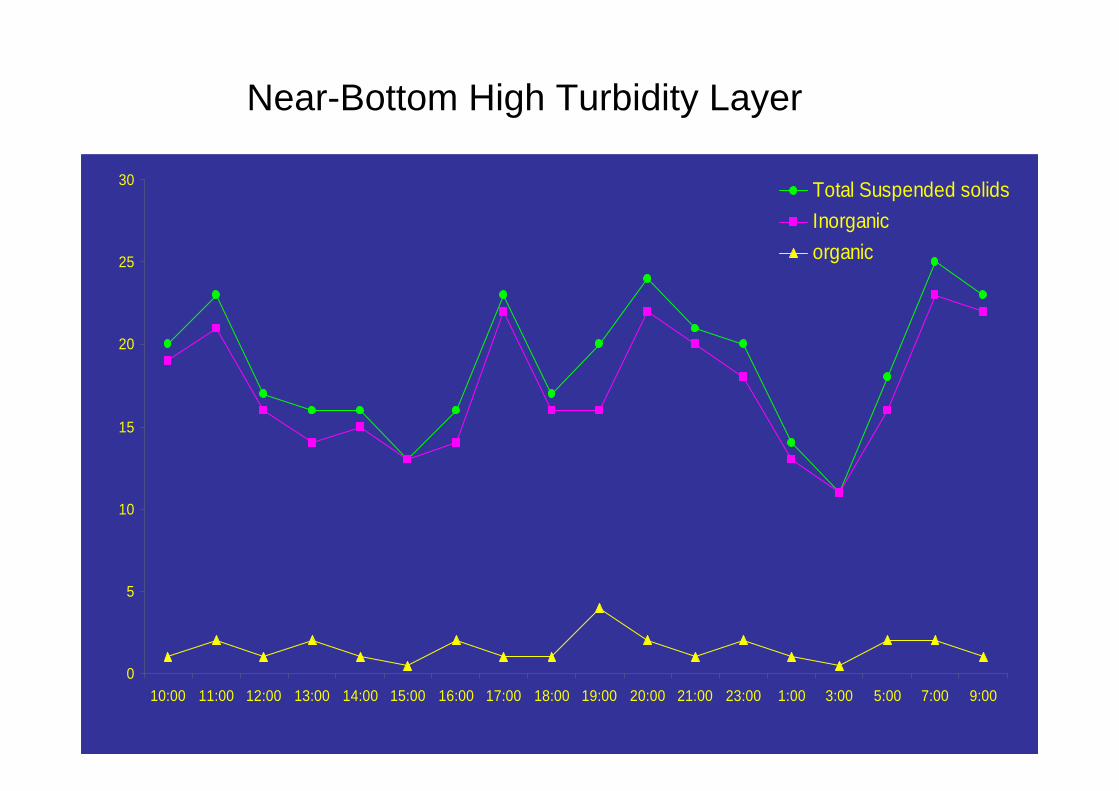
Near-Bottom High Turbidity Layer
Suspended Solids content (mg/L) of near-bottom waters of the Motueka plume
0
5
10
15
20
25
30
10:00 11:00 12:00 13:00 14:00 15:00 16:00 17:00 18:00 19:00 20:00 21:00 23:00 1:00 3:00 5:00 7:00 9:00
Total Suspended solidsInorganicorganic
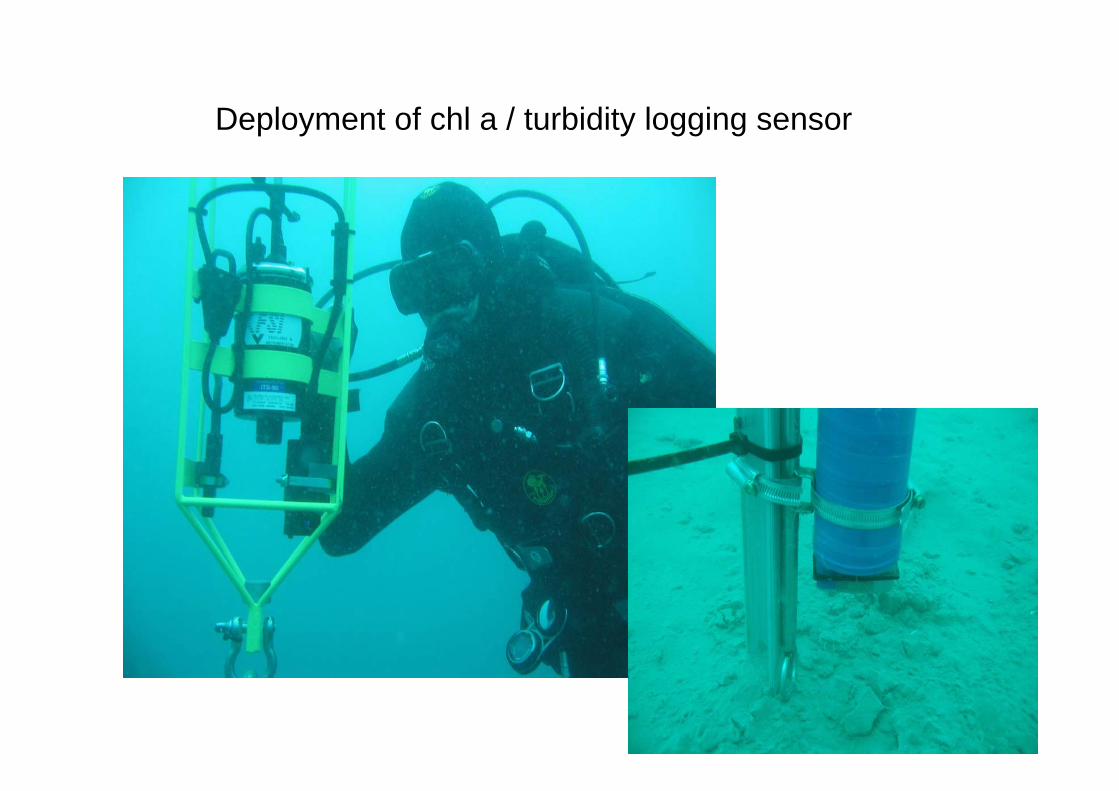
Tasman Bay LT in situ Data Collection FacilityDeployment of chl a / turbidity logging sensor
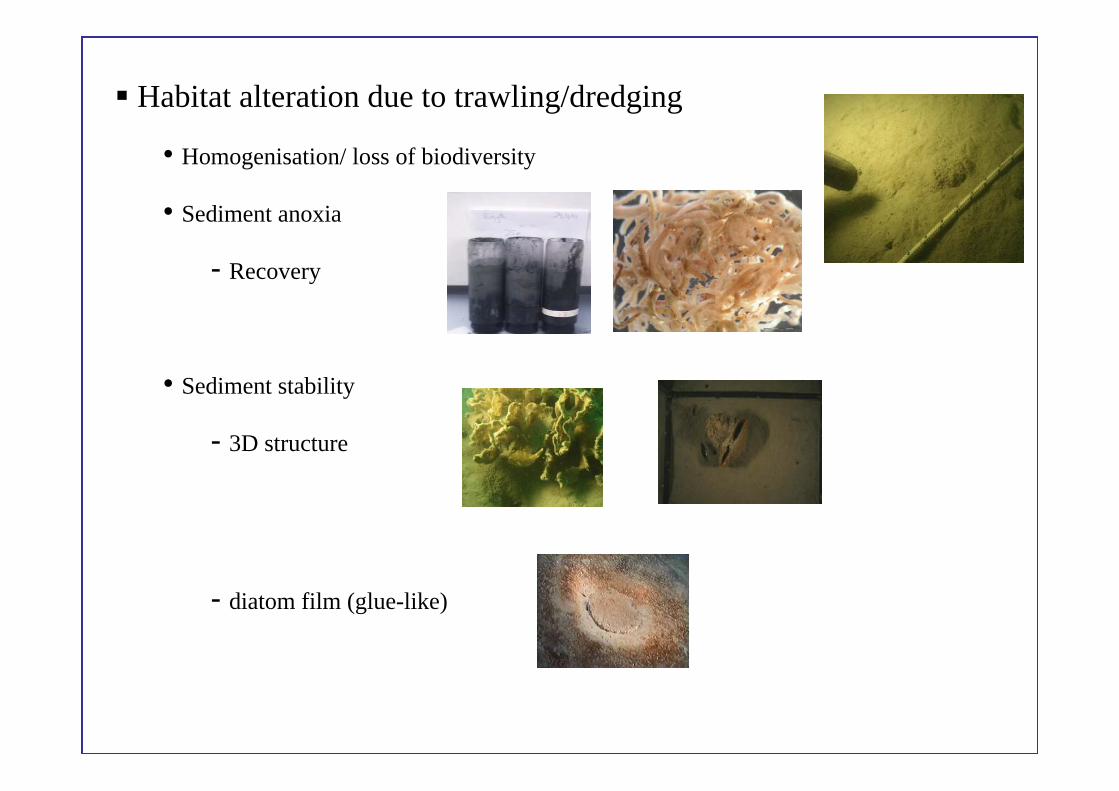
Physical seabed disturbancesHabitat alteration due to trawling/dredging
• Homogenisation/ loss of biodiversity
• Sediment anoxia
- Recovery
• Sediment stability
- 3D structure
- diatom film (glue-like)

Red Hills
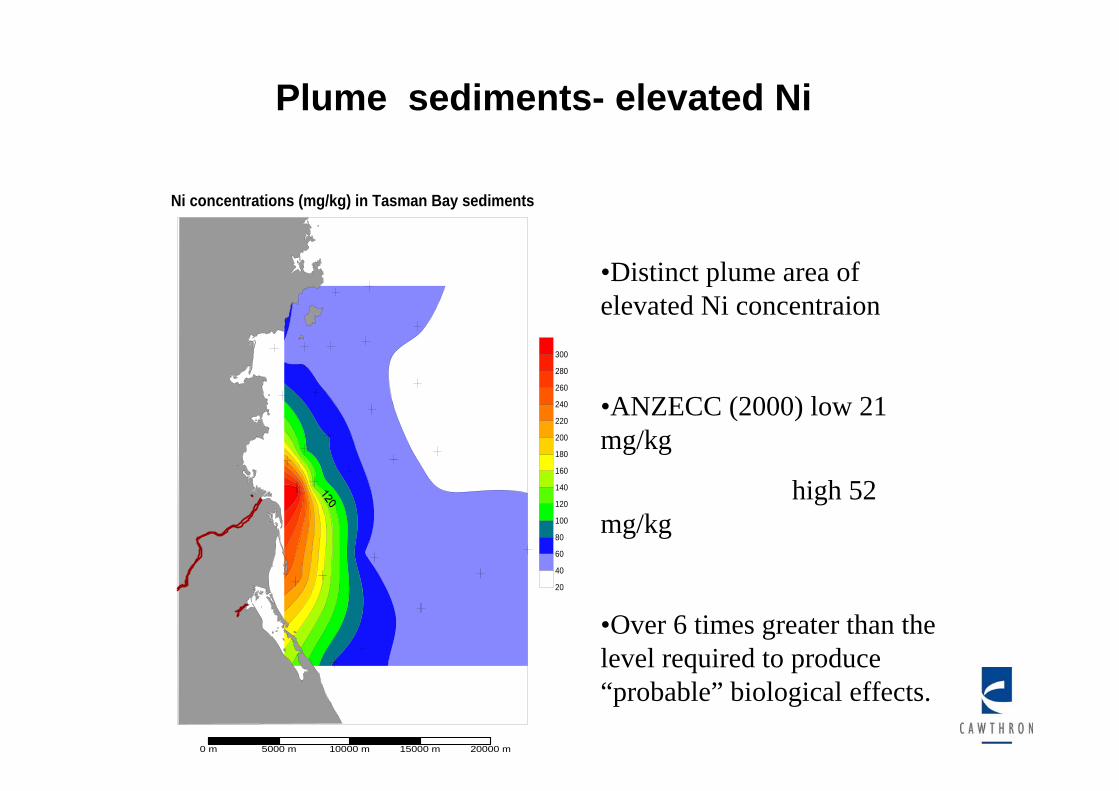
Plume sediments- elevated Ni
Ni concentrations (mg/kg) in Tasman Bay sediments
20
40
60
80
100
120
140
160
180
200
220
240
260
280
300
0 m 5000 m 10000 m 15000 m 20000 m
•Distinct plume area of elevated Ni concentraion
•ANZECC (2000) low 21 mg/kg
high 52 mg/kg
•Over 6 times greater than the level required to produce “probable” biological effects.
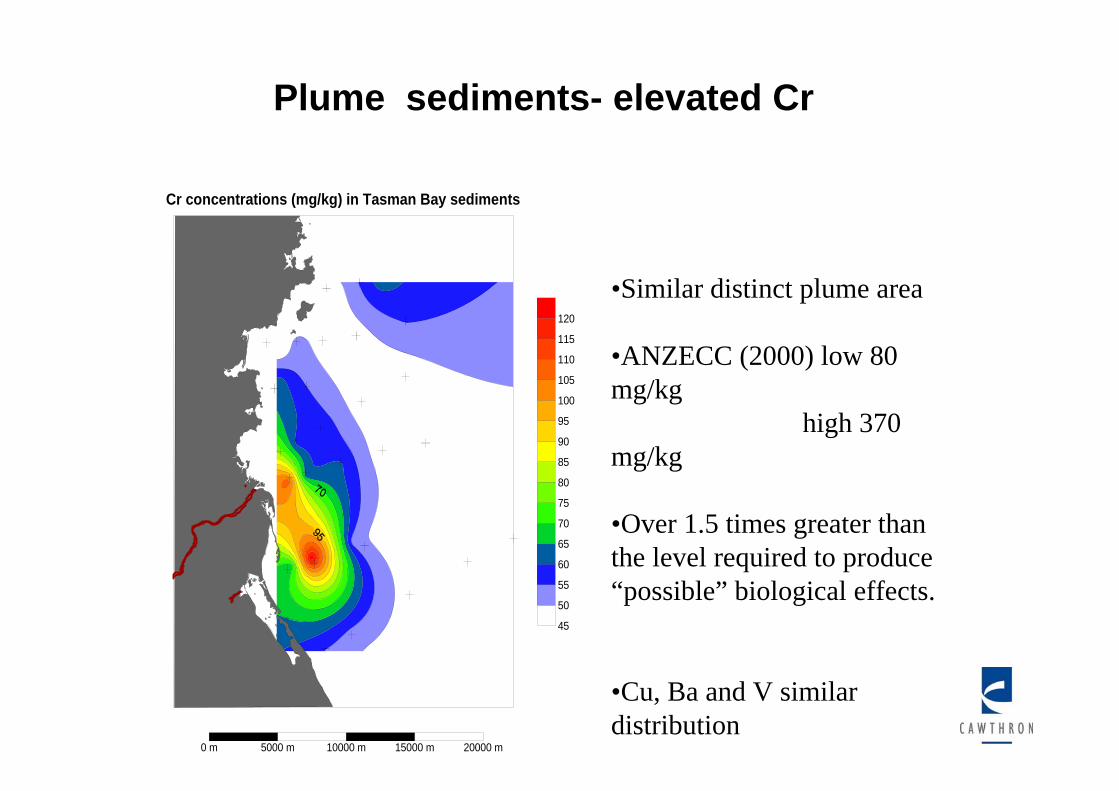
Plume sediments- elevated Cr
Cr concentrations (mg/kg) in Tasman Bay sediments
45
50
55
60
65
70
75
80
85
90
95
100
105
110
115
120
0 m 5000 m 10000 m 15000 m 20000 m
•Similar distinct plume area
•ANZECC (2000) low 80 mg/kg
high 370 mg/kg
•Over 1.5 times greater than the level required to produce “possible” biological effects.
•Cu, Ba and V similar distribution
Motueka@Gorge
Riwaka@Hickmotts
Motueka@Woodmans
Graham R
Motueka@Woodstock
Stanley Brook
Motueka u/s WangapekaWangapeka@Walters Peak
Baton
Motueka u/s MotupikoMotupiko@Quinney Bush
1
23
4
56
78
Tadmore
9
10
11
12
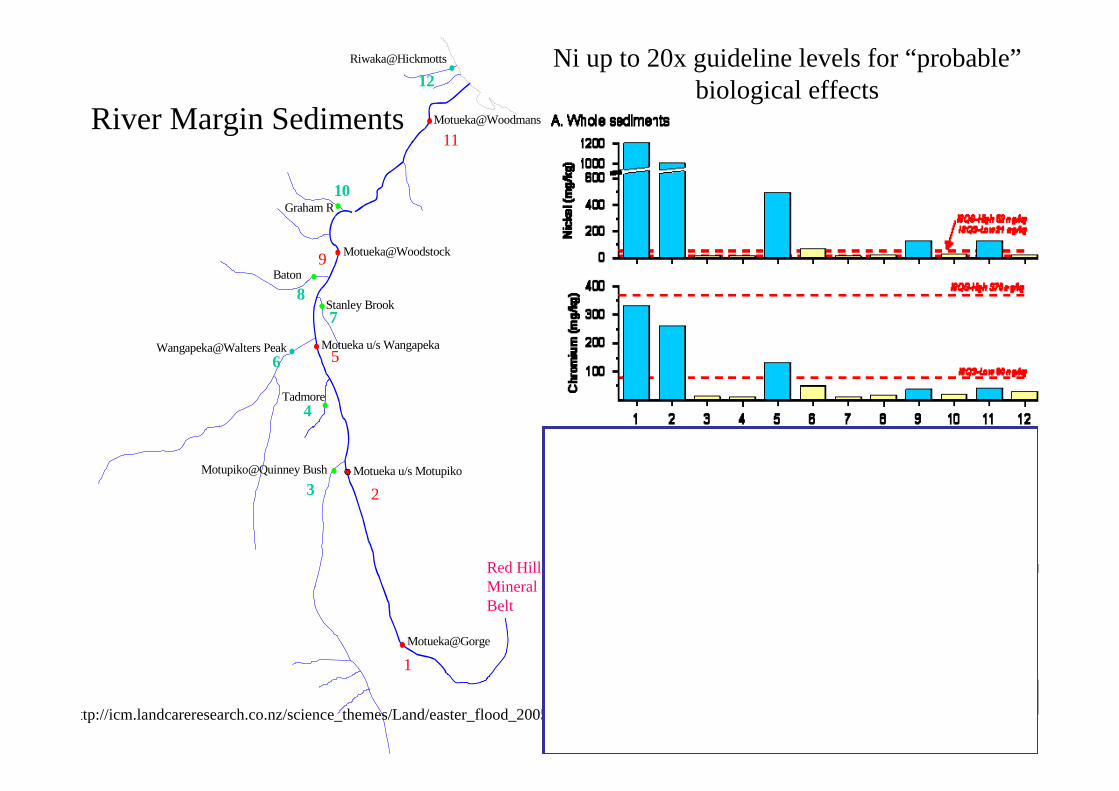
River Margin Sediments
Red Hills Mineral Belt
Ni up to 20x guideline levels for “probable”biological effects
ttp://icm.landcareresearch.co.nz/science_themes/Land/easter_flood_2005.htm
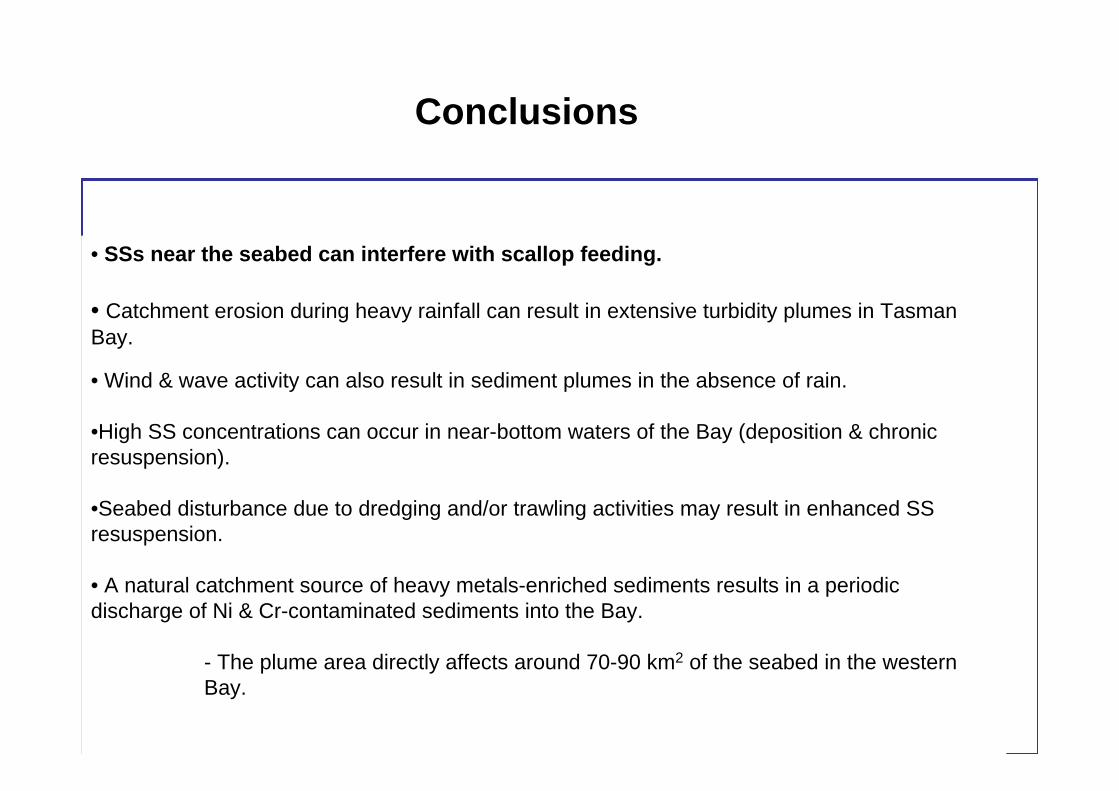
Conclusions
• SSs near the seabed can interfere with scallop feeding.
• Catchment erosion during heavy rainfall can result in extensive turbidity plumes in Tasman Bay.
• Wind & wave activity can also result in sediment plumes in the absence of rain.
•High SS concentrations can occur in near-bottom waters of the Bay (deposition & chronic resuspension).
•Seabed disturbance due to dredging and/or trawling activities may result in enhanced SS resuspension.
• A natural catchment source of heavy metals-enriched sediments results in a periodic discharge of Ni & Cr-contaminated sediments into the Bay.
- The plume area directly affects around 70-90 km2 of the seabed in the western Bay.
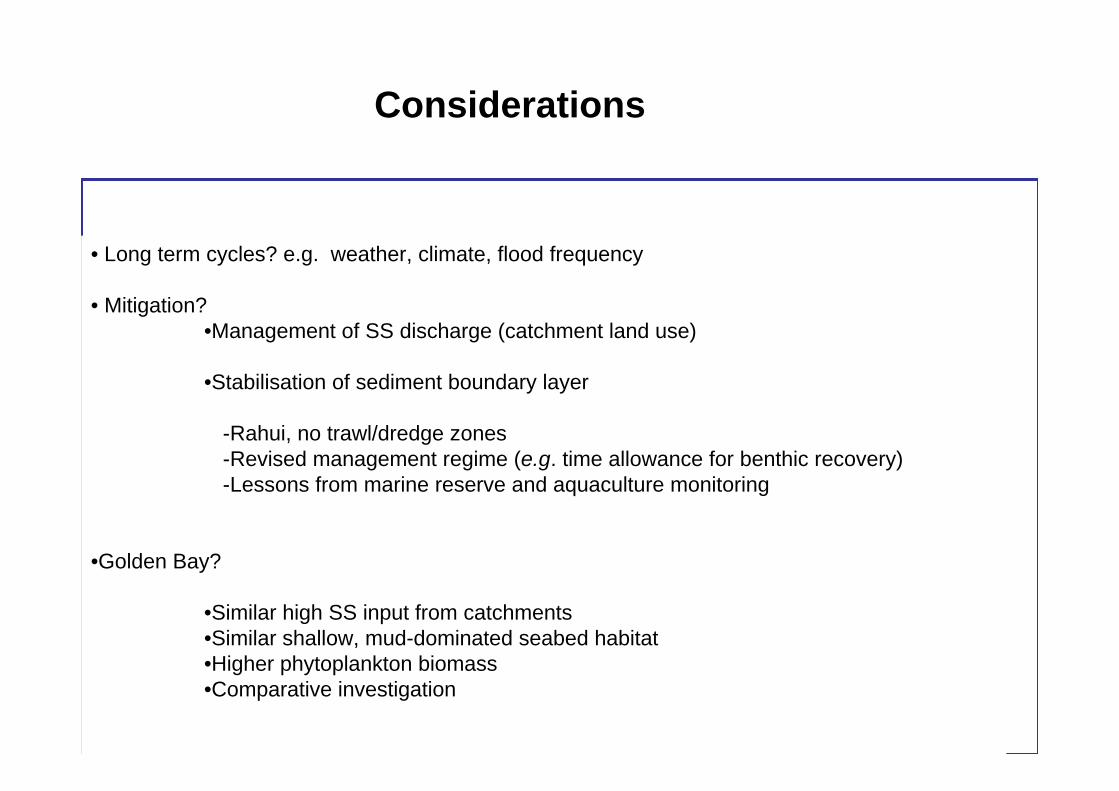
Considerations
• Long term cycles? e.g. weather, climate, flood frequency
• Mitigation? •Management of SS discharge (catchment land use)
•Stabilisation of sediment boundary layer
-Rahui, no trawl/dredge zones-Revised management regime (e.g. time allowance for benthic recovery)-Lessons from marine reserve and aquaculture monitoring
•Golden Bay?
•Similar high SS input from catchments•Similar shallow, mud-dominated seabed habitat•Higher phytoplankton biomass•Comparative investigation
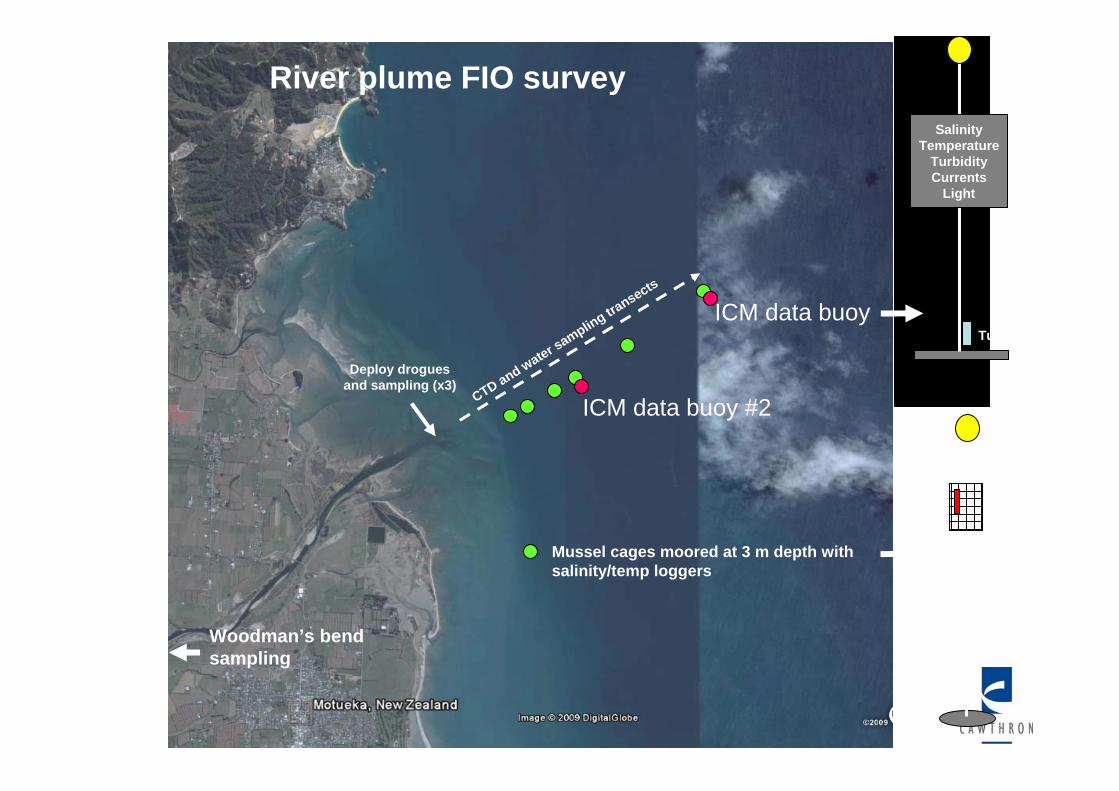
ICM data buoy
ICM data buoy #2
Mussel cages moored at 3 m depth with salinity/temp loggers
Deploy droguesand sampling (x3)
CTD and water sampling transects
Woodman’s bend sampling
River plume FIO surveySalinity
TemperatureTurbidityCurrents
Light
Turbidity
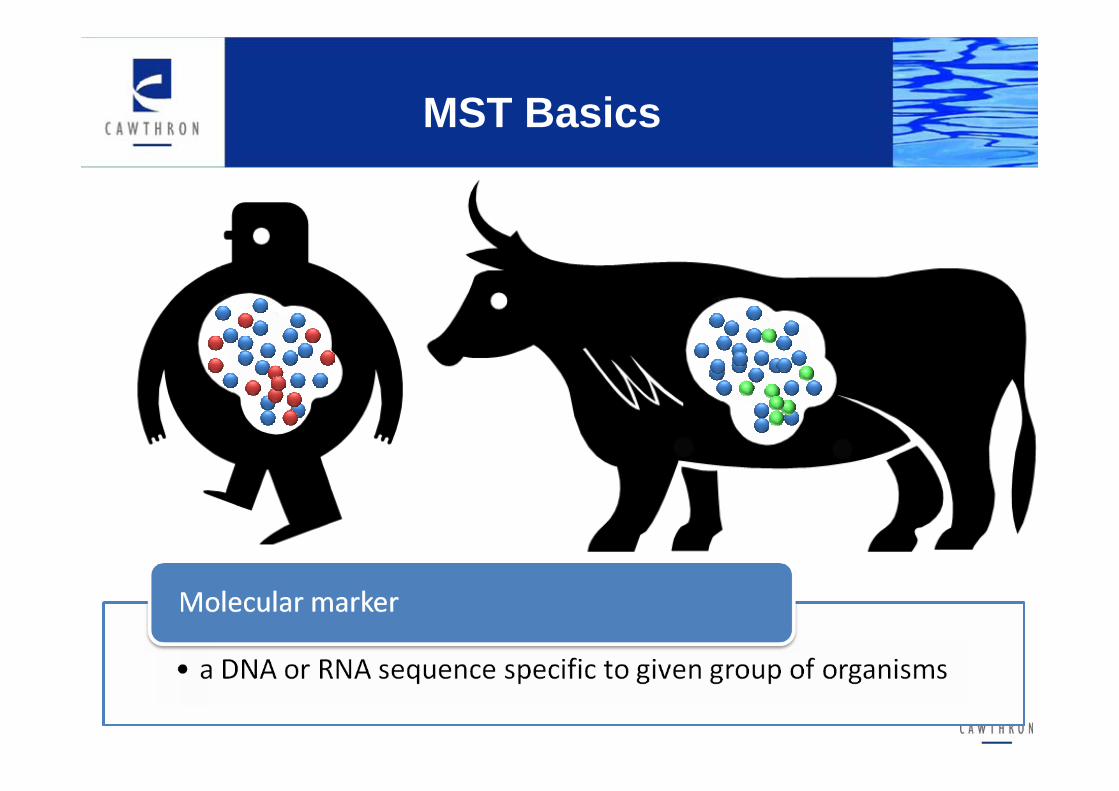
MST Basics
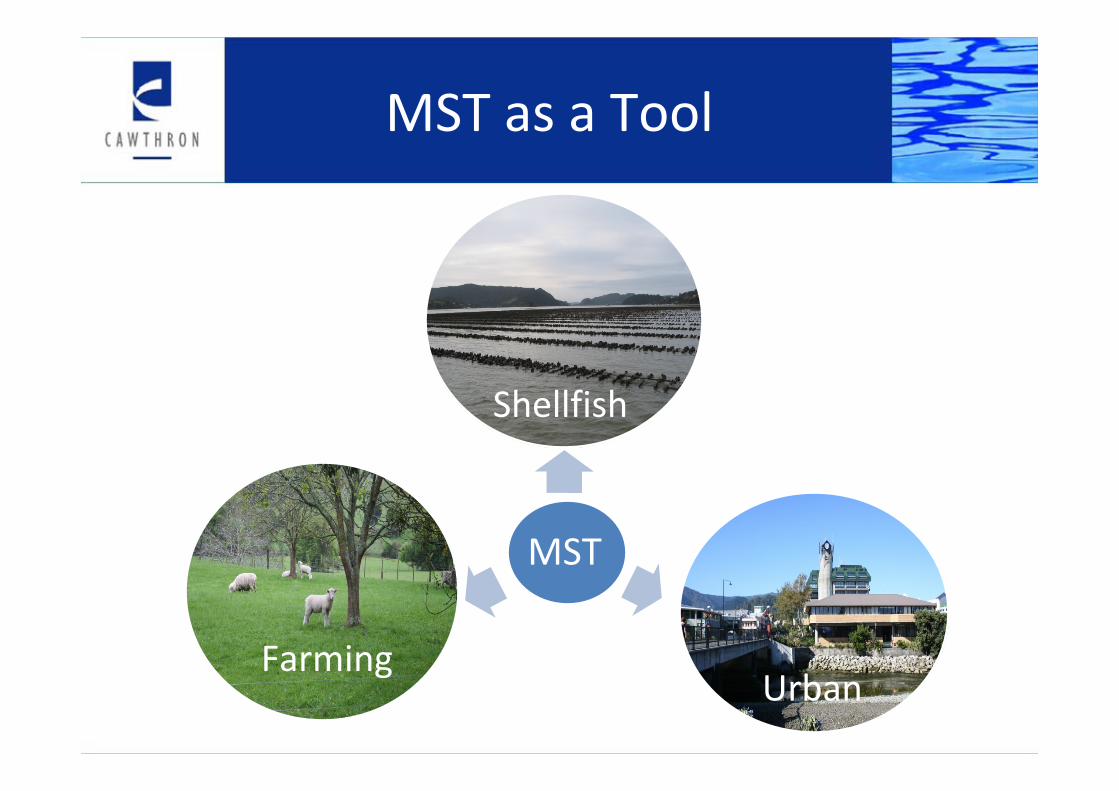
Farming
Shellfish
MST
Urban
MST as a Tool

17.12.07
17.12.07
31.03.08
31.03.08
31.03.08
19.12.07
31.03.08
17.12.07
31.03.0817.12.07
19.12.07
31.03.08 17.12.08
19.12.07
31.03.0817.12.07
General Bacteroides MarkerRuminant Bacteroides MarkerHuman Bacteroides MarkerHuman Enterococcus MarkerHuman Polyomavirus Marker
Water ColumnSediment Stormwater OutfallSaltwater Creek
Distribution of MST markers in the Maitai RiverDistribution of MST markers in the Maitai RiverDistribution of MST markers in the Maitai River