Embed Size (px)
Citation preview
The Mortality of our Public Men: Being a Study of the Mortality of the Presidents, VicePresidents, Senators and Representatives, of the United States Compared, with Insured Lives,and OthersAuthor(s): Irving FisherSource: Publications of the American Statistical Association, Vol. 15, No. 113 (Mar., 1916), pp.35-49Published by: American Statistical AssociationStable URL: http://www.jstor.org/stable/2965031 .
Accessed: 25/05/2014 06:13
Your use of the JSTOR archive indicates your acceptance of the Terms & Conditions of Use, available at .http://www.jstor.org/page/info/about/policies/terms.jsp
.JSTOR is a not-for-profit service that helps scholars, researchers, and students discover, use, and build upon a wide range ofcontent in a trusted digital archive. We use information technology and tools to increase productivity and facilitate new formsof scholarship. For more information about JSTOR, please contact [email protected].
.
American Statistical Association is collaborating with JSTOR to digitize, preserve and extend access toPublications of the American Statistical Association.
http://www.jstor.org
This content downloaded from 194.29.185.68 on Sun, 25 May 2014 06:13:00 AMAll use subject to JSTOR Terms and Conditions
35] The Mortality of Our Public Men. 35
THE MORTALITY OF OUR PUBLIC MEN.
Being a Study of the Mortality of the Presidents, Vice
Presidents, Senators and Representatives, of the United States Compared, with Insured Lives, and Others.*
By Irving Fisher, Professor of Political Economy, Yale University. Chair? man of the Hygiene Reference Board of the Life Extension Institute.
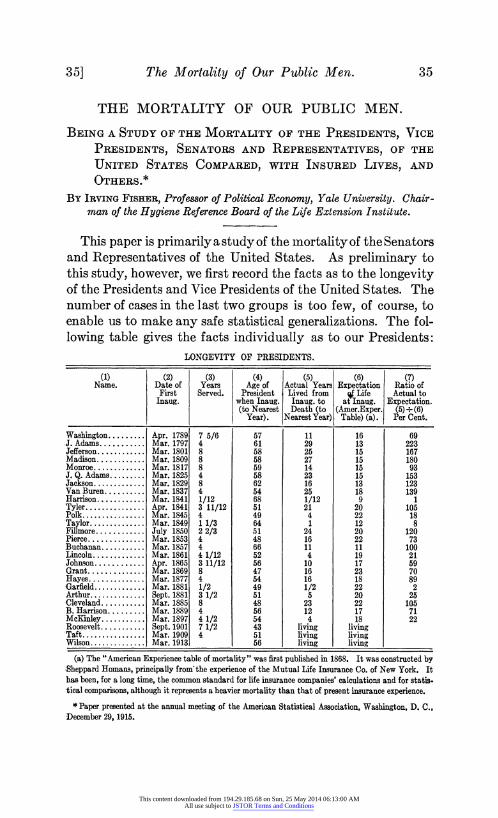
This paper is primarily a study of the mortality of the Senators and Representatives of the United States. As preliminary to this study, however, we first record the facts as to the longevity of the Presidents and Vice Presidents of the United States. The number of cases in the last two groups is too few, of course, to enable us to make any safe statistical generalizations. The fol?
lowing table gives the facts individually as to our Presidents:
longevity of presidents.
(i) Name.
(2) Date of First Inaug.
(3) Years Served.
Age of President
when Inaug. (to Nearest Year).
(5) Actual Years Lived from Inaug.to Death (to
Nearest Year)
T, (6) ? Expectation qfLife at Inaug.
(Amer.Exper. Table) (a).
(7) Ratio of Actual to
Expectation. (5)-K6) Per Cent.
Washington.. J. Adams.... Jefferson_ Madison_ Monroe. J. Q. Adams. Jackson. Van Buren.., Harrison_ Tyler. Polk. Taylor. Fillmore_ Pierce. Buchanan... Lincoln. Johnson. Grant. Garfield. Arthur. Cleveland... B. Harrison. McKinley... Roosevelt... Taft. Wilson.
Apr. 1789 Mar. 1797 Mar. 1801 Mar. 1809 Mar. 1817 Mar. 1825 Mar. 1829 Mar. 1837 Mar. 1841 Apr. 1841 Mar. 1845 Mar. 1849 July 1850 Mar. 1853 Mar. 1857 Mar. 1861 Apr. 1865 Mar. 1869 Mar. 1877 Mar. 1881 Sept. 1881 Mar. 1885 Mar. 1889 Mar. 1897 Sept. 1901 Mar. 1909 Mar. 1913
7 5/6 4
4 1/12 3 11/12 11/3 2 2/3 4 4 4 1/12 3 11/12 8 4 1/2 3 1/2 8 4 4 1/2 7 1/2 4
57 61 58 58 59 58 62 54 68 51 49 64 51 48 66 52 56 47 54 49 51 48 56 54 43 51 56
ll 29 25 27 14 23 16 25 1/12 21 4 1
24 16 ll 4 10 16 16 1/2 5 23 12 4
living living living
16 13 15 15 15 15 13 18 9
20 22 12 20 22 ll 19 17 23 18 22 20 22 17 18
living living living
167 180 93 153 123 139 1
105 18 8
120 73 100 21 59 70 89 2 25 105 71 22
(a) The "American Experience table of mortality" was first published in 1868. It was constructed by Sheppard Homans, principally from'the experience of the Mutual Life Insurance Co. of New York. It has been, for a long time, the common standard for life insurance companies' calculations and for statis? tical comparisons, although it represents a heavier mortality than that of present insurance experience. ?Paper presented at the annual meeting of the American Statistical Association, Washington, D. C.,
December 29,1915.
This content downloaded from 194.29.185.68 on Sun, 25 May 2014 06:13:00 AMAll use subject to JSTOR Terms and Conditions
36 American Statistical Association. [36
The longevity of each President is reckoned from the date of inauguration?that is, from the time of his first being Presi? dent. Thus Washington became President at 57 years of age when the "expectation" of life, according to the American
Experience table, was 16 years. He actually lived, however, only ll years instead of the 16. That is, he lived only 11/16, or 69 per cent., of his expectation. John Adams, on the other
hand, lived after inauguration 29 years, which was 2.23 times his expectation of 13 years.
Greatest Longevity.
John Adams (223) Madison (180) Jefferson (167) J. Q. Adams (153) Van Buren (139) Jackson (123) Fillmore (120)
Least Longevity.
Harrison (the first) (1) Garfield (2) Taylor (8) Polk (18) Lincoln (21) McKinley (22) . Arthur (25)
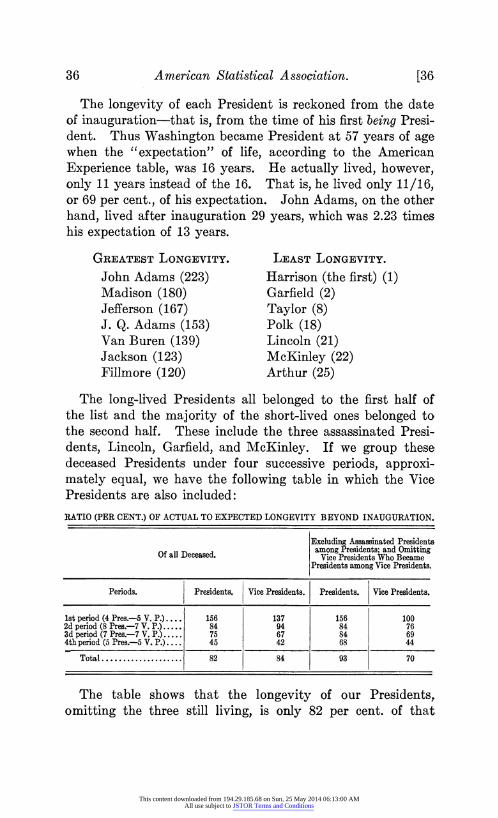
The long-lived Presidents all belonged to the first half of the list and the majority of the short-lived ones belonged to the second half. These include the three assassinated Presi?
dents, Lincoln, Garfield, and McKinley. If we group these deceased Presidents under four successive periods, approxi? mately equal, we have the following table in which the Vice Presidents are also included:
RATIO (PER CENT.) OF ACTUAL TO EXPECTED LONGEVITY BEYOND INAUGURATION.
Of all Deceased. Excluding Assassinated Presidents among Presidents; and Omitting Vice Presidents Who Became Presidents among Vice Presidents.
Periods. Presidents. Vice Presidents. Presidents. Vice Presidents.
1st period (4 Pres.?5 V. P.)_ 2d period (8 Pres.?7 V. P.). 3d period (7 Pres.?7 V. P.). 4th period (5 Pres.?5 V. P.)....
156 84 75 45
137 94 67 42
156 84 84
100 76
Total. 84 70
The table shows that the longevity of our Presidents, omitting the three still living, is only 82 per cent, of that
This content downloaded from 194.29.185.68 on Sun, 25 May 2014 06:13:00 AMAll use subject to JSTOR Terms and Conditions
37] The Mortality of Our Public Men. 37
"expected" according to the table, which, in turn, is less than that among insured lives of the present time. Even if we omit the assassinated Presidents, Lincoln, Garfield, and
McKinley, the longevity of the remainder is still only 93 per cent, of that expected by the American Experience table and less than two thirds the expectation of the insured lives of
today. We note also that the longevity of our Presidents seems to be diminishing with the increasing complexity of modern life in Washington. Their average longevity in the four successive periods was 156, 84, 75, and 45 per cent, respec? tively, or, omitting the assassinated Presidents, 156, 84, 84, and 68 per cent. We find the same apparent tendency among the Vice Presidents. It is also interesting to note that the Vice Presidents seem to live out a smaller fraction of their expectations than the Presidents, excluding the influ? ence of assassinations. This fact (if it be a significant fact rather than an accidental incident in so small a number of
lives) would suggest that the official social and convivial life at Washington is a greater life-shortener than the heavy re?
sponsibilities of office. The five Presidents of Yale University, for substantially
the same period as that of the above table, show a longevity equal to 137 per cent, of their expectations. The consistent
conformity of all the results to the hypothesis that a " simple"
life is a long life and that a "complex" life is a short one is at least striking.
But as already emphasized, the number of lives in all three lists (only 50 in all excluding duplications) is so small that any statistical conclusions whatever, without confirmatory evi?
dence, would be dangerous. We turn now from these preliminary remarks on Presidential
and Vice Presidential lives to the lives of our Congressmen? Senators and Representatives. Here, fortunately, we have
enough lives, about 7,500, to make the results of undoubted
significance. In this study I have been fortunate in having the assistance
of the New York Life Insurance Company to which I am indebted for its courtesy in permitting the clerical work to be done in its offices. I am also greatly indebted to Mr. Arthur
This content downloaded from 194.29.185.68 on Sun, 25 May 2014 06:13:00 AMAll use subject to JSTOR Terms and Conditions
38 American Statistical Association. [38
Hunter, its Actuary, for his assistance and criticism at every stage of the work.
The method employed has not been that of expected longev? ity used above, but that of expected mortality. This makes it possible to include the influence of the several thousand lives of the Congressmen still living. The mortality of the American Experience table was used here also as a standard of comparison, or measuring rod. Although, as already stated, this early table does not agree with the mortality experienced at present, either by the insurance companies of today* or
among the general public, it still serves as a convenient basis in terms of which any actual mortality may be expressed in
percentages, f The chief data for this investigation were obtained from the
Biographical Congressional Directory, and the necessary facts
relating to nearly 7,500 Congressmen were entered upon in? dividual cards. As the Congressional year dates from March
4, it was found convenient to carry the observations up to March 3, 1912, at which point they were closed.J
In order to discover the effect of Congressional life on
mortality, the following table was constructed:
* Modern experience averages about 25 per cent, less than the American Experience table. The con? trast is more marked for the earlier than for the older ages. t Thus if (for a particular year of age) the actual death rate is half the death rate expected (for that par?
ticular year of age) according to the American Experience table, and if the same were true for each other year of age, we would say that the actual mortality is half of the expected. Usually, of course, the ratios of actual to expected death rates will be somewhat different for different years of age. In that case an average of the different ratios, duly weighted, is struck. To take a specific example, we find that out of 398 Congressmen (entering the 15 Congresses ending March 3, 1911 and being 45 to 49 years of age on entering), the actual number who died in the second year after entering was 7 and the number expected to die out of 398 was, according to the American Experience table, 4.94. Therefore the ratio of actual to expected deaths (in this second year) was 7-4-4.94=1.41, or 141 per cent. In the same way, the number actually dying in the tenth year out of 275 then surviving was 3 as against 5.47 expected out of 275. The ratio of actual to expected is, in this case, 3-4-5.47, or 55 per cent. In this same way the actual and ex? pected deaths are taken, not only for the second and tenth years, but for each year involved, until all have passed from observation (either by death or by surviving to March 3,1912, at which date all observations closed). The average ratio for all these years is then found by dividing the total deaths (159) by the total of the expected (137). giving 159-4-137=1.16, or 116 per cent., as the ratio of actual to expected for the group of Congressmen in the entire category considered. J Except for the cases mentioned below, where the record was not complete, the investigation covered the
entire history from date of entering Congress until death, or until March 3,1912. The date of birth was required in order to determine the age on first entering Congress. For some Congressmen this information was not given in the Directory. The number of such cases was small (785) and sufficient accuracy was obtained by assuming that they entered at an average age. In other cases the Directory did not trace the history of the Congressman after his retirement from Congress. These cases were not large in number and were included in the investigation from the date of first entering Congress to the date of last retirement from Congress.
This content downloaded from 194.29.185.68 on Sun, 25 May 2014 06:13:00 AMAll use subject to JSTOR Terms and Conditions
-39] The Mortality of Our Public Men. 39
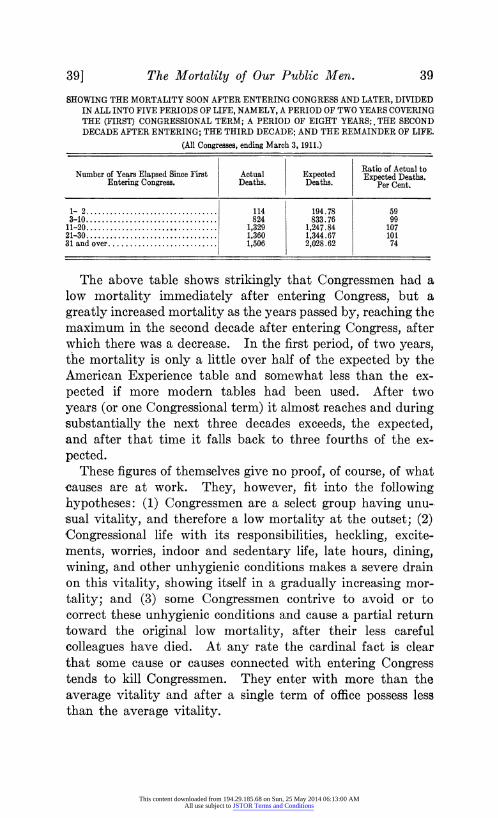
SHOWING THE MORTALITY SOON AFTER ENTERING CONGRESS AND LATER, DIVIDED IN ALL INTO FIVE PERIODS OF LIFE, NAMELY, A PERIOD OF TWO YEARS COVERING THE (FIRST) CONGRESSIONAL TERM; A PERIOD OF EIGHT YEARS;.THE SECOND DECADE AFTER ENTERING; THE THIRD DECADE; AND THE REMAINDER OF LIFE.
(All Congresses, ending March 3,1911.)
Number of Years Elapsed Since First Entering Congress.
Actual Deaths.
Expected Deaths.
Ratio of Actual to Expected Deaths.
Per Cent.
1- 2. 3-10. 11-20. 21-30. 31 and over.
114 824
1,329 1,360 1,506
194.78 833.76
1,247.84 1,344.67 2,028.62
107 101 74
The above table shows strikingly that Congressmen had a low mortality immediately after entering Congress, but a
greatly increased mortality as the years passed by, reaching the maximum in the second decade after entering Congress, after which there was a decrease. In the first period, of two years, the mortality is only a little over half of the expected by the American Experience table and somewhat less than the ex?
pected if more modern tables had been used. After two
years (or one Congressional term) it almost reaches and during substantially the next three decades exceeds, the expected, and after that time it falls back to three fourths of the ex?
pected. These figures of themselves give no proof, of course, of what
causes are at work. They, however, fit into the following hypotheses: (1) Congressmen are a select group having unu? sual vitality, and therefore a low mortality at the outset; (2) Congressional life with its responsibilities, heckling, excite?
ments, worries, indoor and sedentary life, late hours, dining, wining, and other unhygienic conditions makes a severe drain on this vitality, showing itself in a gradually increasing mor?
tality; and (3) some Congressmen contrive to avoid or to correct these unhygienic conditions and cause a partial return toward the original low mortality, after their less careful
colleagues have died. At any rate the cardinal fact is clear that some cause or causes connected with entering Congress tends to kill Congressmen. They enter with more than the
average vitality and after a single term of office possess less than the average vitality.
This content downloaded from 194.29.185.68 on Sun, 25 May 2014 06:13:00 AMAll use subject to JSTOR Terms and Conditions
40 American Statistical Association. [40
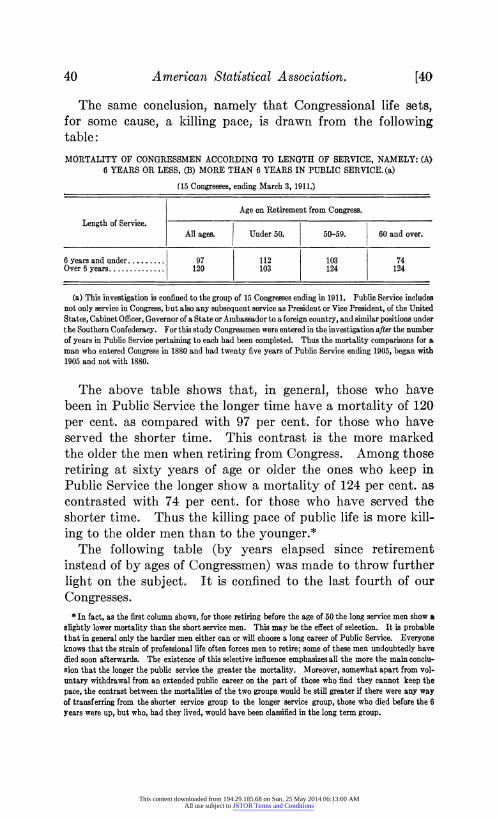
The same conclusion, namely that Congressional life sets, for some cause, a killing pace, is drawn from the following table :
MORTALITY OF CONGRESSMEN ACCORDING TO LENGTH OF SERVICE, NAMELY: (A> 6 YEARS OR LESS, (B) MORE THAN 6 YEARS IN PUBLIC SERVICE, (a)
(15 Congresses, ending March 3, 1911.)
Length of Service. Age on Retirement from Congress.
All ? Under 50. 50-59. 60 and over.
6 years and under. Over 6 years.
97 120
112 103
103 124
74 124
(a) This investigation is confined to the group of 15 Congresses ending in 1911. Public Service includes not only service in Congress, but also any subsequent service as President or Vice President, of the United States, Cabinet Officer, Governor of a State or Ambassador to a foreign country, and similar positions under t he Southern Confederacy. For this study Congressmen were entered in the investigation after the number of years in Public Service pertaining to each had been completed. Thus the mortality comparisons for a. man who entered Congress in 1880 and had twenty five years of Public Service ending 1905, began with 1905 and not with 1880.
The above table shows that, in general, those who have been in Public Service the longer time have a mortality of 120
per cent, as compared with 97 per cent, for those who have served the shorter time. This contrast is the more marked the older the men when retiring from Congress. Among those
retiring at sixty years of age or older the ones who keep in Public Service the longer show a mortality of 124 per cent, as contrasted with 74 per cent, for those who have served the shorter time. Thus the killing pace of public life is more kill?
ing to the older men than to the younger.* The following table (by years elapsed since retirement
instead of by ages of Congressmen) was made to throw further
light on the subject It is confined to the last fourth of our
Congresses. * In fact, as the first column shows, for those retiring before the age of 50 the long service men show a
slightly lower mortality than the short service men. This may be the effect of selection. It is probable that in general only the hardier men either can or will choose a long career of Public Service. Everyone knows that the strain of professional life often forces men to retire; some of these men undoubtedly have died soon afterwards. The existence of this selective influence emphasizes all the more the main conclu? sion that the longer the public service the greater the mortality. Moreover, somewhat apart from vol? untary withdrawal from an extended public career on the part of those who find they cannot keep the pace, the contrast between the mortalities of the two groups would be still greater if there were any way of transferring from the shorter service group to the longer service group, those who died before the 6 years were up, but who, had they lived, would have been classified in the long term group.
This content downloaded from 194.29.185.68 on Sun, 25 May 2014 06:13:00 AMAll use subject to JSTOR Terms and Conditions
41] The Mortality of Our Public Men. 41
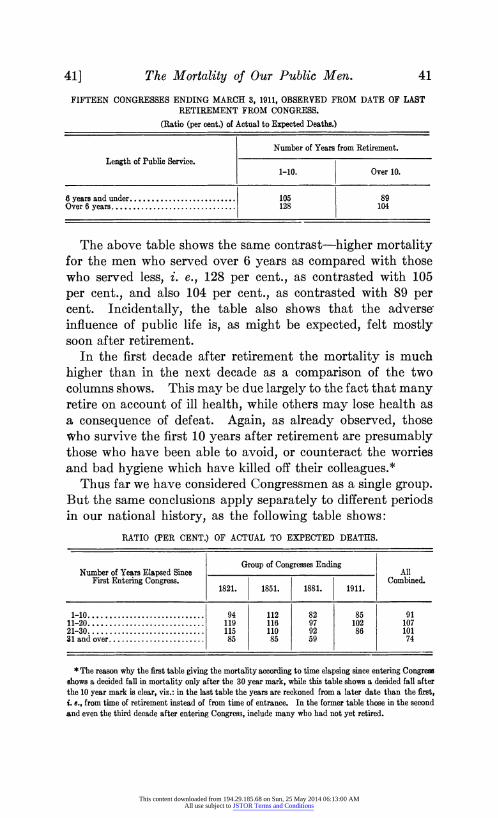
FIFTEEN CONGRESSES ENDING MARCH 3, 1911, OBSERVED FROM DATE OF LAST RETIREMENT FROM CONGRESS.
(Ratio (per cent.) of Actual to Expected Deaths.)
Length of Public Service. Number of Years from Retirement.
1-10. Over 10.
6 years and under. Over 6 years.,
105 128 104
The above table shows the same contrast?higher mortality for the men who served over 6 years as compared with those who served less, i. e., 128 per cent., as contrasted with 105
per cent., and also 104 per cent., as contrasted with 89 per cent. Incidentally, the table also shows that the adverse* influence of public life is, as might be expected, felt mostly soon after retirement.
In the first decade after retirement the mortality is much
higher than in the next decade as a comparison of the two columns shows. This may be due largely to the fact that many retire on account of ill health, while others may lose health as a consequence of defeat. Again, as already observed, those who survive the first 10 years after retirement are presumably those who have been able to avoid, or counteract the worries and bad hygiene which have killed off their colleagues.*
Thus far we have considered Congressmen as a single group. But the same conclusions apply separately to different periods in our national history, as the following table shows:
RATIO (PER CENT.) OF ACTUAL TO EXPECTED DEATHS.
Number of Years Elapsed Since First Entering Congress.
Group of Congresses Ending
1821. 1851. 1881. All
Combined.
1-10. 11-20. 21-30. 31 and over.
94 119 115 85
112 116 110 85
82 97 92 59
85 102
91 107 101 74
* The reason why the first table giving the mortality according to time elapsing since entering Congress flhows a decided fall in mortality only after the 30 year mark, while this table shows a decided fall after the 10 year mark is clear, viz.: in the last table the years are reckoned from a later date than the first, t. e., from time of retirement instead of from time of entrance. In the former table those in the second and even the third decade after entering Congress, include many who had not yet retired.
This content downloaded from 194.29.185.68 on Sun, 25 May 2014 06:13:00 AMAll use subject to JSTOR Terms and Conditions
42 American Statistical Association. [42
The first group consists of the Continental Congresses and the first 16 regular Congresses ending with March 3, 1821, and the other three groups, each of 15 Congresses, ending respectively March 3, 1851, 1881, and 1911. The individual cases were classified in the four groups according to the date of first enter?
ing Congress. It will be observed by following the eye down
any one of the columns of the table that the mortality always rises from the first to the second decade after entering Con?
gress and falls thereafter, especially from the third to the fourth decades.
The above table also affords an opportunity to compare one historical period with another, if the eye is run through it
horizontally instead of vertically. The most striking results of such comparisons are the lower mortality of the last two
groups of Congresses as compared with the first two. The low
mortality of the third group seems especially remarkable. For historical comparison, however, the best data are those
in which the mortality is presented by the attained ages of the
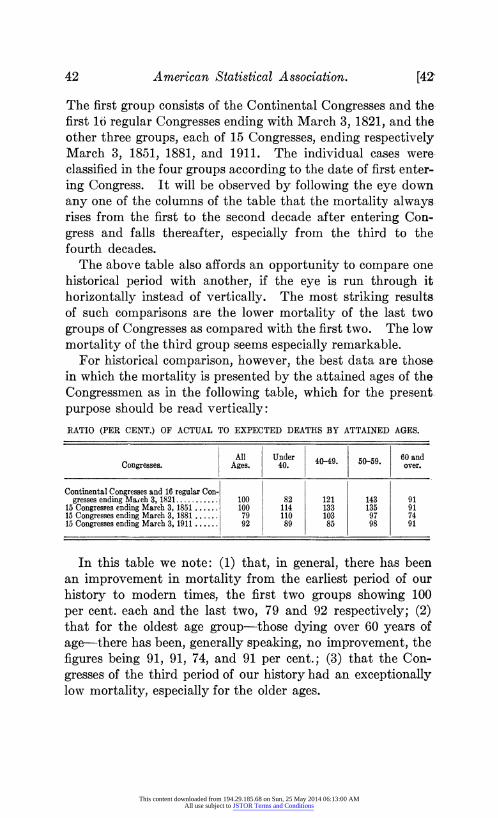
Congressmen as in the following table, which for the present purpose should be read vertically:
RATIO (PER CENT.) OF ACTUAL TO EXPECTED DEATHS BY ATTAINED AGES.
Congresses. All
Ages. Under 40. 40-49. 50-59. 60 and
over.
Continental Congresses and 16 regular Con? gresses ending Maich 3, 1821.
15 Congresses ending March 3, 1851. 15 Congresses ending March 3, 1881. 15 Congresses ending March 3, 1911.
100 100 79 92
82 114 110
121 133 103 85
143 135 97
91 91 74 91
In this table we note: (1) that, in general, there has been an improvement in mortality from the earliest period of our
history to modern times, the first two groups showing 100
per cent, each and the last two, 79 and 92 respectively; (2) that for the oldest age group?those dying over 60 years of
age?there has been, generally speaking, no improvement, the
figures being 91, 91, 74, and 91 per cent.; (3) that the Con?
gresses of the third period of our history had an exceptionally low mortality, especially for the older ages.
This content downloaded from 194.29.185.68 on Sun, 25 May 2014 06:13:00 AMAll use subject to JSTOR Terms and Conditions
43] The Mortality of Our Public Men. 43
It seems difficult to account for the exceptionally low mor?
tality in the group of Congresses from 1851 to 1881. Probably there are several reasons, such as: (1) the temporary with? drawal (about 1861-1867) of the Southern contingent of
Congressmen because of the Civil War (the insurance com?
panies have experienced a higher mortality in the South than in other sections of the country and the statistics given below show the same contrast for Congressmen); (2) the stricter standard of living which prevailed during war time; (3) the inclusion in Congress of a larger proportion of men of " plain living and high thinking" during the period of and following the Civil War. The last named factor may account for the
special superiority of the Congresses of the third period in
respect to the older ages at which time the "wear and tear" diseases chiefly enter into mortality.
As has been previously stated, the expected deaths in the tables of this paper have been calculated by the American
Experience table, which table shows a much higher death rate than is experienced by American insured persons at the present time. For instance, the present ratio of actual to expected deaths among the insurance companies of this country is about 75 per cent, of the American Experience table. Policy? holders, however, have passed a medical examination, which is not the case with Congressmen. It is necessary, therefore, to turn to some other records in order to determine approxi? mately what relationship to the American Experience table the mortality among Congressmen should have. In the Transactions of the Actuarial Society, Vol. X, there appears an
analysis by Mr. E. B. Morris of the mortality experienced among Yale graduates.*
In order that a more detailed comparison with the mor?
tality experience of Yale graduates may be made, the following tables have been prepared.
They show the mortality of Congressmen and the mortality of Yale graduates as compared with the American Experience table.
* The figures of Mr. Morris are, so far as I know, the only figures for any representative class of the population extending continuously from the eighteenth century through the nineteenth.
This content downloaded from 194.29.185.68 on Sun, 25 May 2014 06:13:00 AMAll use subject to JSTOR Terms and Conditions
44 American Statistical Association.
RATIO (PER CENT.) OF ACTUAL TO EXPECTED DEATHS.
[44
Groups.
Attained Ages.
All Under 40. 40-49. 50-59. 60 and
Over.
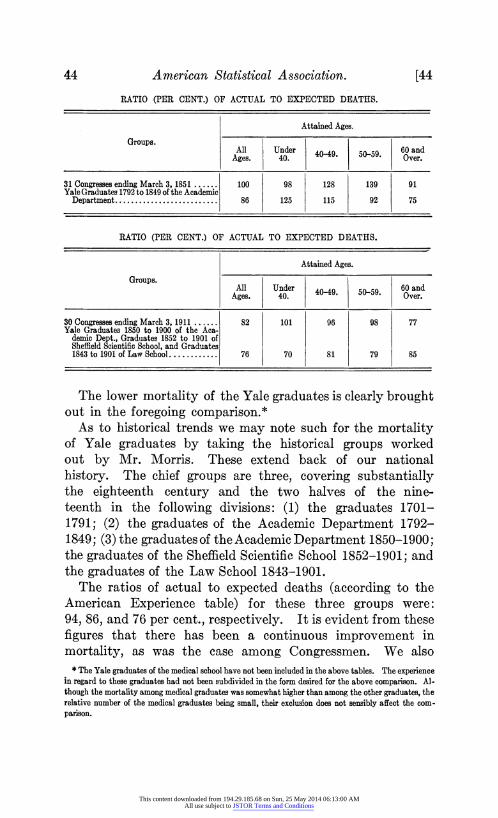
31 Congresses ending March 3, 1851. Yale Graduates 1792 to 1849 of the Academic Department.
100 125
128 115
139 92
91 75
RATIO (PER CENT.) OF ACTUAL TO EXPECTED DEATHS.
Groups. Attained Ages.
All Under 40. 40-49. 50-59. 60 and
Over.
30 Congresses ending March 3,1911. Yale Graduates 1850 to 1900 of the Aca? demic Dept., Graduates 1852 to 1901 of Sheffield Scientific School, and Graduates 1843 to 1901 of Law School.
82 101
70 81 79
77
85
The lower mortality of the Yale graduates is clearly brought out in the foregoing comparison.*
As to historical trends we may note such for the mortality of Yale graduates by taking the historical groups worked out by Mr. Morris. These extend back of our national
history. The chief groups are three, covering substantially the eighteenth century and the two halves of the nine? teenth in the following divisions: (1) the graduates 1701-
1791; (2) the graduates of the Academic Department 1792-
1849; (3) the graduates of the Academic Department 1850-1900; the graduates of the Sheffield Scientific School 1852-1901; and the graduates of the Law School 1843-1901.
The ratios of actual to expected deaths (according to the American Experience table) for these three groups were:
94, 86, and 76 per cent., respectively. It is evident from these
figures that there has been a continuous improvement in
mortality, as was the case among Congressmen. We also * The Yale graduates of the medical school have not been included in the above tables. The experience
in regard to these graduates had not been subdivided in the form desired for the above comparison. Al? though the mortality among medical graduates was somewhat higher than among the other graduates, the relative number of the medical graduates being small, their exclusion does not sensibly affect the com? parison.
This content downloaded from 194.29.185.68 on Sun, 25 May 2014 06:13:00 AMAll use subject to JSTOR Terms and Conditions
45] The Mortality of Our Public Men. 45
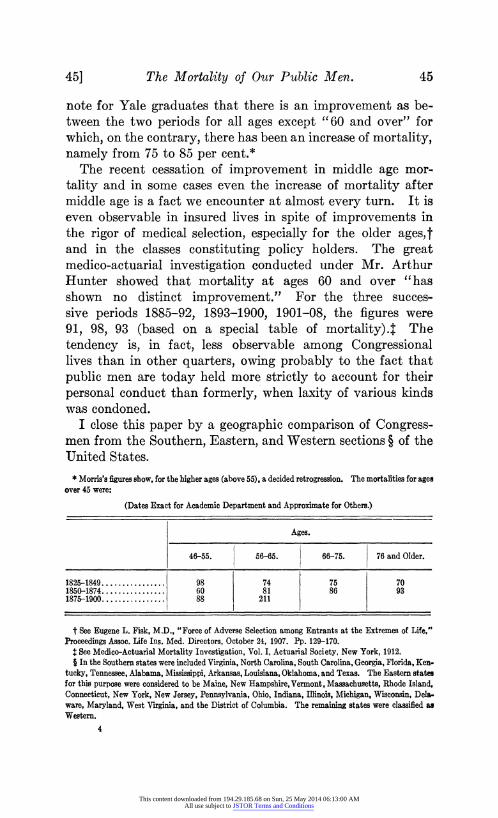
note for Yale graduates that there is an improvement as be? tween the two periods for all ages except "60 and over" for
which, on the contrary, there has been an increase of mortality, namely from 75 to 85 per cent.*
The recent cessation of improvement in middle age mor?
tality and in some cases even the increase of mortality after middle age is a fact we encounter at almost every turn. It is even observable in insured lives in spite of improvements in the rigor of medical selection, especially for the older ages,f and in the classes constituting policy holders. The great medico-actuarial investigation conducted under Mr. Arthur Hunter showed that mortality at ages 60 and over "has shown no distinct improvement/' For the three succes? sive periods 1885-92, 1893-1900, 1901-08, the figures were
91, 98, 93 (based on a special table of mortality).J The
tendency is, in fact, less observable among Congressional lives than in other quarters, owing probably to the fact that
public men are today held more strictly to account for their
personal conduct than formerly, when laxity of various kinds was condoned.
I close this paper by a geographic comparison of Congress? men from the Southern, Eastern, and Western sections ? of the United States.
* Morris's figures show, for the higher ages (above 55), a decided retrogression. The mortalities for ages over 45 were:
(Dates Exact for Academic Department and Approximate for Others.)
t See Eugene L. Fisk, M.D., "Force of Adverse Selection among Entrants at the Extremes of Life," Proceedings Assoc. Life Ins. Med. Directors, October 24, 1907. Pp. 129-170. t See Medico-Actuarial Mortality Investigation, Vol. I, Actuarial Society, New York, 1912. ? In the Southern states were included Virginia, North Carolina, South Carolina, Georgia, Florida, Ken?
tucky, Tennessee, Alabama, Mississippi, Arkansas, Louisiana, Oklahoma, and Texas. The Eastern states for this purpose were considered to be Maine, New Hampshire,Vermont, Massachusetts, Rhode Island, Connecticut, New York, New Jersey, Pennsylvania, Ohio, Indiana, Illinois, Michigan, Wisconsin, Dela? ware, Maryland, West Virginia, and the District of Columbia. The remaining states were classified as Western.
There
This content downloaded from 194.29.185.68 on Sun, 25 May 2014 06:13:00 AMAll use subject to JSTOR Terms and Conditions
46 American Statistical Association. [46
The results of this investigation based upon the group of 15
Congresses ending in 1911 are as follows: Ratio (per cent.) of Actual to Expected Deaths.
Southern. 100 Eastern. 93 Western. 80 All states. 92
The foregoing is in conformity with the experience of insur? ance companies?namely, that the Southern states have the
highest mortality, and the Western states the lowest, while the Eastern states represent about the average mortality throughout the United States.
The results of this investigation may be summarized in the
following statistical generalizations: 1. The mortality of Congressmen for the two years immedi?
ately after entering Congress has been low, being very much lower than that of the American Experience table and mate?
rially lower than the mortality of Yale graduates from 1792 on.
2. The mortality of Congressmen in the next eight years of life was much higher, being about equal to that of the Ameri? can Experience table and above the mortality of Yale gradu? ates. Again, their mortality in the next decade was still
higher. 3. Those Congressmen surviving beyond the second decade
showed, in turn, a much lower mortality. 4. Those Congressmen whose Public Service was only 6
years or less showed a materially lower mortality than those whose Public Service extended beyond 6 years.
5. The mortality of our modern Congressmen is in general lower than that of their predecessors.
6. This historical improvement in Congressional mortality is greatest for the younger ages?in accordance with the ob? servations on mortality of the general population.
7. For the ages "60 and above" there has been no improve? ment. This is also in accordance with observations on the
mortality of the general population.
This content downloaded from 194.29.185.68 on Sun, 25 May 2014 06:13:00 AMAll use subject to JSTOR Terms and Conditions
47] The Mortality of Our Public Men. 47
8. The Congressional mortality during and soon after the Civil War was exceptionally low.
9. This low mortality for the Civil War period was especially marked for the older ages.
10. The last five conclusions (as to historical changes in
mortality) are, in general, consonant with the results of the
investigations of Mr. E. B. Morris for Yale graduates. (In the case of Yale graduates the mortality at older ages has not
only not improved but has grown worse.) 11. Comparing the mortality of Southern, Eastern, and
Western Congressmen we find that of the Southerners was the highest and that of the Westerners the lowest, the figures being 100, 93, and 80 per cent, for the South, East, and West
respectively. In the above generalizations no mention has been made of
the mortality of Presidents and Vice Presidents. This seems to be high and to show a consistent progressive change for the
worse; but the number of lives available is so small, compared with the number of Congressmen considered, as scarcely to
justify independent generalizations. The foregoing generalizations merely give the facts as we
find them without reference to their interpretation.. The facts may seem to different people capable of different inter?
pretations. My own interpretation is one into which all the facts fit perfectly and which is also in tune with the results of E. B. Morris's investigations for Yale graduates and other
studies, such as certain investigations of the United, States Census and of the Life Extension Institute. This interpreta? tion is as follows:
(a) Presidents, Vice Presidents, and Congressmen are a. select group endowed at the outset with unusual vitality.
(b) The vitality of most of them is severely taxed and!
materially reduced by the heavy responsibilities and bad
personal hygiene incident to a public career.
(c) A minority escape the worst of these conditions and retain the major part of their natural endowment of vitality.
(d) Bad hygiene has been more destructive than the weight of responsibility. This conclusion is suggested by the fact that the Vice Presidents suffer a greater curtailment of life
This content downloaded from 194.29.185.68 on Sun, 25 May 2014 06:13:00 AMAll use subject to JSTOR Terms and Conditions
48 American Statistical Association. [48
than the Presidents, although Vice Presidents have far less
responsibility but spend much more time in Washington social life than the Presidents. It is also suggested by the fact that the Civil War period, with its greater weight of responsibility but more simple living, showed a lower mortality than the
periods preceding and following, with less weight of responsi? bility, but less simple living.
(e) Historically there has been a progressive decrease in those causes of death consisting of infections which kill their victims chiefly at the earlier ages, but a progressive change for the worse in those causes of death consisting of the wear and tear diseases (or degenerative diseases) which kill their victims
chiefly at the later years. These opposite changes in the infectious and degenerative diseases would explain the im?
provement in mortality at the earlier ages and, on the other
hand, the non-improvement (and in the case of the Yale
graduates even positive retrogression) in the mortality at the older ages; again they would explain the marked exceptionality of the older ages in the Civil War period; for if it was plain living which explained the low mortality of that period we should expect the most marked influence of this factor to
appear, just as it does, at the older ages at which the wear and tear mortality is chiefly registered.
(f) The chief causes of wear and tear on the lives of Con?
gressmen are the same as those applying to modern convivial
social life in general; they are the causes emphasized by the
Life Extension Institute which, through its Hygiene Reference
Board of hygienists and scientists, has described these causes
Sin its recent hand book "How to Live." The chief causes * emphasized are indoor and sedentary living, a crouching,
cramping posture, late dinners, overeating, especially of nitrog? enous foods, such as meat and eggs, overconcentration or
lack of bulk in diet, hasty eating, constipation, irregular
hours, lack of sleep, worry, and the use of drugs, especially nar?
cotics like alcohol and tobacco. In short, the chief reasons
why Congressmen shorten their lives are avoidable, being due, not so much to their work as to the kind of life into which
their work leads them.
This content downloaded from 194.29.185.68 on Sun, 25 May 2014 06:13:00 AMAll use subject to JSTOR Terms and Conditions
49] The Mortality of Our Public Men. 4&
The damage to vitality which we find from public life is not, therefore, put forward as an argument against entering public service; nor will a knowledge of the facts probably tend in that
direction, certainly not among those who place public interests above personal interests, as every public man should. But
knowledge is power and a knowledge of the facts should enable us to protect our public men or enable them to protect them?
selves, and to do so in the public interest. This can be accom?
plished by better general health conditions in the country and its Capital, by better health customs and habits, by better health ideals, and by a more systematic application of the
imperfect ideals already existing.
This content downloaded from 194.29.185.68 on Sun, 25 May 2014 06:13:00 AMAll use subject to JSTOR Terms and Conditions