Embed Size (px)
Citation preview
THE MORPHOLOGY OF EYEWALL CLOUD TO GROUND LIGHTNING IN TWO
CATEGORY FIVE HURRICANES
A THESIS SUBMITTED TO THE GRADUATE DIVISION OF THE UNIVERSITY OF HAWAI‘I IN PARTIAL FULFILLMENT OF THE REQUIREMENTS FOR THE
DEGREE OF
MASTER OF SCIENCE
IN
METEOROLOGY
DECEMBER 2006
By Kirt A. Squires
Thesis Committee:
Steven Businger, Chairperson Gary Barnes
Thomas A. Schroeder

ii
We certify that we have read this thesis and that, in our opinion, it is satisfactory in scope
and quality as a thesis for the degree of Master of Science in Meteorology.
THESIS COMMITTEE
______________________________
Chairperson
______________________________
______________________________

iii
ACKNOWLEGDEMENTS
I would like to thank Dr. Steven Businger for providing me with the chance to
conduct this research, and for all his help throughout the scientific and editorial
processes. I would also like to thank Drs. Gary Barnes and Tom Schroeder for the help
they provided during the editing process. Thanks also go to the
NOAA/AOML/Hurricane Research Division and NOAA/NWS/National Hurricane
Center for their efforts in the collection of the data used in this study. I would especially
like to thank John Gamache and Neal Dorst of HRD for their assistance in making the
aircraft radar and 1-second data available to us. I am grateful to Antti Pessi for his
technical assistance with the satellite image processing, and to Nancy Hulbirt for her
graphics expertise. TRMM satellite data have been provided by the TRMM Science Data
and Information System at the Goddard Space Flight Center, Greenbelt, Maryland. This
work was supported by the Office of Naval Research under grant number
N000140510551.
iv
ABSRACT
Data from the Long-Range Lightning Detection Network (LLDN), the Tropical
Rainfall Measuring Mission (TRMM) satellite, and reconnaissance aircraft are used to
analyze the frequency and location of cloud to ground lightning outbreaks in the eyewalls
of Hurricanes Rita and Katrina. Each hurricane produced eyewall lightning outbreaks
during the period of most rapid intensification, during eyewall replacement cycles,
and during the period that encompassed the maximum intensity for each storm.
The strike density (number of strikes per (100 km)2) ratio between the eyewall
region (0 – 50 km) and the outer rainband region (175 – 300 km) was 6:1 for Hurricane
Rita, and 1:1 for Hurricane Katrina. This result is in contrast to those of previous
remote lightning studies, which found that outer rainbands dominated the lightning
distribution. The differences are shown to be at least in part the result of the more limited
range of the National Lightning Detection Network (NLDN) data.
Within the effective range of the aircraft radar, maxima in eyewall strike density
were collocated with maxima in radar reflectivity. High lightning strike rates were also
reliably associated with TRMM low brightness temperatures and large Precipitation Ice
Concentration (PIC) product. The differences in storm structure and lightning strike
morphology between Hurricanes Rita and Katrina are documented. The implications of
the results for the use of LLDN lightning data to remotely examine changes in hurricane
intensity and structural evolution are discussed.
v
TABLE OF CONTENTS
Acknowledgements………………………………………………………………………iii
Abstract…...………………………………………………………………………………iv
List of Tables……………………………………………………………………………viii
List of Figures………………………………...…………………………………………..ix
Chapter 1: Introduction……………...................................................................................1
Chapter 2: Background…………………………………………………………………...5
2.1 Charge Separation…………………………………………………………..5
2.1.1 Inductive Charge Transfer………………………………………….5
2.1.2 Non-Inductive Charge Transfer…………………………………….6
2.2 Cloud to Ground Lightning…………………………………………………7
2.3 Hurricane Electrification……………………………………………………8
2.4 Previous Lightning Studies…………………………………………………9
2.4.1 Lightning Flash Density and Environmental Instability…………….9
2.4.2 Lightning Flash Density and Cloud Condensation Nuclei………...10
2.4.3 TRMM Measured Lightning Correlations…………………………10
2.5 In-situ Hurricane Studies………………………………………………….11
Chapter 3: Data and Methods……………………………………………………………13
3.1 LLDN………………………………………………………………………...13
3.2 TRMM……………………………………………………………………….14
vi
3.2.1 85 GHz……………………………………………………………..15
3.2.2 Precipitation Ice……………………………………………………15
3.3 Aircraft……………………………………………………………………….16
3.3.1 Radar…………………...…………………………………………..16
3.3.2 In-situ………………………………………………………………18
3.4 G.O.E.S………………………………………………………………………19
Chapter 4: Results………………………………………………………………………..20
4.1 Rita…………………………………………………………………………...20
4.1.1 Rapid Intensification Eyewall Lightning Outbreak...……………...21
4.1.2 Minimum Central Pressure Eyewall Lightning Outbreak...……….25
4.1.3 Inner Eyewall Lightning Outbreak…………………...………...….27
4.2 Katrina……………………………………………………………………….28
4.2.1 Rapid Intensification Eyewall Lightning Outbreak…………….....29
4.2.2 Inner Eyewall Lightning Outbreak………………………………...30
4.2.3 Minimum Central Pressure Eyewall Lightning Outbreak…………32
Chapter 5: Summary and Conclusions……………………….………………………..…36
5.1 Comparison between Hurricane Rita and Katrina………….………………..36
5.2 Lightning, Radar Reflectivity, and TRMM………………………………….37
vii
Chapter 6: Discussion…………………………………………………………………...40
6.1 Impact of a Coastal Proximity Limitation…………………….…………….40
6.2 Implications for Lightning Strike Morphology……………………………...42
6.3 Applications of LLDN Lightning Data to Hurricanes……………………….43
References………………………………………………………………………………..71

viii
LIST OF TABLES
Table Page
1. Comparing the results found by Molinari et al. (1999)
with the results found in this study………………………………………………45
ix
LIST OF FIGURES
Figure Page
1. A map of the model derived detection efficiency contours (%) for the
Gulf of Mexico region, with Hurricane tracks…………………………………...46
2. Radial distribution of lightning flash density for Hurricane Rita
between 20 September 1800 UTC and 23 September 0900 UTC………………47
3. Time series containing the number of cloud-to-ground flashes within
50 km of the center of Hurricane Rita, and minimum central pressure………….48
4. NOAA P-3 lower fuselage radar reflectivity of Hurricane Rita taken
on 21 September…………………………………………………………………49
5. Vertical reflectivity profile (VRP) composites created by the
NOAA P-3 aircraft tail radar on 21 September…………………………….........50
6. TRMM data collected as the satellite passed over the center of
Hurricane Rita at 1540 UTC……………………………………………………..51
7. TRMM data collected as the satellite passed over the center of
Hurricane Rita at 0810 UTC……………………………………………………..51
x
8. NOAA P-3 lower fuselage radar reflectivity of Hurricane Rita
on 22 September…………………………………………………………………52
9. Vertical reflectivity profile composites of Hurricane Rita created by the
NOAA P-3 aircraft tail radar on 22 September………………………………….53
10. TRMM data collected as the satellite passed over the center of
Hurricane Rita on 22 September…………………………………………………54
11. NOAA P-3 lower fuselage radar reflectivity of Hurricane Rita
on 22 September…………………………………………………………………55
12. Vertical reflectivity profile composites of Hurricane Rita created by the
NOAA P-3 aircraft tail radar on 22 September………………………………….56
13. Aircraft Derived Tangential winds as measured at flight level……………………57
14. Radial distribution of the total number of detected lightning flashes
for Hurricane Katrina…………………………………………………………….58
15. Time series containing the number of cloud-to-ground flashes within
50 km of the center of Hurricane Katrina, and minimum central pressure………59
xi
16. 85-GHz TRMM image taken of Hurricane Katrina on 27 August.
GOES-12 infrared satellite image taken at 0345 UTC 27 August…………...…..60
17. TRMM layer 12 (8 – 10 km) PIC image of Hurricane Katrina on
27 August………………………………………………………………………...61
18. Aircraft measured tangential winds in the Hurricane Katrina
on 27 August………………………………………………………………….….62
19. NOAA P-3 radar reflectivity for Hurricane Katrina for 27 August
GOES-12 infrared satellite image of Hurricane Katrina
taken on 27 August………………………………………………………………63
20. TRMM image for Hurricane Katrina on 27 August. 85-GHz TMI image
and layer 12 (8 – 10 km) PIC values……………………………………………..63
21. TRMM image for Hurricane Katrina on 28 August. 85-GHz TMI image
and layer 12 (8 – 10 km) PIC values……………………………………………..64
22. NOAA P-3 lower fuselage radar reflectivity of Hurricane Katrina
on 28 August while the aircraft was near storm center…………………………..65
xii
23. Vertical reflectivity profile (VRP) composites created by the
NOAA P-3 aircraft tail radar on 28 August………………………………….......66
24. TRMM image for Hurricane Katrina on 28 August. 85-GHz TMI image
and layer 12 (8 – 10 km) PIC. GOES-12 Infrared satellite image
taken of Hurricane Katrina on 28 August………………………………………..67
25. A vertical profile of the tangential wind of a radial pass through
eyewall of Hurricane Katrina…………………………………………………….68
26. PIC pixel values for two separate TRMM passes during Hurricane Rita………….69
27. Volume plot of the radial distribution of lightning flash density
in Hurricane Rita……………………………………………………....................70
1
CHAPTER 1. INTRODUCTION
It has been shown that the convective structure of the eyewall of a mature hurricane
can provide valuable information about changes in storm intensity (Jorgensen 1984;
Black et al. 1986, 1994; Marks 1985; Heymsfield et al. 2001). Marks (1985) showed that
intensification of a hurricane could be represented by a contraction of the eyewall, as well
as by an increase in the strength of the convection within the eyewall. Black et al. (1994)
also witness a strengthening and deepening of the convection contained with in the
eyewall of Hurricane Emily (1987) as the hurricane intensified. Heymsfield et al. (2001)
also showed that the development of mesoscale regions of intense convection within the
eyewall of a mature hurricane could cause significant intensity changes. Thus, it has
become of interest to hurricane forecasters and researchers alike, to develop various
methods that would allow the continuous examination of the structural evolution of the
eyewall within hurricanes.
The lightning flash rates produced by a convective system are positively correlated
with the convective strength of that system (Orville and Vonnegut 1974; Orville et al.
1983; Williams et al. 1992). The earlier study by Orville and Vonnegut (1974) examined
scanned photographs of lighting flashes provided by Defense Meteorological Satellite
Program (DMSP) in order to derive the lightning flash frequencies of specific convective
systems. The more recent studies by Orville et al. (1983) and Williams et al. (1992) both
used a network of direction finding sensors that were able to detect the cloud to ground
lightning strikes produced by convective systems. Williams et al. (1992) also analyzed
the individual convective systems using vertical reflectivity profiles provided by a ground
based radar; concluding that as convective systems become more vigorous, their cloud to
2
ground strike rates increase. These findings have been further supported by various other
studies and therefore it has been suggested that it is possible to examine the development
and evolution of a convective system by examining its lightning strike morphology
(Orville et al. 1983; Williams et al. 1992). Thus the examination of eyewall convection
with the use of remote lightning data would be possible.
Molinari et al. (1994, 1999) examined the convective structure of hurricanes through
the use of remote lightning detection. The study also looked for links between eyewall
structure, inferred from the remote lightning data, and changes is storm intensity.
Molinari et al. (1999) used lightning data provided by the National Lightning Detection
Network (NLDN) to examine the hourly cloud to ground lightning evolution in nine
Atlantic hurricanes, three of which were previously studied by Lyons and Keen (1994).
He concluded that mature TCs could be divided into three regions with respect to
lightning strike density (defined as the number of measured cloud to ground strikes per
unit area per time). The greatest strike density was contained within the outer rainband
region, beginning ~140 km from storm center and continuing outward. The eyewall
region, 0 - 60 km from storm center, contained a secondary maximum in strike density,
which was approximately 3 to 6 times less than that of the outer rainband region. The
minimum in strike density was found in the inner rainband region, this region was
defined as 60 - 140 km outward from storm center. These three regions defined by
lightning strike density in Molinari et al. (1999) are comparable with the three convective
regions of a mature TC described by Jorgensen (1984); in particular, (i) the eyewall
region, an area of outward-sloped convection that surrounds the eye and contains
moderate vertical velocities (~ 4 - 6 m s-1), (ii) the stratiform region, which is located just
3
outward of the eyewall and contains little active convection and weak vertical velocities,
and (iii) the rainband region, which is characterized by the variable nature of the
reflectivity and vertical velocity profiles.
Molinari et al. (1999) also concluded that moderate and intense hurricanes
(maximum sustained winds > 41 m s-1) contained less cloud to ground eyewall lightning
when compared to weak hurricanes (maximum sustained winds 32 – 35 m s-1). Moderate
and strong hurricanes contained < 30 strikes day-1 within 60 km of storm center, with
eyewall lightning only occurring in 7% of hourly periods and never occurring for longer
than a 5-h period. Molinari et al. (1999) also showed that eyewall lightning outbreaks
frequently accompany eyewall replacement cycles, as well as periods of intensification.
Cecil et al. (1999) conducted a study of three TCs using lightning data provided by
the Optical Transient Detector (OTD) aboard the polar orbiting satellite Pegasus. Cecil et
al. (2002a, b) used the TRMM mounted Lightning Imaging Sensor (LIS) to study 261
TRMM satellite overpasses of 45 TC’s. The OTD and LIS instruments were able to
detect the total number of lightning flashes (defined as both intra-cloud lightning flashes
and cloud to ground strikes), and operated with a detection efficiency of 60% and 90%
respectively. Cecil et al. (1999, 2002a, b) found a radial distribution similar to Molinari
et al. (1999), in which there were lightning flash density (defined as, the total number of
lightning flashes per area per time) maxima in the eyewall region and outer rainband
region, with a distinct flash density minima located within the inner rainband region.
However, Cecil et al. (1999, 2002a,b) found that the ratio of flash densities between the
eyewall region and outer rainband region was closer to 1:1, not 1:3-6 as found by
Molinari et al. (1999).
4
The detection efficiency of the NLDN is very sensitive to the distance of a lightning
strike from the network sensors; as the distance increases the detection efficiency
decreases. As a result previous researchers using NLDN data limited their analysis of
lightning data to times when TCs centers were within 400 km of at least two direction-
finding (DF) sensors (e.g., Molinari et al. 1994, 1999; Samsury and Orville 1994). This
limitation made it impossible to examine any lightning data while the TCs of interest
were located over the open ocean, and may have resulted in inaccurate conclusions about
the spatial evolution of cloud to ground lightning strikes produced by TCs.
In this study, data from the Long-Range Lightning Detection Network (LLDN) are
compared with convective precipitation and precipitable ice derived from aircraft radar
and TRMM data in the eyewall regions of two category five hurricanes. The overarching
goal of this work is to determine the utility of continuous LLDN data to remotely infer
the evolution of the convective structure of hurricane eyewalls.
5
CHAPTER 2. BACKGROUND
2.1 Charge Separation
The theories regarding the various methods of charge separation within the
atmosphere are still very exploratory. While different methods of charge separation are
known to occur, their order of importance for inducing cloud electrification is not well
understood. There are two main methods of charge separation; inductive (IC) and non-
inductive charge separation (NIC).
2.1.1 Inductive Charge Transfer
IC can only occur when there is a background electric field within the region of
cloud in which the transferring particles are located. There are two main methods of IC
transfer, drop breakup and particle rebound. The Earth’s natural electric field causes a
dominant initial electric field within the cloud that is usually positive above negative at
all altitudes above the freezing mark. This electric field causes the bottom of a droplet to
become positive and the top of the droplet to become negative. Drop breakup IC occurs
when the environmentally induced charge separation within a droplet is redistributed
when the droplet breaks up. The cause of the droplet breakup is usually due to the
collision and coalescence process occurring within clouds.
Particle rebound takes place when a smaller particle collides with the bottom of a
larger particle due to differential fall velocities. A portion of the positive charge on the
bottom of the large droplet will be lost and transferred to the smaller droplet. For both
drop breakup and particle rebound the charge separation within the cloud comes as a
result of the redistribution of the differing charged particles via gravitational separation
6
(Beard 1986). The smaller particles have slower fall velocities, and as a result are carried
higher into the cloud. This causes the top of the cloud to become positively charged
while the larger, negatively charged particles collect at the bottom of the cloud causing it
to become negatively charged.
2.1.2 Non-Inductive Charge Transfer
NIC transfer does not need a pre-existing environmental electric field in order to
operate. There are three main methods of NIC transfer, thermoelectric effect, contact
potential effect, and freezing drop breakup (Pruppacher and Klett 2000).
The thermoelectric effect states that a collision by two particles of different
temperatures will cause a temperature gradient across the particles. This temperature
gradient causes an ion gradient and a resultant electric field across the particles. Large
objects, such as hail will be frozen, while smaller particles may remain in liquid phase
(i.e. supercooled water). A collision between the two would tend to cause the colder
particle to acquire a negative charge, while the small particle would acquire a positive
charge.
Contact potential effect requires the collision of two particles, which have
differing electric surface potential. The difference in surface potential of the two
particles would then attempt to equalize by transferring charges between particles.
Contact potential varies such that it becomes more negative with as temperature
decreases, and riming increases. Thus a collision between a rimed ice particle and ice
crystal would cause negative charge transfer to the rimed particle and positive charge to
the smaller ice crystal (Saunders 1995).
7
When a droplet begins to freeze the outer ice shell of the droplet is positively
charged, while the main inner core is negatively charged. If the droplet fractures during
freezing, the main core of the particle will remain negatively charged, and the ice
splinters associated with the outer shell will remain positively charged. For all 3 of the
NIC mechanisms, separation of the unlike charged particles by gravity and or updrafts
and downdrafts, create the electric field within the cloud. The smaller particles tend to
acquire a positive charge and the larger particles acquire a negative charge, therefore the
bottom of the cloud becomes negatively charged, and the top becomes positively charged.
2.2 Cloud to Ground Lightning
When charge separation occurs within a cloud it creates an electric field. The
structure of the electric field can change drastically for various reasons, however the most
commonly understood electric field that occurs in most thunderstorms is a vertical dipole.
This occurs when charge particles become vertically separated by gravity, updrafts
downdrafts, for example, and create a volume of one charge above another volume of
opposing charge. It has now been measured that thunderstorms that contain extremely
high vertical velocities can have electric fields that are tri- or quad-poles (Black and
Hallett 1999). Besides the electric field that is created within the thunderstorm, there is a
dipole induced between the lower part of the cloud and the ground. When the strength of
the dipole between the cloud and ground reaches a limit, a value known as dielectric
breakdown, it is possible for a cloud to ground lightning strike to occur. Uman (1987)
showed that each cloud to ground lightning strike requires a charge separation of ~ 10
coulombs per strike, or several strikes and lower tens of coulombs.
8
2.3 Hurricane Electrification
Charge separation and the resulting dipole orientation depend on many different
characteristics of the convective system of interest, such as updraft strength, liquid and
ice water concentrations, and temperature. Therefore it is a good idea to discuss the
electrification of hurricanes in particular and not just convection in general.
Black and Hallett (1999) examined the electrification and hydrometeor
characteristics within Hurricane Claudette (1991) and Hurricane Tina (1992) using an
array of field mills mounted on the WP-3D aircraft. As the aircraft penetrated through
the TCs, the field mill array was able to measure the strength and the polarity of the
electric field at that particular flight level. Detailed measurements of hydrometeor size,
concentration, and state (liquid or solid) were also recorded along the flight path using
two-dimensional optical array probes, a forward scattering-spectrometer, and a liquid
water meter. Radial flight penetrations were completed at various altitudes between 4.5
km and 7 km. All flight levels recorded a positive vertical electric field (no charge or
positive charge below the aircraft with negative charge above the airplane) nearly all the
time, with negative (negative charge below the aircraft with no charge of positive charge
above the airplane) vertical electrical fields recorded only while the plane passed through
weak downdrafts around the melting level. The strongest vertical electric fields
measured within the eyewall measured ~ 17 - 24 kV m-1, and were approximately 3-5
times weaker than those measured in continental thunderstorms (Marshall et al. 1995).
The peaks in electric field within the eyewall were collocated with strongest updraft
velocities and highest super-cooled water concentration. Black and Hallett (1999)
concluded that the large amount of ice produced within the eyewall of a mature hurricane
9
would act to nucleate and freeze much of the liquid water content (LWC) that is present
above the 0°C isotherm. This process would result in little super-cooled water droplets
within the eyewall, which are needed for charge separation within clouds (Ziv and Levin
1974; Takahashi 1978; Saunders et al 1991). Therefore Black and Hallett (1999) suggest
that lightning outbreaks within the eyewall are rare, especially when compared to
continental convection.
2.4 Previous Lightning Studies
2.4.1 Lightning Flash Density and Environmental Instability
Lightning strike rates for a particular convective system are closely related to the
magnitude of the updrafts and the vertical development of the convective system, as well
as the concentration of ice-phase precipitation produced by the convective system
(Williams et al. 1992). These three properties of a convective system can be largely
dependent on the amount of convective available potential energy (CAPE) within the
environment of a convective system. Williams et al. (1992) concluded that higher CAPE
values resulted in more intense convection, as denoted by greater radar reflectivity values
extending above the melting level, which signify greater concentrations of ice-phase
precipitant. These high concentrations of ice-phase precipitant are needed in order to
separate enough charge in order to produce lightning within the storm (Ziv and Levin
1974). Thus, intense convection that is formed within high CAPE environments will also
produce more lightning strikes per area when compared to weaker convection (Williams
et al. 1992).
10
2.4.2 Lightning Flash Density and Cloud Condensation Nuclei
The concentration of ice-phase precipitant is also dependent on the concentration of
cloud condensation nuclei (CCN) present within the environment. CCN aid in the
formation of ice-phase precipitant through heterogeneous nucleation processes, therefore
atmospheric environments which contain higher concentrations of CCN also usually
contain higher concentrations of ice-phase precipitant (Sherwood, 2002). Toracinta and
Cecil (2001) determined that continental regions contained the highest concentrations of
CCN, with the lowest concentrations found over open ocean regions. This variance in
microphysical structure has been shown as one cause for higher concentrations of ice-
phase precipitant over continental regions and lower concentrations over open ocean
regions (Sherwood 2002). This variance in ice-phase precipitant between continental
regions and open ocean regions were also speculated as one of the reasons lightning flash
densities are generally higher over continental regions (Cecil et al. 2002a, b).
2.4.3 TRMM Measured Lightning Correlations
Cecil et al. (2002a, b) and Nesbitt et al. (2000) used the Tropical Rainfall Measuring
Mission (TRMM)-based microwave imager (TMI) and lightning imaging sensor (LIS) to
examine the intensity of convective areas; they found that the greatest lightning flash
densities are recorded over continents, consistent with the fact that solar heating of the
land produces higher values of CAPE. Convective systems over the open ocean are
usually weaker than their continental counterparts because of lower CAPE values (Zipser
and LeMone 1980; Jorgensen et al. 1985; Jorgensen and LeMone 1989), and as a result
11
yield much lower lightning flash rates (Zipser 1994; Cecil and Zipser 1999; Cecil et al.
2002 a and b; Nesbitt et al. 2000).
2.5 In-situ Hurricane Studies
Gray (1965), Jorgensen et al. (1985), and Black et al. (1994) used aircraft-measured
vertical velocities to study the size and intensity of convective cores within the eyewall of
mature hurricanes. A study of three mature hurricanes concluded that the mean vertical
velocity within the eyewall was 4 m s-1 with an average updraft and downdraft diameter
of 2.5 km (Gray 1965). Jorgensen et al. (1985) recorded vertical velocities during a total
of 115 aircraft penetrations of 4 mature hurricanes, finding the average updraft velocity to
be ~ 4 - 5 m s-1 at 5 km. Black et al. (1994) found similar results for Hurricane Emily of
1987; however Black et al. (1994) measured strong updrafts (> 20 m s-1) during a time
when Hurricane Emily underwent a period of rapid intensification. Using aircraft
Doppler radar to derive vertical velocities in hurricanes, Black et al. (1996) found that
70% of the hurricane eyewall penetrations contained updrafts < 2 m s-1, with ~5%
containing vertical velocities >5 m s-1. The typical vertical velocities found in the
eyewalls of a mature hurricanes are therefore relatively weak when compared to
continental thunderstorms, which can have updrafts >30 m s-1. These small updraft
velocities have been related to the lack of CAPE within the eyewall region of mature
hurricanes (Bogner et al. 2000; Emanuel 1986). As a result, lightning outbreaks within
the eyewall of mature hurricanes should be a rare event compared to continental
convective systems. However, strong convective updrafts, which may occur during rapid

12
intensification events, as studied by Black et al. (1994), could contain vertical velocities
that are strong enough to produce eyewall lightning outbreaks.
13
CHAPTER 3. DATA AND METHODS
3.1 LLDN
The lightning data used in this study were obtained from the archives of the long-
range National Lightning Detection Network (LLDN) operated by the Vaisala
Thunderstorm Group (Cummins et al., 1998, 1999; Cramer and Cummins 1999;
Demetriades and Holle 2005). First implemented in 1996, the LLDN initially comprised
all the sensors in the U.S. National Lightning Detection Network (NLDN) (Orville et al.
2002). In 1998, the coverage, detection efficiency, and location accuracy were all
improved with the addition of sensor information from the Canadian Lightning Detection
Network (CLDN). At the time of the two hurricanes used in this study (2005), the LLDN
comprised 187 sensors (Cummings, 2006).
The LLDN detects very low frequency (VLF) electromagnetic waves reflected from
the ionosphere to determine lightning strike locations. The range of the LLDN data used
in this study is an order of magnitude greater than that of the NLDN data used in previous
hurricane studies (Samsury and Orville 1994; Molinari et al. 1994, 1999), allowing for a
more complete documentation of the lightning evolution in Hurricanes Rita and Katrina.
As a result of the reversal of the polarity of the signal with each ionospheric reflection,
this method of detection makes it impossible to determine the strike polarity. The
network also suffers in a small region just north of Cuba, where linear bands of false
strikes appear. These linear patterns were also observed in previous lightning studies
(Molinari et al. 1994, 1999) and are explained in more detail by Molinari et al. (1999).
The detection efficiency of the network depends on the strike strength, its distance
from the network, and time of day (Cummins 2006) (Fig. 1). Strong strikes (greater than
14
30-kA peak current) and strikes that are close to the network are detected more
efficiently. Also, there is a diurnal variation in detection efficiency as a result of the VLF
detection method and ionospheric dynamics, with the detection efficiency being greater
during nighttime hours. Given the tracks of Hurricanes Rita and Katrina, the detection
efficiency values ranged from ~75% to 95% (Fig. 1). This study does not explicitly
account for variations in detection efficiency, but in objective applications of lightning
data, such as data assimilation into numerical weather prediction models, the variations in
detection efficiency need to be taken into account. For this purpose modeled detection
efficiency can be used (Cummins, 2006).
Cramer and Cummins (1999) conducted a location accuracy study within the NLDN,
using both NLDN and LLDN detection methods. They concluded that median location
accuracy of the LLDN detected strikes is ~ 5 km. The vertical sections of lightning bolts
provide the strongest signal for the NLDN and LLDN to detect. The location of the
lowest couple of kilometers of each strike is often vertical, whereas the higher portions of
the lightning bolt may be more horizontal in orientation. Therefore, the lateral
displacement of each strike from its cloud origin is not exactly known, but will likely fall
within the radius of the median displacement accuracy.
3.2 TRMM
The Tropical Rainfall Measuring Mission (TRMM) Microwave Imager (TMI) is a
passive radiometer sensor that receives radiation in nine wavelengths. Brightness
temperatures from the vertically polarized 85 GHz channel are used in this study (TRMM
product 1B11). Also, the hydrometeor profile product is used to estimate the horizontal
15
and vertical distribution of precipitation-sized ice (for details on algorithm 2A12 see
http://disc.sci.gsfc.nasa.gov). The algorithm generates vertical profiles of hydrometeors
for 14 levels by combining TMI brightness temperature data with dynamical cloud
models. For both the vertically polarized 85 GHz channel and the Hydrometeor Profiler,
the scan width is 878 km wide and the ground resolution is 5 km.
3.2.1 85 GHz
Passive microwave brightness temperatures at 85 GHz have been used in various
studies to determine the vertical development and related strength of convective systems
(e.g., Mohr et al. 1999; Cecil and Zipser 1999; Nesbitt et al. 2000; Cecil et al. 2002a,b;
Lee et al. 2002). The 85 GHz channel brightness temperature is sensitive to radiation
scattering by precipitation sized ice particles. The brightness temperature decreases with
deeper vertical distributions, and greater density of these hydrometeors. Nesbitt et al.
(2000) and Cecil et al. (2002a, b) also concluded that the frequency of lightning flashes
was higher for convective systems in the tropics with lower 85 GHz temperatures.
3.2.2 Precipitation Ice
The TMI hydrometeor profile product is able to calculate precipitation-sized ice
concentrations (g m-3) for various vertical levels. After examining all vertical levels
above 5 km, it was determined that level 12 (corresponding to 8 - 10 km elevation)
showed the greatest contrast between images taken during times of high strike density
and images taken with little or no lightning present. When comparing images from
different times and days, as well as comparing different areas within the same image,
16
stronger convection produces greater precipitation ice concentration (PIC). The greater
PIC values are also lifted higher into the atmosphere as a result of the enhanced vertical
velocities within the area of active convection; therefore, contrasts were most pronounced
at higher levels, which warranted the uses of level 12. Similar contrasts were also seen at
level 10 (5 - 6 km) and level 11 (6 - 8 km), however they were less pronounced than
those at level 12. A study by Fiorino (2006) examined the accuracy of the TRMM PIC
product by comparing TRMM derived PIC values with in-situ aircraft PIC measurements.
Finding that with in level 12 the TRMM PIC product tended to slightly underestimate
actual values by ~ 20%. When comparing the lower level values of TRMM derived PIC
found in Hurricanes Rita and Katrina it is seen that these values are close to the in-situ
radar derived values in the hurricane studies by Black (1990) and Gamache et al. (1993).
3.3 Aircraft
The flight level and radar data were collected by the National Oceanic and
Atmospheric Administration (NOAA) WP-3D aircraft during numerous flight missions
through both TCs. The data used in this study were then obtained from the Hurricane
Research Division (HRD).
3.3.1 Radar
Plane Position Indicator (PPI) images were provided by the lower fuselage (LF)
radar (5.59 cm wavelength). The radar is a 360˚ horizontally scanning fan beam radar
with a vertical beam width of 4.1˚, and a horizontal width of 1.1˚. The full scan period of
the radar is ~ 30-seconds (The National Oceanic and Atmospheric Administration
17
Aircraft Operations Center website). The LF radar is affected from both inadequate beam
filling as well as attenuation, however during hurricane missions measurement errors as a
result of inadequate beam filling are more significant (Marks 1985). Inadequate beam
filling occurs when the pulse volume of the radar beam is not filled with homogenous
precipitation; when this happens there is a reduction in the strength of the return signal,
and a reduction of the actual value of the highest reflectivities contained within the radar
pulse volume. The beam width increases as its distance from the radar increases, so the
pulse volume becomes larger, increasing the effect inhomogeneous precipitation has on
the strength of the return signal. The reduction of return signal as a result of inadequate
beam filling during hurricane missions was examined as a function of LF radar altitude
and radar distance from target (Marks 1985). At an altitude of 1500m (3000m) at a range
of 75 km, mean signal loss was ~3 dBZ (~5dBZ). The PPI images used throughout this
study are single scans, at various altitudes from 1500 to 2800 m, taken while the P-3
aircraft was within storm center. The analysis within this study focuses on the eyewall
regions of both hurricanes, which are always < 70 km from the radar.
Vertical reflectivity profiles (VRP) used in this study are composite images
created by the Hurricane Research Division (HRD) from data recorded by the tail
mounted Doppler (TA) radar aboard the P-3. The TA radar has a 3.22 cm wavelength,
and operates using a 2.07˚ aft beam width and a 2.04˚ fore beam width. The radar
operates in range height indicator mode (RHI) and the scan period can be adjusted from
0 - 10 revolutions per minute. The TA also suffers from inadequate beam filling,
however as a result of the shorter wavelength the effect of attenuation is more of a
problem during hurricane missions. Attenuation is a weakening of the radar beam, as the
18
energy of the beams is lost due to scattering and absorption by hydrometeors. The TA
radar experiences a sharp attenuation of the signal just below the radar, while it is
pointing downward, which is then poorly interpreted by the composite computer program
at the HRD (Gamache, Hurricane Research Division 2006, personal correspondence).
The sharp attenuation of the radar is seen in the VRP as the vertical discontinuity of
reflectivity values at and below the altitude of the radar. The highest altitude radar flight
used in this paper is ~ 3000 m, thus the altitudes of interest (> 5 km) will not be affected
at all by this attenuation problem. The VRPs used in this study are comprised of
~ 20 – 30 minutes of TA radar data gathered during radial passes through eyewall by the
P-3 aircraft. These data are then processed at the HRD into a single, storm relative, VRP.
3.3.2 In-situ
Vertical and horizontal wind speeds are measured along the aircraft flight path
with a sampling rate of 1 Hz. The vertical wind is measured by adding the vertical speed
of the aircraft relative to the earth and the vertical wind speed relative to the aircraft. The
aircraft vertical speed is calculated using an inertial navigation system, which measures
the vertical acceleration of the aircraft (Jorgensen 1984). The vertical wind speed relative
to the aircraft is computed using the true air speed of the aircraft as well as the attack,
pitch, roll, and sideslip angles of the aircraft. Once these are summed together the
vertical wind speeds are resolved with an accuracy of ± 0.5 m s-1, within a range of
± 20 m s-1 (National Oceanic and Atmospheric Administration’s Aircraft Operations
Center website). The environmental horizontal wind speeds are also calculated using the
19
aircraft true air speed and attack, pitch, roll, and sideslip angles, along with the inertial
navigation calculated aircraft track. The horizontal wind speeds are then accurate to
± 1 m s-1, with a range of ± 212 m s-1 (National Oceanic and Atmospheric
Administration’s Aircraft Operations Center website). The aircraft position via global
positioning system is also included in the 1-second data supplied by HRD, and is used
throughout this study to give the aircraft position relative to the hurricanes.
3.4 G.O.E.S.
The GOES-12 satellite area files were obtained from the National Environmental
Satellite, Data, and Information Service (NESDIS). The files were processed into
standard 4 km resolution infrared images using the Man computer Interactive Data
Access System (McIDAS-X) imaging software. Lightning strike data were then overlaid
onto the satellite images using the same software.
20
CHAPTER 4. RESULTS
Hurricanes Rita and Katrina were very similar storms in terms of genesis region,
track, and mature lifetime. Hurricanes Rita and Katrina were also two of the most intense
hurricanes in the historical record, attaining minimum central pressures of 895 mb and
902 mb respectively (Knabb et al. 2005, 2006).
4.1 Rita
The density of cloud-to-ground lightning strikes produced within the eyewall of
Hurricane Rita was the largest ever detected by the NLDN or LLDN. Molinari et al.
(1999) recorded the radial distribution of lightning strikes for 20 km radial bins, in units
number of strikes per 100 km X 100 km per day = (100 km)-2 day-1. The study first
normalized all radial bin totals by (100 km)2; because the total number of hours of
lightning data varied for each storm, the totals were then normalized by 24 hours.
Molinari et al. (1999) found the highest eyewall region (0 – 40 km) strike count of
225 strikes (100 km)-2 day-1 in a marginal hurricane (Hurricane Bob of 1985). The most
intense hurricane examined was Hurricane Andrew (minimum surface pressure of 922
mb), with the eyewall region (0 - 40 km) only producing 140 strikes (100 km)-2 day-1.
For comparison the eyewall region (0 – 50 km) of Hurricane Rita produced
986 strikes (100 km)-2 day-1. Although similar data sets are being compared, Molinari et
al. (1999, NLDN) and the LLDN used in this study, differences in detection efficiency
(DE) must be taken into account. However, these DE differences are not large enough to
explain the observed differences in the eyewall flash rates.
21
Lightning data discussed for Hurricane Rita begins on 21 September at 0000 UTC
and ends just prior to landfall on 23 September at 2300 UTC. Lightning data were
divided hourly into 25 km annular rings beginning at storm center and continuing
outward to 300 km. Following Molinari et al. (1999) the radial bins were grouped into
three main regions, the eyewall (0–50 km), inner rainband (75 - 175 km) and outer
rainbands (r > 175 km). The strike density maximum for Hurricane Rita was contained
within the eyewall region, not in the outer rainband region (Fig. 2). The 0 – 25 km bin of
Rita contained a total of 5608 strikes (100 km)-2, which is ~7 times larger than any one of
the outer rainband bins.
Three eyewall outbreaks occurred during the 71 h period beginning at 0000 UTC
on 21 September 2005 (Fig. 3). The first outbreak reached a maximum at 1600 UTC on
21 September, during a period of rapid intensification (as defined by a 15 m s-1 increase
in maximum sustained winds in 24 hours), where the central pressure of the TC dropped
68 mb in 22.5 h. A second outbreak occurred at the end of the period of rapid
intensification, between 2300 UTC on 21 September and 0700 UTC on 22 September
during the time Rita reached maximum intensity. A final outbreak at 1800 UTC on 22
September was much smaller than the first two both in intensity and duration.
4.1.1 Rapid Intensification Eyewall Lightning Outbreak
The first eyewall lightning outbreak contained the highest strike rate in this study,
producing a maximum hourly strike density of 474 strikes (100 km)-2. The outbreak
began at 1400 UTC, 10 hours after the TC begun to rapidly intensify, and lasted ~ 5 h.
22
The eye had begun contracting earlier in the day (Knabb et al. 2005) and now was ~ 40
km in diameter (as measured by PPI radar in Fig. 4).
During the time of this outbreak, aircraft-measured reflectivity shows that the eye
was completely enclosed and relatively axisymmetric in structure (Fig. 4). However,
reflectivity values varied around the eyewall, with the northwest and southeast containing
the highest reflectivity values (> 40 dBZ). During this outbreak lightning strikes were
detected in every region of the eyewall. However, strike density maxima is located in the
northwestern and southeastern regions of the eyewall coinciding with higher reflectivity
values. This asymmetric pattern in strike density lasts for the duration of this outbreak.
For all PPI images lightning strike locations are overlaid throughout the entire image to
further display the lightning distribution within the two Hurricanes. Because of effects of
attenuation and inadequate beam filling previously discussed, each of the aircraft PPI
radar images contain a 70 km range ring demarcating the nominal effective range of the
LF radar. Therefore the qualitative correlation between aircraft PPI radar reflectivity and
lightning strike locations will only be accounted for within the 70 km range ring (Marks
1985). The fact that an overwhelming majority of the strikes were detected within 5 km
of maximum eyewall reflectivities in Fig. 4 is consistent with the known relationship
between high lightning rates and enhanced convective precipitation, whereas it also acts
to verify the location accuracy of the LLDN.
The TA VRP images at various locations around the eyewall show a well-
developed outward tilt of the eyewall (Fig. 5). At this time Hurricane Rita displays
relatively deep convection for a mature hurricane eyewall region (Figs. 5a,c, d),
containing reflectivities of 30 dBZ above the melting level, with a gradual decrease of
23
reflectivity with height. The attenuation correction problem previously discussed is very
evident in all the images in Fig. 5. The marked discontinuities at flight-level (~ 3000 m),
with decreased values below the aircraft make the use of any data below 3000 m
impossible. However, all the data above the aircrafts flight level are not affected at all by
this severe attenuation problem, and it is within reason to evaluate those data at and
above ~ 4000 m.
Flight-level updraft velocities in the eyewall are substantial, with maximum
velocities measuring > 4.5 m s-1 for each eyewall penetration (Fig. 5). The northern
eyewall pass recorded the strongest eyewall updraft for any radial pass for either storm,
with a peak velocity of 16.5 m s-1. Within this updraft, vertical velocities > 7.5 m s-1
were observed over a distance of 2 km (Fig. 5a). This radial leg also contained the
greatest number of lightning strikes, with 16 strikes detected in the range of 12 to 28 km
from the center of Rita.
The minimum in strike density within the inner rainbands is a feature Hurricane Rita
shares with previously studied TCs. This region of minimum strike density in Hurricane
Rita was due to the stratiform nature of the cloud development in that region, as seen in
previous studies (Molinari et al., 1994, 1999). All of the VRPs contain a region 50 to 90
km outward of the eyewall characterized by a stratiform reflectivity and a bright-band
signature with almost no vertical development. These bright-band cells outward of the
eyewall are the result of frozen particles falling and melting in the presence of weak
vertical updrafts (Szoke 1986; Yuter and Houze 1995). These bright band cells reside in
the inner rainband region and coincide with the strike density minimum measured in this
study.
24
The TRMM image shown in Figure 6 was taken just minutes prior to the time of
the detected maximum eyewall strike rate. More than 150 cloud-to-ground strikes were
detected within the eyewall region from 1520 UTC to 1600 UTC (Fig. 6a). The entire
eyewall contained brightness temperatures < 200 K, with most of the eyewall colder than
170 K. According to the study by Cecil et al. (2002a) 85 GHz brightness temperatures
<170 K are extremely cold and are rarely found within the eyewall of a hurricane. A
frequency study of 261 TRMM overpasses of mature hurricanes concluded that 85 GHz
temperature pixels measuring < 170 K are in the 95th percentile of all the mature
hurricane eyewalls.
There is a lower strike density in the western region of the eyewall during this time
that coincides with warmer brightness temperatures in that area. However, during this
outbreak, lightning data do not show an eyewall region void of detected lightning strikes
when viewed for periods on the order of ~1 h.
The eye is completely surrounded by PIC > 0.6 g m-3 at this level, (Fig 6b). The
highest PIC observed, 0.7 g m-3, is in the northeastern region of the eyewall, and
corresponds to an area of enhanced strike density during the time of the image. PIC
reaches a maximum in the eyewall, with values dropping off quickly as you move
radially outward (Figs. 5a and 6b). The maximum PIC occurred just outward of aircraft
measured maximum radar reflectivity and vertical velocity (Fig. 5a). This 4 – 5 km
outward displacement of the PIC maximum from reflectivity maximum can be attributed
to advection and the outward tilt of the eyewall with height.
25
4.1.2 Minimum Central Pressure Eyewall Lightning Outbreak
The second eyewall lightning outbreak was the longest of the three outbreaks, lasting
~ 8 hours. During this period the eyewall produced a strike density of
1234 strikes (100 km)-2, with a maximum hourly density of 169 strikes (100 km)-2. This
outbreak coincided with NHC estimated maximum intensity reached at 0300 UTC on 22
September, and with a minimum eyewall diameter of ~29 km (Knabb et al. 2006).
However, the second outbreak was not as well sampled as the other two, with no aircraft
data available and only one TRMM pass toward the end of the period at 0810 UTC.
Eyewall lightning strikes during this time are co-located with the coldest
brightness temperatures, located in the north and northwestern part of the eyewall
(Fig. 7a). During the time of this image, Hurricane Rita was moving to the west-
northwest and had begun to weaken, after reaching maximum intensity ~ 5 hours earlier.
The 40 minutes of lightning data included in the image took place during the end of the
eyewall outbreak, and included only 20 eyewall strikes. At this time the 200 K brightness
temperature contour is no longer symmetric about the eye. The brightness temperatures
within most of the southern quadrant of the eye have risen to ~ 225 K. However, this
TMI recorded a brightness temperature of 139 K, which is the coldest 85 GHz
temperature measured throughout these two days.
During this time the PIC that completely surrounded the eye dropped from 0.6 g
m-3 to ~ 0.4 g m-3 (compare Figs. 6b and 7b). However, Fig. 7b also contains the highest
PIC values recorded during the two days, with several values > 0.8 g m-3. The low PIC
content in the southern portion of the eyewall is most likely associated with the lack of
convective updrafts within that region of the eyewall, resulting in the inability to support
26
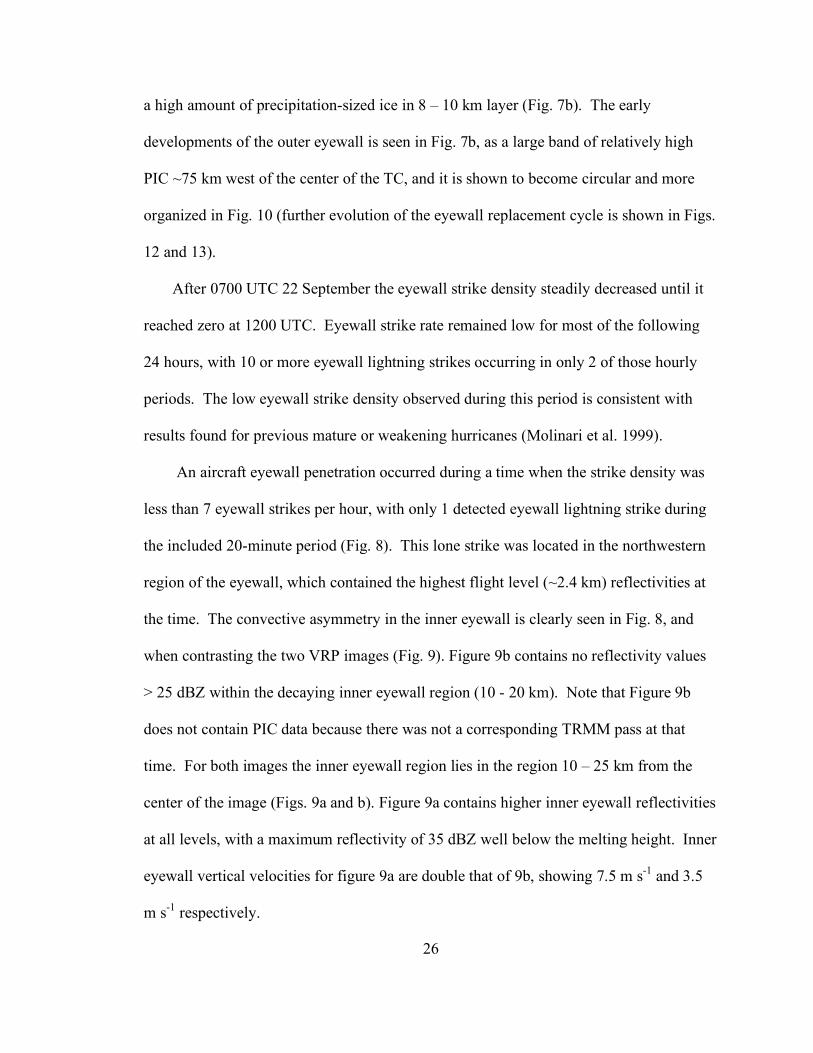
a high amount of precipitation-sized ice in 8 – 10 km layer (Fig. 7b). The early
developments of the outer eyewall is seen in Fig. 7b, as a large band of relatively high
PIC ~75 km west of the center of the TC, and it is shown to become circular and more
organized in Fig. 10 (further evolution of the eyewall replacement cycle is shown in Figs.
12 and 13).
After 0700 UTC 22 September the eyewall strike density steadily decreased until it
reached zero at 1200 UTC. Eyewall strike rate remained low for most of the following
24 hours, with 10 or more eyewall lightning strikes occurring in only 2 of those hourly
periods. The low eyewall strike density observed during this period is consistent with
results found for previous mature or weakening hurricanes (Molinari et al. 1999).
An aircraft eyewall penetration occurred during a time when the strike density was
less than 7 eyewall strikes per hour, with only 1 detected eyewall lightning strike during
the included 20-minute period (Fig. 8). This lone strike was located in the northwestern
region of the eyewall, which contained the highest flight level (~2.4 km) reflectivities at
the time. The convective asymmetry in the inner eyewall is clearly seen in Fig. 8, and
when contrasting the two VRP images (Fig. 9). Figure 9b contains no reflectivity values
> 25 dBZ within the decaying inner eyewall region (10 - 20 km). Note that Figure 9b
does not contain PIC data because there was not a corresponding TRMM pass at that
time. For both images the inner eyewall region lies in the region 10 – 25 km from the
center of the image (Figs. 9a and b). Figure 9a contains higher inner eyewall reflectivities
at all levels, with a maximum reflectivity of 35 dBZ well below the melting height. Inner
eyewall vertical velocities for figure 9a are double that of 9b, showing 7.5 m s-1 and 3.5
m s-1 respectively.
27
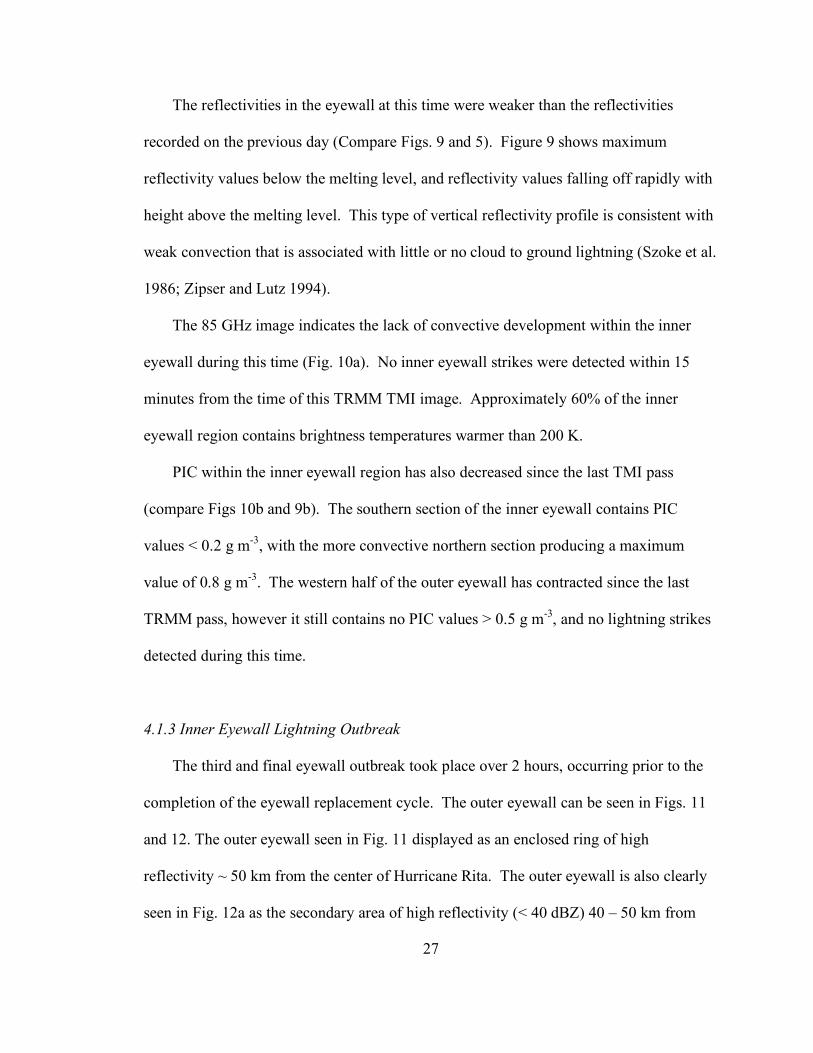
The reflectivities in the eyewall at this time were weaker than the reflectivities
recorded on the previous day (Compare Figs. 9 and 5). Figure 9 shows maximum
reflectivity values below the melting level, and reflectivity values falling off rapidly with
height above the melting level. This type of vertical reflectivity profile is consistent with
weak convection that is associated with little or no cloud to ground lightning (Szoke et al.
1986; Zipser and Lutz 1994).
The 85 GHz image indicates the lack of convective development within the inner
eyewall during this time (Fig. 10a). No inner eyewall strikes were detected within 15
minutes from the time of this TRMM TMI image. Approximately 60% of the inner
eyewall region contains brightness temperatures warmer than 200 K.
PIC within the inner eyewall region has also decreased since the last TMI pass
(compare Figs 10b and 9b). The southern section of the inner eyewall contains PIC
values < 0.2 g m-3, with the more convective northern section producing a maximum
value of 0.8 g m-3. The western half of the outer eyewall has contracted since the last
TRMM pass, however it still contains no PIC values > 0.5 g m-3, and no lightning strikes
detected during this time.
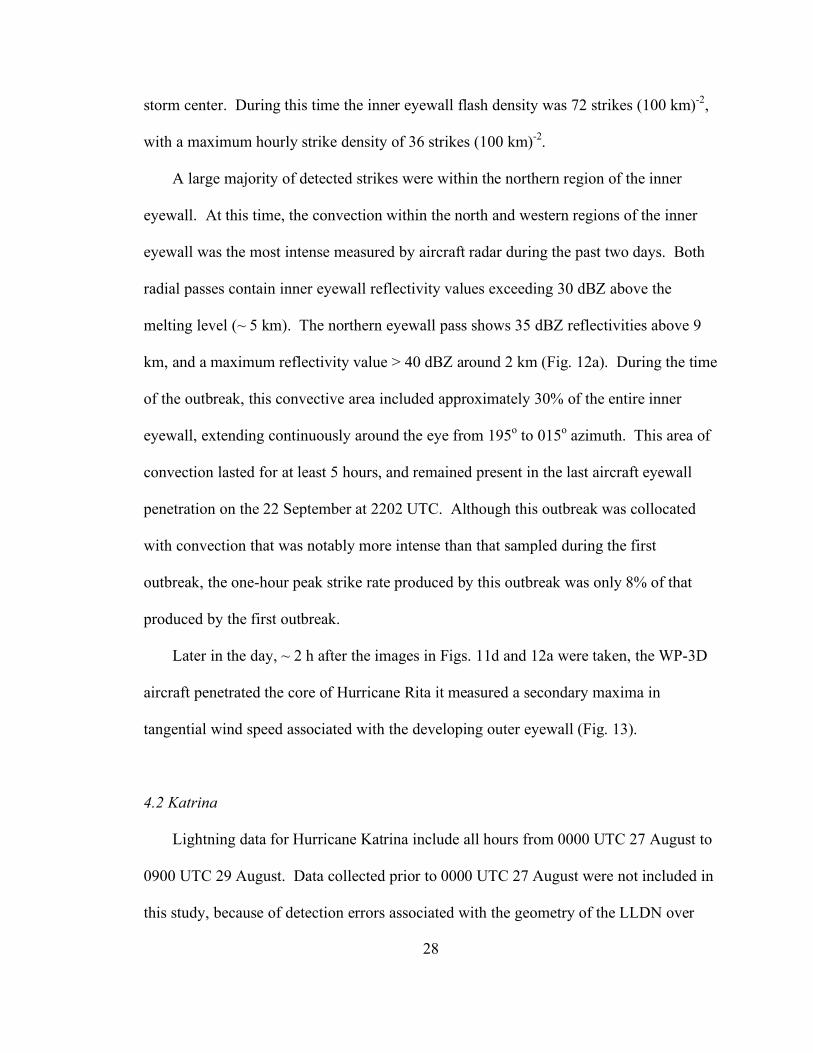
4.1.3 Inner Eyewall Lightning Outbreak
The third and final eyewall outbreak took place over 2 hours, occurring prior to the
completion of the eyewall replacement cycle. The outer eyewall can be seen in Figs. 11
and 12. The outer eyewall seen in Fig. 11 displayed as an enclosed ring of high
reflectivity ~ 50 km from the center of Hurricane Rita. The outer eyewall is also clearly
seen in Fig. 12a as the secondary area of high reflectivity (< 40 dBZ) 40 – 50 km from
28
storm center. During this time the inner eyewall flash density was 72 strikes (100 km)-2,
with a maximum hourly strike density of 36 strikes (100 km)-2.
A large majority of detected strikes were within the northern region of the inner
eyewall. At this time, the convection within the north and western regions of the inner
eyewall was the most intense measured by aircraft radar during the past two days. Both
radial passes contain inner eyewall reflectivity values exceeding 30 dBZ above the
melting level (~ 5 km). The northern eyewall pass shows 35 dBZ reflectivities above 9
km, and a maximum reflectivity value > 40 dBZ around 2 km (Fig. 12a). During the time
of the outbreak, this convective area included approximately 30% of the entire inner
eyewall, extending continuously around the eye from 195o to 015o azimuth. This area of
convection lasted for at least 5 hours, and remained present in the last aircraft eyewall
penetration on the 22 September at 2202 UTC. Although this outbreak was collocated
with convection that was notably more intense than that sampled during the first
outbreak, the one-hour peak strike rate produced by this outbreak was only 8% of that
produced by the first outbreak.
Later in the day, ~ 2 h after the images in Figs. 11d and 12a were taken, the WP-3D
aircraft penetrated the core of Hurricane Rita it measured a secondary maxima in
tangential wind speed associated with the developing outer eyewall (Fig. 13).
4.2 Katrina
Lightning data for Hurricane Katrina include all hours from 0000 UTC 27 August to
0900 UTC 29 August. Data collected prior to 0000 UTC 27 August were not included in
this study, because of detection errors associated with the geometry of the LLDN over
29
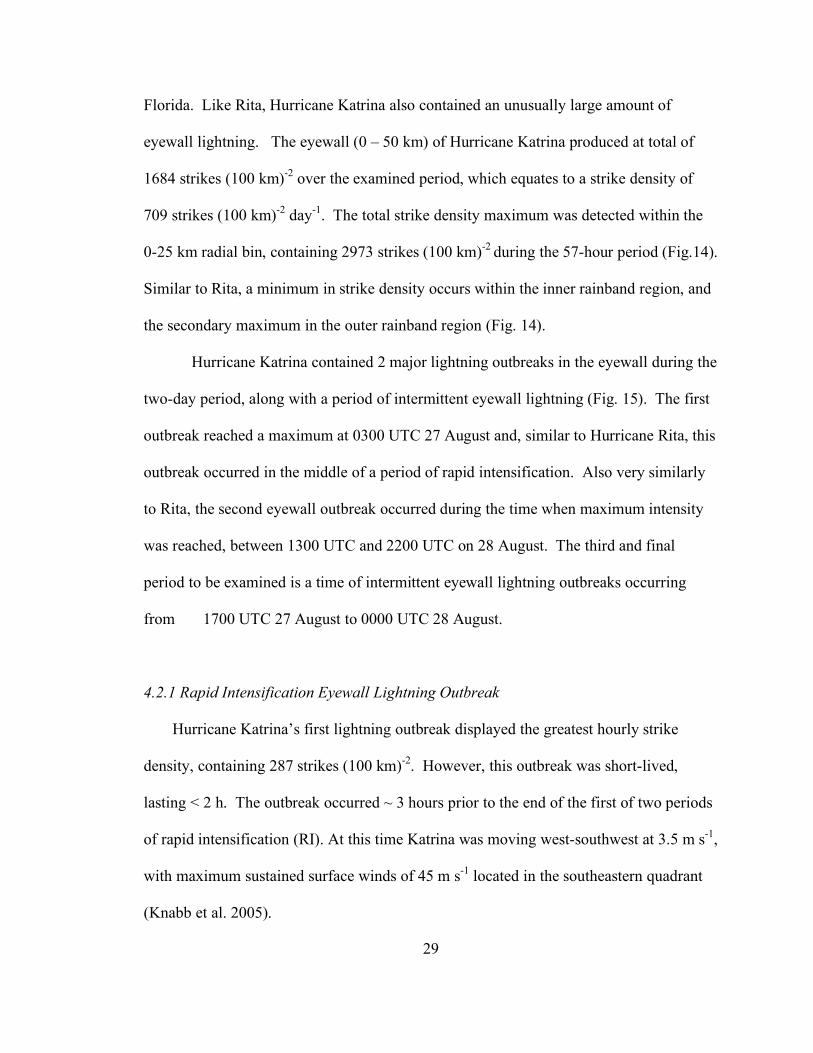
Florida. Like Rita, Hurricane Katrina also contained an unusually large amount of
eyewall lightning. The eyewall (0 – 50 km) of Hurricane Katrina produced at total of
1684 strikes (100 km)-2 over the examined period, which equates to a strike density of
709 strikes (100 km)-2 day-1. The total strike density maximum was detected within the
0-25 km radial bin, containing 2973 strikes (100 km)-2 during the 57-hour period (Fig.14).
Similar to Rita, a minimum in strike density occurs within the inner rainband region, and
the secondary maximum in the outer rainband region (Fig. 14).
Hurricane Katrina contained 2 major lightning outbreaks in the eyewall during the
two-day period, along with a period of intermittent eyewall lightning (Fig. 15). The first
outbreak reached a maximum at 0300 UTC 27 August and, similar to Hurricane Rita, this
outbreak occurred in the middle of a period of rapid intensification. Also very similarly
to Rita, the second eyewall outbreak occurred during the time when maximum intensity
was reached, between 1300 UTC and 2200 UTC on 28 August. The third and final
period to be examined is a time of intermittent eyewall lightning outbreaks occurring
from 1700 UTC 27 August to 0000 UTC 28 August.
4.2.1 Rapid Intensification Eyewall Lightning Outbreak
Hurricane Katrina’s first lightning outbreak displayed the greatest hourly strike
density, containing 287 strikes (100 km)-2. However, this outbreak was short-lived,
lasting < 2 h. The outbreak occurred ~ 3 hours prior to the end of the first of two periods
of rapid intensification (RI). At this time Katrina was moving west-southwest at 3.5 m s-1,
with maximum sustained surface winds of 45 m s-1 located in the southeastern quadrant
(Knabb et al. 2005).
30
Unlike Hurricane Rita this eyewall lightning outbreak was asymmetric, with the
majority of strikes detected in the southeastern quadrant of the eyewall (Fig. 16b). Figure
16a show less than 10 eyewall strikes contained within the TRMM image, catching the
tail end of the short-lived outbreak. However, the convective feature and asymmetry of
the eyewall are still clearly visible in the 85-GHz image, with the area still containing
brightness temperatures < 200 K. PIC, in 8-10 km layer is also shows a maximum in the
southeastern quadrant of the eyewall, with TRMM PIC values > 0.62 g m-3
(Fig. 17).
4.2.2 Inner Eyewall Lightning Outbreak
The next time period examined is later in the day on the 27 August, during this time
Hurricane Katrina was moving due west at 3 m s-1, with estimated maximum sustained
surface winds of 51 m s-1. Between 1635 UTC August 27 and 1705 UTC August 27 the
WP-3D aircraft made a southeast to northwest pass through the inner core of the
hurricane at ~ 3000m (Fig. 18). The aircraft recorded a double maximum in tangential
wind indicating that Hurricane Katrina was undergoing an eyewall replacement cycle.
The flight-level peak wind was measured in the southeast pass of the newly forming
eyewall at 49 m s-1 at 16:44:40. Lightning within the eyewall during this time became
intermittent; with hourly strike rates varying from 0 to 50 strikes (100 km)-2. This period
of intermittent eyewall lightning began at ~1700 UTC 27 August in the middle of what
appears to have been an eyewall replacement cycle and lasted approximately 10 hours.
The remnants of the inner eyewall are seen as the area of highest reflectivity
within the newly formed eyewall (Fig. 19a). The image Fig. 19a was taken in the middle
31
of a 2-hour period (1730 - 1930 UTC 27 August), during which only two strikes were
detected within the eyewall region. However, between 1630 UTC and 1730 UTC on 27
August 26 eyewall strikes were detected in the southeastern region encompassing the
remnant eyewall rainband. During the entire 10 hours of intermittent eyewall lightning
> 80% of strikes detected were emanating from the region of the remnant inner eyewall
band (Fig. 19c). The near absence of eyewall lightning in Figs. 19a and b reflects the
observation that these smaller eyewall outbreaks were intermittent and short-lived.
All of the detected eyewall strikes for the period of 1930 UTC - 2030 UTC 27
August occurred between 1930 UTC and 1940 UTC 27 August; therefore no lightning
occurred during the time of Fig. 19b. However, the GOES-12 IR image (Fig. 19c) shows
that most of the eyewall strikes occurred in the southwest region of the eyewall. In fact,
during the entire 10 hours of intermittent eyewall lightning over 80% of strikes detected
were in the southeastern quadrant of the storm. The absence of eyewall lightning in these
images also suggests that these smaller eyewall outbreaks were intermittent and short-
lived.
At ~2100 UTC Hurricane Rita had a new slowly contracting eyewall and
sustained winds of ~50 m s-1. There were no eyewall strikes within a 40-minute period
centered on the time of the images in Fig. 20. The 85-GHz image shows temperatures <
200 K were located throughout the eastern and northeastern region, with the coldest
eyewall brightness temperatures in the eastern region of the eyewall (Fig. 20a). PIC is
also at a maximum in the eastern region of the eyewall (Fig. 20b). However, the
maximum values of PIC in the eyewall have dropped slightly, with only 3 TRMM values
above 0.6 g m-3 (compare Figs. 20b and 17). After this image was taken, 56 eyewall
32
strikes were detected from 2200 to 2230 UTC 27 August, with all but 2 of the strikes
detected in the southeastern region of the eyewall.
As Katrina begins to undergo the second of its two periods of rapid intensification,
further organization of the eyewall is seen, displaying deeper, more symmetrical
convection (Fig. 21 and 22). Excluding a small section in the northern region of the
eyewall, the entire eyewall contains PIC values > 0.45 g m-3 (Fig. 21b).
The low brightness temperatures (<150 k) and high ice values (> 0.8 g m-3) in Fig. 21
are upshear from the area of highest strike density on the northeast side of the eyewall.
The pixel nearest to the group of lightning strikes shown at 25.2N 86.1W measured the
highest value at this vertical level for either storm at 0.9 g m-3.
A sharp gradient in brightness temperatures is located near the concentration of
strikes, with a much weaker gradient upwind of the strikes. Examination of a rapid scan
loop of GOES-IR images overlaid with lightning data (not shown) during the time of this
TRMM image (Fig. 21), shows a localized lightning outbreak moving cyclonically
around the eastern region of the eyewall, presumably moving along with a convective
tower. It is suggested that ice particles ejected upward from the convective tower would
trail upwind of the convection due to decreasing tangential wind speed with height.
However, it is difficult to prove this hypothesis in the absence of continuous in-situ
aircraft reflectivity and tangential wind data.
4.2.3 Minimum Central Pressure Eyewall Lightning Outbreak
Hurricane Katrina attained maximum intensity at 1800 UTC on 28 September, with
estimated minimum central pressure of 902 mb and maximum sustained surface winds of
33
77 m s-1 (Knabb et al. 2005). The third and final eyewall outbreak started at 1300 UTC
on 28 September and continued for approximately 9 hours, reaching a maximum strike
density of 128 strikes (100 km)-2 h-1 at 1800 UTC. This outbreak was more symmetrical
than the previous two, with strikes detected in every azimuth of the eyewall. During the
9-h period this outbreak produced an average strike density of 64 strikes (100 km)-2.
Figure 22a shows that reflectivity values in the eyewall do not vary greatly
throughout different sections of the eyewall. However, slightly higher reflectivities were
observed in southeastern and northern region of the eyewall, and these regions also
contained higher strike densities. This asymmetric pattern of active convection and the
maxima in strike density both remained stationary relative to storm center for the
remainder of the outbreak, with the strike density increasing in the south-southeastern
region of the eyewall as the outbreak came to an end (Figs. 22b and c).
VRP’s show that northeast and southwest regions of the eyewall contained maximum
reflectivities below the melting level (~5 km), with 25 dBZ observed above 7 km
(Figs. 23 a and b). These two azimuths both contain relatively little lightning during the
time of the pass, with lightning detected cyclonically downwind of each. The airplane
pass through the northwest region of the eyewall recorded reflectivities that decrease
rapidly with height above the melting level, which is characteristic of weak convection
(Fig. 23c). This radial pass also contains the least amount of lightning when compared to
the other passes through the eyewall. Downwind of the northwest eyewall pass, the
western and southwestern regions of the eyewall contain the least lightning during the
outbreak.
34
The deepest convection measured within the eyewall during this outbreak period was
in the 180o azimuth (Fig. 23d). This radial pass was flown approximately 5 hours after
maximum intensity was reached, at the time when Katrina had begun to weaken.
Reflectivities of 30-dBZ were measured above 8 km, with 20 dBZ extending to ~ 11 km.
The flight level updraft for this part of the eyewall contained positive vertical velocities
continuously for 15 km along the flight path. This azimuth also contains the greatest
strike density, consistent with the strike distribution seen in Fig. 22c.
The peak values of PIC for both the 315˚ and 180˚ are both approximately 0.6 g m-3
(Figs. 23c and d). Therefore, in this case there is no obvious correspondence between
PIC and strike density and higher reflectivity between these two azimuths, as the 180˚
section contained a much higher strike density throughout the outbreak. It is suggested
that this lack of correspondence is due to the vertical shear of the horizontal wind with
respect to the area of active convection. The wind advects the ice concentrations
cyclonically around the storm, whereas the area of active convection remains stationary
relative to storm center (Figs. 22b, c). The tangential wind speed ~ 25 – 30 km from
storm center, at the PIC level 12 (8 – 10 km) are ~ 55 m s-1 (Fig. 25). Taking the value of
the diameter of the eyewall at this time to be ~ 90 km, ice particles advected upward to a
height of 8-10 km would be displaced 90˚ cyclonically around the eyewall from the
stationary convective source in only 20 minutes. The slightly higher values for the
northwestern eyewall region could be because of its position downwind from more
intense convection in the northern region of the eyewall.
On very small time and spatial scale there can be discrepancies found in the
correlation between lightning strike density and PIC/Brightness temperatures. For
35
example, it is not apparent from the lightning strike locations in Figs 24a, b that detected
lightning strikes coincide well with low brightness temperatures and highest PIC values.
This image only contains lightning from 2102 -2142 UTC, during which time there was a
brief reduction in eyewall strike density just before a last local maximum was reached at
2300 UTC (shown in Fig. 15). However these two images do correlate well with the
spatial distribution of strike density that was present for most of the 9-h outbreak (Figs.
22 and 24c). The lowest 85 GHz brightness temperatures were located in the
southeastern and northern regions of the eyewall, with the western eyewall region void of
temperatures < 225 K. The PIC values are also highest in the southeastern and northern
regions of the eyewall, with both of these eyewall regions containing TRMM pixel values
> 0.73 g m-3, while the western region contained very little lightning during the 9-h
period, values < 0.4 g m-3.
36
CHAPTER 5. SUMMARY AND CONCLUSIONS
Data collected by the National Long-Range Lightning Detection Network (LLDN),
along with TRMM and reconnaissance aircraft data have been used to investigate the
morphology of lightning outbreaks in the eyewalls of Hurricanes Rita (2005) and Katrina
(2005). The LLDN network is one of few observing systems, outside geostationary
satellite-based instruments, that provide continuous real-time data throughout a synoptic-
scale coverage area over the open ocean. Given the small sample size in the analysis of
only two hurricanes presented, some of the conclusions of this research are necessarily of
a qualitative rather than a quantitative nature. Nevertheless, the correspondence of the
lightning outbreaks with strong reflectivity and high precipitable ice concentrations
inferred from aircraft and TRMM data, show that the LLDN data stream holds promise
for future applications to assess hurricane convective structure and evolution.
5.1 Comparison between Hurricane Rita and Katrina
Both Hurricanes Rita and Katrina produced their greatest hourly eyewall strike
density during their respective periods of rapid intensification. However, the morphology
of these two outbreaks and their associated convective structures proved to be very
different. Hurricane Rita’s eyewall outbreak lasted ~ 3 hours, and was quasi-symmetric
about the eye, with cloud to ground lightning strikes detected in every azimuthal section
of the eyewall. In contrast, Hurricane Katrina’s outbreak was asymmetric, with the all
the eyewall strikes detected in the southeastern region of the eyewall. The bulk of the
eyewall strikes occurred during ~ 20 minutes from 0325 UTC to 0345 UTC 27 August, a
period much shorter than that of Hurricane Rita’s outbreak. Rita was a stronger storm
37
than Katrina at the time of its burst of eyewall lightning, and the symmetric character of
the observed convection may have prevented wind shear from dissipating the electric
field built-up by the convection, helping to prolong the outbreak.
During the eyewall replacement cycles the eyewall region produced brief periods
of cloud to ground lightning. Hurricane Rita produced one outbreak, which lasted less
than 2 hours, while Katrina produced multiple sub-hourly eyewall outbreaks. The hourly
strike density of these outbreaks for both storms were ~ 50 strikes (100 km)-2. Aircraft
radar data showed that the lightning outbreaks were produced by the decaying inner
eyewall, and not by the developing outer eyewall in both storms.
One of the most intriguing results is that Hurricanes Rita and Katrina both
contained a long-lived eyewall outbreak centered on the time when maximum intensity
was reached. The eyewall strike densities during these periods of maximum storm
strength were comparable, with hourly strike densities between 140 – 175 strikes (100
km)-2 for each storm. Hurricane Katrina’s eyewall outbreak reached a maximum within
the same hour as minimum central pressure was reached (as estimated by the NHC).
While the eyewall of Hurricane Katrina was completely enclosed and circular, eyewall
strike density values were not quite symmetric about the eye, showing higher values in
the southeast region of the eyewall.
5.2 Lightning, Radar Reflectivity, and TRMM
Aircraft radar reflectivities showed the best spatial correlation with lightning strikes.
When areas of high strike density within the eyewall were detected they were invariably
co-located with areas of high reflectivity (i.e. Figs. 4, 8, 11, and 20). The strength and
38
vertical development of convection was also correlated with high strike density. Areas of
eyewall convection that contained 30 dBZ reflectivities at higher altitudes (i.e. > 7 km),
along with reflectivity values that decreased slowly with height above the freezing level
contained greater lightning strike densities.
The TRMM 85 GHz and PIC product both displayed spatial and temporal
correspondence with the eyewall lightning. Low 85 GHz brightness temperatures and
high PIC were not always indicative of the presence of eyewall lightning; however, when
significant amounts of eyewall lightning were detected, low brightness temperatures and
high PIC were always recorded within close proximity of the strikes. Moreover, the
differences in location were consistent with advective processes. Two PIC eyewall
averages were taken for Hurricane Rita at 3 different levels, one average for a time when
there was high eyewall strike density, and the other when there were no detected eyewall
strikes (Fig. 26). The period when the eyewall contained lightning strikes, higher PIC
values were recorded at all levels when compared to the time of no lightning. The
percent difference was greatest at level 12 (8-10 km), the level chosen for presentation
throughout this study.
Fitting with the high intensity of these two hurricanes, the 85 GHz brightness
temperatures within their eyewalls were also historically low when compared to the
previous hurricane study by Cecil et al. (2002a,b). Cecil et al. (2002) found that less than
5% (10%) of eyewall pixels sampled measured values < 150 K (175 K). The eyewalls of
Hurricane Rita and Katrina contained more than 20% (75%) of their eyewall pixels <
150K (175 K).

39
Maximum vertical velocities observed in flight-level data in the eyewalls of Rita and
Katrina varied from 3 m s-1 to 16.5 m s-1. The single highest vertical velocity (16.5 m s-1)
was measured during the time of highest eyewall strike density, however a more general
correlation was not found. It is suggested that the lack of correlation is the result of
limited sampling in rapidly evolving convection and the healthy tendency for
reconnaissance pilots to avoid convective cores.
40
CHAPTER 6. DISCUSSION
6.1 Impact of a Coastal Proximity Limitation
Using the NLDN data, M99 was forced to limit the analysis of lightning data to
times when TCs centers were within 400 km of at least two direction finding (DF)
sensors. However, the use of the LLDN in this study allowed continuous monitoring of
Hurricanes Rita and Katrina, and did not require the implementation of the coastal
proximity limitation (CPL) used in M99. It is of interest to see if the results presented
here would differ if the same CPL restriction was applied (Table 1).
In contrast to the results presented in M99, eyewall lightning represented a
dominant contribution of the lightning distribution of these two hurricanes. In fact
eyewall cloud to ground strikes were detected more often then not during these two
Hurricanes. When the CPL is used we see that the percent of hourly observations
decreases dramatically for Rita, while it remains nearly unchanged for Katrina.
M99 concluded that intense hurricanes, those of the intensity of Rita and Katrina,
would likely contain less eyewall lightning than hurricanes of weaker intensity.
Hurricane Andrew (1994), a storm of similar intensity to Hurricanes Rita and Katrina was
sampled by M99, and contained an eyewall flash density of 140 strikes (100 km)-2 day-1.
If M99 CPL had been used in the study of Hurricane Rita, a very similar 145 strikes (100
km)-2 day-1 would have been recorded. However, the actual lightning data shows that the
eyewall strike density for Hurricane Rita is 986 strikes (100 km)-2 day-1, which is nearly
an eight-fold difference. Hurricane Katrina also contains much more eyewall lightning
than any of the hurricanes studied in M99; however unlike Hurricane Rita, when the CPL
is implemented for Hurricane Katrina the eyewall strike density increases. It is possible
41
for Hurricane Katrina’s strike density to increase with the implementation of the CPL
because the eyewall strikes category is not the total number of eyewall lightning strikes
recorded during the period; rather it is the total number of eyewall lightning strikes
recorded during the period which is then normalized by one day. Therefore, while the
total number of eyewall strikes decreased with the implementation of the CPL, the
average number of eyewall strikes per day actually increased; representing that a
Hurricane Katrina’s eyewall was most lightning active while the storm was within
400 km from the coastline.
The length of lightning outbreaks also change significantly with the
implementation of the CPL. The longest continuous eyewall lightning episode (defined as
one or more detected lightning strikes in each hourly period) documented by M99 was 5-
hours in duration. In contrast, the longest eyewall lightning episodes for Hurricane Rita
and Hurricane Katrina lasted for 31 and 22 hours, respectively. Implementing the CPL
reduces the longest continuous eyewall outbreak down to 12 hours for Katrina, and Rita’s
longest is reduced down to only 4 hours.
The eyewall lightning produced by Hurricane Rita was more impressive than that
of Hurricane Katrina, that is to say that Hurricane Rita had greater eyewall strike
densities, and the highest single hour strike density (compare Figs. 3 and 14). The
eyewall of Hurricane Rita also produced the longest lightning episode, with eyewall
lightning lasting continuously for more than 24 h. However, if CPL is implemented, the
conclusions would have been reversed, and eyewall lightning in Hurricane Katrina would
have appeared to be the more significant of the two. In summary, the differences in the
results produced by artificially restricting the data coverage to that of the NLDN
42
highlight the value of the LLDN data stream for remotely observing lightning in tropical
storms.
6.2 Implications of Lightning Morphology
Hurricanes Rita and Katrina both contained nearly symmetric eyewall lightning
outbreaks during the period when maximum intensity was reached. During the time of
maximum intensity the eye diameter for both Hurricane Rita and Katrina had reached a
minimum, and radar and TRMM data showed evidence of enhanced convection. It is
likely that vertical motion associated with the convection was also enhanced, thus
promoting elevated rates of charge separation within the eyewall. The resulting strong
symmetric electric field would not be prone to dissipation by wind shear effects and
mixing prevalent in mature hurricanes (Black and Hallett 1994). The symmetric
character of the charge separation process made it possible for the eyewall to sustain
strong electric fields for extended periods of time and produce the recorded high strike
densities.
In contrast, lower than expected strike densities can accompany very deep eyewall
convection, if that convection is asymmetric about the eyewall, as observed in Hurricane
Rita (i.e., Figs. 11 and 12). The large vertical shear of the horizontal winds within the
eyewall of mature hurricanes can cause locally enhanced charge separation created by
intense asymmetric convection to be mixed out. This differential horizontal mixing
would cause a rapid reduction in electric field strength and diminish cloud to ground
strike density.
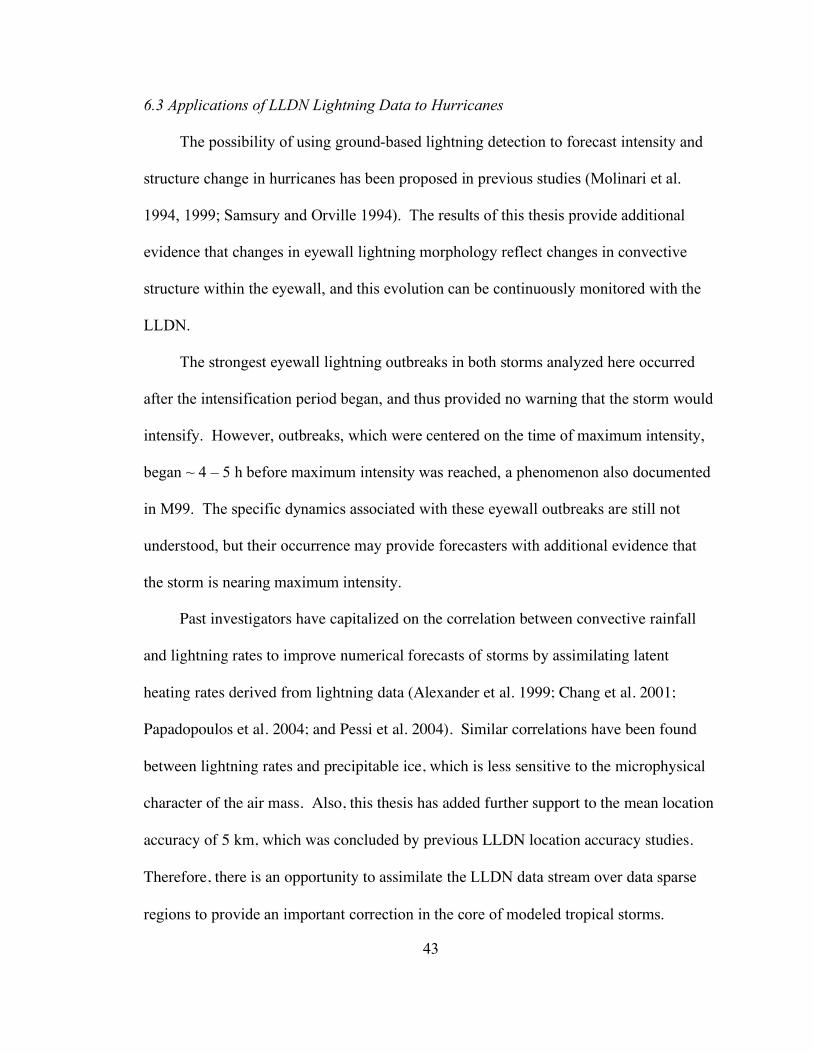
43
6.3 Applications of LLDN Lightning Data to Hurricanes
The possibility of using ground-based lightning detection to forecast intensity and
structure change in hurricanes has been proposed in previous studies (Molinari et al.
1994, 1999; Samsury and Orville 1994). The results of this thesis provide additional
evidence that changes in eyewall lightning morphology reflect changes in convective
structure within the eyewall, and this evolution can be continuously monitored with the
LLDN.
The strongest eyewall lightning outbreaks in both storms analyzed here occurred
after the intensification period began, and thus provided no warning that the storm would
intensify. However, outbreaks, which were centered on the time of maximum intensity,
began ~ 4 – 5 h before maximum intensity was reached, a phenomenon also documented
in M99. The specific dynamics associated with these eyewall outbreaks are still not
understood, but their occurrence may provide forecasters with additional evidence that
the storm is nearing maximum intensity.
Past investigators have capitalized on the correlation between convective rainfall
and lightning rates to improve numerical forecasts of storms by assimilating latent
heating rates derived from lightning data (Alexander et al. 1999; Chang et al. 2001;
Papadopoulos et al. 2004; and Pessi et al. 2004). Similar correlations have been found
between lightning rates and precipitable ice, which is less sensitive to the microphysical
character of the air mass. Also, this thesis has added further support to the mean location
accuracy of 5 km, which was concluded by previous LLDN location accuracy studies.
Therefore, there is an opportunity to assimilate the LLDN data stream over data sparse
regions to provide an important correction in the core of modeled tropical storms.
44
An example of how one could use LLDN lightning data to quantitatively examine
the evolution of a hurricane’s convective structure is illustrated in Fig. 27. By examining
a time series of the radial distribution of lightning strike density, it is possible to show the
eyewall contraction that took place as Hurricane Rita underwent rapid intensification.
From 0300 UTC 21 September to 1200 UTC 21 September it is shown that most eyewall
lightning took place in the 25 – 50 km radial bin. At ~ 1300 UTC the eyewall maximum
began to switch to the 0 – 25 km eyewall bin, and by 1500 UTC the inner eyewall
contained a lightning strike density twice that of the 25 – 50 km bin.
In summary, although only two storms are documented in this study, the results
show promise for the use of continuous LLDN data to remotely infer the temporal
evolution of hurricane convective structure. It is the hope of the author that this thesis
will spur interest in the application of LLDN data to the challenges presented by tropical
cyclones.
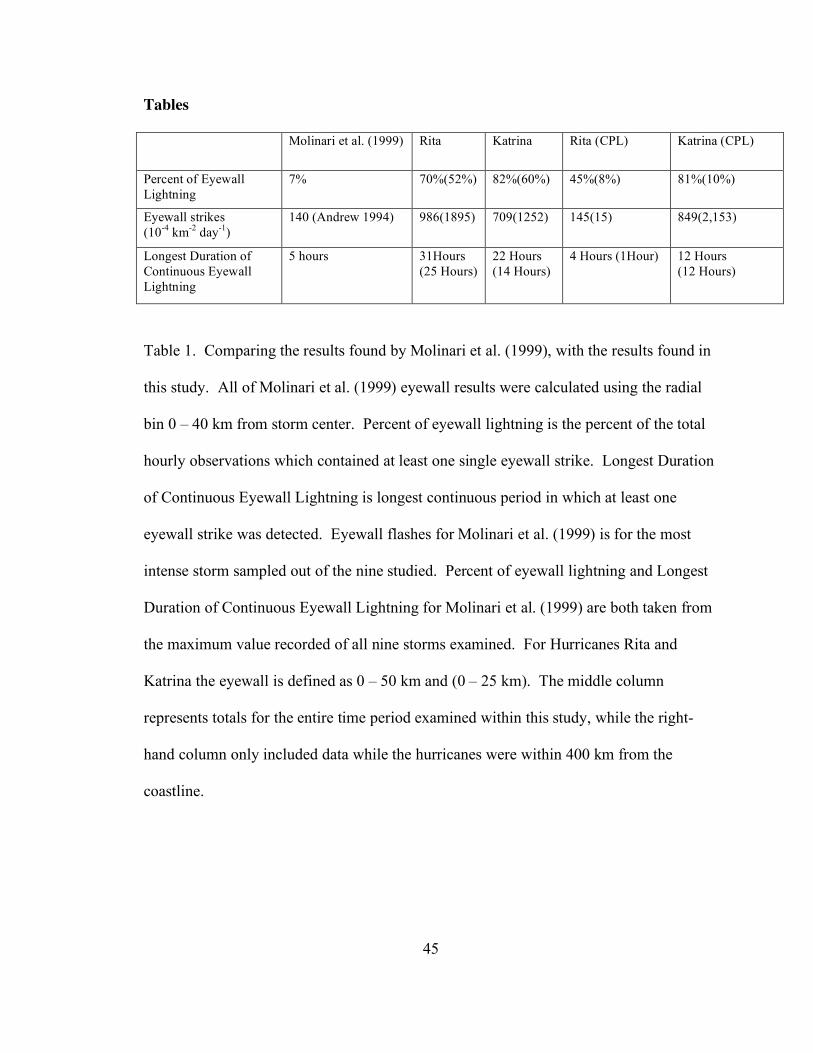
45
Tables
Molinari et al. (1999) Rita Katrina Rita (CPL) Katrina (CPL)
Percent of Eyewall Lightning
7% 70%(52%) 82%(60%) 45%(8%) 81%(10%)
Eyewall strikes (10-4 km-2 day-1)
140 (Andrew 1994) 986(1895) 709(1252) 145(15) 849(2,153)
Longest Duration of Continuous Eyewall Lightning
5 hours 31Hours (25 Hours)
22 Hours (14 Hours)
4 Hours (1Hour) 12 Hours (12 Hours)
Table 1. Comparing the results found by Molinari et al. (1999), with the results found in
this study. All of Molinari et al. (1999) eyewall results were calculated using the radial
bin 0 – 40 km from storm center. Percent of eyewall lightning is the percent of the total
hourly observations which contained at least one single eyewall strike. Longest Duration
of Continuous Eyewall Lightning is longest continuous period in which at least one
eyewall strike was detected. Eyewall flashes for Molinari et al. (1999) is for the most
intense storm sampled out of the nine studied. Percent of eyewall lightning and Longest
Duration of Continuous Eyewall Lightning for Molinari et al. (1999) are both taken from
the maximum value recorded of all nine storms examined. For Hurricanes Rita and
Katrina the eyewall is defined as 0 – 50 km and (0 – 25 km). The middle column
represents totals for the entire time period examined within this study, while the right-
hand column only included data while the hurricanes were within 400 km from the
coastline.
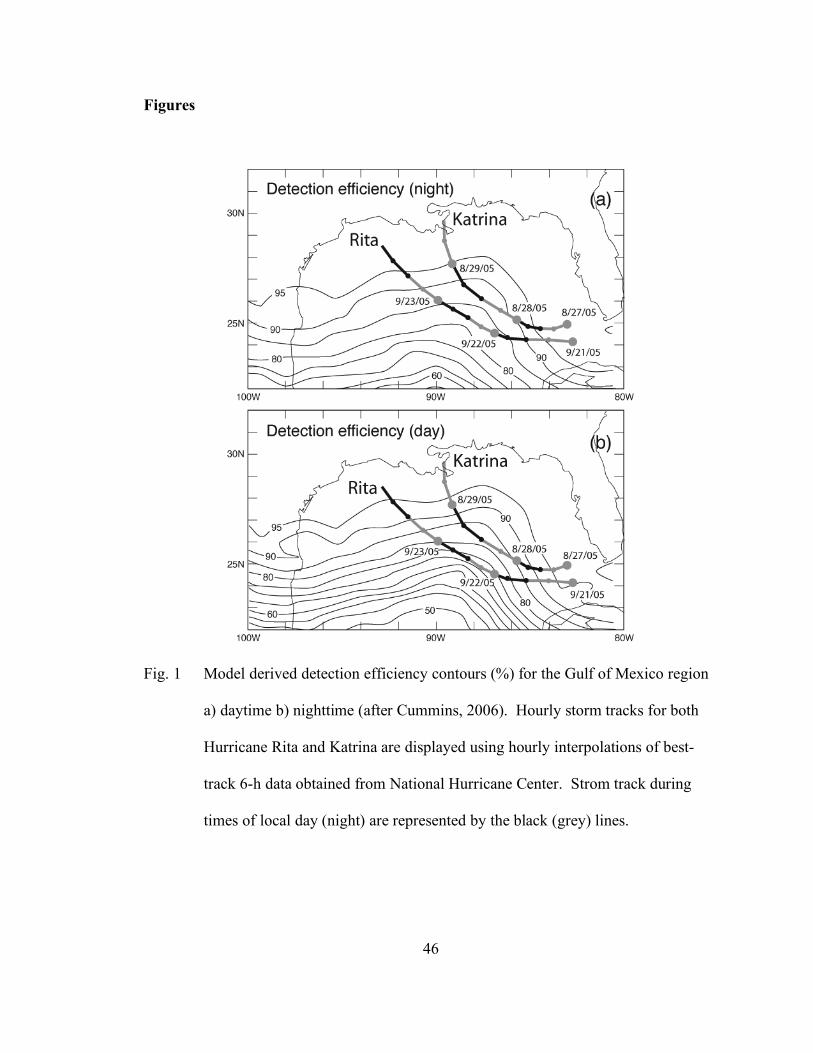
46
Figures
Fig. 1 Model derived detection efficiency contours (%) for the Gulf of Mexico region
a) daytime b) nighttime (after Cummins, 2006). Hourly storm tracks for both
Hurricane Rita and Katrina are displayed using hourly interpolations of best-
track 6-h data obtained from National Hurricane Center. Strom track during
times of local day (night) are represented by the black (grey) lines.
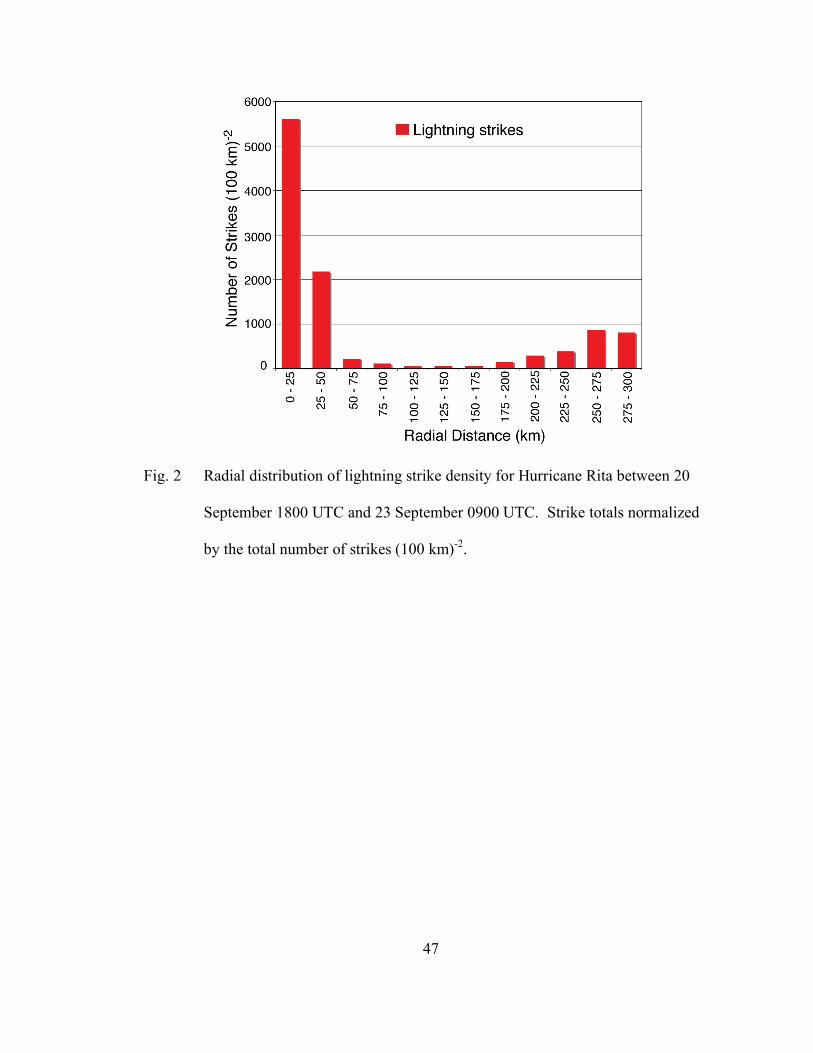
47
Fig. 2 Radial distribution of lightning strike density for Hurricane Rita between 20
September 1800 UTC and 23 September 0900 UTC. Strike totals normalized
by the total number of strikes (100 km)-2.
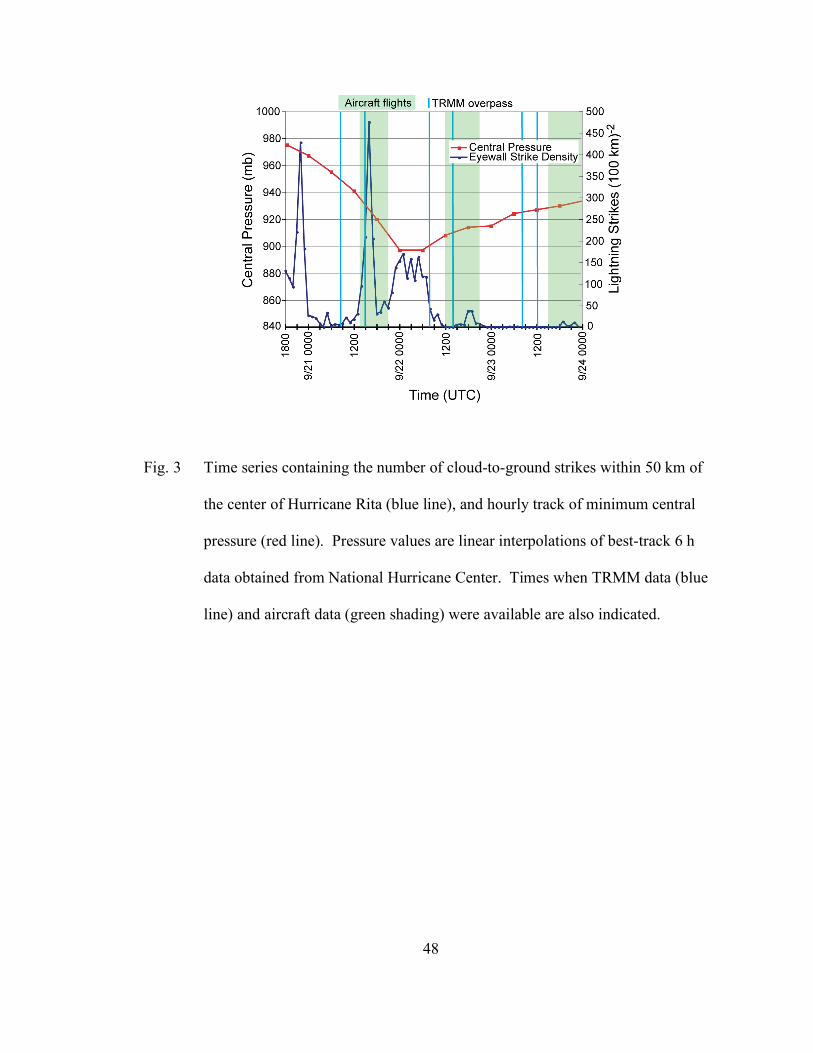
48
Fig. 3 Time series containing the number of cloud-to-ground strikes within 50 km of
the center of Hurricane Rita (blue line), and hourly track of minimum central
pressure (red line). Pressure values are linear interpolations of best-track 6 h
data obtained from National Hurricane Center. Times when TRMM data (blue
line) and aircraft data (green shading) were available are also indicated.
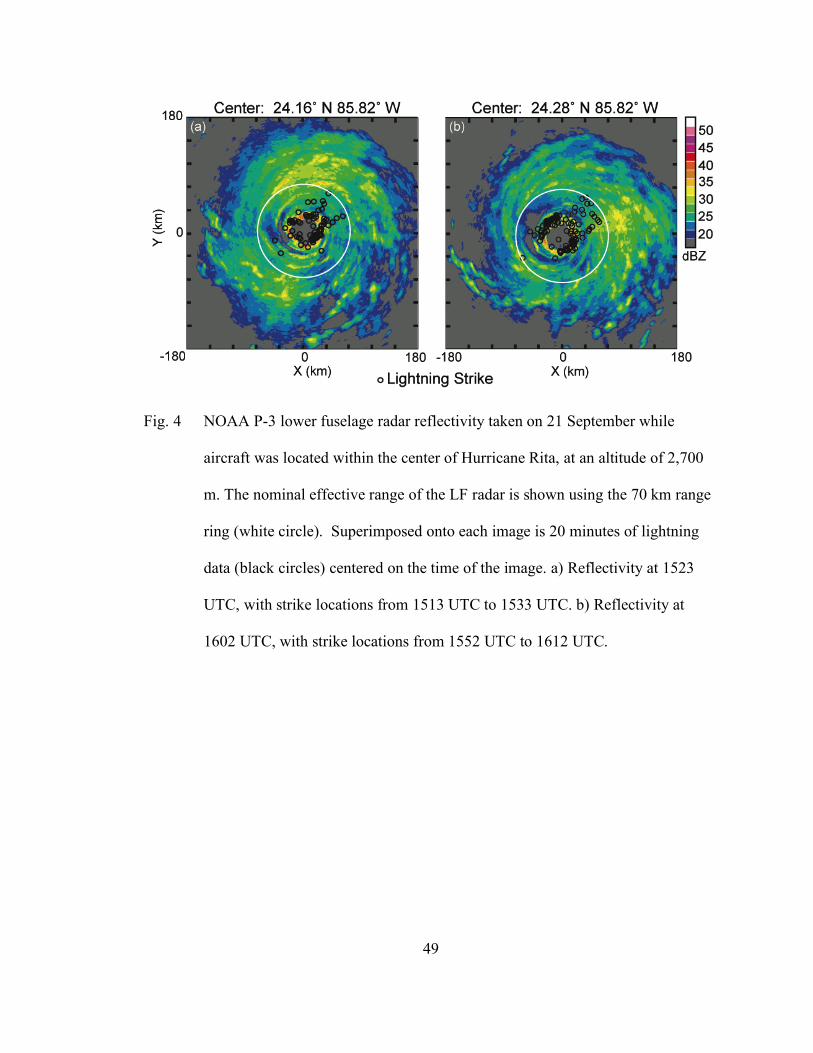
49
Fig. 4 NOAA P-3 lower fuselage radar reflectivity taken on 21 September while
aircraft was located within the center of Hurricane Rita, at an altitude of 2,700
m. The nominal effective range of the LF radar is shown using the 70 km range
ring (white circle). Superimposed onto each image is 20 minutes of lightning
data (black circles) centered on the time of the image. a) Reflectivity at 1523
UTC, with strike locations from 1513 UTC to 1533 UTC. b) Reflectivity at
1602 UTC, with strike locations from 1552 UTC to 1612 UTC.
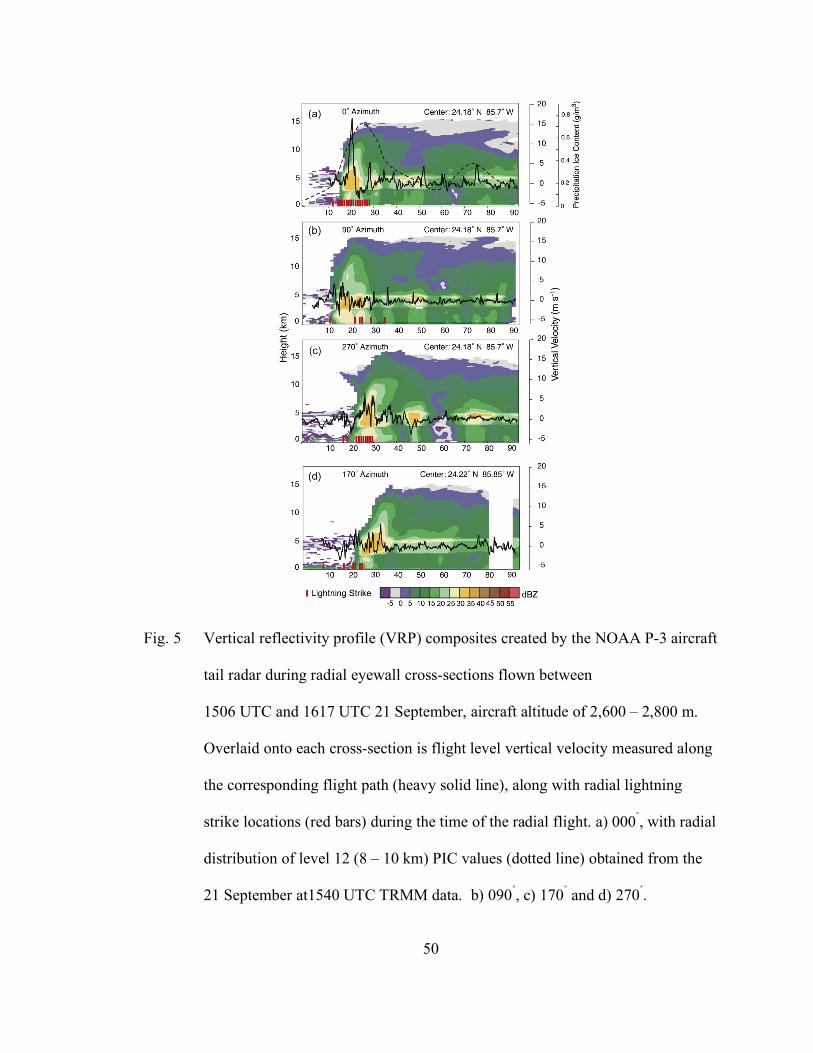
50
Fig. 5 Vertical reflectivity profile (VRP) composites created by the NOAA P-3 aircraft
tail radar during radial eyewall cross-sections flown between
1506 UTC and 1617 UTC 21 September, aircraft altitude of 2,600 – 2,800 m.
Overlaid onto each cross-section is flight level vertical velocity measured along
the corresponding flight path (heavy solid line), along with radial lightning
strike locations (red bars) during the time of the radial flight. a) 000˚, with radial
distribution of level 12 (8 – 10 km) PIC values (dotted line) obtained from the
21 September at1540 UTC TRMM data. b) 090˚, c) 170˚ and d) 270˚.
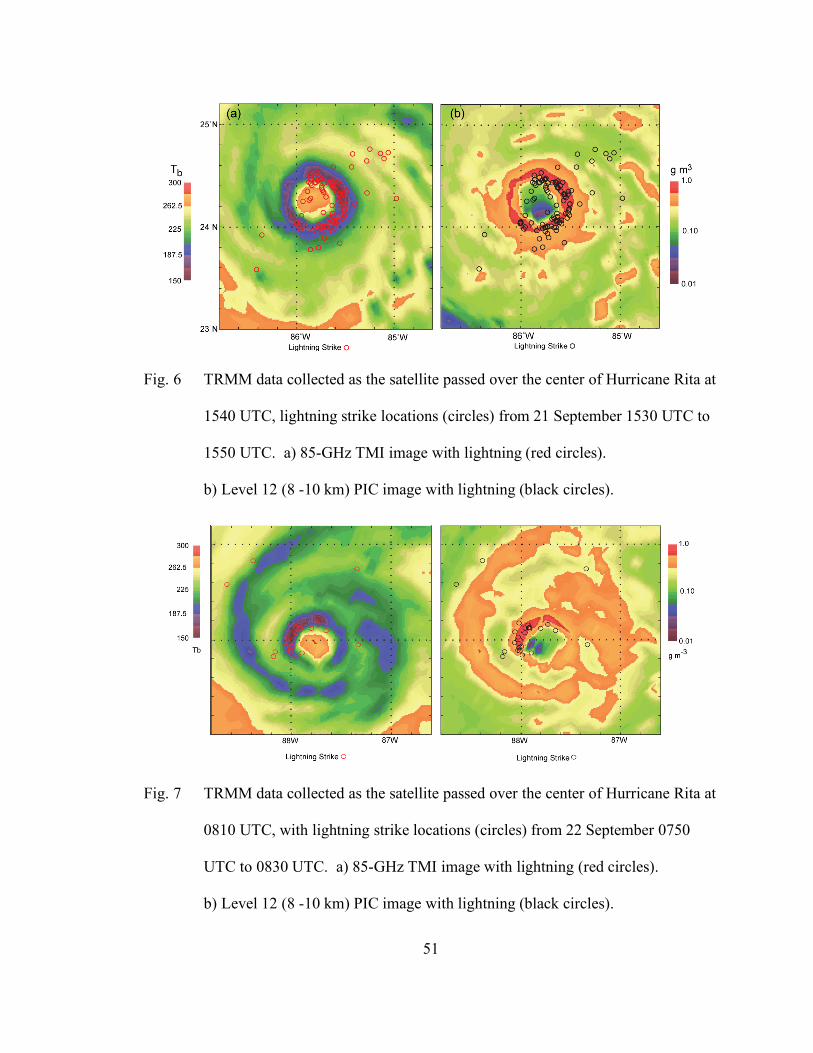
51
Fig. 6 TRMM data collected as the satellite passed over the center of Hurricane Rita at
1540 UTC, lightning strike locations (circles) from 21 September 1530 UTC to
1550 UTC. a) 85-GHz TMI image with lightning (red circles).
b) Level 12 (8 -10 km) PIC image with lightning (black circles).
Fig. 7 TRMM data collected as the satellite passed over the center of Hurricane Rita at
0810 UTC, with lightning strike locations (circles) from 22 September 0750
UTC to 0830 UTC. a) 85-GHz TMI image with lightning (red circles).
b) Level 12 (8 -10 km) PIC image with lightning (black circles).
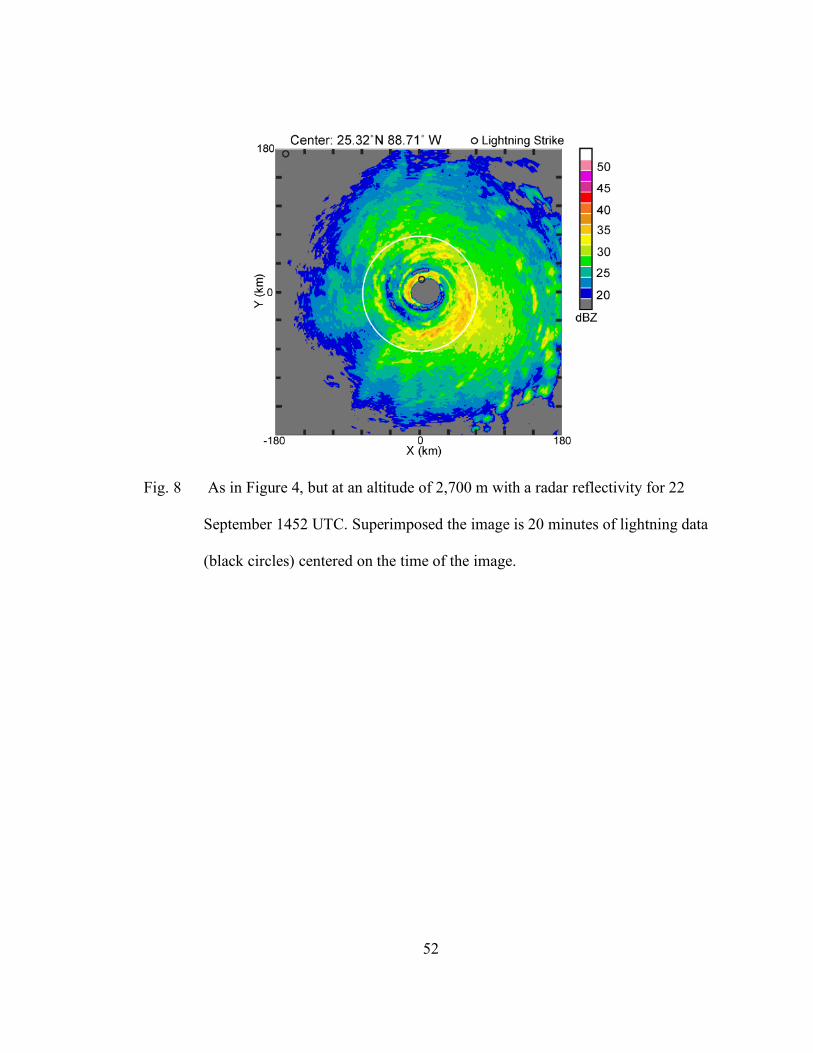
52
Fig. 8 As in Figure 4, but at an altitude of 2,700 m with a radar reflectivity for 22
September 1452 UTC. Superimposed the image is 20 minutes of lightning data
(black circles) centered on the time of the image.
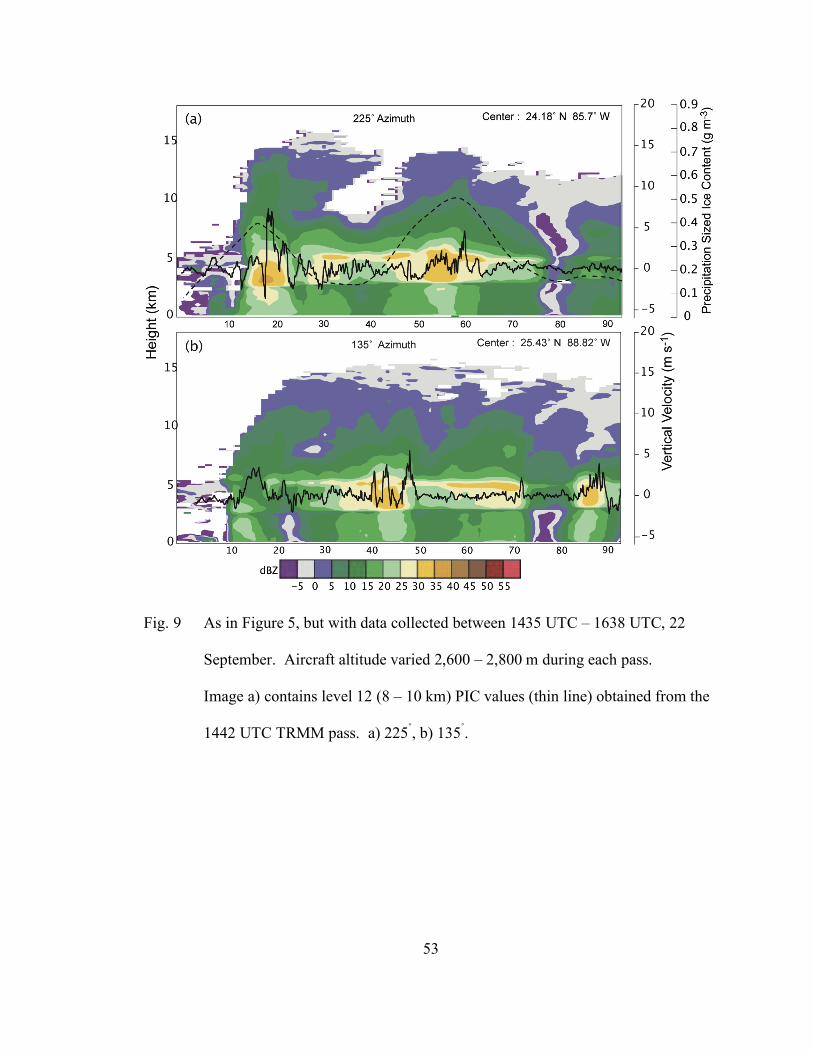
53
Fig. 9 As in Figure 5, but with data collected between 1435 UTC – 1638 UTC, 22
September. Aircraft altitude varied 2,600 – 2,800 m during each pass.
Image a) contains level 12 (8 – 10 km) PIC values (thin line) obtained from the
1442 UTC TRMM pass. a) 225˚, b) 135˚.
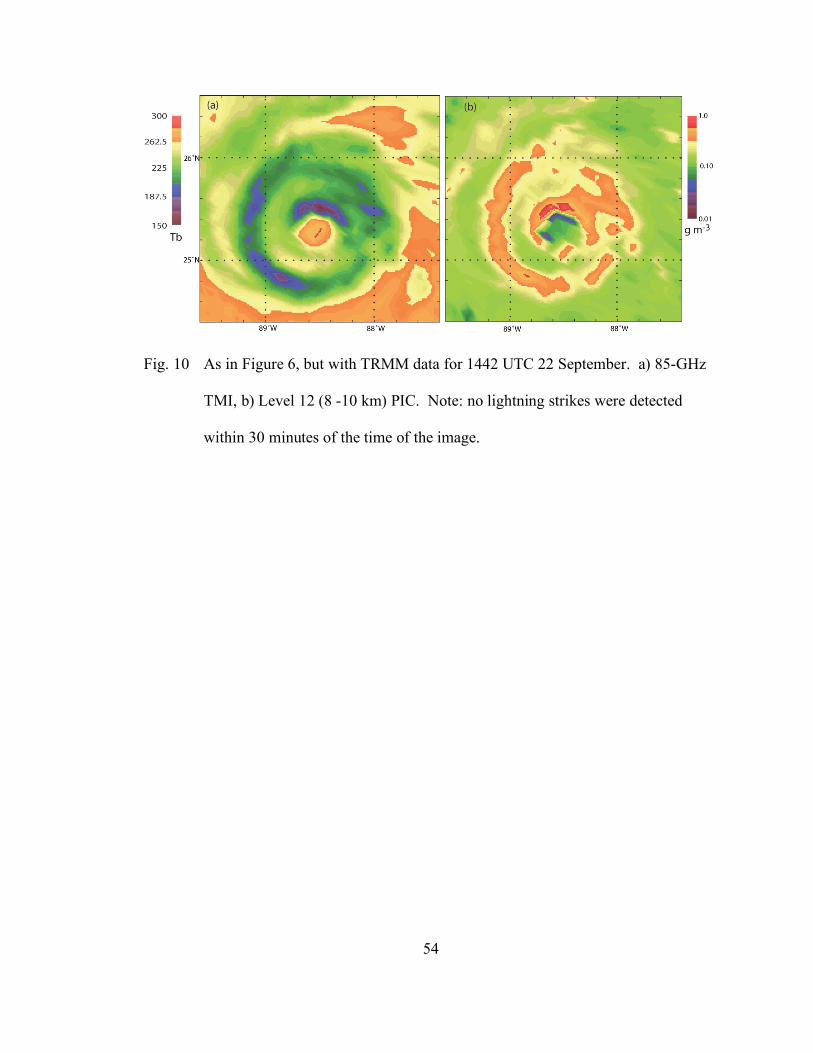
54
Fig. 10 As in Figure 6, but with TRMM data for 1442 UTC 22 September. a) 85-GHz
TMI, b) Level 12 (8 -10 km) PIC. Note: no lightning strikes were detected
within 30 minutes of the time of the image.
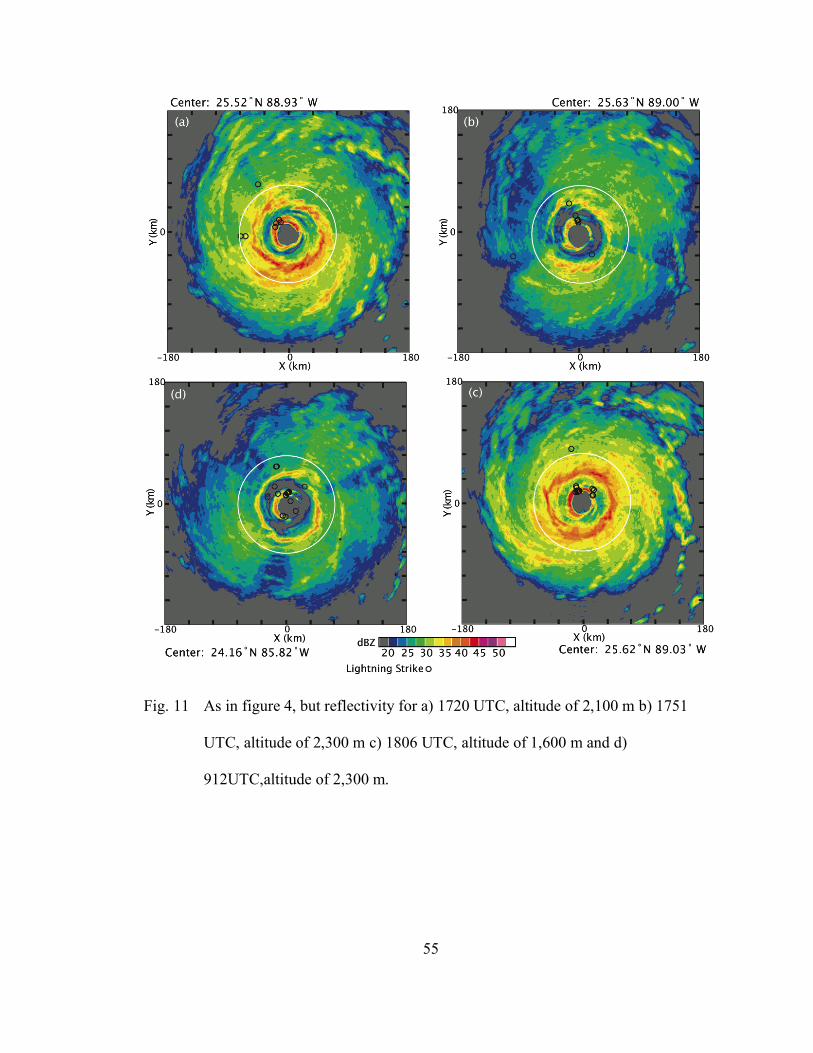
55
Fig. 11 As in figure 4, but reflectivity for a) 1720 UTC, altitude of 2,100 m b) 1751
UTC, altitude of 2,300 m c) 1806 UTC, altitude of 1,600 m and d)
912UTC,altitude of 2,300 m.
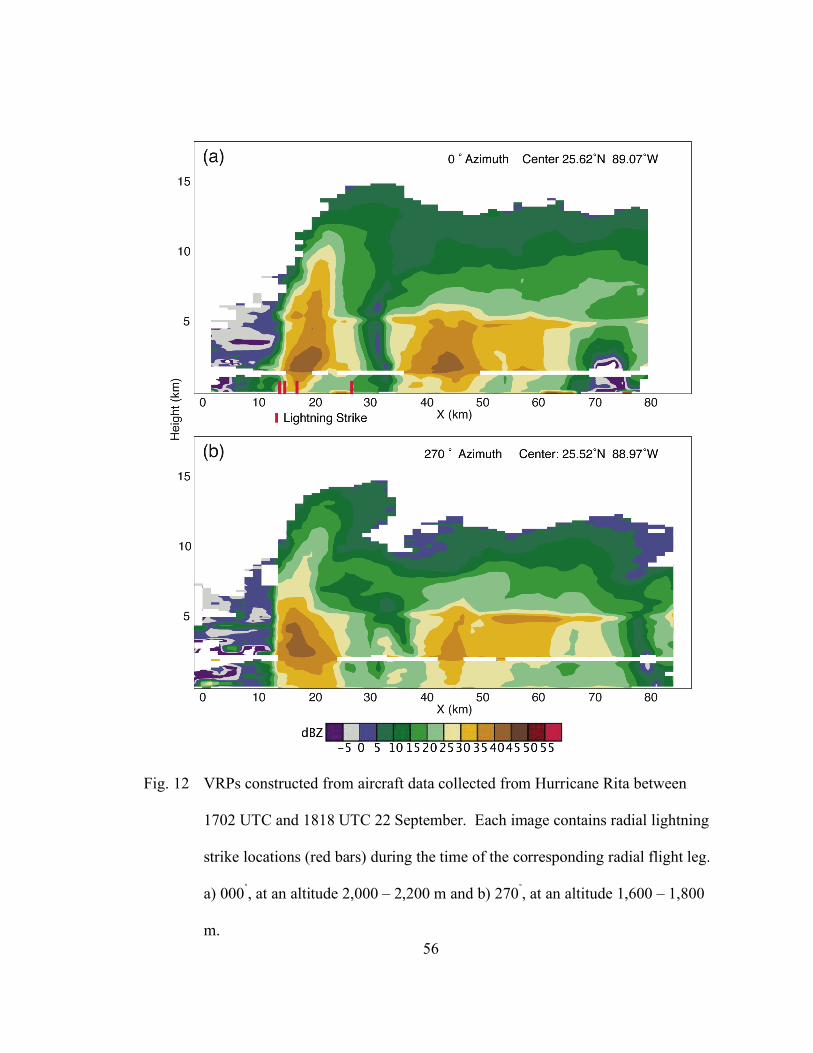
56
Fig. 12 VRPs constructed from aircraft data collected from Hurricane Rita between
1702 UTC and 1818 UTC 22 September. Each image contains radial lightning
strike locations (red bars) during the time of the corresponding radial flight leg.
a) 000˚, at an altitude 2,000 – 2,200 m and b) 270˚, at an altitude 1,600 – 1,800
m.
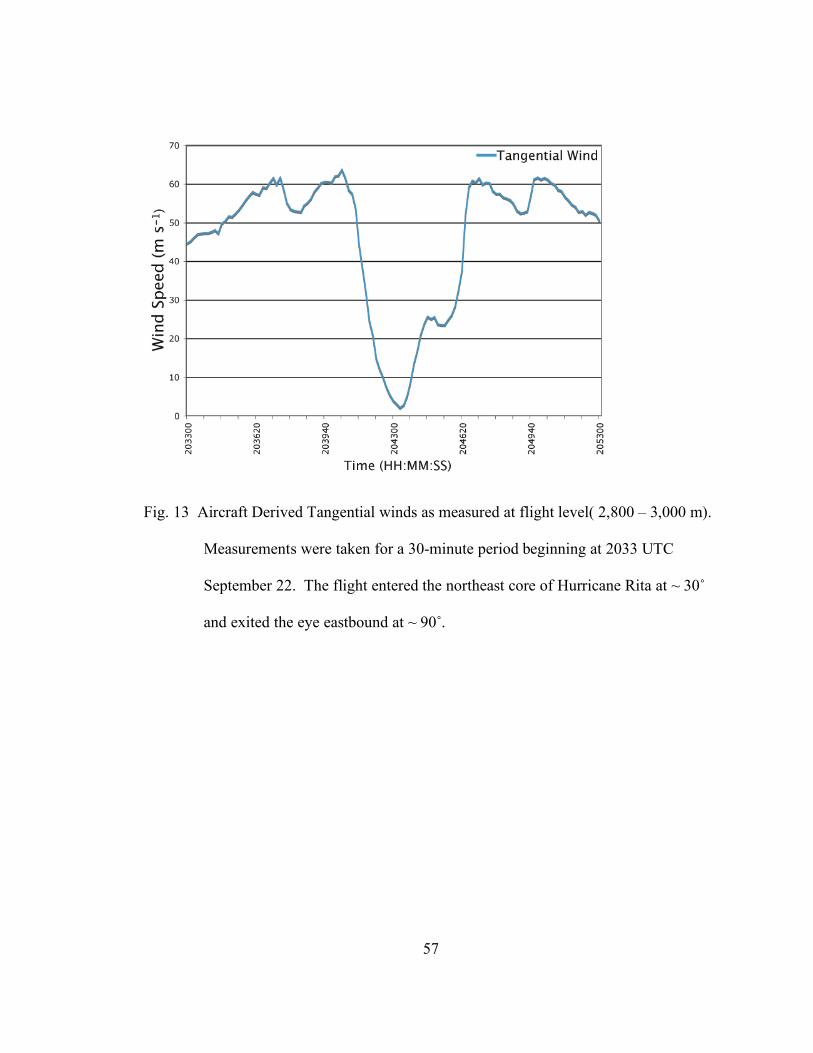
57
Fig. 13 Aircraft Derived Tangential winds as measured at flight level( 2,800 – 3,000 m).
Measurements were taken for a 30-minute period beginning at 2033 UTC
September 22. The flight entered the northeast core of Hurricane Rita at ~ 30˚
and exited the eye eastbound at ~ 90˚.
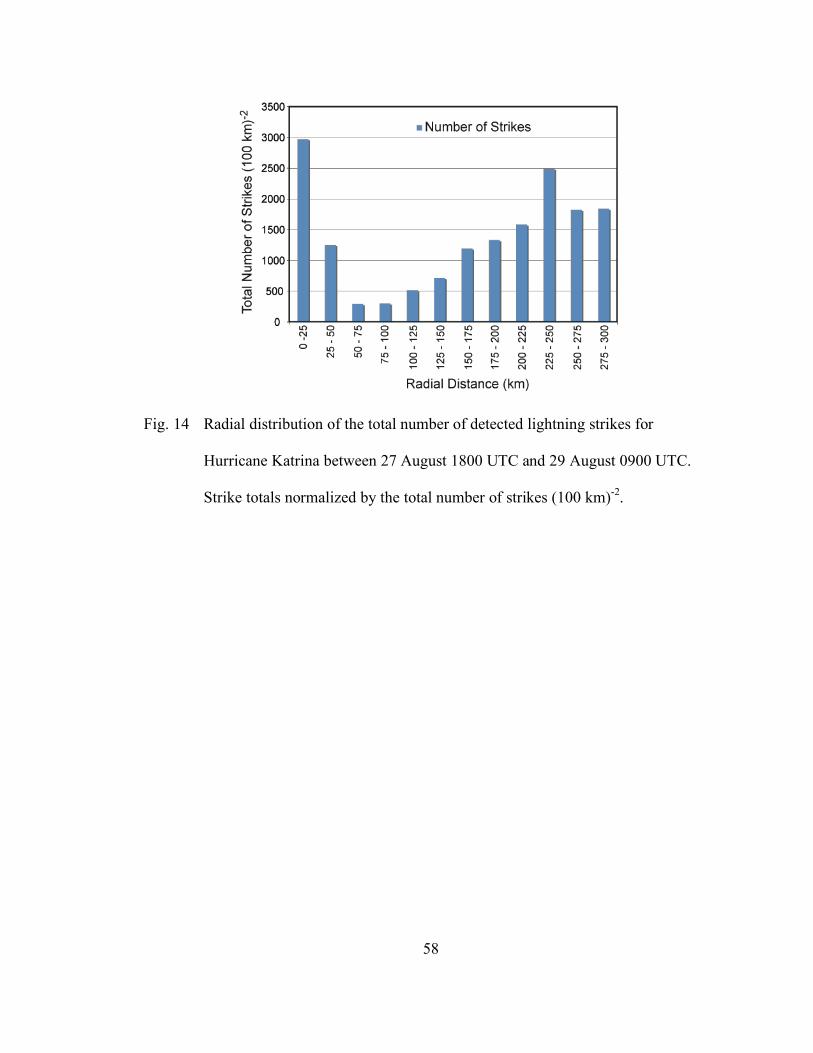
58
Fig. 14 Radial distribution of the total number of detected lightning strikes for
Hurricane Katrina between 27 August 1800 UTC and 29 August 0900 UTC.
Strike totals normalized by the total number of strikes (100 km)-2.
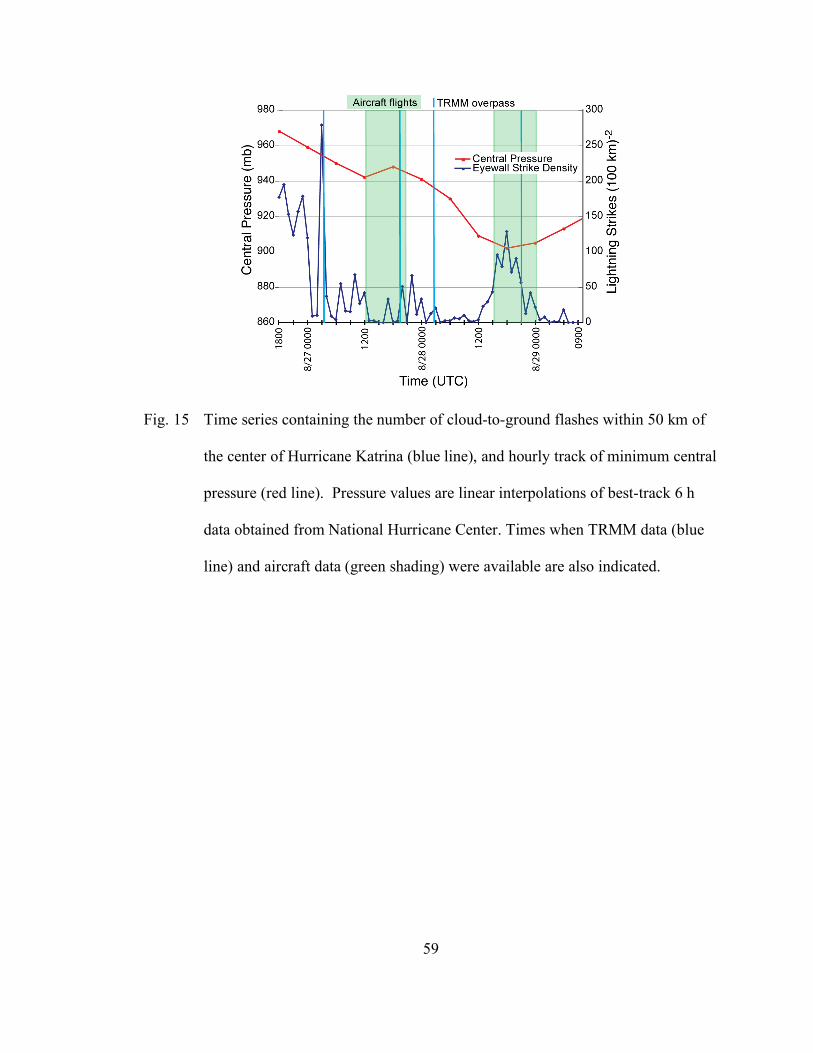
59
Fig. 15 Time series containing the number of cloud-to-ground flashes within 50 km of
the center of Hurricane Katrina (blue line), and hourly track of minimum central
pressure (red line). Pressure values are linear interpolations of best-track 6 h
data obtained from National Hurricane Center. Times when TRMM data (blue
line) and aircraft data (green shading) were available are also indicated.
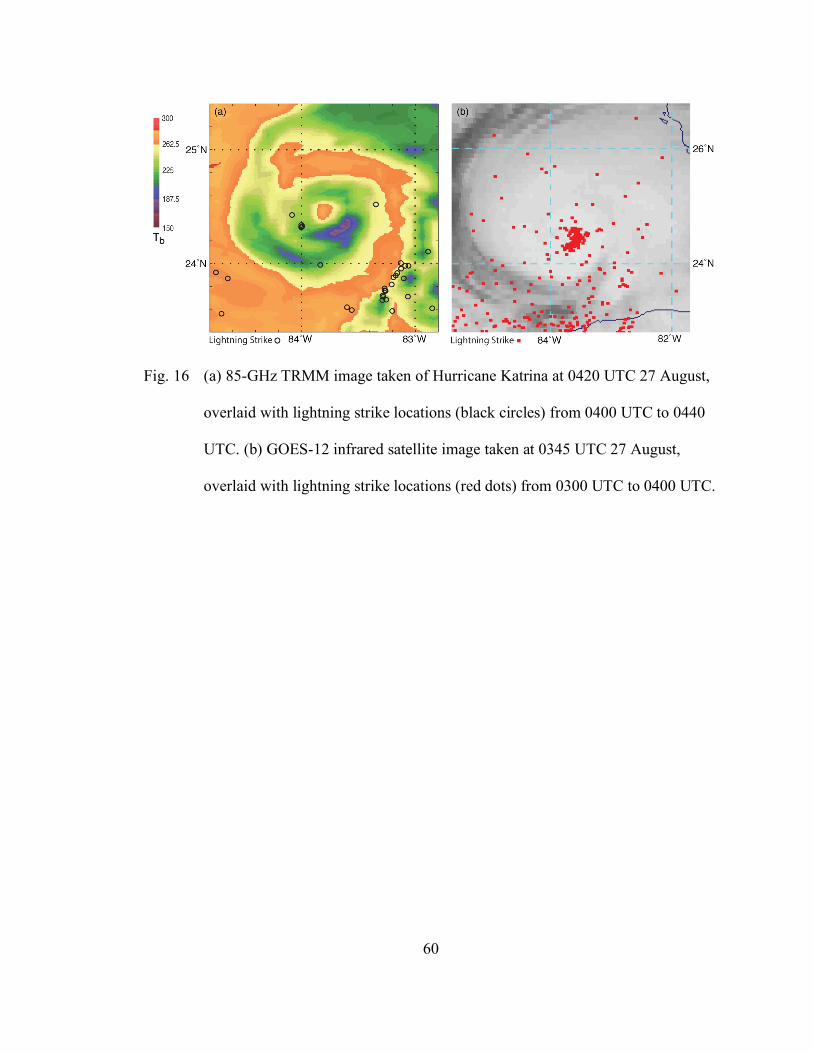
60
Fig. 16 (a) 85-GHz TRMM image taken of Hurricane Katrina at 0420 UTC 27 August,
overlaid with lightning strike locations (black circles) from 0400 UTC to 0440
UTC. (b) GOES-12 infrared satellite image taken at 0345 UTC 27 August,
overlaid with lightning strike locations (red dots) from 0300 UTC to 0400 UTC.
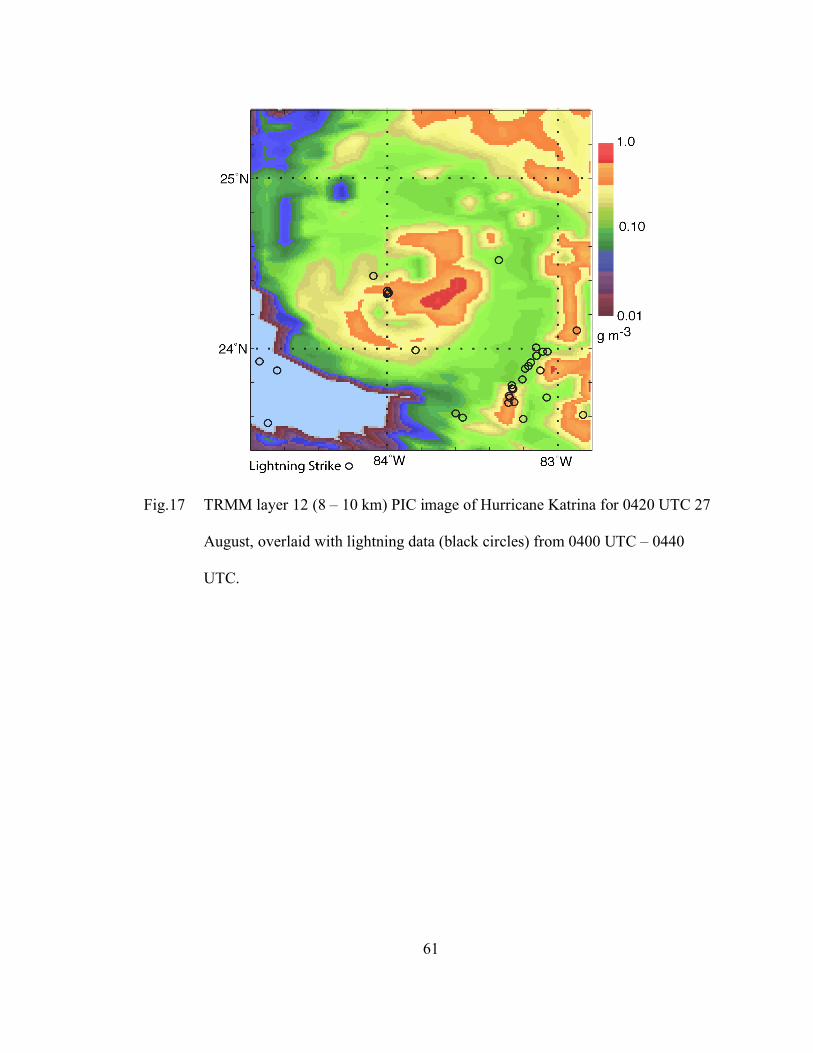
61
Fig.17 TRMM layer 12 (8 – 10 km) PIC image of Hurricane Katrina for 0420 UTC 27
August, overlaid with lightning data (black circles) from 0400 UTC – 0440
UTC.
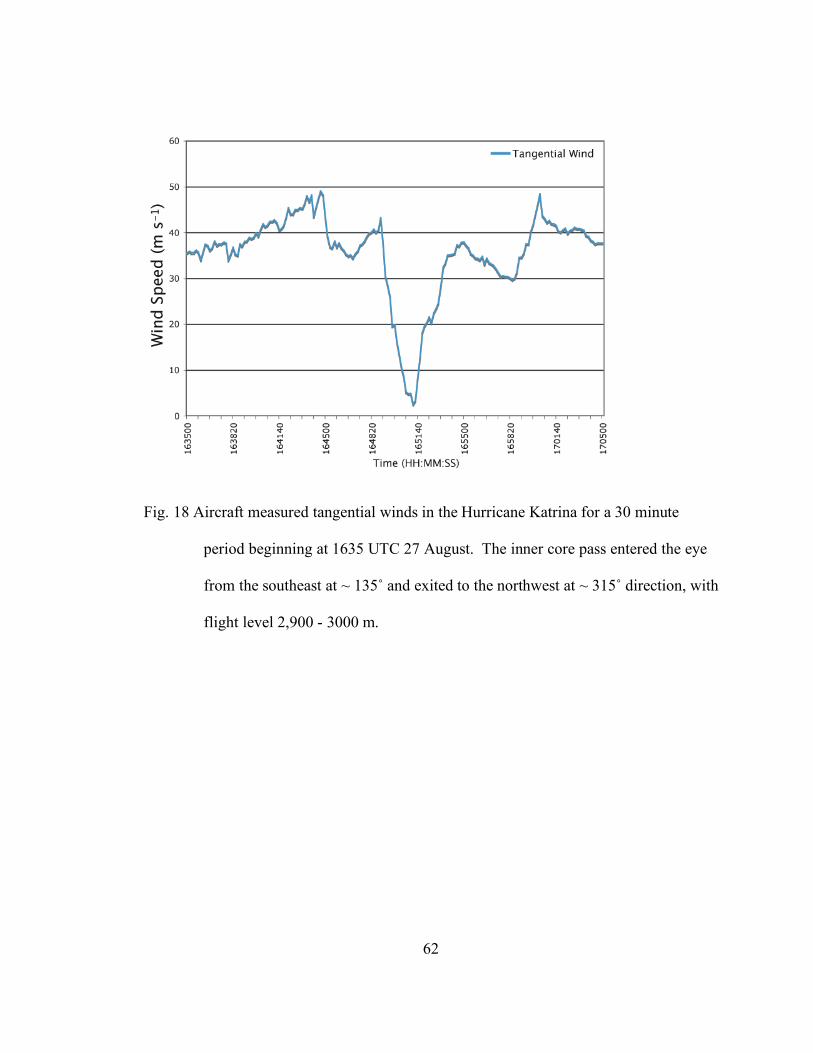
62
Fig. 18 Aircraft measured tangential winds in the Hurricane Katrina for a 30 minute
period beginning at 1635 UTC 27 August. The inner core pass entered the eye
from the southeast at ~ 135˚ and exited to the northwest at ~ 315˚ direction, with
flight level 2,900 - 3000 m.
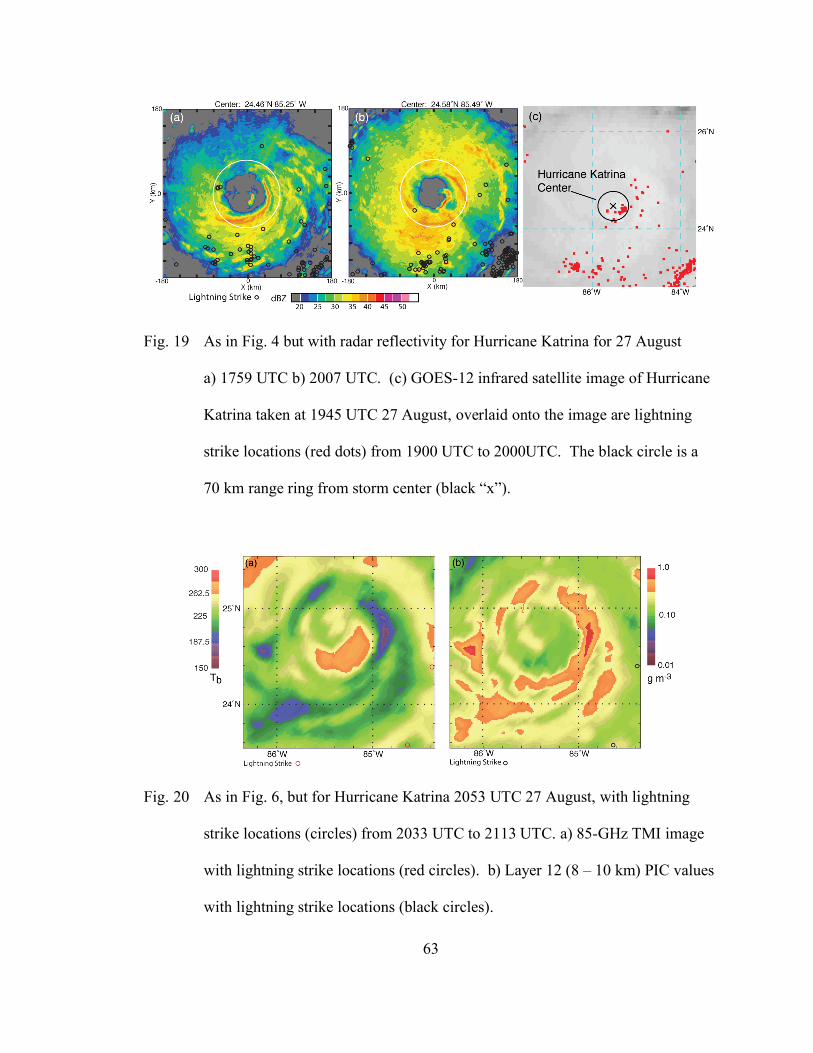
63
Fig. 19 As in Fig. 4 but with radar reflectivity for Hurricane Katrina for 27 August
a) 1759 UTC b) 2007 UTC. (c) GOES-12 infrared satellite image of Hurricane
Katrina taken at 1945 UTC 27 August, overlaid onto the image are lightning
strike locations (red dots) from 1900 UTC to 2000UTC. The black circle is a
70 km range ring from storm center (black “x”).
Fig. 20 As in Fig. 6, but for Hurricane Katrina 2053 UTC 27 August, with lightning
strike locations (circles) from 2033 UTC to 2113 UTC. a) 85-GHz TMI image
with lightning strike locations (red circles). b) Layer 12 (8 – 10 km) PIC values
with lightning strike locations (black circles).
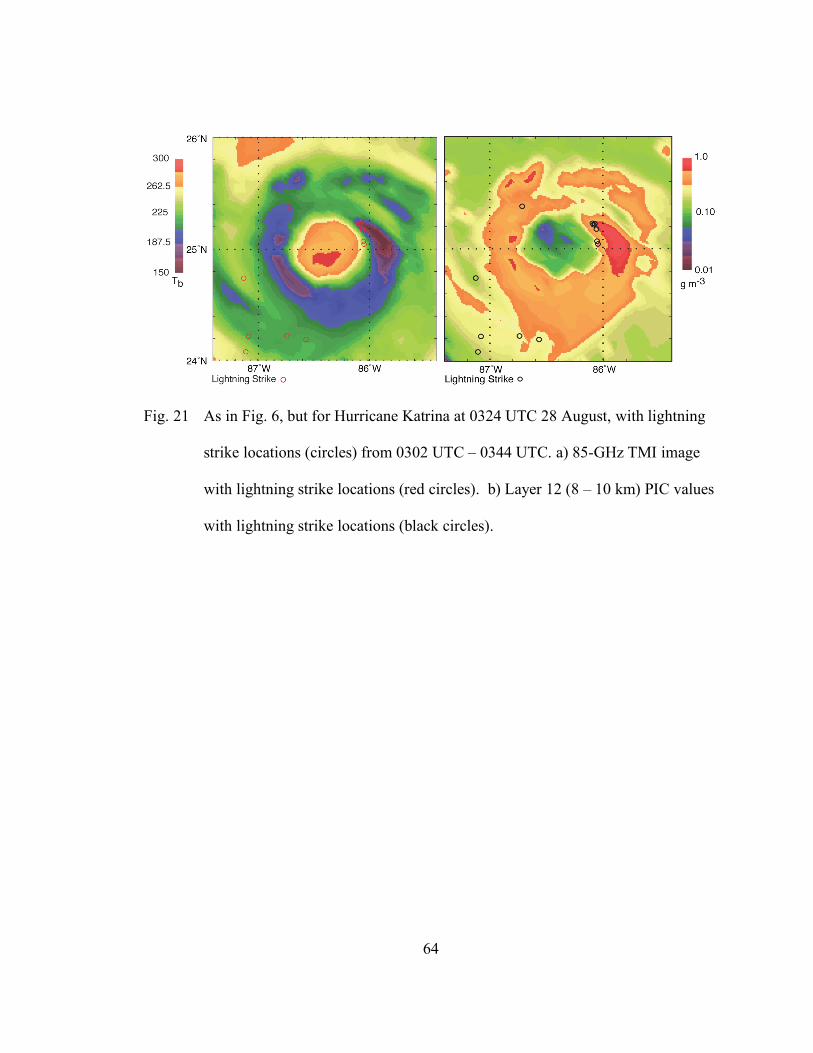
64
Fig. 21 As in Fig. 6, but for Hurricane Katrina at 0324 UTC 28 August, with lightning
strike locations (circles) from 0302 UTC – 0344 UTC. a) 85-GHz TMI image
with lightning strike locations (red circles). b) Layer 12 (8 – 10 km) PIC values
with lightning strike locations (black circles).
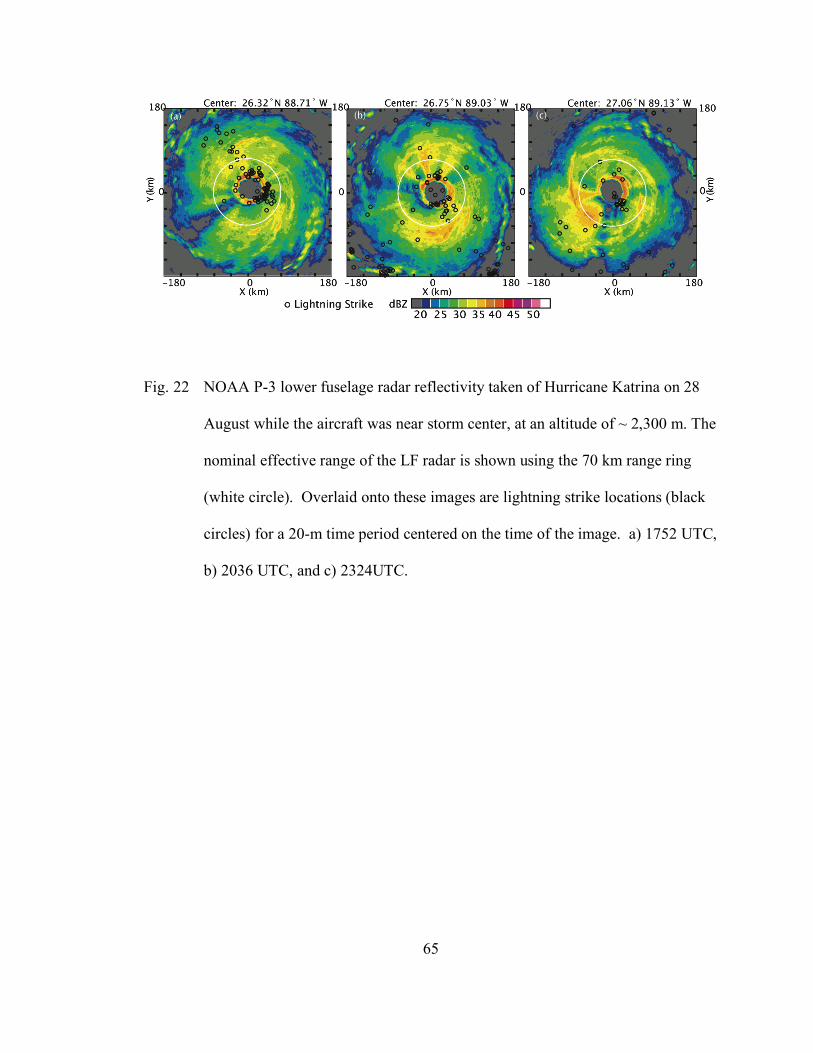
65
Fig. 22 NOAA P-3 lower fuselage radar reflectivity taken of Hurricane Katrina on 28
August while the aircraft was near storm center, at an altitude of ~ 2,300 m. The
nominal effective range of the LF radar is shown using the 70 km range ring
(white circle). Overlaid onto these images are lightning strike locations (black
circles) for a 20-m time period centered on the time of the image. a) 1752 UTC,
b) 2036 UTC, and c) 2324UTC.
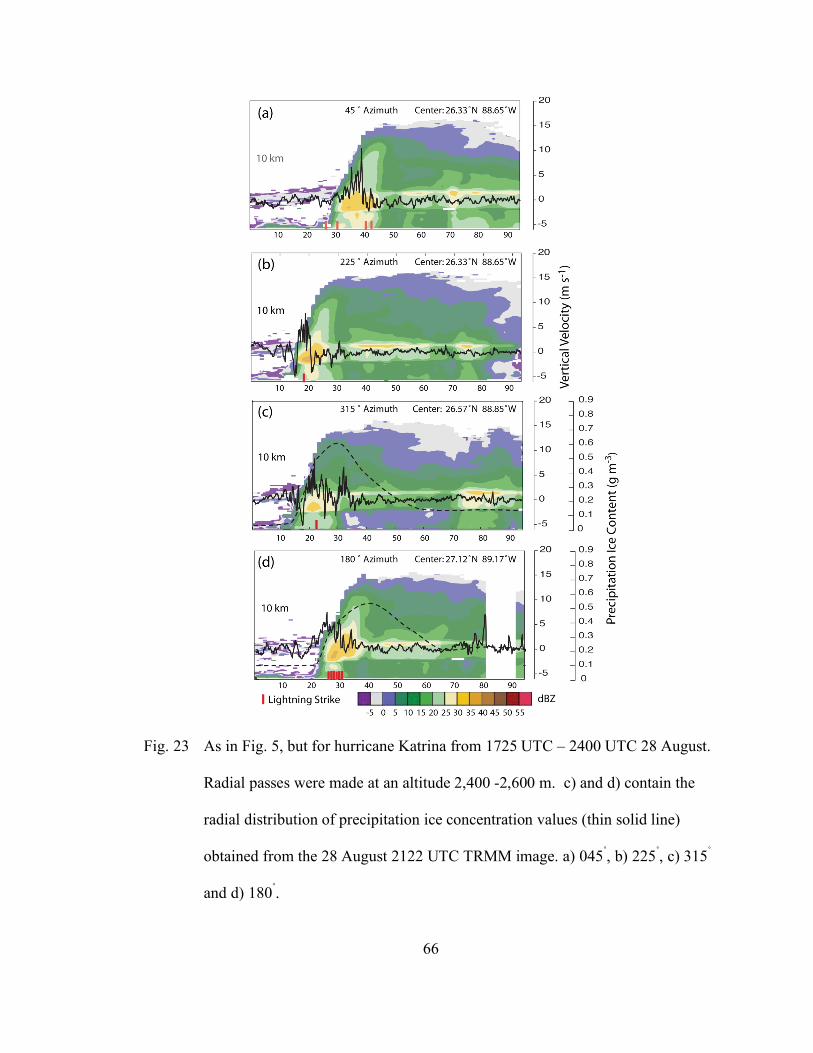
66
Fig. 23 As in Fig. 5, but for hurricane Katrina from 1725 UTC – 2400 UTC 28 August.
Radial passes were made at an altitude 2,400 -2,600 m. c) and d) contain the
radial distribution of precipitation ice concentration values (thin solid line)
obtained from the 28 August 2122 UTC TRMM image. a) 045˚, b) 225˚, c) 315˚
and d) 180˚.
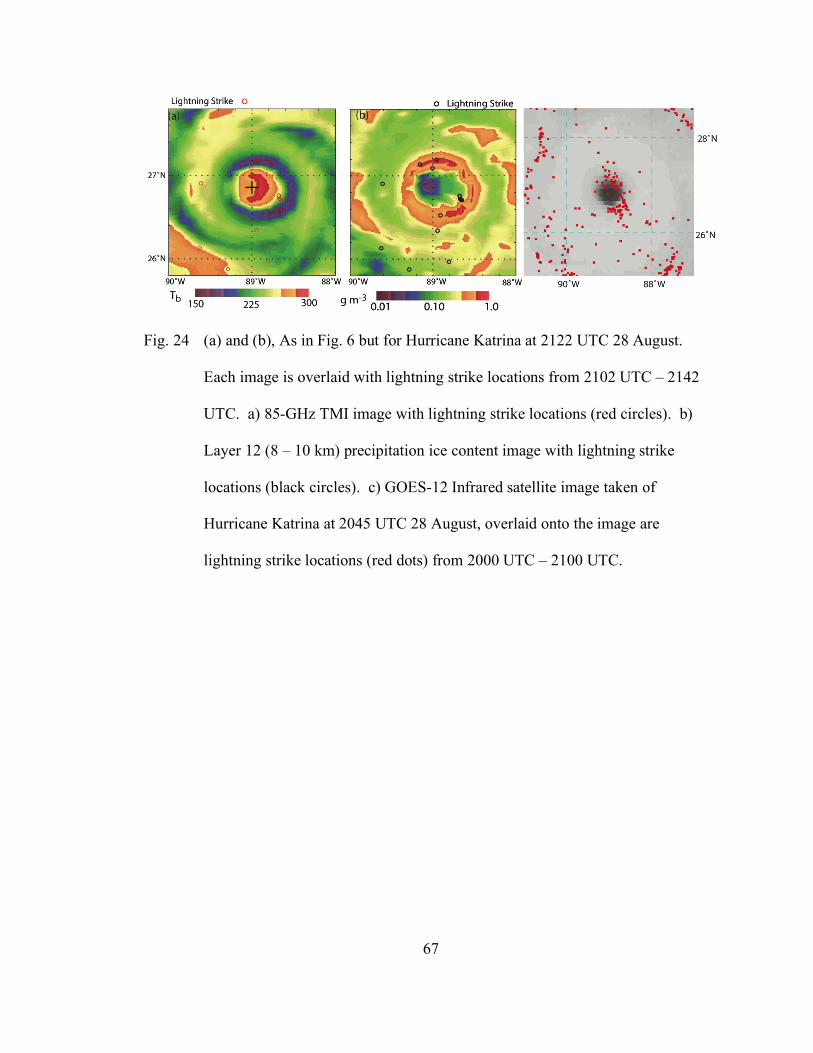
67
Fig. 24 (a) and (b), As in Fig. 6 but for Hurricane Katrina at 2122 UTC 28 August.
Each image is overlaid with lightning strike locations from 2102 UTC – 2142
UTC. a) 85-GHz TMI image with lightning strike locations (red circles). b)
Layer 12 (8 – 10 km) precipitation ice content image with lightning strike
locations (black circles). c) GOES-12 Infrared satellite image taken of
Hurricane Katrina at 2045 UTC 28 August, overlaid onto the image are
lightning strike locations (red dots) from 2000 UTC – 2100 UTC.
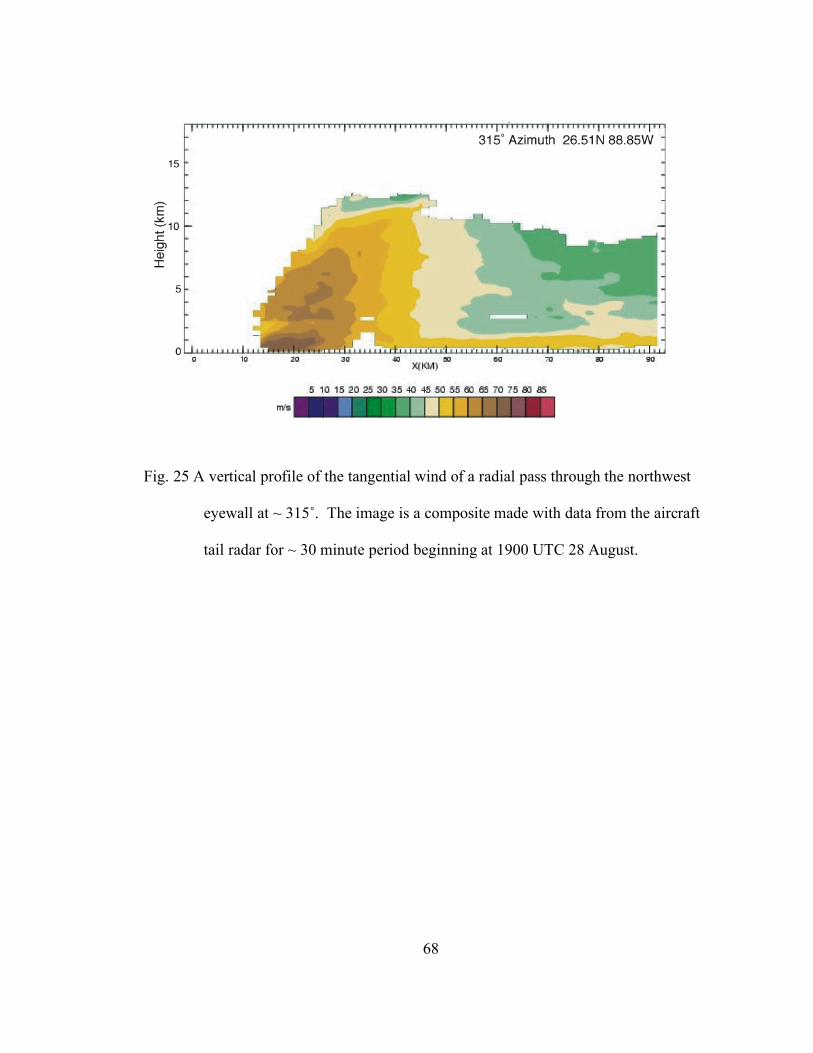
68
Fig. 25 A vertical profile of the tangential wind of a radial pass through the northwest
eyewall at ~ 315˚. The image is a composite made with data from the aircraft
tail radar for ~ 30 minute period beginning at 1900 UTC 28 August.
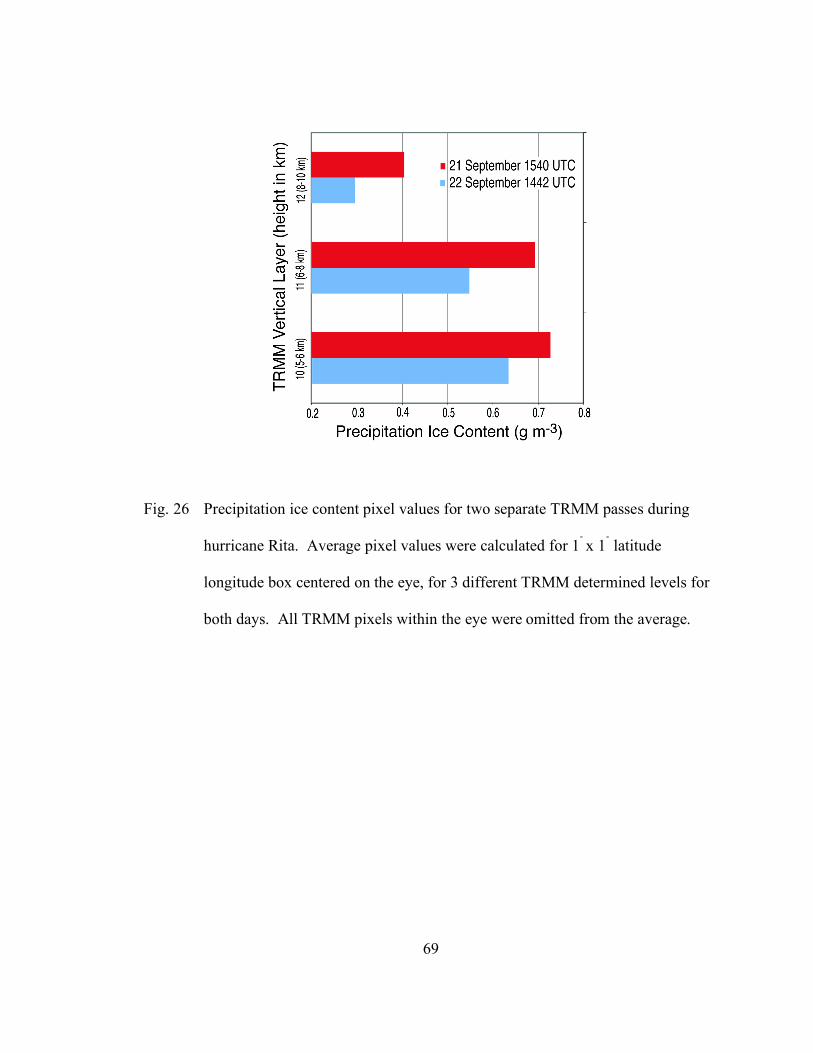
69
Fig. 26 Precipitation ice content pixel values for two separate TRMM passes during
hurricane Rita. Average pixel values were calculated for 1˚ x 1˚ latitude
longitude box centered on the eye, for 3 different TRMM determined levels for
both days. All TRMM pixels within the eye were omitted from the average.
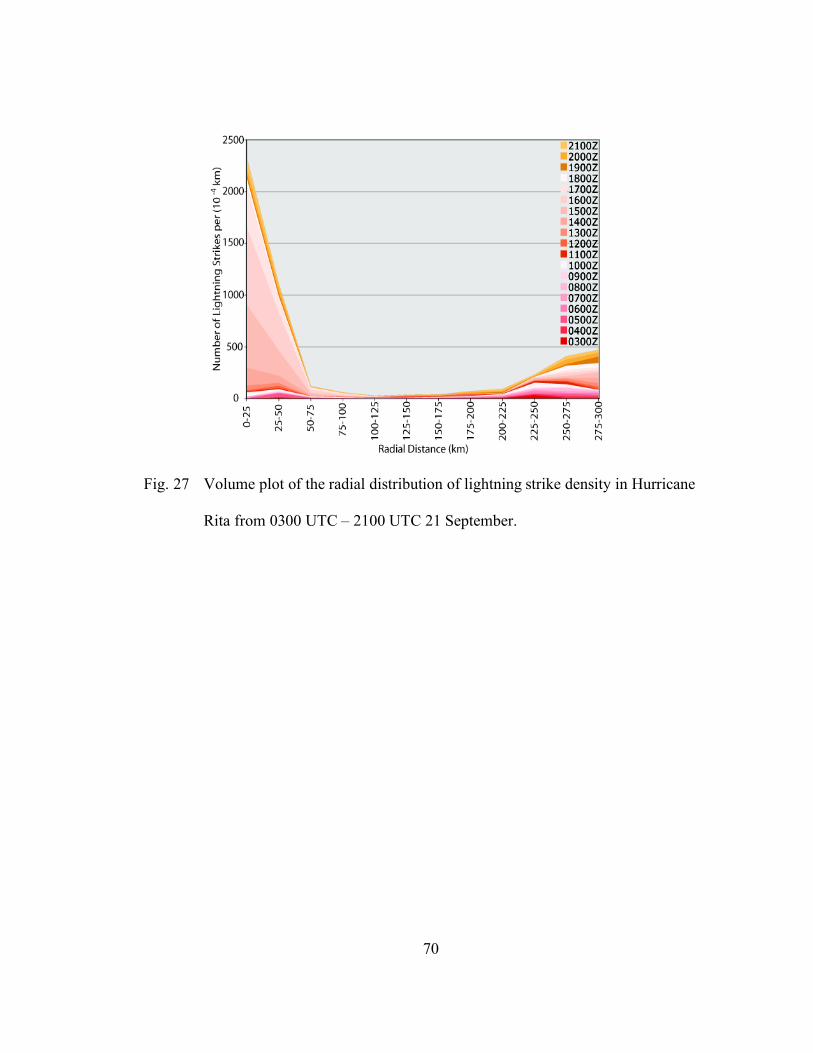
70
Fig. 27 Volume plot of the radial distribution of lightning strike density in Hurricane
Rita from 0300 UTC – 2100 UTC 21 September.
71
References
Alexander, G. David, Weinman, James A., Karyampudi, V. Mohan, Olson, William S.,
Lee, A. C. L. 1999: The Effect of Assimilating Rain Rates Derived from Satellites
and Lightning on Forecasts of the 1993 Superstorm. Monthly Weather Review: Vol.
127, No. 7, pp. 1433-1457.
Beard, K.V.K., and H. T. Ochs., 1986: Charging mechanisms in clouds and
thunderstorms, in the earth's electrical environment, pp. 114-130, National
Academy Press, Washington D.C.
Black, M. L., R. W. Burpee, and F. D. Marks Jr., 1996: Vertical motion characteristics of
tropical cyclones determined with airborne Doppler radial velocities. J. Atmos. Sci.,
53, 1887-1909.
Black, R. A., 1990: Radar reflectivity-ice water content relationships for use above the
melting level in hurricanes. J. Appl. Meteor., 29, 955 – 961.
_____, H. B. Bluestein, M. L. Black, and J. Hallett 1994: Unusually strong vertical
motions in a Caribbean hurricane. Mon. Wea. Rev., 122, 2722-2739.
_____, and J. Hallett, 1986: Observations of the distribution of ice in hurricanes. J.
Atmos. Sci., 43, 802-822.
____, and ___, 1999: Electrification of the hurricane. J. Atmos. Sci., 56, 2004-2028.
Bogner, P. B., G. M. Barnes, and J. L. Franklin, 2000: Conditional instability and shear
for six hurricanes over the atlantic ocean. Weather and Forecasting., 15, 192 – 207.
Cecil, D. J., and E. J. Zipser, 1999: Relationships between tropical cyclone intensity and
satellite-based indicators of inner core convection: 85-GHz ice-scattering signature
and lightning. Mon. Wea. Rev., 127, 103-123.
72
____, ___, and S. W. Nesbitt, 2002: Reflectivity, ice scattering, and lightning
characteristics of hurricane eyewalls and rainbands. Part I: quantitative description.
Mon. Wea. Rev., 130, 771-784.
___, ___, and ___, 2002: Reflectivity, ice scattering, and lightning characteristics of
hurricane eyewalls and rainbands. Part II: intercomparison of observations. Mon.
Wea. Rev., 130, 785-801.
Chang, Dong-Eon, Weinman, J. A., Morales, C. A., Olson, William S. 2001: The Effect
of Spaceborne Microwave and Ground-Based Continuous Lightning Measurements
on Forecasts of the 1998 Groundhog Day Storm. Monthly Weather Review: Vol.
129, No. 8, pp. 1809-1833.
Corbosiero, K. L., and J. Molinari, 2003: The relationship between storm motion, vertical
wind shear, and convective asymmetries in tropical cyclones. J. Atmos. Sci., 60,
366-376.
___, Molinari, J., M. L. Black, 2005: The Structure and Evolution of Hurricane Elena
(1985). Part I: symmetric intensification. Mon. Wea. Rev., 133, 2905-2921.
Cramer, J. A., and K. L. Cummins, 1999: Long-Range and Trans-Oceanic Lightning
Detection, Proceedings of the 11th International Conference on Atmospheric
Electricity, Guntersville, AL, June 7-11.
Cummins, K. L., 2006: Vaisala long-range lightning network: Progress report. Preprints,
19th international lightning detection conference, Tucson, AZ, April 24-25.
___, M. J. Murphy, E. A. Bardo, W. L. Hiscoz, R. D. Pyle, and A. E. Pifer, 1998: A
combined TOA/MDF technology upgrade of the U.S. National Lightning Detection
Network. J. Geophys. Res., 103, 9035-9044.
73
___, R. B. Pyle, and G. Fournier, 1999: An Integrated North American Lightning
Detection Network, Proceedings of the 11th International Conference on
Atmospheric Electricity, Guntersville, AL, June 7-11.
Demetriades, N. W., and R. L. Holle, 2005: Long-range lightning applications for
hurricane intensity. Preprints, Conf. Meteorological Applications of Lightning
Data, San Diego, CA, Amer. Meteor. Soc., P2.8.
___, and R. L. Holle, 2006: Long range lightning nowcasting applications for tropical
cyclones. Preprints, 2nd Conf. Meteorological Applications of Lightning Data,
Atlanta, GA, Amer. Meteor. Soc., P2.15.
Emanuel, K. A., 1986: An air-sea interaction theory for tropical cyclones. Part I: steady-
state maintenance. J. Atmos. Sci., 43, 585 – 605.
Fiorino, S. T., and E. A. Smith., 2006: Critical assessment of microphysical assumptions
within TRMM radiometer rain profile algorithm using satellite, aircraft, and surface
datasets from KWAJEX. J. Appl. Meteor., 45, 754 – 786.
Gamanche, J. F., R. A. Houze., and F. D. Marks Jr., 1993: Dual-aircraft investigation of
the inner core of Hurricane Norbert. J. Atmos. Sci., 50, 3221 – 3243.
Gray, W. M., 1965: Calculations of cumulus vertical draft velocities in hurricanes from
aircraft observations. J. Appl. Meteor., 4, 463-474.
Jorgensen, D. P., 1984: Meso-scale and convective scale characteristics of mature
hurricanes. Part I: general observations by research aircraft. J. Atmos. Sci., 41,
1268-1285.
___, and M. A. LeMone, 1989: Vertical velocity characteristics of oceanic convection. J.
Atmos. Sci., 46, 621-640.
74
___, E. J. Zipser,, M. A. LeMone, 1985: Vertical motions in intense hurricanes. J. Atmos.
Sci., 42, 839-856.
Lee, T. F., F. J. Turk, J. Hawkins, and K. Richardson, 2002: Interpretation of TRMM
TMI images of tropical cyclones. Earth Interactions., 6,
Lyons, W. A., and C. S. Keen, 1994: Observations of lightning in convective supercells
within tropical storms and hurricanes. Mon. Wea. Rev., 122, 1897-1916.
Knabb, R. D., D. P. Brown., and J. R. Rhome., 2006: Hurricane Rita. Nat. Hurricane.
Center., 1 – 33.
____, J. R. Rhome., D. P. Brown, 2005: Hurricane Katrina. Nat. Hurricane. Center., 1-
42.
Marks F. D., Jr, 1985: Evolution of the Structure of Precipitation in Hurricane Allen
(1980). Mon. Wea. Rev.,113, 909–930.
___, and R. A. Houze Jr, 1987: Inner core structure of Hurricane Alicia from airborne
Doppler radar observations. J. Atmos. Sci., 44, 1296–1317.
Marshall, T. C., W. D. Rust, and M. Stolzenburg, 1995: Electrical structure and updraft
speeds in thunderstorms over the southern Great Plains. J. Geophys. Res., 100,
1001-1016.
Mohr, K. I., Famiglietti, J. S., and E. J. Zipser, 1999: The contribution to tropical rainfall
with respect to convective system type, size, and intensity estimated from the 85-
GHz ice-scattering signature. J. App Meteor., 38, pp. 596–606.
Molinari, J., P. K. Moore, V. P. Idone, R. W. Henderson, Saljoughy, 1994: Cloud-to
ground lightning in hurricane Andrew. J. Geophys. Res., 99, 16 665-16 676.
75
___, P. Moore, V. Idone, 1999: Convective structure of hurricanes as revealed by
lightning locations. Mon. Wea. Rev., 127, 520-534.
Nesbitt, S. W., E. J. Zipser, D. J. Cecil, 2000: A census of precipitation features in the
tropics using TRMM: radar, ice scattering, and lightning observations. J. Climate.,
13, 4087-4106.
Orville, R. E., and B. Vonnegut, 1974: Lightning detection from satellites. Electrical
Processes in Atmospheres, H. Dolezalek and R. Reiter, Eds., Steinkopff Verlag,
Darmstadt, 750 – 753.
____,R. W. Henderson, L. F. Bosart, 1983: An east coast lightning detection
network. Bull. Amer. Meteor. Soc., 64, 1029 – 1037.
____, G. R. Huffines, W. R. Burrows, R. L. Holle, K. L. Cummins, 2002: The North
American Lightning Detection Network (NALDN)—first results: 1998–2000. Mon.
Wea. Rev., 130, 2098-2109.
Papadopoulos, A., T. Chronis and E. N. Anagnostou, 2004: Improving Convective
Precipitation Forecasting Through Assimilation of Regional Lightning
Measurements in a Mesoscale Model, Monthly Weather Review (in review).
Pessi, A.T., S. Businger, T. Cherubini, K. L. Cummins, and T. Turner, 2005: Toward the
assimilation of lightning data over the Pacific Ocean into a mesoscale NWP model.
85th Annual AMS Meeting held in San Diego, CA.
Petersen, W. A., and S. A. Rutledge., 2001: Regional variability in tropical convection:
observations from TRMM. J. Climate., 14, 3566–3586
Pruppacher, H.R., and J. D. Klett., 2000: Microphysics of clouds and precipitation, pp.
792-852, Kluwer Academic Publishers, Norwell, Mass.
76
Samsury, C. E., and R. E. Orville, 1994: Cloud-to-ground lightning in tropical cyclones: a
study of hurricanes Hugo (1989) and Jerry (1989). Mon. Wea. Rev., 122, 1887-
1896.
Saunders, C. P. R., W. D. Keith, and R. P. Mitzeva, 1991: The influence of liquid water
on thunderstorm charging. J. Geophys. Res., 96, 11 007- 11 017.
____, 1995: Thunderstorm electrification, in Handbook of Atmospheric Electrodynamics,
Volume I, pp. 61-92, CRC Press, Inc., Boca Raton.
Sherwood, S. C., 2002: Aerosol and ice particle size in tropical cumulonimbus. J.
Climate., 15, 1051 – 1063.
Szoke, E. J., E. J. Zipser, and D. P. Jorgensen, 1986: A radar study of convective cells in
mesoscale systems in GATE. Par I: Vertical profile statistics and comparison with
hurricanes. J. Atmos. Sci, 43, 182-197.
Takahashi, T., 1978: Riming electrification as a charge generation mechanisms in
thunderstorms. J. Atmos. Sci., 35, 1536-1548.
Uman, M. A., 1987: The Lightning Discharge. International Geo- physics Series, Vol. 39,
Academic Press, 377 pp
Williams, E. R., S. A. Rutledge, S. G. Goetis, N. Renno, E. Rassmussen, T. Rickenbach,
1992: A radar and electrical study of tropical “Hot Towers”. J. Atmos. Sci., 49,
1386-1395.
Willoughby, H. E., 1990: Temporal changes of the primary circulation in tropical
cyclones. J. Atmos. Sci., 47, 242-264.
77
Yuter, S. E., and R. A. Houze Jr., 1995: Three-dimensional kinematic and microphysical
evolution of Florida cumulonimbus. Part I: Spatial distribution of updrafts,
downdrafts, and precipitation. Mon. Wea. Rev., 123, 1921-1940.
Zipser, E. J., 1994: Deep cumulonimbus cloud systems in the tropics with and without
lightning. Mon. Wea. Rev., 122, 1837-1851.
___, and M. A. LeMone, 1980: Cumulonimbus vertical velocity events in GATE. Part II:
Synthesis and model core structure. J. Atmos. Sci., 37, 2458-2469.
___, K. R. Lutz, 1994: The vertical profile of radar reflectivity of convective cells: a
strong indicator of storm intensity and lightning probability? Mon. Wea. Rev., 122,
1751-1759.
Ziv, A., and Z. Levin, 1974: Thundercloud electrification: cloud growth and electrical
development. J. Amos. Sci., 31, 1652-1661.