Embed Size (px)
Citation preview

The Moray Council Feasibility Study:
Residual Waste Treatment
Prepared by Albion Environmental Ltd May 2014
ALB/TMC/APR2014 Residual Waste Treatment: Feasibility Study Version1 Page 1
Contents
Executive Summary ...................................................................................................................... 3
1.0 Introduction ........................................................................................................................ 6
2.0 Background ........................................................................................................................ 7
3.0 Current Situation ................................................................................................................ 9
3.1.1 Introduction .............................................................................................................. 9
3.1.2 Residual Analysis Commentary ........................................................................... 10
3.1.3 Waste Compositional Analysis Conclusion ......................................................... 12
4.0 Future Waste Growth ....................................................................................................... 15
4.1 Future Waste Generation ............................................................................................. 15
4.2 Recycling via a Material Recycling Facility (MRF) ...................................................... 20
4.2.1 Future Waste Predictions for Recycling via a MRF ............................................. 20
4.2.2 Advantages / Disadvantages of Recycling at Source versus recycling at MRF 22
4.3 Commercial Waste ........................................................................................................ 23
4.4 Level of confidence in residual waste tonnage .......................................................... 23
4.4.1 Residual Waste Tonnage ...................................................................................... 23
4.4.2 Waste Composition ............................................................................................... 24
5.0 Carbon Metric ................................................................................................................... 25
6.0 Residual Waste Treatment Technology .......................................................................... 29
6.1 Low Risk Technologies ................................................................................................ 29
6.1.1 Waste Transfer Station .......................................................................................... 29
6.1.2 “Dirty” Material Recycling Facility ........................................................................ 29
6.1.3 “Dirty” MRF with Refuse Derived Fuel Production (RDF) ................................... 30
6.1.4 Solid Recovered Fuel Production (SRF) .............................................................. 30
6.2 Conventional and advanced thermal treatment technologies ................................... 30
6.2.1 Incineration ............................................................................................................ 31
6.2.2 Pyrolysis................................................................................................................. 32
6.2.3 Gasification ............................................................................................................ 32
6.3 Opportunities to recover energy .................................................................................. 33
6.3.1 Calorific Value of Waste ........................................................................................ 33
6.3.2 Renewables Obligation Certificates ..................................................................... 34
6.3.3 Export of RDF......................................................................................................... 34
7.0 Proposed Strategies for Residual Waste ........................................................................ 36
7.1 Increasing Use of Existing Recycling Services .......................................................... 37
7.2 Provision of MRF .......................................................................................................... 38
ALB/TMC/APR2014 Residual Waste Treatment: Feasibility Study Version1 Page 2
7.3 Provision of MRF with RDF Production ...................................................................... 39
7.4 Provision of Waste to Energy Facility ......................................................................... 40
8.4.1 Thermal Treatment Footnote ................................................................................ 41
8.0 Neighbouring Authorities ................................................................................................ 42
8.1 The Highland Council ................................................................................................... 42
8.2 Aberdeenshire Council ................................................................................................. 42
8.3 Aberdeen City Council ................................................................................................. 42
9.0 Commercial Facilities....................................................................................................... 43
9.1 Facilities within TMC .................................................................................................... 43
9.1.1 Grays Recycling Services Ltd, .............................................................................. 43
9.1.2 J Gordon Williamson Ltd ...................................................................................... 43
9.2 Facilities outwith TMC .................................................................................................. 43
9.2.1 SITA UK .................................................................................................................. 43
9.2.2 Wm. Munro Construction (Highland) Limited ...................................................... 43
9.2.3 Shore Energy ......................................................................................................... 43
9.3 Review of Waste to Energy Facilities .......................................................................... 43
9.3.1 Clean Power Properties ......................................................................................... 44
9.3.2 J Gordon Williamson Ltd ...................................................................................... 44
9.3.3 Combined Power and Heat (Highlands) Ltd ......................................................... 44
9.3.4 Operational facilities within Scotland .................................................................. 44
10.0 Procurement Methods ...................................................................................................... 45
10.1 PFI (Public Finance Initiative) / PPP (Public Private Partnership) Contracts. ........... 45
10.2 Short Term Contracts 1- 5years ................................................................................... 45
10.3 Scotland EXCEL Framework Contracts ...................................................................... 45
10.4 Scotland Wide Brokerage............................................................................................. 46
11.0 Best Strategy Considerations ......................................................................................... 47
Appendix 1 Table of Energy from Waste projects across Scotland ........................................ 50
Appendix 2 Index of abbreviations ............................................................................................ 53
Appendix 3 Index of references ................................................................................................. 54
Appendix 4 Index of Tables and Graphs ................................................................................... 55
Tables .......................................................................................................................................... 55
Graphs ......................................................................................................................................... 55
ALB/TMC/APR2014 Residual Waste Treatment: Feasibility Study Version1 Page 3
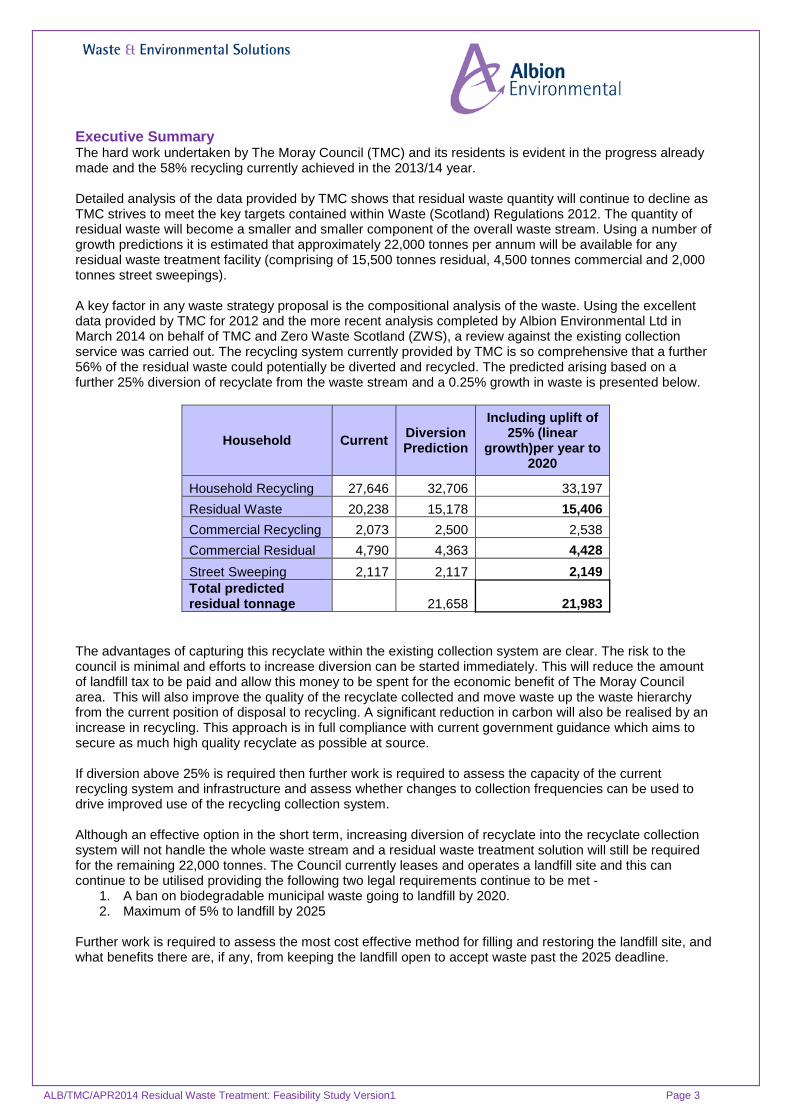
Executive Summary The hard work undertaken by The Moray Council (TMC) and its residents is evident in the progress already made and the 58% recycling currently achieved in the 2013/14 year. Detailed analysis of the data provided by TMC shows that residual waste quantity will continue to decline as TMC strives to meet the key targets contained within Waste (Scotland) Regulations 2012. The quantity of residual waste will become a smaller and smaller component of the overall waste stream. Using a number of growth predictions it is estimated that approximately 22,000 tonnes per annum will be available for any residual waste treatment facility (comprising of 15,500 tonnes residual, 4,500 tonnes commercial and 2,000 tonnes street sweepings). A key factor in any waste strategy proposal is the compositional analysis of the waste. Using the excellent data provided by TMC for 2012 and the more recent analysis completed by Albion Environmental Ltd in March 2014 on behalf of TMC and Zero Waste Scotland (ZWS), a review against the existing collection service was carried out. The recycling system currently provided by TMC is so comprehensive that a further 56% of the residual waste could potentially be diverted and recycled. The predicted arising based on a further 25% diversion of recyclate from the waste stream and a 0.25% growth in waste is presented below.
Household Current Diversion Prediction
Including uplift of 25% (linear
growth)per year to 2020
Household Recycling 27,646 32,706 33,197 Residual Waste 20,238 15,178 15,406 Commercial Recycling 2,073 2,500 2,538 Commercial Residual 4,790 4,363 4,428 Street Sweeping 2,117 2,117 2,149 Total predicted residual tonnage 21,658 21,983
The advantages of capturing this recyclate within the existing collection system are clear. The risk to the council is minimal and efforts to increase diversion can be started immediately. This will reduce the amount of landfill tax to be paid and allow this money to be spent for the economic benefit of The Moray Council area. This will also improve the quality of the recyclate collected and move waste up the waste hierarchy from the current position of disposal to recycling. A significant reduction in carbon will also be realised by an increase in recycling. This approach is in full compliance with current government guidance which aims to secure as much high quality recyclate as possible at source. If diversion above 25% is required then further work is required to assess the capacity of the current recycling system and infrastructure and assess whether changes to collection frequencies can be used to drive improved use of the recycling collection system. Although an effective option in the short term, increasing diversion of recyclate into the recyclate collection system will not handle the whole waste stream and a residual waste treatment solution will still be required for the remaining 22,000 tonnes. The Council currently leases and operates a landfill site and this can continue to be utilised providing the following two legal requirements continue to be met -
1. A ban on biodegradable municipal waste going to landfill by 2020. 2. Maximum of 5% to landfill by 2025
Further work is required to assess the most cost effective method for filling and restoring the landfill site, and what benefits there are, if any, from keeping the landfill open to accept waste past the 2025 deadline.
ALB/TMC/APR2014 Residual Waste Treatment: Feasibility Study Version1 Page 4
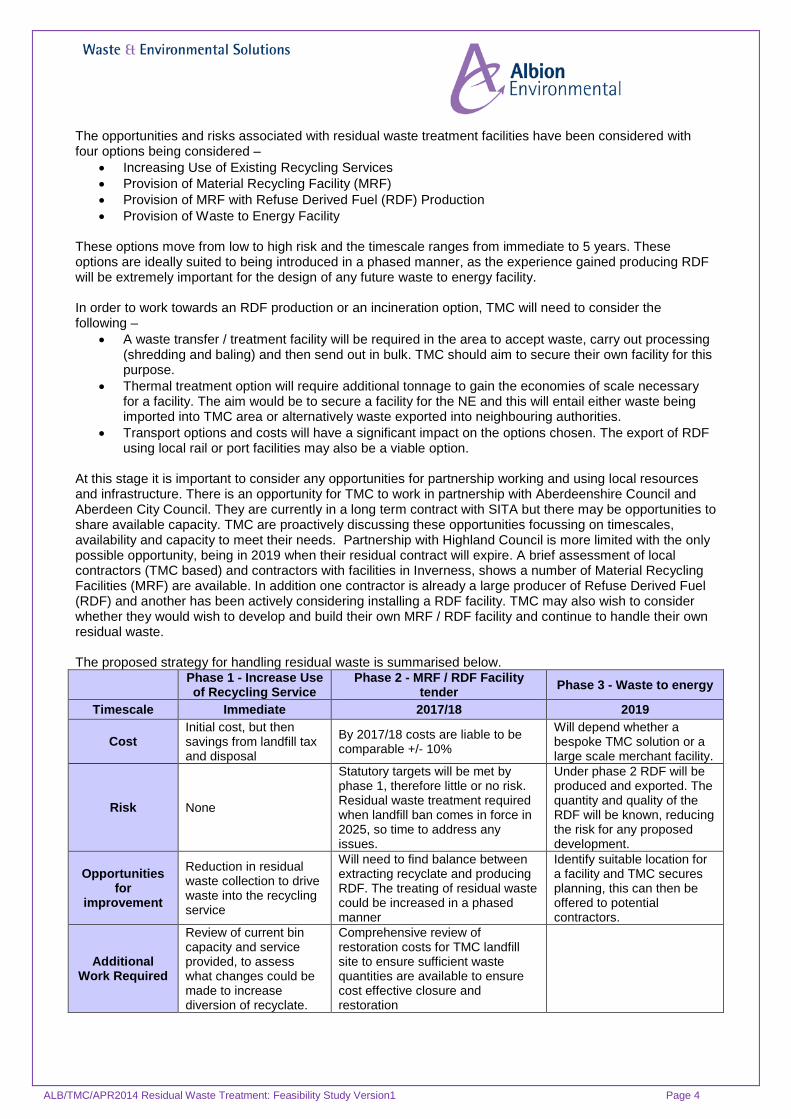
The opportunities and risks associated with residual waste treatment facilities have been considered with four options being considered –
• Increasing Use of Existing Recycling Services • Provision of Material Recycling Facility (MRF) • Provision of MRF with Refuse Derived Fuel (RDF) Production • Provision of Waste to Energy Facility
These options move from low to high risk and the timescale ranges from immediate to 5 years. These options are ideally suited to being introduced in a phased manner, as the experience gained producing RDF will be extremely important for the design of any future waste to energy facility. In order to work towards an RDF production or an incineration option, TMC will need to consider the following –
• A waste transfer / treatment facility will be required in the area to accept waste, carry out processing (shredding and baling) and then send out in bulk. TMC should aim to secure their own facility for this purpose.
• Thermal treatment option will require additional tonnage to gain the economies of scale necessary for a facility. The aim would be to secure a facility for the NE and this will entail either waste being imported into TMC area or alternatively waste exported into neighbouring authorities.
• Transport options and costs will have a significant impact on the options chosen. The export of RDF using local rail or port facilities may also be a viable option.
At this stage it is important to consider any opportunities for partnership working and using local resources and infrastructure. There is an opportunity for TMC to work in partnership with Aberdeenshire Council and Aberdeen City Council. They are currently in a long term contract with SITA but there may be opportunities to share available capacity. TMC are proactively discussing these opportunities focussing on timescales, availability and capacity to meet their needs. Partnership with Highland Council is more limited with the only possible opportunity, being in 2019 when their residual contract will expire. A brief assessment of local contractors (TMC based) and contractors with facilities in Inverness, shows a number of Material Recycling Facilities (MRF) are available. In addition one contractor is already a large producer of Refuse Derived Fuel (RDF) and another has been actively considering installing a RDF facility. TMC may also wish to consider whether they would wish to develop and build their own MRF / RDF facility and continue to handle their own residual waste. The proposed strategy for handling residual waste is summarised below.
Phase 1 - Increase Use of Recycling Service
Phase 2 - MRF / RDF Facility tender Phase 3 - Waste to energy
Timescale Immediate 2017/18 2019
Cost Initial cost, but then savings from landfill tax and disposal
By 2017/18 costs are liable to be comparable +/- 10%
Will depend whether a bespoke TMC solution or a large scale merchant facility.
Risk None
Statutory targets will be met by phase 1, therefore little or no risk. Residual waste treatment required when landfill ban comes in force in 2025, so time to address any issues.
Under phase 2 RDF will be produced and exported. The quantity and quality of the RDF will be known, reducing the risk for any proposed development.
Opportunities for
improvement
Reduction in residual waste collection to drive waste into the recycling service
Will need to find balance between extracting recyclate and producing RDF. The treating of residual waste could be increased in a phased manner
Identify suitable location for a facility and TMC secures planning, this can then be offered to potential contractors.
Additional Work Required
Review of current bin capacity and service provided, to assess what changes could be made to increase diversion of recyclate.
Comprehensive review of restoration costs for TMC landfill site to ensure sufficient waste quantities are available to ensure cost effective closure and restoration
ALB/TMC/APR2014 Residual Waste Treatment: Feasibility Study Version1 Page 5
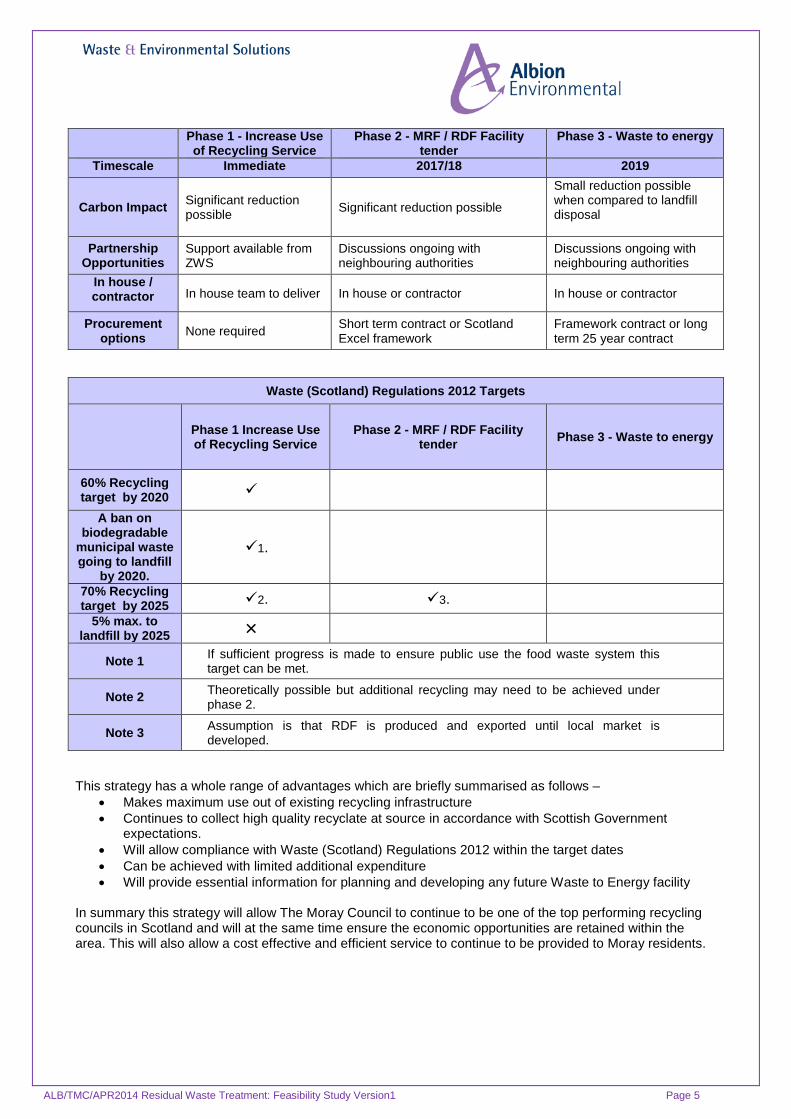
Phase 1 - Increase Use of Recycling Service
Phase 2 - MRF / RDF Facility tender
Phase 3 - Waste to energy
Timescale Immediate 2017/18 2019
Carbon Impact Significant reduction possible Significant reduction possible
Small reduction possible when compared to landfill disposal
Partnership Opportunities
Support available from ZWS
Discussions ongoing with neighbouring authorities
Discussions ongoing with neighbouring authorities
In house / contractor
In house team to deliver In house or contractor In house or contractor
Procurement options None required Short term contract or Scotland
Excel framework Framework contract or long term 25 year contract
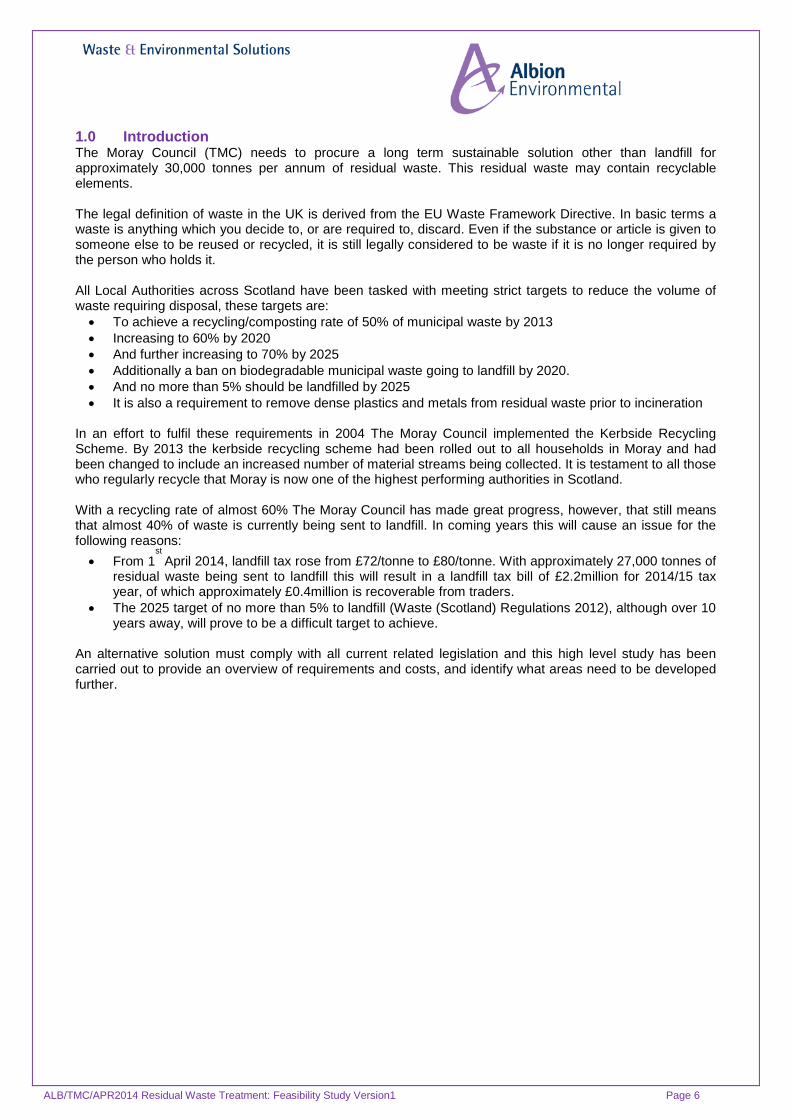
Waste (Scotland) Regulations 2012 Targets
Phase 1 Increase Use of Recycling Service
Phase 2 - MRF / RDF Facility tender Phase 3 - Waste to energy
60% Recycling target by 2020
A ban on biodegradable
municipal waste going to landfill
by 2020.
1.
70% Recycling target by 2025 2. 3.
5% max. to landfill by 2025 ×
Note 1 If sufficient progress is made to ensure public use the food waste system this target can be met.
Note 2 Theoretically possible but additional recycling may need to be achieved under phase 2.
Note 3 Assumption is that RDF is produced and exported until local market is developed.
This strategy has a whole range of advantages which are briefly summarised as follows – • Makes maximum use out of existing recycling infrastructure • Continues to collect high quality recyclate at source in accordance with Scottish Government
expectations. • Will allow compliance with Waste (Scotland) Regulations 2012 within the target dates • Can be achieved with limited additional expenditure • Will provide essential information for planning and developing any future Waste to Energy facility
In summary this strategy will allow The Moray Council to continue to be one of the top performing recycling councils in Scotland and will at the same time ensure the economic opportunities are retained within the area. This will also allow a cost effective and efficient service to continue to be provided to Moray residents.
ALB/TMC/APR2014 Residual Waste Treatment: Feasibility Study Version1 Page 6
1.0 Introduction The Moray Council (TMC) needs to procure a long term sustainable solution other than landfill for approximately 30,000 tonnes per annum of residual waste. This residual waste may contain recyclable elements. The legal definition of waste in the UK is derived from the EU Waste Framework Directive. In basic terms a waste is anything which you decide to, or are required to, discard. Even if the substance or article is given to someone else to be reused or recycled, it is still legally considered to be waste if it is no longer required by the person who holds it. All Local Authorities across Scotland have been tasked with meeting strict targets to reduce the volume of waste requiring disposal, these targets are: • To achieve a recycling/composting rate of 50% of municipal waste by 2013 • Increasing to 60% by 2020 • And further increasing to 70% by 2025 • Additionally a ban on biodegradable municipal waste going to landfill by 2020. • And no more than 5% should be landfilled by 2025 • It is also a requirement to remove dense plastics and metals from residual waste prior to incineration
In an effort to fulfil these requirements in 2004 The Moray Council implemented the Kerbside Recycling Scheme. By 2013 the kerbside recycling scheme had been rolled out to all households in Moray and had been changed to include an increased number of material streams being collected. It is testament to all those who regularly recycle that Moray is now one of the highest performing authorities in Scotland. With a recycling rate of almost 60% The Moray Council has made great progress, however, that still means that almost 40% of waste is currently being sent to landfill. In coming years this will cause an issue for the following reasons: • From 1
st April 2014, landfill tax rose from £72/tonne to £80/tonne. With approximately 27,000 tonnes of
residual waste being sent to landfill this will result in a landfill tax bill of £2.2million for 2014/15 tax year, of which approximately £0.4million is recoverable from traders.
• The 2025 target of no more than 5% to landfill (Waste (Scotland) Regulations 2012), although over 10 years away, will prove to be a difficult target to achieve.
An alternative solution must comply with all current related legislation and this high level study has been carried out to provide an overview of requirements and costs, and identify what areas need to be developed further.
ALB/TMC/APR2014 Residual Waste Treatment: Feasibility Study Version1 Page 7
2.0 Background The Moray Council (TMC) needs to procure a long term sustainable solution other than landfill for approximately 30,000 tonnes per annum of residual waste. This residual waste may contain recyclable elements. Residual Waste is that which has been subjected to all reasonably practicable efforts to extract and recover re-usable and recyclable materials. Recent analysis has indicated that with the introduction of food waste collections and an extended range of recyclate material services, the residual waste can still contain between 30-50% material which could be more cost effectively handled by these other services. One aspect we will consider is the impact of increasing the focus on the food and recyclate collection and reducing the frequency of residual waste collection to drive a change in public attitudes. The remaining residual waste will be composed of a variety of different types of material which can be treated in a number of ways. Treatment options can range from a simple shred and screen type operation all the way through to incineration, pyrolysis and gasification. Usually incineration, pyrolysis and gasification require a certain economy of scale and it is likely that the tonnage available from The Moray Council will not be sufficient to secure funding for a facility without working in partnership with other councils. Residual waste can be ‘pre-treated’, for reducing biodegradable components via composting or anaerobic digestion which can stabilise and derive energy from the waste. Recyclable components recovered from residual waste may be used to produce low quality recycled outputs. The Scottish Government has a vision for a zero-waste society where disposal is minimised and all waste is seen as a resource. Elaborating on the aims of the Waste (Scotland) Regulations 2012 and the Scottish Government’s Zero Waste Plan, the Scottish Environment Protection Agency (SEPA) note that legislation ‘aims to maximise levels of closed loop recycling in Scotland through the collection and processing of material resources back into new products and organic wastes back into nutrient cycles.’ The Waste (Scotland) Regulations 2012 require a reduction in quantities of waste sent to landfill by increasing recycling rates, removing biodegradable content from the mixed waste stream and optimising the recovery of materials and energy from residual waste prior to disposal. The 2012 Regulations also require separate waste collections for recyclable and biodegradable waste and introduce a ban on the landfilling or incineration of materials collected separately for recycling by the end of 2013. Together these regulations are likely to have a significant impact on the future composition and quantity of Scotland’s residual waste stream. The residual waste should also be processed as high up the waste hierarchy as possible. Currently waste is either being recycled or landfilled. The aim is to move more waste up to being recycled, with energy being recovered from the remainder.

ALB/TMC/APR2014 Residual Waste Treatment: Feasibility Study Version1 Page 8
Figure 1 – Waste Hierarchy
As a result of the 2012 Regulations, the composition of residual waste from all sources will change significantly with increased recovery of recyclables and the segregated collection of different waste streams. This will influence the way in which the remaining material is most effectively treated. Waste management policy and practice have changed significantly over the past fifteen years. With landfill tax increasing and now £80 tonne from 1st April 2014 this has seen an increase in the popularity of alternative treatments. Note - Powers devolved to Scotland in the Scotland Act 2012 mean that from April 2015 the Scottish Parliament will be empowered to introduce and manage taxes on the disposal of waste to landfill, allowing more targeted implementation of the Waste (Scotland) Regulations 2012. In England and Wales the standard and lower rates of landfill tax are to rise in line with inflation from April 2015. At this stage it is not clear whether Scotland intends to also apply this increase. Recent Environment Agency figures show that Refuse Derived Fuel exports have increased from 272k tonnes in 2011 to 1.5 million tonnes in 2013. This trend is liable to continue for the short term while the infrastructure in the UK is fully developed. Residual waste treatment options are important in reducing the amount of waste requiring disposal, as they offer the last opportunity in the current treatment schemes to capture materials and energy from waste before it is ultimately sent to landfill. The Waste (Scotland) Regulations 2012 mark a significant shift from historic practices. The most appropriate approaches for dealing with residual waste will be needed to meet the ‘5% of all waste to landfill’ target by 2025. The Scottish Government considers that the selection and implementation of residual waste treatment options should be a significant part of the waste hierarchy and an area of national policy focus. The current conditions in Scotland in relation to existing and pending thermal treatments/RDF have been affected by the main drivers which include the new obligations arising from the European Waste Framework Directive 2008/98/EC revised, the publication of Scotland’s Zero Waste Plan (2010) and the supporting Waste (Scotland) Regulations 2012. There is broad agreement that while residual waste treatment is a useful and necessary stage of the waste hierarchy, it is economically and environmentally important to manage waste as far up the hierarchy as possible. Residual waste treatment should not be allowed to present a more attractive option than reduction, reuse or recycling, and provision should be made for improved capacity to take action at these earlier stages. Scotland’s Zero Waste Plan (Scottish Government 2010) stated that ‘the Scottish Government will introduce regulatory measures to support the delivery of landfill bans, by ensuring energy from waste treatment is only used to recover value from resources that cannot offer greater environmental and economic benefits through reuse or recycling.’ This measure was formally introduced in the Waste (Scotland) Regulations 2012 and as a result residual waste treatment should only be developed to a capacity fit for, not exceeding, this purpose.
ALB/TMC/APR2014 Residual Waste Treatment: Feasibility Study Version1 Page 9
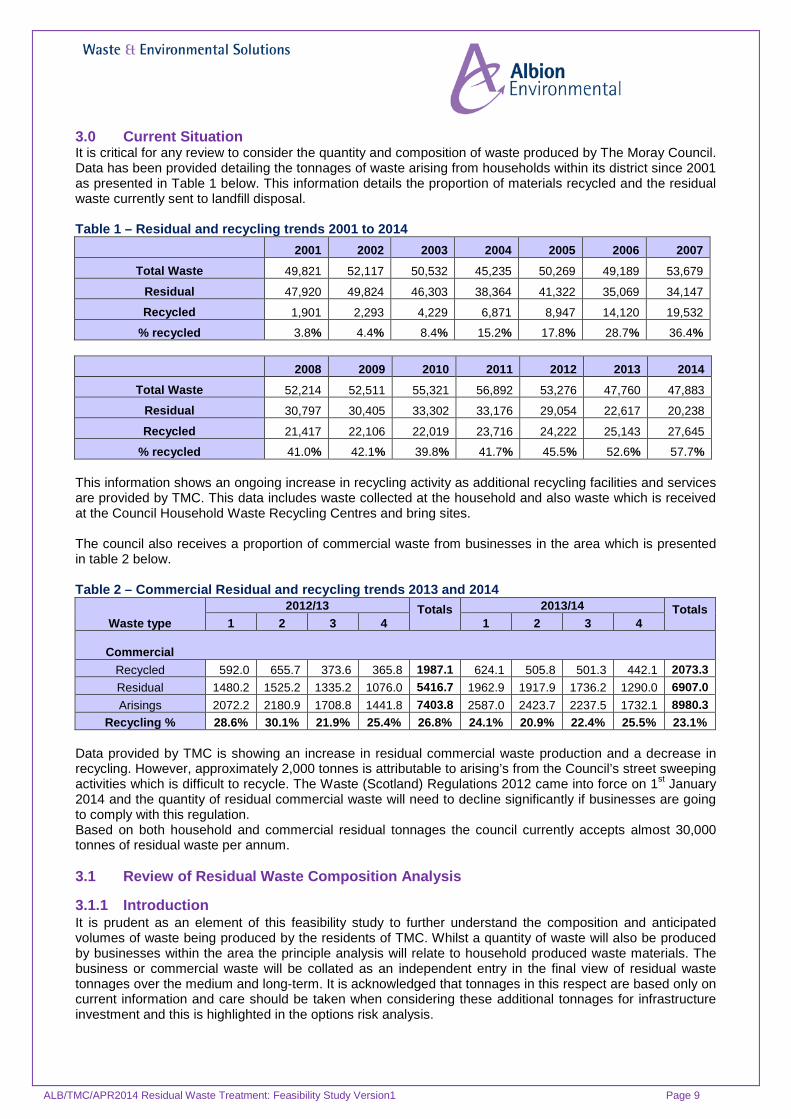
3.0 Current Situation It is critical for any review to consider the quantity and composition of waste produced by The Moray Council. Data has been provided detailing the tonnages of waste arising from households within its district since 2001 as presented in Table 1 below. This information details the proportion of materials recycled and the residual waste currently sent to landfill disposal. Table 1 – Residual and recycling trends 2001 to 2014
2001 2002 2003 2004 2005 2006 2007
Total Waste 49,821 52,117 50,532 45,235 50,269 49,189 53,679
Residual 47,920 49,824 46,303 38,364 41,322 35,069 34,147
Recycled 1,901 2,293 4,229 6,871 8,947 14,120 19,532
% recycled 3.8% 4.4% 8.4% 15.2% 17.8% 28.7% 36.4%
2008 2009 2010 2011 2012 2013 2014
Total Waste 52,214 52,511 55,321 56,892 53,276 47,760 47,883
Residual 30,797 30,405 33,302 33,176 29,054 22,617 20,238
Recycled 21,417 22,106 22,019 23,716 24,222 25,143 27,645
% recycled 41.0% 42.1% 39.8% 41.7% 45.5% 52.6% 57.7% This information shows an ongoing increase in recycling activity as additional recycling facilities and services are provided by TMC. This data includes waste collected at the household and also waste which is received at the Council Household Waste Recycling Centres and bring sites. The council also receives a proportion of commercial waste from businesses in the area which is presented in table 2 below. Table 2 – Commercial Residual and recycling trends 2013 and 2014
Waste type 2012/13 Totals
2013/14 Totals
1 2 3 4 1 2 3 4
Commercial Recycled 592.0 655.7 373.6 365.8 1987.1 624.1 505.8 501.3 442.1 2073.3 Residual 1480.2 1525.2 1335.2 1076.0 5416.7 1962.9 1917.9 1736.2 1290.0 6907.0 Arisings 2072.2 2180.9 1708.8 1441.8 7403.8 2587.0 2423.7 2237.5 1732.1 8980.3
Recycling % 28.6% 30.1% 21.9% 25.4% 26.8% 24.1% 20.9% 22.4% 25.5% 23.1% Data provided by TMC is showing an increase in residual commercial waste production and a decrease in recycling. However, approximately 2,000 tonnes is attributable to arising’s from the Council’s street sweeping activities which is difficult to recycle. The Waste (Scotland) Regulations 2012 came into force on 1st January 2014 and the quantity of residual commercial waste will need to decline significantly if businesses are going to comply with this regulation. Based on both household and commercial residual tonnages the council currently accepts almost 30,000 tonnes of residual waste per annum. 3.1 Review of Residual Waste Composition Analysis
3.1.1 Introduction It is prudent as an element of this feasibility study to further understand the composition and anticipated volumes of waste being produced by the residents of TMC. Whilst a quantity of waste will also be produced by businesses within the area the principle analysis will relate to household produced waste materials. The business or commercial waste will be collated as an independent entry in the final view of residual waste tonnages over the medium and long-term. It is acknowledged that tonnages in this respect are based only on current information and care should be taken when considering these additional tonnages for infrastructure investment and this is highlighted in the options risk analysis.

ALB/TMC/APR2014 Residual Waste Treatment: Feasibility Study Version1 Page 10
3.1.2 Residual Analysis Commentary The TMC provided annual residual waste compositional analysis data which has been carried out on a regular basis (at least annually) since 2002. For the purpose of this exercise we have used the most recent data from 2012 and worked through the product descriptions to assess whether this material should be recycled or should remain within the residual waste as per the current council guidance which is readily available to the general public. This recycled material could be segregated in the household and placed in the existing recycling bin service provided by TMC. Please note we have not assessed for any volume restrictions on the recycling bins caused by this increase in recycling activity and this may require further consideration. Table 3 – 2012 Waste compositional analysis
Material Residual
Waste Total %
% Potential
for Recycling
% Remaining
in Residual
Paper, card, newsprint etc. 12.47 7.52 4.95
Plastic Film 7.89 NIL 7.89 Hard Plastic, bottles etc. 11.68 9.98 1.70
Clothing 5.08 5.08 NIL Glass 3.85 3.35 0.50
Metals, batteries, WEEE 4.80 4.80 NIL Disposable Nappies 10.50 NIL 10.50 Hazardous Materials 0.95 NIL 0.95
Hardcore/rubble 4.57 4.57 NIL Kitchen & Garden 34.10 31.03 3.07
Fines 4.11 NIL 4.11 Total 100 66.33 33.67
2012 waste compositional analysis shows that an additional 66% of this waste if segregated properly could be placed in the recycling bins and services provided by TMC. To support this analysis TMC also provided the results from the recent waste compositional analysis which has been completed in conjunction with Zero Waste Scotland and Albion Environmental Ltd. This work involved a sample size of 250 bins and work was completed in March 2014. Again we worked through the product descriptions to assess whether this material should be recycled or should remain within the residual waste as per the current council guidance which is readily available to the general public.
ALB/TMC/APR2014 Residual Waste Treatment: Feasibility Study Version1 Page 11
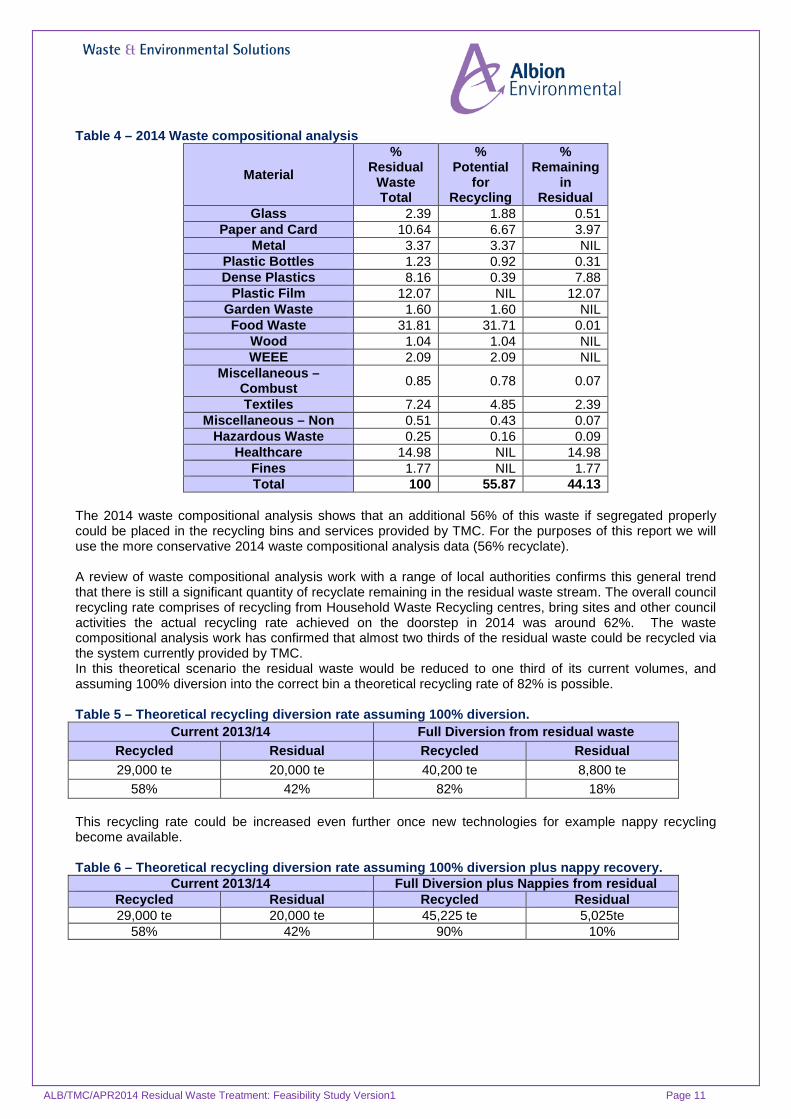
Table 4 – 2014 Waste compositional analysis
Material %
Residual Waste Total
% Potential
for Recycling
% Remaining
in Residual
Glass 2.39 1.88 0.51 Paper and Card 10.64 6.67 3.97
Metal 3.37 3.37 NIL Plastic Bottles 1.23 0.92 0.31 Dense Plastics 8.16 0.39 7.88
Plastic Film 12.07 NIL 12.07 Garden Waste 1.60 1.60 NIL Food Waste 31.81 31.71 0.01
Wood 1.04 1.04 NIL WEEE 2.09 2.09 NIL
Miscellaneous – Combust 0.85 0.78 0.07
Textiles 7.24 4.85 2.39 Miscellaneous – Non 0.51 0.43 0.07
Hazardous Waste 0.25 0.16 0.09 Healthcare 14.98 NIL 14.98
Fines 1.77 NIL 1.77 Total 100 55.87 44.13
The 2014 waste compositional analysis shows that an additional 56% of this waste if segregated properly could be placed in the recycling bins and services provided by TMC. For the purposes of this report we will use the more conservative 2014 waste compositional analysis data (56% recyclate). A review of waste compositional analysis work with a range of local authorities confirms this general trend that there is still a significant quantity of recyclate remaining in the residual waste stream. The overall council recycling rate comprises of recycling from Household Waste Recycling centres, bring sites and other council activities the actual recycling rate achieved on the doorstep in 2014 was around 62%. The waste compositional analysis work has confirmed that almost two thirds of the residual waste could be recycled via the system currently provided by TMC. In this theoretical scenario the residual waste would be reduced to one third of its current volumes, and assuming 100% diversion into the correct bin a theoretical recycling rate of 82% is possible. Table 5 – Theoretical recycling diversion rate assuming 100% diversion.
Current 2013/14 Full Diversion from residual waste Recycled Residual Recycled Residual 29,000 te 20,000 te 40,200 te 8,800 te
58% 42% 82% 18% This recycling rate could be increased even further once new technologies for example nappy recycling become available. Table 6 – Theoretical recycling diversion rate assuming 100% diversion plus nappy recovery.
Current 2013/14 Full Diversion plus Nappies from residual Recycled Residual Recycled Residual 29,000 te 20,000 te 45,225 te 5,025te
58% 42% 90% 10%
ALB/TMC/APR2014 Residual Waste Treatment: Feasibility Study Version1 Page 12
3.1.3 Waste Compositional Analysis Conclusion Based on the Council waste compositional analysis and the recent 2014 ZWS / Albion analysis it is clear that a significant portion of recyclate remains in the residual waste. Analysis results would also indicate it is possible to achieve over 70% recycling using the existing system and infrastructure that TMC has in place. Further analysis of the waste quantities would establish whether the frequency of collections would need to be changed. These changes to the actual collection system are likely to be cost neutral as any increase in recycling collections would result in a corresponding decrease in residual waste collections. It is clear from the above rates that TMC has not yet maximised the recycling rates and potential which could be achieved at a household level. There are clear advantages to this approach of maximising recycling rates which include –
• Collection costs – cost neutral • Landfill tax savings (see 3.1.4) • Waste is moved higher up the waste hierarchy, from disposal to recycling. • Increasing recycling and participation will improve public attitudes to waste and resources.
The main disadvantage is that additional resources will need to be allocated to improve public participation and encourage the public to use the service correctly. Costs are likely to relate to –
• Additional Awareness / Enforcement officers • Rigorous application of contamination policy including both contamination of recyclate and
contamination of residual waste with recyclate • Increasing training for crews and call centre staff to drive change • Local awareness raising campaigns • Increasing waste and resource education in schools
The savings generated from reduced disposal costs and reduced landfill tax costs should therefore be viewed as an opportunity to improve public participation and encourage the public to use the service correctly. This will provide significant social and economic benefits to TMC, in comparison to paying landfill tax which has little or no benefit for the local community. The diversion of large quantities of waste into the recyclate stream is obviously going to reduce the overall quantity of residual waste which will need to be treated. The impact of this will be considered further in section 4.
ALB/TMC/APR2014 Residual Waste Treatment: Feasibility Study Version1 Page 13
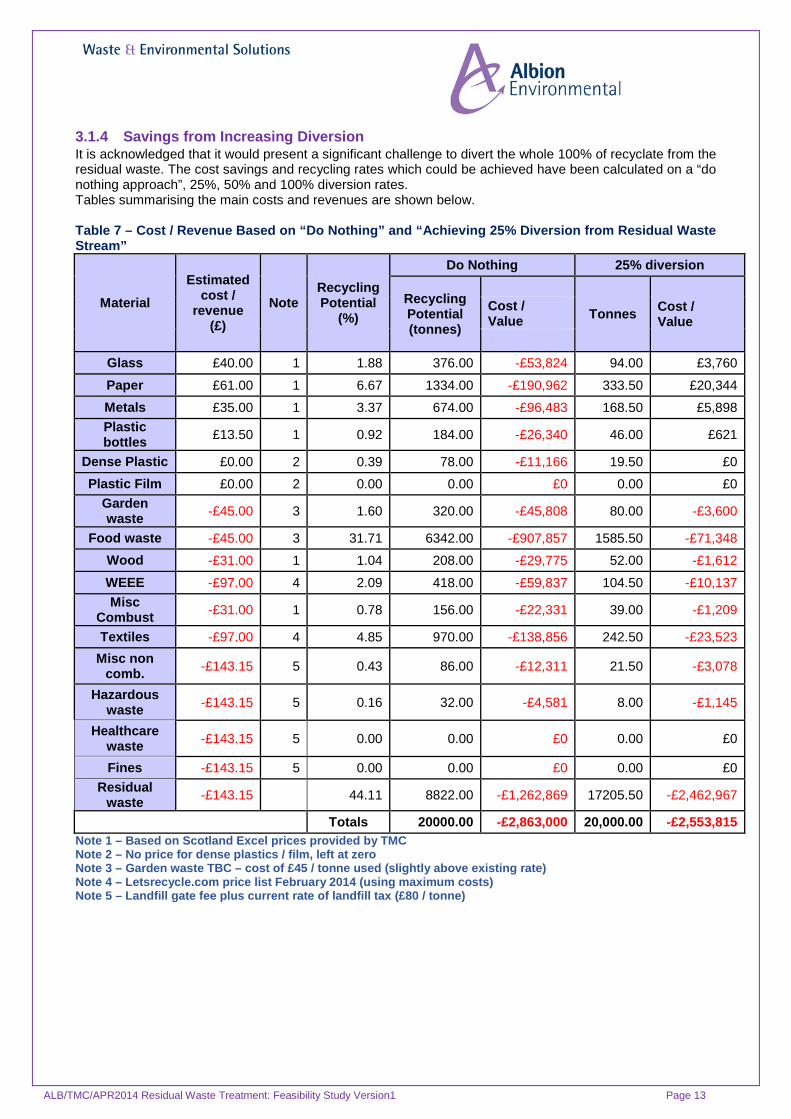
3.1.4 Savings from Increasing Diversion It is acknowledged that it would present a significant challenge to divert the whole 100% of recyclate from the residual waste. The cost savings and recycling rates which could be achieved have been calculated on a “do nothing approach”, 25%, 50% and 100% diversion rates. Tables summarising the main costs and revenues are shown below. Table 7 – Cost / Revenue Based on “Do Nothing” and “Achieving 25% Diversion from Residual Waste Stream”
Material Estimated
cost / revenue
(£) Note
Recycling Potential
(%)
Do Nothing 25% diversion
Recycling Potential (tonnes)
Tonnes Cost / Value
Cost / Value
Glass £40.00 1 1.88 376.00 -£53,824 94.00 £3,760
Paper £61.00 1 6.67 1334.00 -£190,962 333.50 £20,344 Metals £35.00 1 3.37 674.00 -£96,483 168.50 £5,898 Plastic bottles £13.50 1 0.92 184.00 -£26,340 46.00 £621
Dense Plastic £0.00 2 0.39 78.00 -£11,166 19.50 £0 Plastic Film £0.00 2 0.00 0.00 £0 0.00 £0
Garden waste -£45.00 3 1.60 320.00 -£45,808 80.00 -£3,600
Food waste -£45.00 3 31.71 6342.00 -£907,857 1585.50 -£71,348 Wood -£31.00 1 1.04 208.00 -£29,775 52.00 -£1,612
WEEE -£97.00 4 2.09 418.00 -£59,837 104.50 -£10,137 Misc
Combust -£31.00 1 0.78 156.00 -£22,331 39.00 -£1,209
Textiles -£97.00 4 4.85 970.00 -£138,856 242.50 -£23,523 Misc non
comb. -£143.15 5 0.43 86.00 -£12,311 21.50 -£3,078
Hazardous waste -£143.15 5 0.16 32.00 -£4,581 8.00 -£1,145
Healthcare waste -£143.15 5 0.00 0.00 £0 0.00 £0
Fines -£143.15 5 0.00 0.00 £0 0.00 £0 Residual
waste -£143.15 44.11 8822.00 -£1,262,869 17205.50 -£2,462,967
Totals 20000.00 -£2,863,000 20,000.00 -£2,553,815 Note 1 – Based on Scotland Excel prices provided by TMC Note 2 – No price for dense plastics / film, left at zero Note 3 – Garden waste TBC – cost of £45 / tonne used (slightly above existing rate) Note 4 – Letsrecycle.com price list February 2014 (using maximum costs) Note 5 – Landfill gate fee plus current rate of landfill tax (£80 / tonne)
ALB/TMC/APR2014 Residual Waste Treatment: Feasibility Study Version1 Page 14
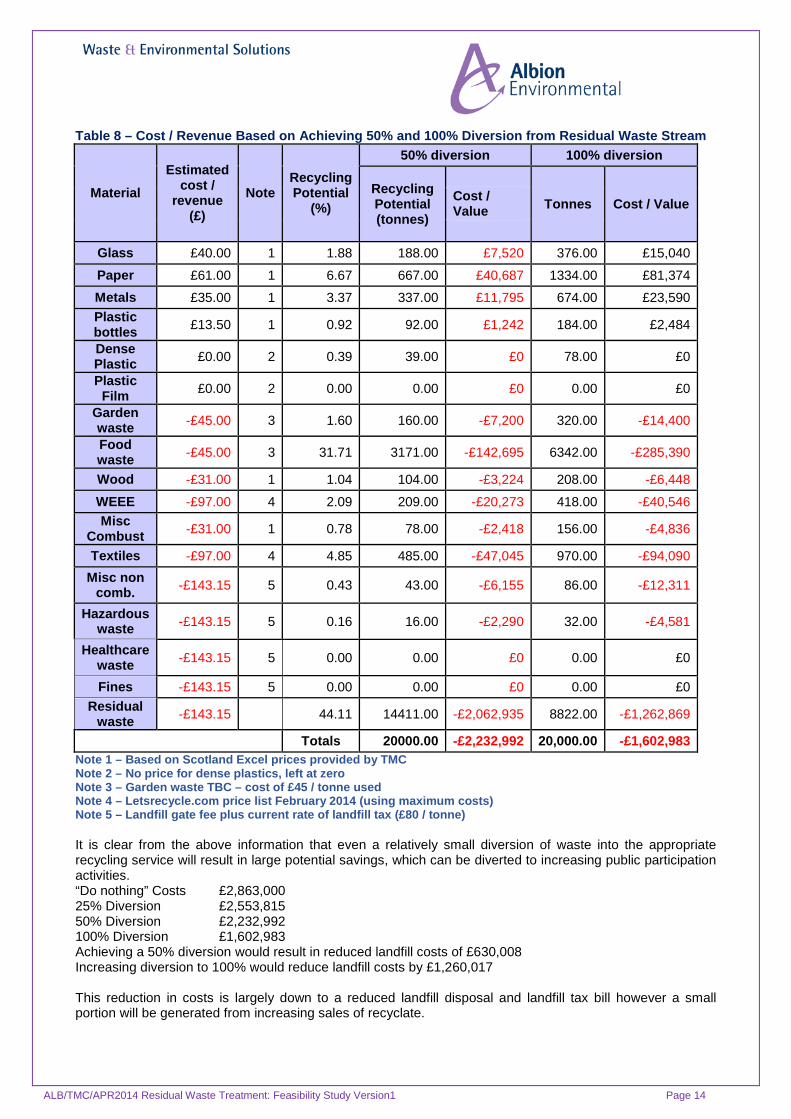
Table 8 – Cost / Revenue Based on Achieving 50% and 100% Diversion from Residual Waste Stream
Material Estimated
cost / revenue
(£) Note
Recycling Potential
(%)
50% diversion 100% diversion
Recycling Potential (tonnes)
Tonnes Cost / Value Cost / Value
Glass £40.00 1 1.88 188.00 £7,520 376.00 £15,040
Paper £61.00 1 6.67 667.00 £40,687 1334.00 £81,374 Metals £35.00 1 3.37 337.00 £11,795 674.00 £23,590 Plastic bottles £13.50 1 0.92 92.00 £1,242 184.00 £2,484
Dense Plastic £0.00 2 0.39 39.00 £0 78.00 £0
Plastic Film £0.00 2 0.00 0.00 £0 0.00 £0
Garden waste -£45.00 3 1.60 160.00 -£7,200 320.00 -£14,400
Food waste -£45.00 3 31.71 3171.00 -£142,695 6342.00 -£285,390
Wood -£31.00 1 1.04 104.00 -£3,224 208.00 -£6,448
WEEE -£97.00 4 2.09 209.00 -£20,273 418.00 -£40,546 Misc
Combust -£31.00 1 0.78 78.00 -£2,418 156.00 -£4,836
Textiles -£97.00 4 4.85 485.00 -£47,045 970.00 -£94,090 Misc non
comb. -£143.15 5 0.43 43.00 -£6,155 86.00 -£12,311
Hazardous waste -£143.15 5 0.16 16.00 -£2,290 32.00 -£4,581
Healthcare waste -£143.15 5 0.00 0.00 £0 0.00 £0
Fines -£143.15 5 0.00 0.00 £0 0.00 £0 Residual
waste -£143.15 44.11 14411.00 -£2,062,935 8822.00 -£1,262,869
Totals 20000.00 -£2,232,992 20,000.00 -£1,602,983 Note 1 – Based on Scotland Excel prices provided by TMC Note 2 – No price for dense plastics, left at zero Note 3 – Garden waste TBC – cost of £45 / tonne used Note 4 – Letsrecycle.com price list February 2014 (using maximum costs) Note 5 – Landfill gate fee plus current rate of landfill tax (£80 / tonne) It is clear from the above information that even a relatively small diversion of waste into the appropriate recycling service will result in large potential savings, which can be diverted to increasing public participation activities. “Do nothing” Costs £2,863,000 25% Diversion £2,553,815 50% Diversion £2,232,992 100% Diversion £1,602,983 Achieving a 50% diversion would result in reduced landfill costs of £630,008 Increasing diversion to 100% would reduce landfill costs by £1,260,017 This reduction in costs is largely down to a reduced landfill disposal and landfill tax bill however a small portion will be generated from increasing sales of recyclate.
ALB/TMC/APR2014 Residual Waste Treatment: Feasibility Study Version1 Page 15
The best return that can be achieved for both the extent of materials presented for recycling and the greatest value achieved commercially is to segregate at source. TMC have shown great progress in achieving almost 60% recycling rates using intelligent methods of collection. With the residents supporting the established systems it is clear that there is a culture to support efforts to drive solutions up the waste hierarchy. Improving the use of the recycling services provides a simple opportunity for TMC to drive up recycling rates, reduce costs and reduce the quantity of residual waste which needs to be handled. This can all be achieved at little or no risk to the Council, and complies with the current Scottish Government strategy of maximising the quality of recyclate by collecting at source.
4.0 Future Waste Growth The general trend across Scotland is that residual waste quantities have been in slow decline in recent years partially due to the poor economic climate and partially due to better quality of data recording. The general consensus is that waste quantities will gradually increase as the economic environment improves. This is a particularly difficult time to try and predict future tonnages as the impact and increased awareness around the implementation of the Waste (Scotland) Regulations 2012 will not be fully established for a number of years. The following predictions have been based on the following information –
• Base data - year 2013/14 data and mean average for the period 2006/12 • Growth data of 0.25%, 0.4% and 0.6% • An assumption that recycling at source as per the spirit of the Waste (Scotland) Regulations 2012
will be the preferred option
4.1 Future Waste Generation To facilitate the understanding of the potential growth in waste volumes to be treated by TMC a model was constructed to highlight the strands of data which could affect the estimated volume of residual waste. The following tables are constructed to build a picture of the arisings both through to the target date for compliance in 2025, and a longer-term prediction through to 2045. The methods to achieve further recovery of the materials highlighted in the residual waste analysis section of this report where potentially 56% of the residual waste could be presented for recycling and material recovery. WRAP reports that ongoing population growth and associated waste generation in households across the UK will potentially increase by 2% year-on-year. However for the utilising data specific to the area we can consider three growth scenarios
1. Using the historic growth of waste data this demonstrates a 4% growth over the previous 16 years and a linear extrapolation of this data is presented at 0.25% per year.
2. Using the Moray Demographics Factsheet published in 2014 using 2012 data this predicts an increase in population in the area of 0.40% per year. This is presented as a linear extrapolation over the period.
3. Using the Moray Demographics Factsheet published in 2014 using 2012 data this predicts an increase in dwellings in the area of 0.60% per year. This is presented as a linear extrapolation over the period.
It should be noted that these factsheets predict population through to 2035 and the analysis below does not take into account the differing recycling behaviours observed by the population when stratified across different social criteria. The historic data supplied to particularise the waste tonnages generated since 2001 show two distinct patterns where from the period 2006 -2012 a total tonnage of the combined recycled and residual waste is noticeably higher than the figures for the following years. To aid understanding of each of the scenarios detailed below two base tonnage levels have been used. Firstly the annualised waste production data for the year 2013/14 and secondly a mean average for the period 2006/12.
ALB/TMC/APR2014 Residual Waste Treatment: Feasibility Study Version1 Page 16
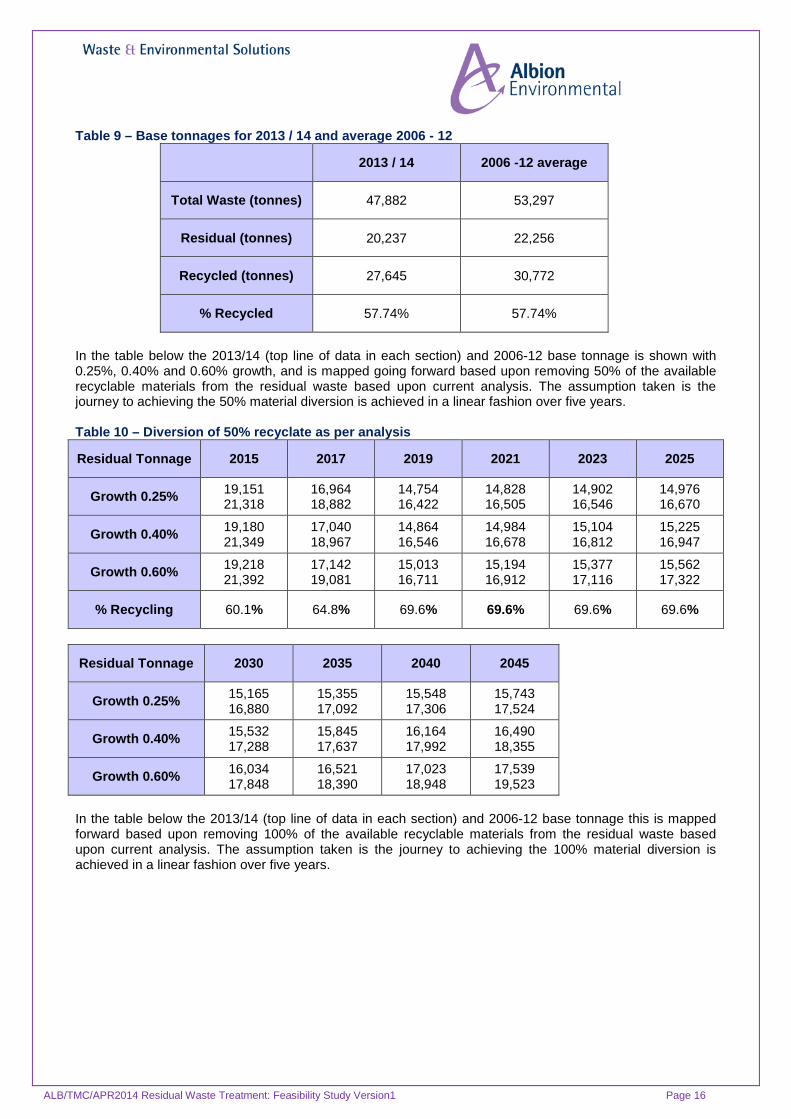
Table 9 – Base tonnages for 2013 / 14 and average 2006 - 12
2013 / 14 2006 -12 average
Total Waste (tonnes) 47,882 53,297
Residual (tonnes) 20,237 22,256
Recycled (tonnes) 27,645 30,772
% Recycled 57.74% 57.74%
In the table below the 2013/14 (top line of data in each section) and 2006-12 base tonnage is shown with 0.25%, 0.40% and 0.60% growth, and is mapped going forward based upon removing 50% of the available recyclable materials from the residual waste based upon current analysis. The assumption taken is the journey to achieving the 50% material diversion is achieved in a linear fashion over five years. Table 10 – Diversion of 50% recyclate as per analysis
Residual Tonnage 2015 2017 2019 2021 2023 2025
Growth 0.25% 19,151 21,318
16,964 18,882
14,754 16,422
14,828 16,505
14,902 16,546
14,976 16,670
Growth 0.40% 19,180 21,349
17,040 18,967
14,864 16,546
14,984 16,678
15,104 16,812
15,225 16,947
Growth 0.60% 19,218 21,392
17,142 19,081
15,013 16,711
15,194 16,912
15,377 17,116
15,562 17,322
% Recycling 60.1% 64.8% 69.6% 69.6% 69.6% 69.6%
Residual Tonnage 2030 2035 2040 2045
Growth 0.25% 15,165 16,880
15,355 17,092
15,548 17,306
15,743 17,524
Growth 0.40% 15,532 17,288
15,845 17,637
16,164 17,992
16,490 18,355
Growth 0.60% 16,034 17,848
16,521 18,390
17,023 18,948
17,539 19,523
In the table below the 2013/14 (top line of data in each section) and 2006-12 base tonnage this is mapped forward based upon removing 100% of the available recyclable materials from the residual waste based upon current analysis. The assumption taken is the journey to achieving the 100% material diversion is achieved in a linear fashion over five years.

ALB/TMC/APR2014 Residual Waste Treatment: Feasibility Study Version1 Page 17
Table 11 – Diversion of 100% recyclate as per analysis
Residual Tonnage 2015 2017 2019 2021 2023 2025
Growth 0.25% 19,151 21,318
16,964 18,882
14,754 16,442
12,521 13,937
10,266 11,427
9,152 10,187
Growth 0.40% 19,180 21,349
17,040 18,967
14,864 16,546
12,653 14,084
10,405 11,582
9,304 10,356
Growth 0.60% 19,218 21,392
17,142 19,081
15,013 16,711
12,830 14,281
10,593 11,791
9,510 10,585
% Recycling 60.1% 64.8% 69.6% 74.3% 79.0% 81.4%
Residual Tonnage 2030 2035 2040 2045
Growth 0.25% 9,267 10,315
9,384 10,445
9,502 10,576
9,621 10,709
Growth 0.40% 9,492 10,565
9,683 10,778
9,878 10,995
10,077 11,217
Growth 0.60% 9,799 10,907
10,096 11,238
10,403 11,579
10,719 11,931
In the table below the 2013/14 (top line of data in each section) and 2006-12 base tonnage this is mapped forward to hit the legal minimum requirements for 60% recycling by 2020, 70% recycling by 2025, the diversion of all metals and dense plastics and no more than 5% material permitted to landfill disposal diverting available recyclable materials from the residual waste based upon current analysis. The assumption taken is the journey to achieving this will be completed in a linear manner to hit the target dates Table 12 – Diversion as per legal targets
Residual Tonnage 2015 2017 2019 2021 2023 2025
Growth 0.25% 19,720 21,950
19,590 21,806
19,458 21,659
18,864 20,997
17,220 19,167
14,743 16,411
Growth 0.40% 19,749 21,983
19,678 21,904
19,832 21,571
19,062 21,218
17,453 19,427
14,988 16,683
Growth 0.60% 19,788 22,026
19,796 22,035
19,801 22,040
19,330 21,516
17,769 19,778
15,320 17,052
% Recycling 58.9% 59.4% 59.9% 61.3% 64.8% 70%
Residual Tonnage 2030 2035 2040 2045
Growth 0.25% 14,929 16,617
15,116 16,826
15,306 17,037
15,498 17,251
Growth 0.40% 15,290 17,019
15,598 17,362
15,913 17,713
16,234 18,070
Growth 0.60% 15,785 17,570
16,264 18,103
16,758 18,653
17,267 19,219
Using this information a best estimate and data map can be drawn building on the baseline data and elevated sensitivity with a predicted waste growth from population increase of 0.25%, 0.4%, 0.6% and the extraction of recoverable materials from the residual waste of both 50% and 100%.
ALB/TMC/APR2014 Residual Waste Treatment: Feasibility Study Version1 Page 18
See over the page for Graph 1. The trend and information indicate that it will be several years until a stable waste output picture can be understood as TMC achieve the recycling targets. It is clear that there is an opportunity to increase recycling, decrease disposal costs and meet recycling targets by an increased focus on ensuring the correct waste is placed in the correct bin. On the assumption that TMC would wish to encourage the use of waste further up the waste hierarchy, and utilise the existing collection service this analysis would indicate that a residual waste solution should be designed with a tolerance between 9,500 tonnes per annum and 18,000 tonnes per annum with an anticipated arising of circa 14,000 tonnes per annum. Tonnages relating to commercial waste should also be considered and they are included in section 4.3.

ALB/TMC/APR2014 Residual Waste Treatment: Feasibility Study Version1 Page 19
Graph 1 – Projected Waste Tonnages
0
5,000
10,000
15,000
20,000
25,000
2015
2016
2017
2018
2019
2020
2021
2022
2023
2024
2025
2026
2027
2028
2029
2030
2031
2032
2033
2034
2035
2036
2037
2038
2039
2040
2041
2042
2043
2044
2045
Combined Residual Waste Statistical View
Flex of 2013/14 with 0.25% annual waste growth recovering 50% of recyclable materials in residualwaste plus metals and plastic
Flex of 2006/12 average with 0.25% annual waste growth recovering 50% of recyclable materials inresidual waste plus metals and plastic
Flex of 2013/14 with 0.4% annual waste growth recovering 50% of recyclable materials in residualwaste plus metals and plastic
Flex of 2006/12 average with 0.4% annual waste growth recovering 50% of recyclable materials inresidual waste plus metals and plastic
Flex of 2013/14 with 0.6% annual waste growth recovering 50% of recyclable materials in residualwaste plus metals and plastic
Flex of 2006/12 average with 0.6% annual waste growth recovering 50% of recyclable materials inresidual waste plus metals and plastic
Flex of 2013/14 with 0.25% annual waste growth recovering 100% of recyclable materials in residualwaste
Flex of 2006/12 average with 0.25% annual waste growth recovering 100% of recyclable materials inresidual waste
Flex of 2013/14 with 0.4% annual waste growth recovering 100% of recyclable materials in residualwaste plus metals and plastic
Flex of 2006/12 average with 0.4% annual waste growth recovering 100% of recyclable materials inresidual waste plus metals and plastic
Flex of 2013/14 with 0.6% annual waste growth recovering 100% of recyclable materials in residualwaste plus metals and plastic
Flex of 2006/12 average with 0.6% annual waste growth recovering 100% of recyclable materials inresidual waste plus metals and plastic
Average

ALB/TMC/APR2014 Residual Waste Treatment: Feasibility Study Version1 Page 20
4.2 Recycling via a Material Recycling Facility (MRF) An alternative to continued efforts to source segregate the recyclable waste streams would be to establish a facility to extract the recyclable materials presented as co-mingled. As this facility would accept residual waste it would be classified as a “dirty MRF” with the capability to extract recyclate. This recyclate will be dirty and is likely to achieve a lower commercial value. It is also less likely to be able to extract the maximum amount of recyclables from the residual waste. The materials are generally cross contaminated and with the maturity of markets for recyclable materials, lower grade materials are seen as less desirable and could realistically have no buyer at all. 4.2.1 Future Waste Predictions for Recycling via a MRF To facilitate the understanding of the potential growth in waste volumes to be treated by TMC a model was constructed to highlight the strands of data which could affect the estimated volume of residual waste. The following tables are constructed to build a picture of the arisings both through to the target date for compliance in 2025 and a longer-term prediction through to 2045 Within the strategy section of this report it is discussed the methods to achieve further recovery from the residual waste of the materials highlighted in the residual waste analysis section of this report where potentially two thirds of the residual waste could be presented for recycling and material recovery. An alternative solution where all residual waste is presented to a TMC facility, or contractor designated by TMC, is discussed here to understand the size of facility to receive waste and the ultimate expected tonnage of residual waste for treatment after the extraction of recyclable materials WRAP reports that ongoing population growth and associated waste generation in households across the UK will potentially increase by 2% year-on-year. However for the utilising data specific to the area we can consider three growth scenarios
1. Using the historic growth of waste data this demonstrates a 4% growth over the previous 16 years and a linear extrapolation of this data is presented at 0.25% per year.
2. Using the Moray Demographics Factsheet published in 2014 using 2012 data this predicts an increase in population in the area of 0.40% per year. This is presented as a linear extrapolation over the period.
3. Using the Moray Demographics Factsheet published in 2014 using 2012 data this predicts an increase in dwellings in the area of 0.60% per year. This is presented as a linear extrapolation over the period.
It should be noted that these factsheets predict population through to 2035 and the analysis below does not take into account the differing recycling behaviours observed by the population when stratified across different social criteria. The historic data supplied to particularise the waste tonnages generated since 2001 show two distinct patterns where from the period 2006 -2012 a total tonnage of the combined recycled and residual waste is noticeably higher than the figures for the following years. To aid understanding of each of the scenarios detailed below two base tonnage levels have been used. Firstly the annualised waste production data for the year 2013/14 (top line of data in each section) and secondly a mean average for the period 2006/12.
ALB/TMC/APR2014 Residual Waste Treatment: Feasibility Study Version1 Page 21
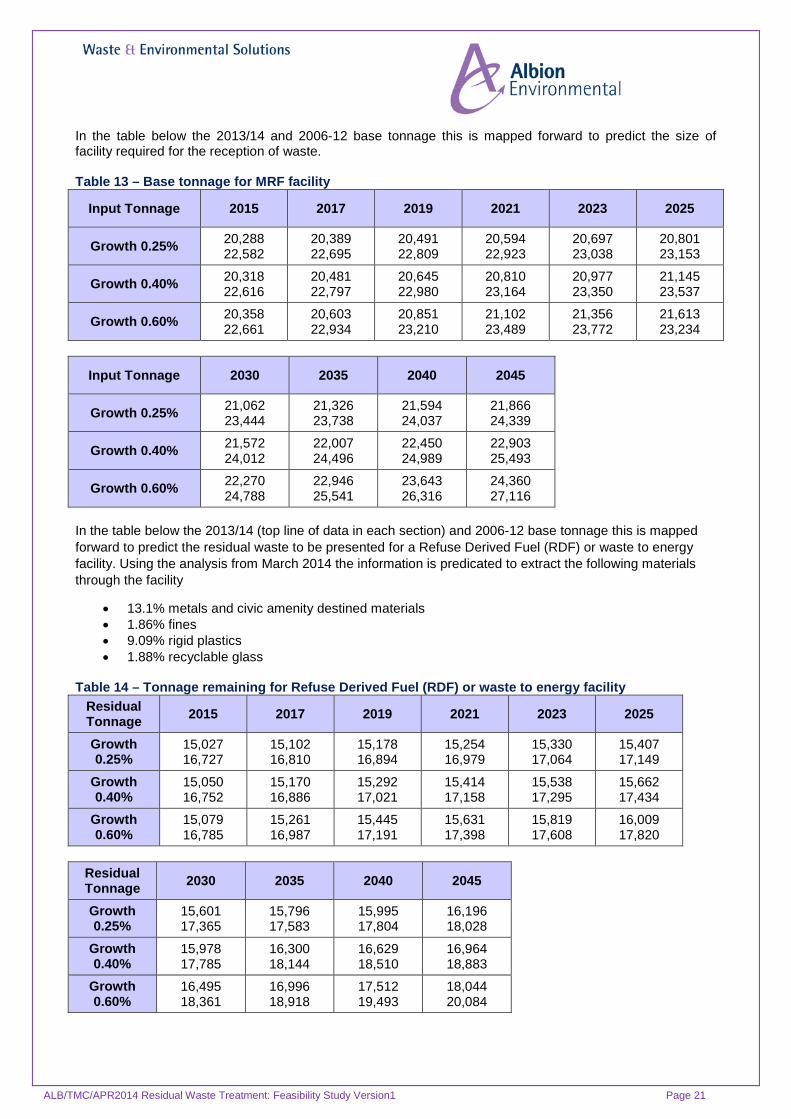
In the table below the 2013/14 and 2006-12 base tonnage this is mapped forward to predict the size of facility required for the reception of waste. Table 13 – Base tonnage for MRF facility
Input Tonnage 2015 2017 2019 2021 2023 2025
Growth 0.25% 20,288 22,582
20,389 22,695
20,491 22,809
20,594 22,923
20,697 23,038
20,801 23,153
Growth 0.40% 20,318 22,616
20,481 22,797
20,645 22,980
20,810 23,164
20,977 23,350
21,145 23,537
Growth 0.60% 20,358 22,661
20,603 22,934
20,851 23,210
21,102 23,489
21,356 23,772
21,613 23,234
Input Tonnage 2030 2035 2040 2045
Growth 0.25% 21,062 23,444
21,326 23,738
21,594 24,037
21,866 24,339
Growth 0.40% 21,572 24,012
22,007 24,496
22,450 24,989
22,903 25,493
Growth 0.60% 22,270 24,788
22,946 25,541
23,643 26,316
24,360 27,116
In the table below the 2013/14 (top line of data in each section) and 2006-12 base tonnage this is mapped forward to predict the residual waste to be presented for a Refuse Derived Fuel (RDF) or waste to energy facility. Using the analysis from March 2014 the information is predicated to extract the following materials through the facility
• 13.1% metals and civic amenity destined materials • 1.86% fines • 9.09% rigid plastics • 1.88% recyclable glass
Table 14 – Tonnage remaining for Refuse Derived Fuel (RDF) or waste to energy facility
Residual Tonnage 2015 2017 2019 2021 2023 2025
Growth 0.25%
15,027 16,727
15,102 16,810
15,178 16,894
15,254 16,979
15,330 17,064
15,407 17,149
Growth 0.40%
15,050 16,752
15,170 16,886
15,292 17,021
15,414 17,158
15,538 17,295
15,662 17,434
Growth 0.60%
15,079 16,785
15,261 16,987
15,445 17,191
15,631 17,398
15,819 17,608
16,009 17,820
Residual Tonnage 2030 2035 2040 2045
Growth 0.25%
15,601 17,365
15,796 17,583
15,995 17,804
16,196 18,028
Growth 0.40%
15,978 17,785
16,300 18,144
16,629 18,510
16,964 18,883
Growth 0.60%
16,495 18,361
16,996 18,918
17,512 19,493
18,044 20,084
ALB/TMC/APR2014 Residual Waste Treatment: Feasibility Study Version1 Page 22
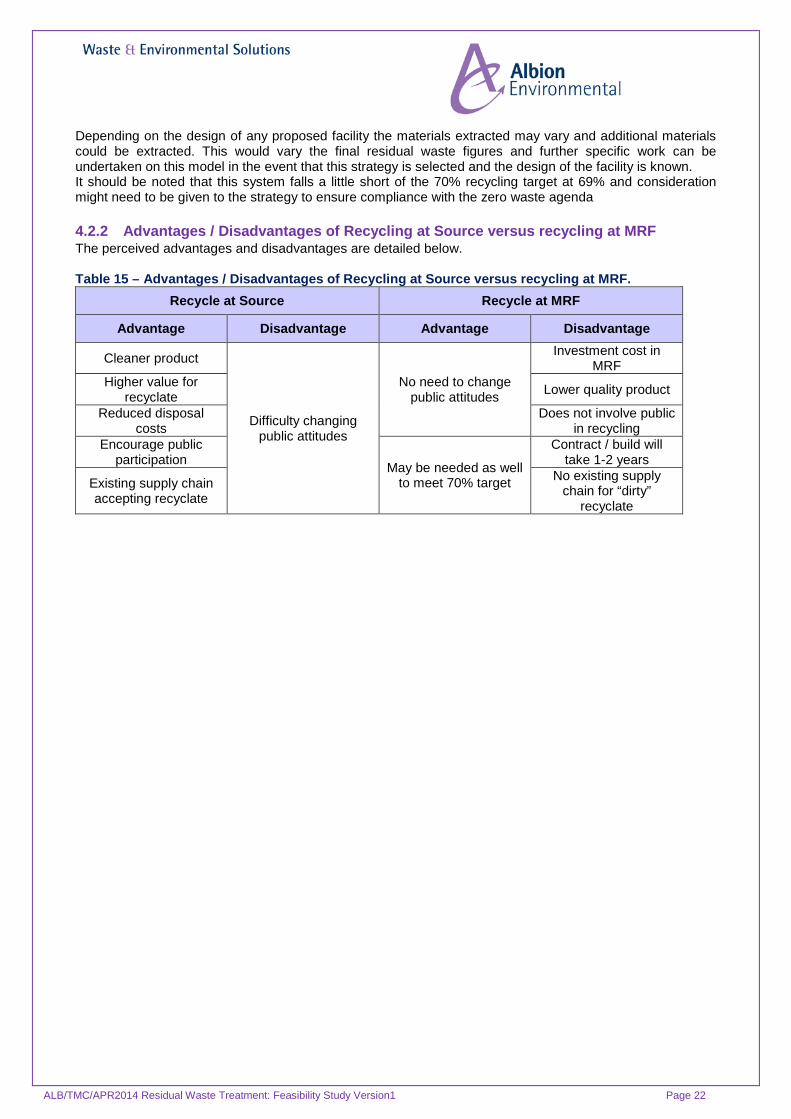
Depending on the design of any proposed facility the materials extracted may vary and additional materials could be extracted. This would vary the final residual waste figures and further specific work can be undertaken on this model in the event that this strategy is selected and the design of the facility is known. It should be noted that this system falls a little short of the 70% recycling target at 69% and consideration might need to be given to the strategy to ensure compliance with the zero waste agenda 4.2.2 Advantages / Disadvantages of Recycling at Source versus recycling at MRF The perceived advantages and disadvantages are detailed below. Table 15 – Advantages / Disadvantages of Recycling at Source versus recycling at MRF.
Recycle at Source Recycle at MRF
Advantage Disadvantage Advantage Disadvantage
Cleaner product
Difficulty changing public attitudes
No need to change public attitudes
Investment cost in MRF
Higher value for recyclate Lower quality product
Reduced disposal costs
Does not involve public in recycling
Encourage public participation May be needed as well
to meet 70% target
Contract / build will take 1-2 years
Existing supply chain accepting recyclate
No existing supply chain for “dirty”
recyclate
ALB/TMC/APR2014 Residual Waste Treatment: Feasibility Study Version1 Page 23
4.3 Commercial Waste The waste data and understanding of the demographics and geography of the location of TMC shows historic evidence that a high proportion of local commercial business currently direct residual waste to the council owned landfill facility. Businesses in Scotland have the same obligations, responsibilities and targets from the zero waste agenda and as such could support an alternative solution for the residual waste when targets for diversion of material from landfill hit threshold dates. Whilst these obligations exist and the geography of TMC indicate that any residual waste treatment strategy may be supported by the residual waste tonnage from commercial businesses in the area this should not be relied upon. The quantity of commercial waste accepted by TMC has varied considerably in the last 10 years from a low of 5,246 tonnes (2007/08) to a high of 8,482 tonnes (2004/05). The overall commercial recycling rate has also varied considerably from a high of 56.71% (2007/08) to a recent low of 24.69% (2012/13). However, approximately 2,000 tonnes is attributable to arising’s from the Council’s street sweeping activities which is difficult to recycle. The Waste (Scotland) Regulations 2012 place a requirement on businesses to
• Present metal, plastic, glass, paper and card separately for collection from 1st January 2014. • If they run a food business which produces over 50kg of food waste per week, they must present it
for separate collection from 1st January 2014. • The requirement to present food waste for separate collection will extend to all food businesses
which produces over 5kg of food waste per week 1st January 2016. This is likely to have a significant reduction in the quantity of residual waste which is available for any waste treatment facility. Businesses are only obligated to reach the targets and no responsibility to direct their residual waste to a council sponsored facility. The data supplied does not support a reliable planning tool and as such it is recommended that commercial waste volumes and commitments should either be
• Not considered in any decision to determine the feasibility of solutions for household residual waste. • Further work should be carried out on the raw data to establish trends and possible commercial
waste quantities. In summary taking into account the lack of facilities in the area there is likely to be some commercial residual waste available for any proposed facility however further work is required to determine quantities in future years. 4.4 Level of confidence in residual waste tonnage One of the outcomes of this report is to provide a statement on the level of confidence that can be given to annual residual waste tonnage and composition, forecasting over the short to medium term (5 years) and the lifetime. The following statements can be provided.
4.4.1 Residual Waste Tonnage Analysis of the tonnage data suggests that a residual waste solution should be designed with a tolerance between 9,500 tonnes per annum and 18,000 tonnes per annum with an anticipated arising of circa 14,000 tonnes per annum. Confidence in this range will be wholly dependent on the effort which is applied by TMC to increase use of the recycling service. The more successful TMC are the lower the overall tonnage which will be available for a treatment facility. Due to the varying tonnage of commercial residual waste and the varying recycling level being achieved it is not possible to determine with any accuracy the commercial residual waste tonnage which may be available for a new facility. As the Waste (Scotland) Regulations 2012 take effect and businesses put in place separate collection systems it would be reasonable to expect the commercial residual waste quantities to decline. It may be possible to determine the expected quantity of commercial residual waste by a very detailed analysis of the raw weighbridge data. However even if historical trends can be established there will be little data to determine the impact of the Waste (Scotland) Regulations 2012 on commercial residual waste tonnages, apart from the fact they are liable to decline.
ALB/TMC/APR2014 Residual Waste Treatment: Feasibility Study Version1 Page 24
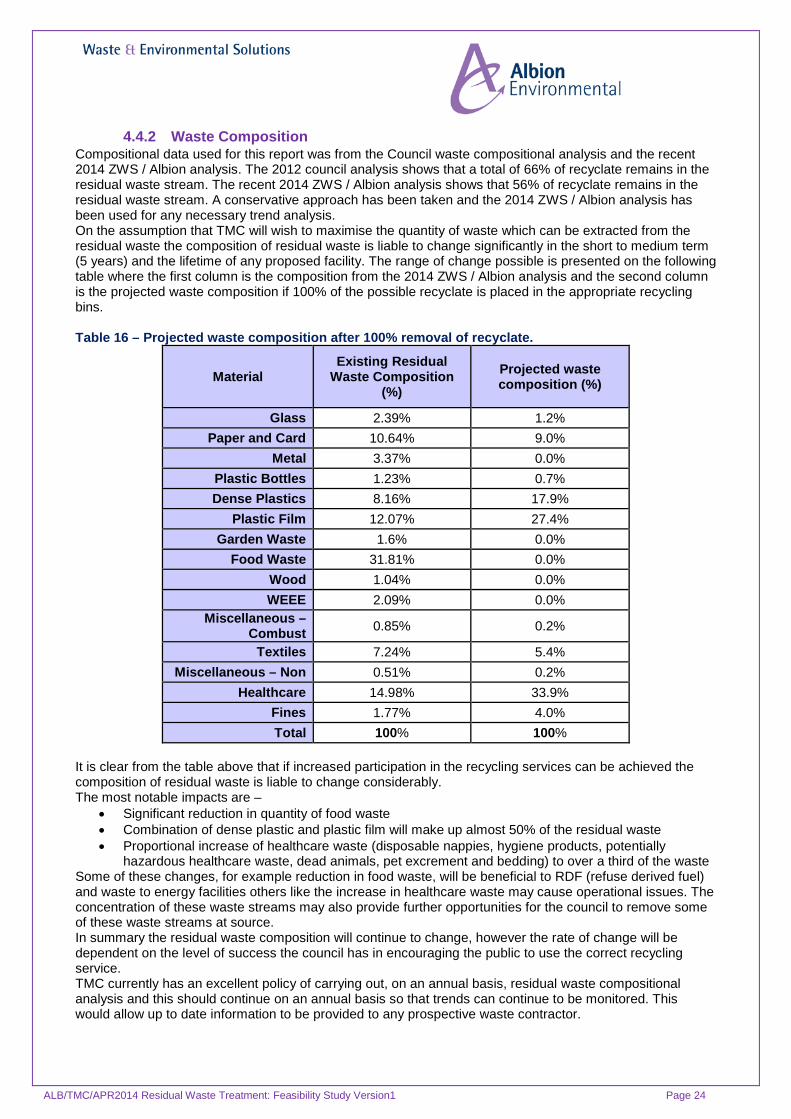
4.4.2 Waste Composition Compositional data used for this report was from the Council waste compositional analysis and the recent 2014 ZWS / Albion analysis. The 2012 council analysis shows that a total of 66% of recyclate remains in the residual waste stream. The recent 2014 ZWS / Albion analysis shows that 56% of recyclate remains in the residual waste stream. A conservative approach has been taken and the 2014 ZWS / Albion analysis has been used for any necessary trend analysis. On the assumption that TMC will wish to maximise the quantity of waste which can be extracted from the residual waste the composition of residual waste is liable to change significantly in the short to medium term (5 years) and the lifetime of any proposed facility. The range of change possible is presented on the following table where the first column is the composition from the 2014 ZWS / Albion analysis and the second column is the projected waste composition if 100% of the possible recyclate is placed in the appropriate recycling bins. Table 16 – Projected waste composition after 100% removal of recyclate.
Material Existing Residual
Waste Composition (%)
Projected waste composition (%)
Glass 2.39% 1.2% Paper and Card 10.64% 9.0%
Metal 3.37% 0.0% Plastic Bottles 1.23% 0.7% Dense Plastics 8.16% 17.9%
Plastic Film 12.07% 27.4% Garden Waste 1.6% 0.0%
Food Waste 31.81% 0.0% Wood 1.04% 0.0% WEEE 2.09% 0.0%
Miscellaneous – Combust 0.85% 0.2%
Textiles 7.24% 5.4% Miscellaneous – Non 0.51% 0.2%
Healthcare 14.98% 33.9% Fines 1.77% 4.0% Total 100% 100%
It is clear from the table above that if increased participation in the recycling services can be achieved the composition of residual waste is liable to change considerably. The most notable impacts are –
• Significant reduction in quantity of food waste • Combination of dense plastic and plastic film will make up almost 50% of the residual waste • Proportional increase of healthcare waste (disposable nappies, hygiene products, potentially
hazardous healthcare waste, dead animals, pet excrement and bedding) to over a third of the waste Some of these changes, for example reduction in food waste, will be beneficial to RDF (refuse derived fuel) and waste to energy facilities others like the increase in healthcare waste may cause operational issues. The concentration of these waste streams may also provide further opportunities for the council to remove some of these waste streams at source. In summary the residual waste composition will continue to change, however the rate of change will be dependent on the level of success the council has in encouraging the public to use the correct recycling service. TMC currently has an excellent policy of carrying out, on an annual basis, residual waste compositional analysis and this should continue on an annual basis so that trends can continue to be monitored. This would allow up to date information to be provided to any prospective waste contractor.
ALB/TMC/APR2014 Residual Waste Treatment: Feasibility Study Version1 Page 25
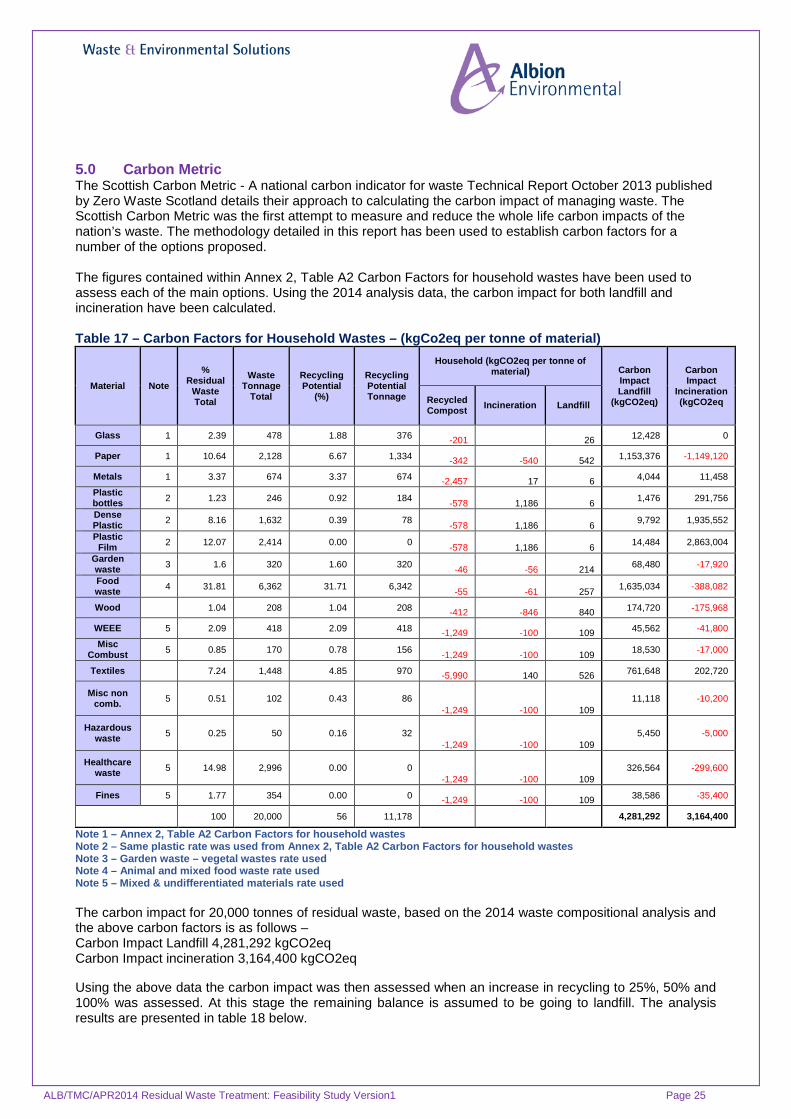
5.0 Carbon Metric The Scottish Carbon Metric - A national carbon indicator for waste Technical Report October 2013 published by Zero Waste Scotland details their approach to calculating the carbon impact of managing waste. The Scottish Carbon Metric was the first attempt to measure and reduce the whole life carbon impacts of the nation’s waste. The methodology detailed in this report has been used to establish carbon factors for a number of the options proposed. The figures contained within Annex 2, Table A2 Carbon Factors for household wastes have been used to assess each of the main options. Using the 2014 analysis data, the carbon impact for both landfill and incineration have been calculated. Table 17 – Carbon Factors for Household Wastes – (kgCo2eq per tonne of material)
Material Note %
Residual Waste Total
Waste Tonnage
Total
Recycling Potential
(%)
Recycling Potential Tonnage
Household (kgCO2eq per tonne of material) Carbon
Impact Landfill
(kgCO2eq)
Carbon Impact
Incineration (kgCO2eq Recycled
Compost Incineration Landfill
Glass 1 2.39 478 1.88 376 -201 26 12,428 0
Paper 1 10.64 2,128 6.67 1,334 -342 -540 542 1,153,376 -1,149,120
Metals 1 3.37 674 3.37 674 -2,457 17 6 4,044 11,458
Plastic bottles 2 1.23 246 0.92 184 -578 1,186 6 1,476 291,756
Dense Plastic 2 8.16 1,632 0.39 78 -578 1,186 6 9,792 1,935,552
Plastic Film 2 12.07 2,414 0.00 0 -578 1,186 6 14,484 2,863,004
Garden waste 3 1.6 320 1.60 320 -46 -56 214 68,480 -17,920
Food waste 4 31.81 6,362 31.71 6,342 -55 -61 257 1,635,034 -388,082
Wood 1.04 208 1.04 208 -412 -846 840 174,720 -175,968
WEEE 5 2.09 418 2.09 418 -1,249 -100 109 45,562 -41,800
Misc Combust 5 0.85 170 0.78 156 -1,249 -100 109 18,530 -17,000
Textiles 7.24 1,448 4.85 970 -5,990 140 526 761,648 202,720
Misc non comb. 5 0.51 102 0.43 86
-1,249 -100 109 11,118 -10,200
Hazardous waste 5 0.25 50 0.16 32
-1,249 -100 109 5,450 -5,000
Healthcare waste 5 14.98 2,996 0.00 0
-1,249 -100 109 326,564 -299,600
Fines 5 1.77 354 0.00 0 -1,249 -100 109 38,586 -35,400
100 20,000 56 11,178 4,281,292 3,164,400
Note 1 – Annex 2, Table A2 Carbon Factors for household wastes Note 2 – Same plastic rate was used from Annex 2, Table A2 Carbon Factors for household wastes Note 3 – Garden waste – vegetal wastes rate used Note 4 – Animal and mixed food waste rate used Note 5 – Mixed & undifferentiated materials rate used The carbon impact for 20,000 tonnes of residual waste, based on the 2014 waste compositional analysis and the above carbon factors is as follows – Carbon Impact Landfill 4,281,292 kgCO2eq Carbon Impact incineration 3,164,400 kgCO2eq Using the above data the carbon impact was then assessed when an increase in recycling to 25%, 50% and 100% was assessed. At this stage the remaining balance is assumed to be going to landfill. The analysis results are presented in table 18 below.
ALB/TMC/APR2014 Residual Waste Treatment: Feasibility Study Version1 Page 26
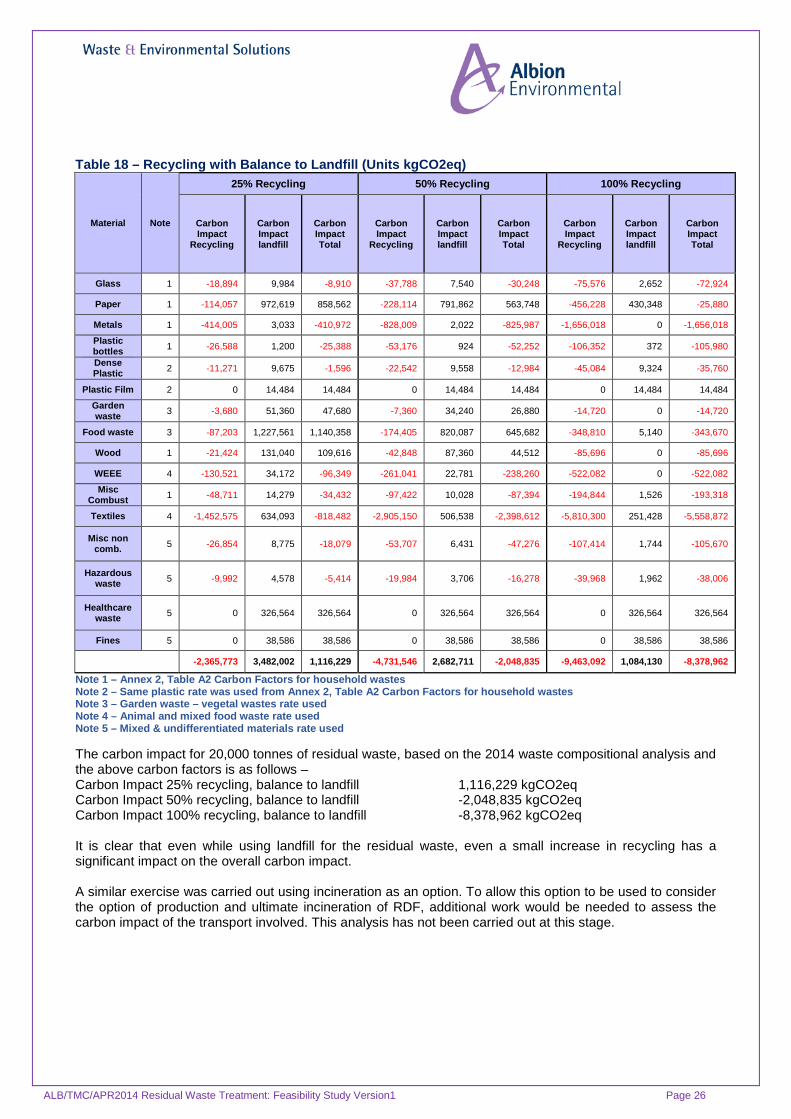
Table 18 – Recycling with Balance to Landfill (Units kgCO2eq)
Material Note
25% Recycling 50% Recycling 100% Recycling
Carbon Impact
Recycling
Carbon Impact landfill
Carbon Impact Total
Carbon Impact
Recycling
Carbon Impact landfill
Carbon Impact Total
Carbon Impact
Recycling
Carbon Impact landfill
Carbon Impact Total
Glass 1 -18,894 9,984 -8,910 -37,788 7,540 -30,248 -75,576 2,652 -72,924
Paper 1 -114,057 972,619 858,562 -228,114 791,862 563,748 -456,228 430,348 -25,880
Metals 1 -414,005 3,033 -410,972 -828,009 2,022 -825,987 -1,656,018 0 -1,656,018
Plastic bottles 1 -26,588 1,200 -25,388 -53,176 924 -52,252 -106,352 372 -105,980
Dense Plastic 2 -11,271 9,675 -1,596 -22,542 9,558 -12,984 -45,084 9,324 -35,760
Plastic Film 2 0 14,484 14,484 0 14,484 14,484 0 14,484 14,484
Garden waste 3 -3,680 51,360 47,680 -7,360 34,240 26,880 -14,720 0 -14,720
Food waste 3 -87,203 1,227,561 1,140,358 -174,405 820,087 645,682 -348,810 5,140 -343,670
Wood 1 -21,424 131,040 109,616 -42,848 87,360 44,512 -85,696 0 -85,696
WEEE 4 -130,521 34,172 -96,349 -261,041 22,781 -238,260 -522,082 0 -522,082
Misc Combust 1 -48,711 14,279 -34,432 -97,422 10,028 -87,394 -194,844 1,526 -193,318
Textiles 4 -1,452,575 634,093 -818,482 -2,905,150 506,538 -2,398,612 -5,810,300 251,428 -5,558,872
Misc non comb. 5 -26,854 8,775 -18,079 -53,707 6,431 -47,276 -107,414 1,744 -105,670
Hazardous waste 5 -9,992 4,578 -5,414 -19,984 3,706 -16,278 -39,968 1,962 -38,006
Healthcare waste 5 0 326,564 326,564 0 326,564 326,564 0 326,564 326,564
Fines 5 0 38,586 38,586 0 38,586 38,586 0 38,586 38,586
-2,365,773 3,482,002 1,116,229 -4,731,546 2,682,711 -2,048,835 -9,463,092 1,084,130 -8,378,962
Note 1 – Annex 2, Table A2 Carbon Factors for household wastes Note 2 – Same plastic rate was used from Annex 2, Table A2 Carbon Factors for household wastes Note 3 – Garden waste – vegetal wastes rate used Note 4 – Animal and mixed food waste rate used Note 5 – Mixed & undifferentiated materials rate used
The carbon impact for 20,000 tonnes of residual waste, based on the 2014 waste compositional analysis and the above carbon factors is as follows – Carbon Impact 25% recycling, balance to landfill 1,116,229 kgCO2eq Carbon Impact 50% recycling, balance to landfill -2,048,835 kgCO2eq Carbon Impact 100% recycling, balance to landfill -8,378,962 kgCO2eq It is clear that even while using landfill for the residual waste, even a small increase in recycling has a significant impact on the overall carbon impact. A similar exercise was carried out using incineration as an option. To allow this option to be used to consider the option of production and ultimate incineration of RDF, additional work would be needed to assess the carbon impact of the transport involved. This analysis has not been carried out at this stage.
ALB/TMC/APR2014 Residual Waste Treatment: Feasibility Study Version1 Page 27
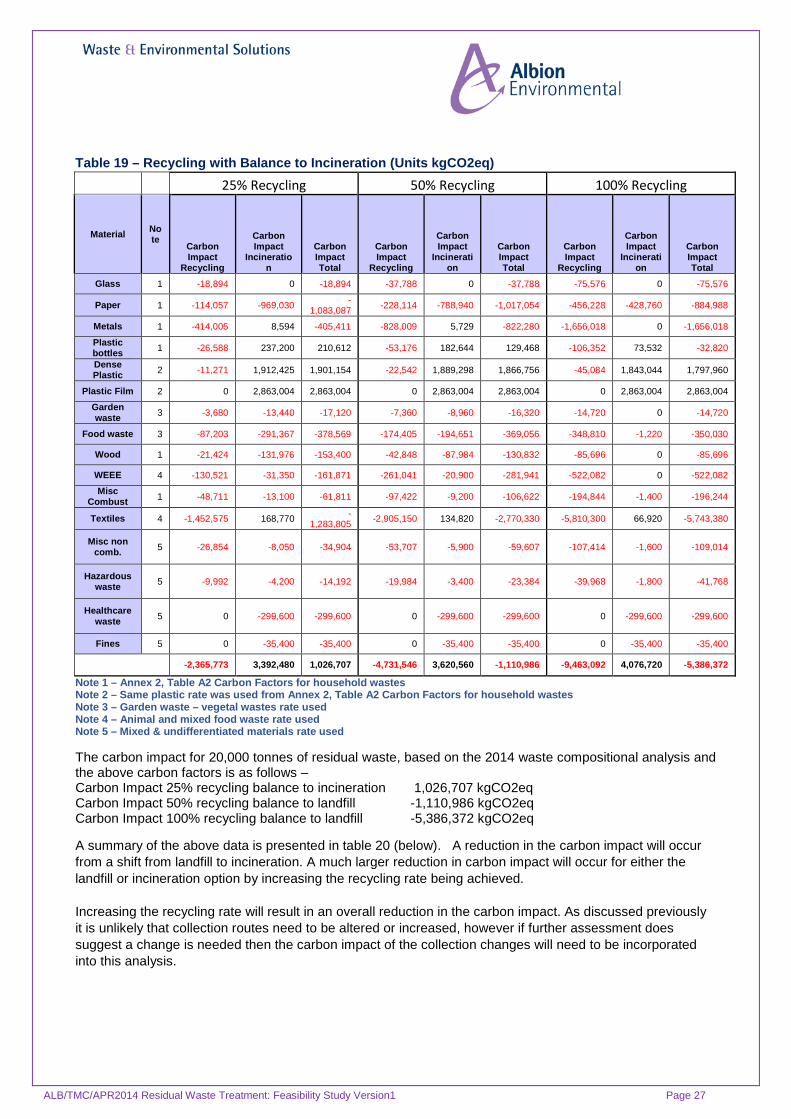
Table 19 – Recycling with Balance to Incineration (Units kgCO2eq)
25% Recycling 50% Recycling 100% Recycling
Material Note
Carbon Impact
Recycling
Carbon Impact
Incineration
Carbon Impact Total
Carbon Impact
Recycling
Carbon Impact
Incineration
Carbon Impact Total
Carbon Impact
Recycling
Carbon Impact
Incineration
Carbon Impact Total
Glass 1 -18,894 0 -18,894 -37,788 0 -37,788 -75,576 0 -75,576
Paper 1 -114,057 -969,030 -1,083,087 -228,114 -788,940 -1,017,054 -456,228 -428,760 -884,988
Metals 1 -414,005 8,594 -405,411 -828,009 5,729 -822,280 -1,656,018 0 -1,656,018
Plastic bottles 1 -26,588 237,200 210,612 -53,176 182,644 129,468 -106,352 73,532 -32,820
Dense Plastic 2 -11,271 1,912,425 1,901,154 -22,542 1,889,298 1,866,756 -45,084 1,843,044 1,797,960
Plastic Film 2 0 2,863,004 2,863,004 0 2,863,004 2,863,004 0 2,863,004 2,863,004
Garden waste 3 -3,680 -13,440 -17,120 -7,360 -8,960 -16,320 -14,720 0 -14,720
Food waste 3 -87,203 -291,367 -378,569 -174,405 -194,651 -369,056 -348,810 -1,220 -350,030
Wood 1 -21,424 -131,976 -153,400 -42,848 -87,984 -130,832 -85,696 0 -85,696
WEEE 4 -130,521 -31,350 -161,871 -261,041 -20,900 -281,941 -522,082 0 -522,082
Misc Combust 1 -48,711 -13,100 -61,811 -97,422 -9,200 -106,622 -194,844 -1,400 -196,244
Textiles 4 -1,452,575 168,770 -1,283,805 -2,905,150 134,820 -2,770,330 -5,810,300 66,920 -5,743,380
Misc non comb. 5 -26,854 -8,050 -34,904 -53,707 -5,900 -59,607 -107,414 -1,600 -109,014
Hazardous waste 5 -9,992 -4,200 -14,192 -19,984 -3,400 -23,384 -39,968 -1,800 -41,768
Healthcare waste 5 0 -299,600 -299,600 0 -299,600 -299,600 0 -299,600 -299,600
Fines 5 0 -35,400 -35,400 0 -35,400 -35,400 0 -35,400 -35,400
-2,365,773 3,392,480 1,026,707 -4,731,546 3,620,560 -1,110,986 -9,463,092 4,076,720 -5,386,372
Note 1 – Annex 2, Table A2 Carbon Factors for household wastes Note 2 – Same plastic rate was used from Annex 2, Table A2 Carbon Factors for household wastes Note 3 – Garden waste – vegetal wastes rate used Note 4 – Animal and mixed food waste rate used Note 5 – Mixed & undifferentiated materials rate used
The carbon impact for 20,000 tonnes of residual waste, based on the 2014 waste compositional analysis and the above carbon factors is as follows – Carbon Impact 25% recycling balance to incineration 1,026,707 kgCO2eq Carbon Impact 50% recycling balance to landfill -1,110,986 kgCO2eq Carbon Impact 100% recycling balance to landfill -5,386,372 kgCO2eq
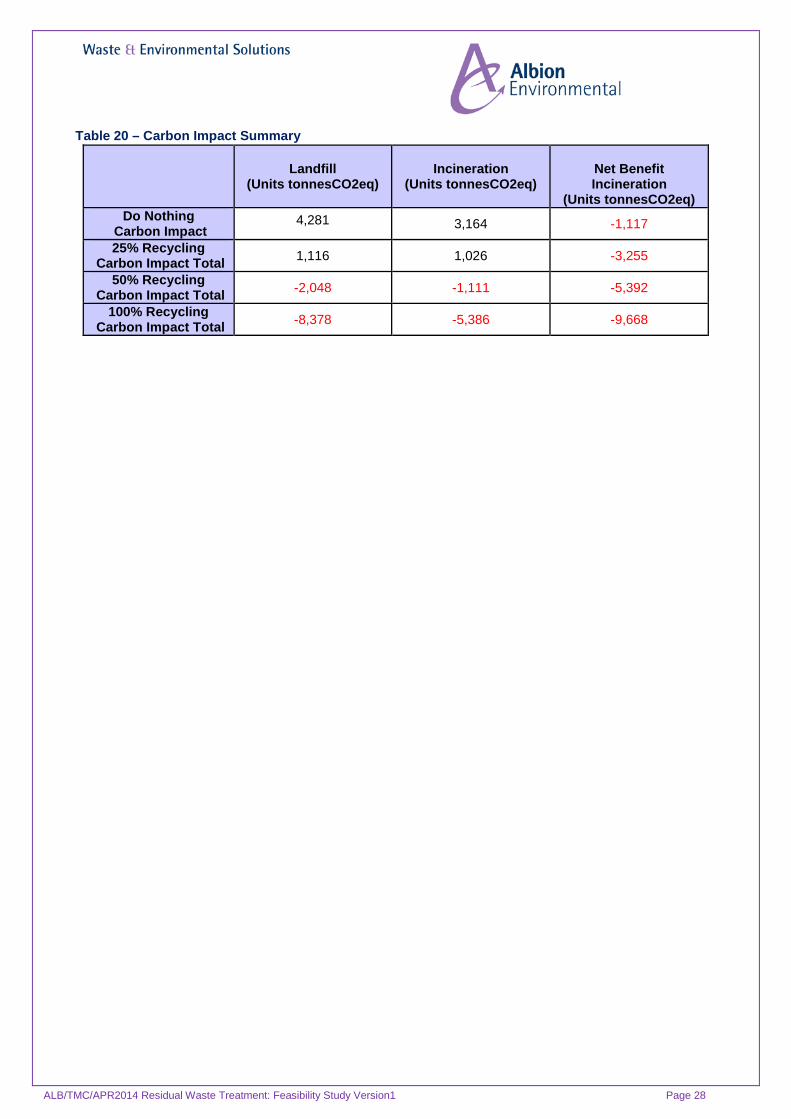
A summary of the above data is presented in table 20 (below). A reduction in the carbon impact will occur from a shift from landfill to incineration. A much larger reduction in carbon impact will occur for either the landfill or incineration option by increasing the recycling rate being achieved. Increasing the recycling rate will result in an overall reduction in the carbon impact. As discussed previously it is unlikely that collection routes need to be altered or increased, however if further assessment does suggest a change is needed then the carbon impact of the collection changes will need to be incorporated into this analysis.
ALB/TMC/APR2014 Residual Waste Treatment: Feasibility Study Version1 Page 28
Table 20 – Carbon Impact Summary
Landfill (Units tonnesCO2eq)
Incineration (Units tonnesCO2eq)
Net Benefit Incineration
(Units tonnesCO2eq) Do Nothing
Carbon Impact 4,281 3,164 -1,117
25% Recycling Carbon Impact Total 1,116 1,026 -3,255
50% Recycling Carbon Impact Total -2,048 -1,111 -5,392
100% Recycling Carbon Impact Total -8,378 -5,386 -9,668

ALB/TMC/APR2014 Residual Waste Treatment: Feasibility Study Version1 Page 29
6.0 Residual Waste Treatment Technology As landfill costs continue to increase the number of residual waste treatment technologies continues to evolve and change. Many of these technologies are not particularly new but are simply a linking together of a number of technologies or processes. The following technologies will be considered in this section.
• Low risk technologies that recover and process residual waste in a form optimised for further treatment (e.g. solid recovered fuel)
• Conventional and advanced thermal treatment technologies • Opportunities to recover energy
The options available to TMC are limited by the small tonnage available for processing.
6.1 Low Risk Technologies Low risk technologies can range from a simple waste transfer station for bulking up and sending waste to another facility all the way through to a complex mechanical biological treatment facility. Although these are specified as low risk, for the more complex facilities the risks can be high. The main risk is in ensuring the facilities produce a product which can meet market expectations. There are a number of recent high profile cases in Scotland of these facilities not meeting expectations.
Avondale “dirty” MRF – this “dirty” MRF was designed to accept residual waste and process it into recyclate, and a RDF for export. The £20 million facility closed after 6 months mainly due to issues relating to the RDF material. The company is currently trying to secure funding to re open the facility.
Shanks Compost / Eco Deco Process – Shanks currently use a composting process for waste from Argyll and Bute and a mechanical biological treatment process, called Eco Deco, in Dumfries and Galloway. Both of these processes produce a “Compost like output” which has not met expectations and is currently landfilled.
The following options are available for The Moray Council, starting at low risk increasing to high.
6.1.1 Waste Transfer Station A large building where waste is received from collection vehicles, stored and then loaded into bulk vehicles for transportation to a treatment facility. For bulky waste and waste from Household Waste recycling sites (HWRC) high recycling levels can be achieved by a simple manual and mechanical sort of the waste as it is on the floor of the building. For residual waste the recycling opportunities are limited unless additional equipment for processing the waste is included.
The main advantage of a waste transfer station is therefore to allow the efficient onward movement of waste. Although low cost to operate (£5-£20 / tonne) the overall cost will be dependent on haulage costs and the cost of the chosen treatment or disposal route.
If a residual waste treatment facility is not provided in TMC, a waste transfer station will be the minimum required to send the waste on for further treatment once the landfill bans come into force.
6.1.2 “Dirty” Material Recycling Facility Pre-treatment options generally aim to remove a proportion (likely to be up to 15%) of residual recyclable materials from mixed waste streams. Various techniques are then used to prepare waste for processing. These techniques can include bag splitters and shredders. A wide range of techniques can then be employed to extract the target materials. These can include screens and trommels (to remove fines), magnetic separation (removal of ferrous metals), eddy current separation (removal of non ferrous material), optical sorting (removal of plastic bottles, glass etc). Manual sorting is also likely to be an essential part of the process.
The quality of material from a “dirty” MRF is likely to be poor. The recyclate will be poor quality and command a lower price, any fine material will be contaminated and only suitable for landfill disposal at high rate of tax. There will also still be a portion of waste which will require disposal. The cost of operating a “dirty” MRF must therefore be balanced against the savings which can be made in overall disposal fees.

ALB/TMC/APR2014 Residual Waste Treatment: Feasibility Study Version1 Page 30
With the limited tonnage available in TMC there would be insufficient economy of scale to provide a full “dirty” MRF. Also if the residents of TMC council continue to perform there will be a reducing quantity of recyclate available to extract from the residual waste. A “dirty” MRF on its own is unlikely to add significant benefit to the overall strategy of TMC.
6.1.3 “Dirty” MRF with Refuse Derived Fuel Production (RDF) As more and more waste is being extracted at source there is an increasing trend within the industry to provide a very basic MRF to remove metal and hard plastic, shred the waste and then bale it in plastic wrap. This is suitable as a Refuse Derived Fuel (RDF) See section 5.3.3 on Export of RDF.
There are a number of contractors currently carrying out this work on a contract basis where they will specify a percentage of recyclate which will be achieved. Contractors are currently looking for waste streams of 30,000 tonnes per annum and larger. Complete cost is in the range of £100 -120 / tonne. The resultant baled RDF would be exported to mainland Europe or England for use as a fuel within energy from waste facilities. Baled RDF is generally moved by sea which reduces vehicle movements and provides opportunities for local ports.
In combination with increased recycling at a household level, a “basic dirty” MRF and RDF production, can ensure that all the targets contained within the Waste (Scotland) Regulations 2012 can be met, at a cost which is comparable with existing landfill rates.
6.1.4 Solid Recovered Fuel Production (SRF) The difference between RDF and SRF, is that SRF is a much more refined product. Obviously to produce a more refined product the complexity of the operation increases. A number of facilities currently use a mechanical biological treatment process which involves shredding the waste, drying it (usually via a composting like process) and then a full MRF to extract the recyclate. One off stream from the MRF will be an SRF. The SRF is typically used in cement kilns and power stations as an alternative to fossil fuels.
The tonnage available within TMC is unlikely to support SRF production and material would need to be sent out with the area.
6.2 Conventional and advanced thermal treatment technologies There are currently three main types of incineration process used within the UK, incineration, pyrolysis and gasification. Gate prices contained within WRAP Gate Fees Report 2013 are specified as follows –
Table 21 – WRAP Gate Fees Report 2013 Incineration gate fees Type of Facility Median Range Responses Local Authority Survey Pre -2000 £58 £32 to £76 30 Post - 2000 £90 £62 - £126 13 Defra Gate fee data <200kt £111 £80 to £135 4 200kt – 300kt £78 £57 - £105 10 350kt-450kt £68 £59 to £90 6
There is limited public data relating the cost of small scale waste to energy facilities, but costs are likely to be at the higher end of these ranges. Highland Council has carried out some detailed analysis for a small scale facility in Skye (approx. 10,000 tonnes per annum). Cost per tonne is comparable with existing haulage and disposal costs, but will require a long term investment to secure the necessary funding. The inclusion of a district heating system to also use the heat would require additional investment and significantly increase the cost per tonne. Note – there is currently grant funding available in England and Wales to support the installation of district heating. There is no similar system currently in Scotland.
The advantages for TMC, in trying to procure a waste to energy solution includes the following –
• Recovery of energy from the waste stream
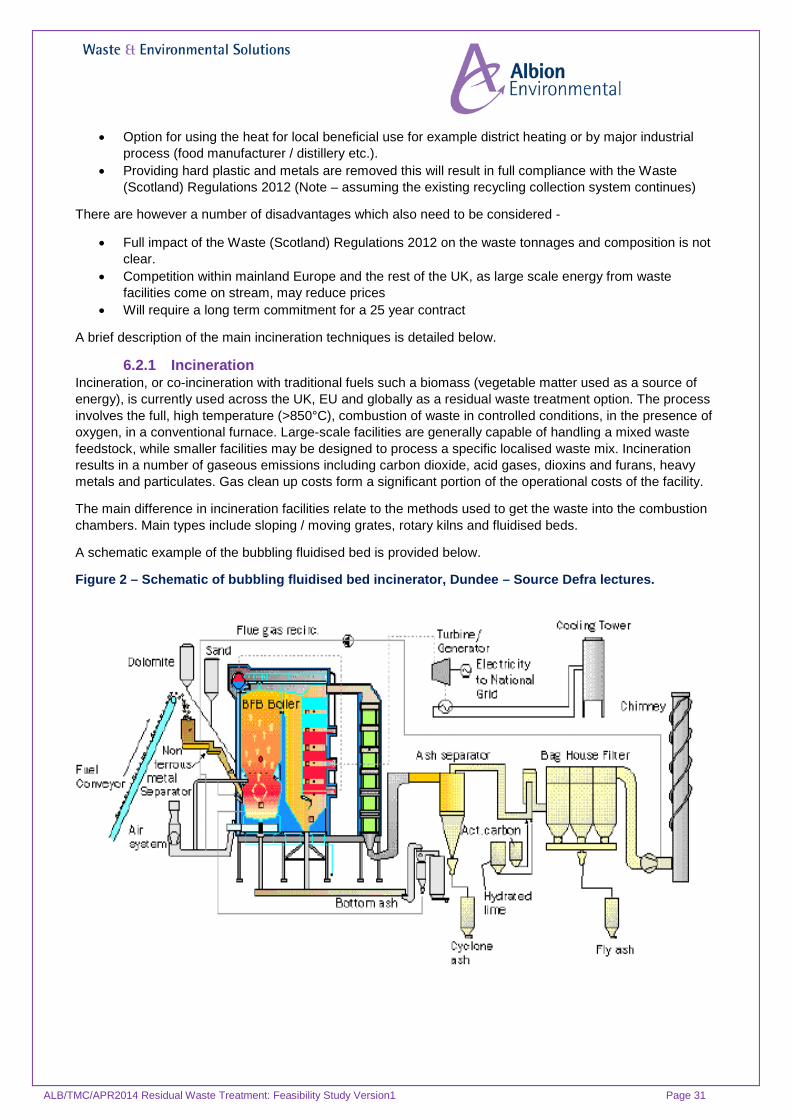
ALB/TMC/APR2014 Residual Waste Treatment: Feasibility Study Version1 Page 31
• Option for using the heat for local beneficial use for example district heating or by major industrial process (food manufacturer / distillery etc.).
• Providing hard plastic and metals are removed this will result in full compliance with the Waste (Scotland) Regulations 2012 (Note – assuming the existing recycling collection system continues)
There are however a number of disadvantages which also need to be considered -
• Full impact of the Waste (Scotland) Regulations 2012 on the waste tonnages and composition is not clear.
• Competition within mainland Europe and the rest of the UK, as large scale energy from waste facilities come on stream, may reduce prices
• Will require a long term commitment for a 25 year contract
A brief description of the main incineration techniques is detailed below.
6.2.1 Incineration Incineration, or co-incineration with traditional fuels such a biomass (vegetable matter used as a source of energy), is currently used across the UK, EU and globally as a residual waste treatment option. The process involves the full, high temperature (>850°C), combustion of waste in controlled conditions, in the presence of oxygen, in a conventional furnace. Large-scale facilities are generally capable of handling a mixed waste feedstock, while smaller facilities may be designed to process a specific localised waste mix. Incineration results in a number of gaseous emissions including carbon dioxide, acid gases, dioxins and furans, heavy metals and particulates. Gas clean up costs form a significant portion of the operational costs of the facility.
The main difference in incineration facilities relate to the methods used to get the waste into the combustion chambers. Main types include sloping / moving grates, rotary kilns and fluidised beds.
A schematic example of the bubbling fluidised bed is provided below.
Figure 2 – Schematic of bubbling fluidised bed incinerator, Dundee – Source Defra lectures.
ALB/TMC/APR2014 Residual Waste Treatment: Feasibility Study Version1 Page 32
Incineration also produces a stable, solid ash residue (representing ~10% of the original mass) which can be used as a secondary aggregate in construction applications dependent upon its chemical and physical properties, which relate to the original feedstock.
6.2.2 Pyrolysis Pyrolysis describes low temperature (400-800°C) processing in a zero, or low oxygen, environment. Classed as an ‘advanced thermal treatment’, it is not a widely implemented technology in waste treatment in Scotland but has been successfully applied to processes producing charcoal and generating energy from a variety of biomass fuels. Pyrolysis can operate on a mixed feedstock, with only non-combustibles such as metal and glass needing to be removed prior to treatment. Pyrolysis results in the production of combustible synthesis gas (syngas) which can be used in power generation, char and fuel oil. Char (representing ~90% reduction from the original mass) can be used as a Refuse Derived Fuel (RDF), soil improver or recycled (secondary) aggregate in construction applications depending upon its chemical and physical properties, which relate to the original feedstock.
The main advantages of pyrolysis include –
• Operates at a lower temperature • Uses municipal solid waste or RDF as a fuel • The technology is more suited to small tonnages
There are however a number of disadvantages which include – • Increased capital and operational costs compared to incineration • Increased technical experience required to maintain facility compared to incineration • Need to process and pre sort the feed stock
6.2.3 Gasification Gasification describes high temperature (900-1400°C) processing in a low oxygen environment. Classed as an ‘advanced thermal treatment’, it is not a widely implemented technology in waste treatment in Scotland but has applications in the conventional fossil fuel industry, used in producing fuel gas from coal. Like pyrolysis, gasification can operate on a mixed feedstock, with only non-combustibles such as metal and glass needing to be removed prior to treatment.
Gasification results in the production of combustible synthesis gas (syngas) which can be used in power generation. The residual char (representing ~90% reduction from the original mass) can be used as a recycled (secondary) aggregate in construction applications dependent upon its chemical and physical properties, which relate to the original feedstock.
A typical gasification process involves a three step production process is shown below

ALB/TMC/APR2014 Residual Waste Treatment: Feasibility Study Version1 Page 33
Figure 3 – Schematic of Gasification Process – Source Defra lectures.
6.3 Opportunities to recover energy In terms of the waste hierarchy the priority is to reduce, re use, recycle and then recover energy from waste prior to any final disposal. The recovery of energy is dependent on the calorific value of the waste being burnt. A brief assessment of the type of calorific values which can be achieved is listed below.
6.3.1 Calorific Value of Waste Calorific Value (CV) is the amount of heat generated by material when it is completely burned (MJ/kg). ‘Completely’ means when all hydrocarbons are converted to just CO2 and H2O. Generally, the more carbon, the higher the CV, eg polymers have high CV; biomass lower CV. Water content plays an important factor in the calorific value as the overall energy released in combustion is significantly affected if there is more water to vaporise or produce, e.g. if the material is wet or was recently growing. It is very important to be aware of the moisture content when considering energy recovery.
Some typical examples of calorific values are as follows –
Table 22 – Typical calorific values for materials Materials MJ/Kg
Fuel Oil (for comparison) 46.5 Plastics
Polyethylene 46.5 Polypropylene 41.6
PET 21.6 PVC 19.0
Municipal solid waste 9.0 Coal 28.0
Thermal processes require a steady CV feed, and do not like jumps and starts for example chunks of plastic and then wood. The reason both RDF and SRF are generally shredded is to try and ensure the feed stock is relatively consistent. The calorific value of residual waste is very variable but one important factor is the amount of food waste within the waste. The lower the food waste, the lower the moisture content and therefore there will be a higher calorific value.
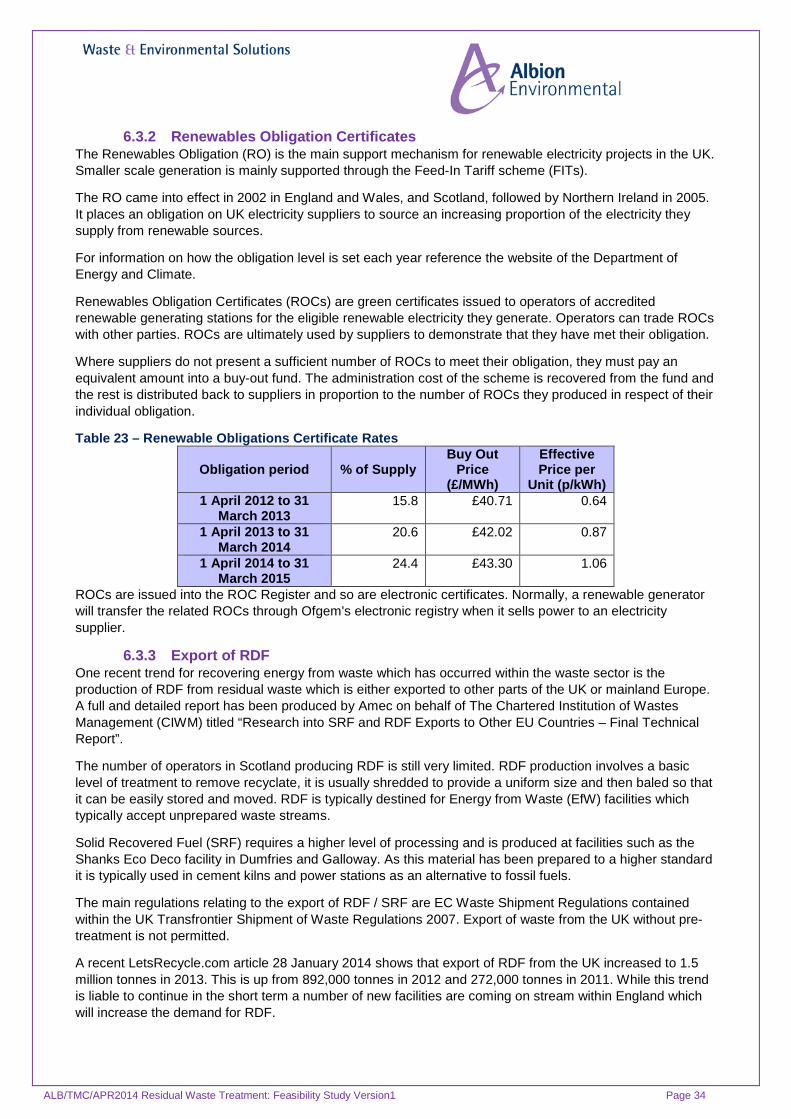
ALB/TMC/APR2014 Residual Waste Treatment: Feasibility Study Version1 Page 34
6.3.2 Renewables Obligation Certificates The Renewables Obligation (RO) is the main support mechanism for renewable electricity projects in the UK. Smaller scale generation is mainly supported through the Feed-In Tariff scheme (FITs).
The RO came into effect in 2002 in England and Wales, and Scotland, followed by Northern Ireland in 2005. It places an obligation on UK electricity suppliers to source an increasing proportion of the electricity they supply from renewable sources.
For information on how the obligation level is set each year reference the website of the Department of Energy and Climate.
Renewables Obligation Certificates (ROCs) are green certificates issued to operators of accredited renewable generating stations for the eligible renewable electricity they generate. Operators can trade ROCs with other parties. ROCs are ultimately used by suppliers to demonstrate that they have met their obligation.
Where suppliers do not present a sufficient number of ROCs to meet their obligation, they must pay an equivalent amount into a buy-out fund. The administration cost of the scheme is recovered from the fund and the rest is distributed back to suppliers in proportion to the number of ROCs they produced in respect of their individual obligation.
Table 23 – Renewable Obligations Certificate Rates
Obligation period % of Supply Buy Out
Price (£/MWh)
Effective Price per
Unit (p/kWh) 1 April 2012 to 31
March 2013 15.8 £40.71 0.64
1 April 2013 to 31 March 2014
20.6 £42.02 0.87
1 April 2014 to 31 March 2015
24.4 £43.30 1.06
ROCs are issued into the ROC Register and so are electronic certificates. Normally, a renewable generator will transfer the related ROCs through Ofgem's electronic registry when it sells power to an electricity supplier.
6.3.3 Export of RDF One recent trend for recovering energy from waste which has occurred within the waste sector is the production of RDF from residual waste which is either exported to other parts of the UK or mainland Europe. A full and detailed report has been produced by Amec on behalf of The Chartered Institution of Wastes Management (CIWM) titled “Research into SRF and RDF Exports to Other EU Countries – Final Technical Report”.
The number of operators in Scotland producing RDF is still very limited. RDF production involves a basic level of treatment to remove recyclate, it is usually shredded to provide a uniform size and then baled so that it can be easily stored and moved. RDF is typically destined for Energy from Waste (EfW) facilities which typically accept unprepared waste streams.
Solid Recovered Fuel (SRF) requires a higher level of processing and is produced at facilities such as the Shanks Eco Deco facility in Dumfries and Galloway. As this material has been prepared to a higher standard it is typically used in cement kilns and power stations as an alternative to fossil fuels.
The main regulations relating to the export of RDF / SRF are EC Waste Shipment Regulations contained within the UK Transfrontier Shipment of Waste Regulations 2007. Export of waste from the UK without pre-treatment is not permitted.
A recent LetsRecycle.com article 28 January 2014 shows that export of RDF from the UK increased to 1.5 million tonnes in 2013. This is up from 892,000 tonnes in 2012 and 272,000 tonnes in 2011. While this trend is liable to continue in the short term a number of new facilities are coming on stream within England which will increase the demand for RDF.

ALB/TMC/APR2014 Residual Waste Treatment: Feasibility Study Version1 Page 35
The price for RDF is now largely comparable with landfill tax and disposal costs and production and export of RDF can provide a simple and straightforward method of increasing recycling rates and reducing landfill disposal.
To allow a strategy of produce and export RDF, THC would still need to demonstrate its recycling service is performing well as detailed in section 7.4.1 Thermal Treatment Footnote.
ALB/TMC/APR2014 Residual Waste Treatment: Feasibility Study Version1 Page 36
7.0 Proposed Strategies for Residual Waste In order to assess the various options available to TMC the advantages and risks for each of the following options has been considered.
• Increasing use of existing recycling services • Provision of a MRF • Provision of MRF with RDF Production • Provision of a waste to energy facility
These have been considered in isolation at present but will be reviewed and assessed in relation to existing facilities and infrastructure in section 9, where a proposed “best strategy” for TMC will also be discussed.
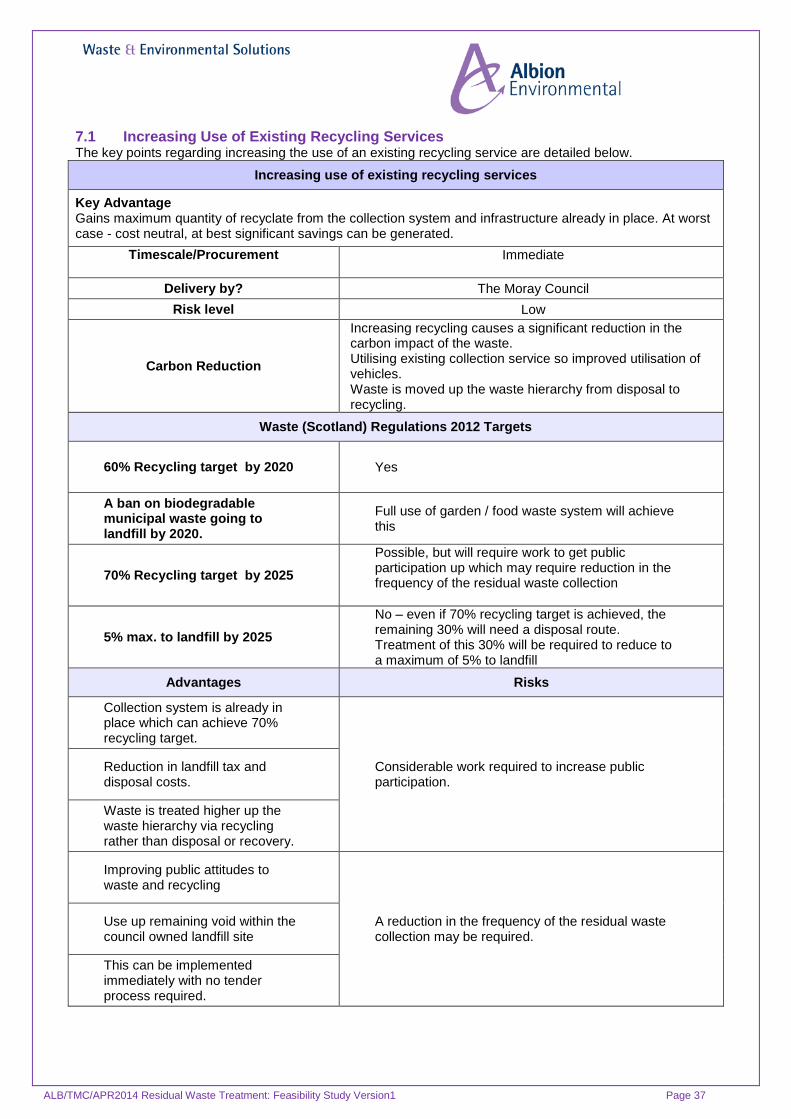
ALB/TMC/APR2014 Residual Waste Treatment: Feasibility Study Version1 Page 37
7.1 Increasing Use of Existing Recycling Services The key points regarding increasing the use of an existing recycling service are detailed below.
Increasing use of existing recycling services
Key Advantage Gains maximum quantity of recyclate from the collection system and infrastructure already in place. At worst case - cost neutral, at best significant savings can be generated.
Timescale/Procurement
Immediate
Delivery by? The Moray Council Risk level Low
Carbon Reduction
Increasing recycling causes a significant reduction in the carbon impact of the waste. Utilising existing collection service so improved utilisation of vehicles. Waste is moved up the waste hierarchy from disposal to recycling.
Waste (Scotland) Regulations 2012 Targets
60% Recycling target by 2020
Yes
A ban on biodegradable municipal waste going to landfill by 2020.
Full use of garden / food waste system will achieve this
70% Recycling target by 2025 Possible, but will require work to get public participation up which may require reduction in the frequency of the residual waste collection
5% max. to landfill by 2025 No – even if 70% recycling target is achieved, the remaining 30% will need a disposal route. Treatment of this 30% will be required to reduce to a maximum of 5% to landfill
Advantages Risks
Collection system is already in place which can achieve 70% recycling target.
Considerable work required to increase public participation.
Reduction in landfill tax and disposal costs.
Waste is treated higher up the waste hierarchy via recycling rather than disposal or recovery.
Improving public attitudes to waste and recycling
A reduction in the frequency of the residual waste collection may be required.
Use up remaining void within the council owned landfill site
This can be implemented immediately with no tender process required.
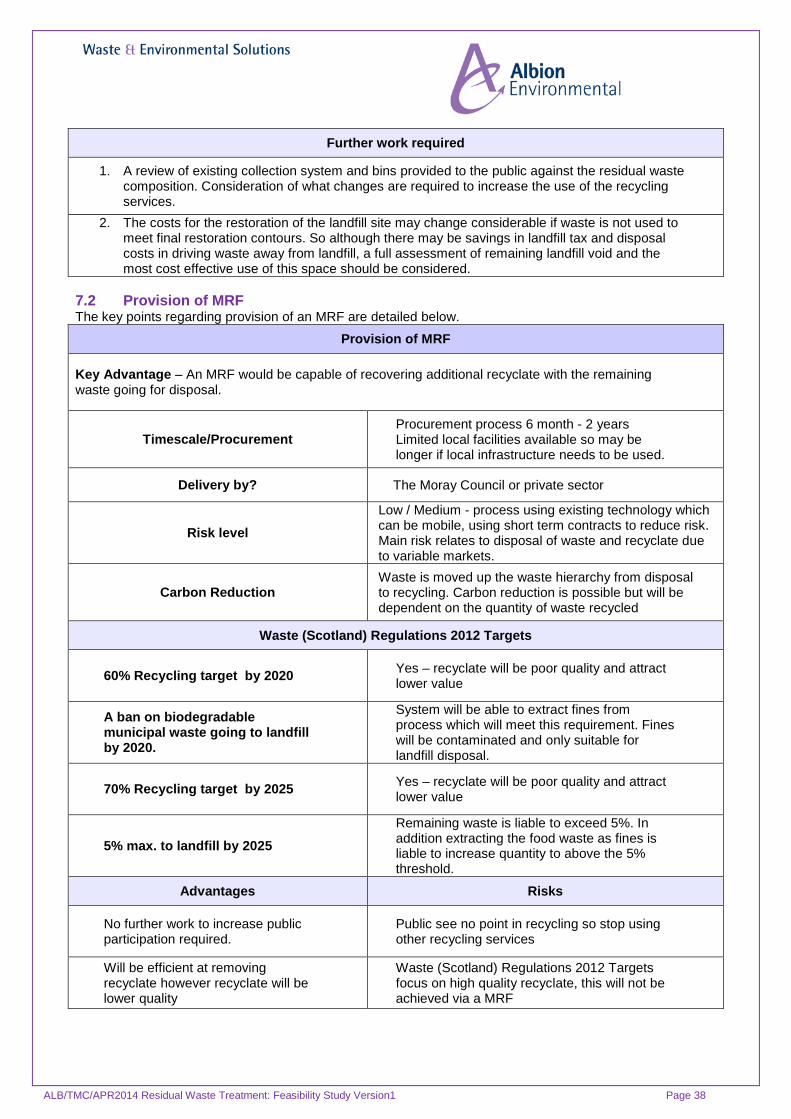
ALB/TMC/APR2014 Residual Waste Treatment: Feasibility Study Version1 Page 38
Further work required
1. A review of existing collection system and bins provided to the public against the residual waste composition. Consideration of what changes are required to increase the use of the recycling services.
2. The costs for the restoration of the landfill site may change considerable if waste is not used to meet final restoration contours. So although there may be savings in landfill tax and disposal costs in driving waste away from landfill, a full assessment of remaining landfill void and the most cost effective use of this space should be considered.
7.2 Provision of MRF The key points regarding provision of an MRF are detailed below.
Provision of MRF
Key Advantage – An MRF would be capable of recovering additional recyclate with the remaining waste going for disposal.
Timescale/Procurement Procurement process 6 month - 2 years Limited local facilities available so may be longer if local infrastructure needs to be used.
Delivery by? The Moray Council or private sector
Risk level Low / Medium - process using existing technology which can be mobile, using short term contracts to reduce risk. Main risk relates to disposal of waste and recyclate due to variable markets.
Carbon Reduction Waste is moved up the waste hierarchy from disposal to recycling. Carbon reduction is possible but will be dependent on the quantity of waste recycled
Waste (Scotland) Regulations 2012 Targets
60% Recycling target by 2020
Yes – recyclate will be poor quality and attract lower value
A ban on biodegradable municipal waste going to landfill by 2020.
System will be able to extract fines from process which will meet this requirement. Fines will be contaminated and only suitable for landfill disposal.
70% Recycling target by 2025 Yes – recyclate will be poor quality and attract lower value
5% max. to landfill by 2025 Remaining waste is liable to exceed 5%. In addition extracting the food waste as fines is liable to increase quantity to above the 5% threshold.
Advantages Risks
No further work to increase public participation required.
Public see no point in recycling so stop using other recycling services
Will be efficient at removing recyclate however recyclate will be lower quality
Waste (Scotland) Regulations 2012 Targets focus on high quality recyclate, this will not be achieved via a MRF
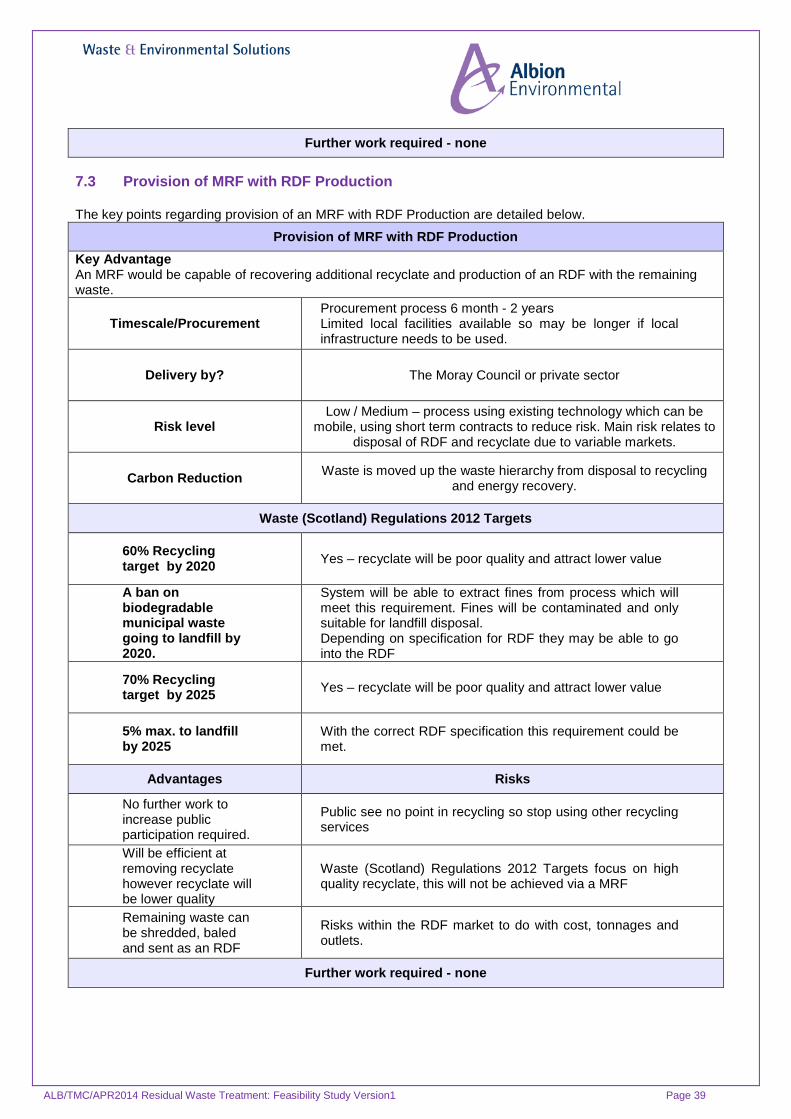
ALB/TMC/APR2014 Residual Waste Treatment: Feasibility Study Version1 Page 39
Further work required - none
7.3 Provision of MRF with RDF Production The key points regarding provision of an MRF with RDF Production are detailed below.
Provision of MRF with RDF Production Key Advantage An MRF would be capable of recovering additional recyclate and production of an RDF with the remaining waste.
Timescale/Procurement Procurement process 6 month - 2 years Limited local facilities available so may be longer if local infrastructure needs to be used.
Delivery by? The Moray Council or private sector
Risk level Low / Medium – process using existing technology which can be
mobile, using short term contracts to reduce risk. Main risk relates to disposal of RDF and recyclate due to variable markets.
Carbon Reduction Waste is moved up the waste hierarchy from disposal to recycling and energy recovery.
Waste (Scotland) Regulations 2012 Targets
60% Recycling target by 2020 Yes – recyclate will be poor quality and attract lower value
A ban on biodegradable municipal waste going to landfill by 2020.
System will be able to extract fines from process which will meet this requirement. Fines will be contaminated and only suitable for landfill disposal. Depending on specification for RDF they may be able to go into the RDF
70% Recycling target by 2025 Yes – recyclate will be poor quality and attract lower value
5% max. to landfill by 2025
With the correct RDF specification this requirement could be met.
Advantages Risks
No further work to increase public participation required.
Public see no point in recycling so stop using other recycling services
Will be efficient at removing recyclate however recyclate will be lower quality
Waste (Scotland) Regulations 2012 Targets focus on high quality recyclate, this will not be achieved via a MRF
Remaining waste can be shredded, baled and sent as an RDF
Risks within the RDF market to do with cost, tonnages and outlets.
Further work required - none
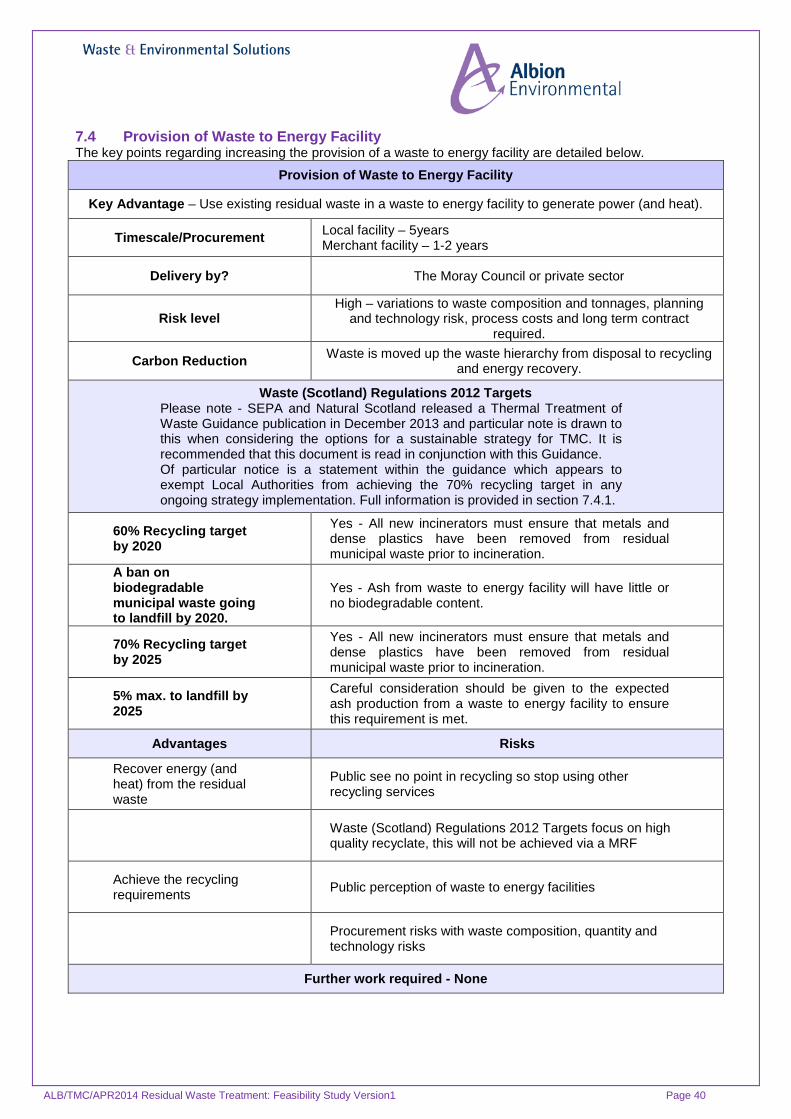
ALB/TMC/APR2014 Residual Waste Treatment: Feasibility Study Version1 Page 40
7.4 Provision of Waste to Energy Facility The key points regarding increasing the provision of a waste to energy facility are detailed below.
Provision of Waste to Energy Facility
Key Advantage – Use existing residual waste in a waste to energy facility to generate power (and heat).
Timescale/Procurement Local facility – 5years Merchant facility – 1-2 years
Delivery by? The Moray Council or private sector
Risk level High – variations to waste composition and tonnages, planning
and technology risk, process costs and long term contract required.
Carbon Reduction Waste is moved up the waste hierarchy from disposal to recycling and energy recovery.
Waste (Scotland) Regulations 2012 Targets Please note - SEPA and Natural Scotland released a Thermal Treatment of Waste Guidance publication in December 2013 and particular note is drawn to this when considering the options for a sustainable strategy for TMC. It is recommended that this document is read in conjunction with this Guidance. Of particular notice is a statement within the guidance which appears to exempt Local Authorities from achieving the 70% recycling target in any ongoing strategy implementation. Full information is provided in section 7.4.1.
60% Recycling target by 2020
Yes - All new incinerators must ensure that metals and dense plastics have been removed from residual municipal waste prior to incineration.
A ban on biodegradable municipal waste going to landfill by 2020.
Yes - Ash from waste to energy facility will have little or no biodegradable content.
70% Recycling target by 2025
Yes - All new incinerators must ensure that metals and dense plastics have been removed from residual municipal waste prior to incineration.
5% max. to landfill by 2025
Careful consideration should be given to the expected ash production from a waste to energy facility to ensure this requirement is met.
Advantages Risks
Recover energy (and heat) from the residual waste
Public see no point in recycling so stop using other recycling services
Waste (Scotland) Regulations 2012 Targets focus on high quality recyclate, this will not be achieved via a MRF
Achieve the recycling requirements Public perception of waste to energy facilities
Procurement risks with waste composition, quantity and technology risks
Further work required - None
ALB/TMC/APR2014 Residual Waste Treatment: Feasibility Study Version1 Page 41
7.4.1 Thermal Treatment Footnote
SEPA and Natural Scotland released a Thermal Treatment of Waste Guidance publication in December 2013 and particular note is drawn to this when considering the options for a sustainable strategy for TMC. It is recommended that this document is read in conjunction with this Guidance. Of particular notice is a statement within the guidance which appears to exempt Local Authorities from achieving the 70% recycling target in any ongoing strategy implementation as is reproduced here for reference With respect to household waste, the availability of and participation in recycling services is highly variable which leads to similarly variable Local Authority recycling rates. Better performing household waste recycling systems (including but not limited to kerbside collections, bring sites and CA sties) may result in residual waste with only minimal quantities of these materials remaining. Consultation responses were clear that there is a tipping point after which the investment required to extract the remaining recyclables by sorting residual waste becomes uneconomic. In such cases, it would be open to operators to make a case to SEPA that secondary sorting of residual waste is not practicable. In such circumstances, SEPA expects evidence that systems are performing well. Local Authorities should have high recycling rates (i.e. greater than 50%) and have full or is close to and working towards full service coverage for cans, tins, foil, aerosols, PET and HDPE. In addition, SEPA also recognises that it may not be practicable for some very small facilities (<25,000 tonnes per annum) serving remote communities to invest in this type of treatment. SEPA will consider the test of practicability for such facilities on a case by case basis. Where recycling scheme performance remains low and is not expected to improve within a reasonable timeframe, a degree of secondary treatment of residual waste will be necessary. Such treatment can either take place at the thermal treatment plant as part of the fuel preparation stage or off-site from a supply chain of mixed waste treatment plants. Where treatment takes place off-site, waste acceptance procedures must be robust enough to satisfy SEPA that any feedstock has been sufficiently treated. Where secondary sorting does take place the process design must consider the input material and how it is first introduced into the plant through to the final outcomes. A significant issue for recyclate recovery is the mixed nature of the materials in residual waste and, specifically, the high content of organic material. The recovery process must ensure that the organic fraction does not become a major contaminant. SEPA would expect that bag splitters, rather than shredders, are used at the start of the process. Shredding is likely to spread the organic matter more evenly through the mix, increasing contamination and making recovery of target materials for recycling more difficult. SEPA would then expect the remaining fraction or fractions to be processed through a combination of techniques to yield a range of final end products Thermal Treatment of Waste Guidelines 2013 14 but, as a minimum, PET, HDPE and metals. Where metals can be recovered from the final residues that may be permitted as an alternative. For such facilities, Permit applications should contain at least the following information;
• Details of the tonnages of different waste streams accepted for processing. • Details of all processing stages, including schematic diagram. • Estimates of the weights of recyclables removed at the plant. • Results of any waste analysis verifying the above information.
This would suggest that as TMC already recycles 58% of household waste it could make a case for the establishment of a facility to process all current residual waste for a thermal treatment solution without further recycling and not achieving the 70% target. If this is to be considered within the strategy it is recommended that TMC seek specific agreement with the regulator to support this approach and have assurances as to the sustainability of this derogation over the lifetime of the commitment required.
ALB/TMC/APR2014 Residual Waste Treatment: Feasibility Study Version1 Page 42
8.0 Neighbouring Authorities In order to assess what opportunities there are for joint working with neighbouring authorities a review of their existing strategy and approaches has been carried out. TMC is bordered by both The Highland Council and Aberdeenshire Council. The nearest large population centres are between TMC and Highland Council. A brief review of Aberdeen City Council has also been carried out as their facilities will be closer than facilities in the central belt of Scotland.
8.1 The Highland Council TMC and Highland Council have previously worked together to develop a joint waste management strategy which was approved by both councils in 2009. This strategy never progressed for a number of reasons, and both councils have since been heavily involved in rolling out extra recycling collection schemes. The joint Waste Strategy, which was approved by the TECS Committee in March 2009, included the following:
• 3 small energy from waste facilities – (Skye, Caithness, Inner Moray Firth) • Local In-vessel composters; • Central materials recycling facility; • An eventual 3 bin service to all highland (dry recyclables, green waste plus food waste, and residual
waste A review of the “Highland and Moray Council Waste Strategy – September 2008” document shows that –
• Additional recycling services are now in place (food waste collection) • Targets and priorities have changed as per Waste (Scotland) Regulations 2012 • Significant increases in recycling have been achieved in this period
The most recent strategy paper 5th November 2012 details the following “In light of the policy/legal changes detailed above, and the internal re-structuring whereby responsibility for street cleansing has passed to Waste Management, it is proposed that a review of the full range of waste management services is undertaken. With the contract for residual waste for Inverness and Ross and Cromarty due to expire on 30/9/14, The Highland Council is expected to be inviting tenders for transportation and disposal of their residual waste. These contracts will be issued as 3 year contracts with a number of 1 year extensions. In the short term there is no pressing requirement for TMC to work with Highland Council. In the longer term if MRF, RDF or waste to energy facility is being actively considered then working together will increase the quantity of waste available and improve the economy of scale.
8.2 Aberdeenshire Council Initial research would suggest there is little option of working together with Aberdeenshire Council for the treatment of residual waste. The Report to the Infrastructure Services Committee – 31st May 2012 states “The arrangements for the waste disposal and treatment contract have been concluded with SITA UK. SITA will manage the treatment/recovery and disposal of 100,000 tonnes of the council’s residual waste with the treatment element scheduled to commence from 2015.” However Aberdeenshire Council are currently in discussion with SITA to assess the implications of the Waste (Scotland) Regulations 2012, particularly relating to landfill diversion, and Aberdeenshire are currently considering their options. TMC are proactively discussing what opportunities exist for working with Aberdeenshire Council and whether there is spare capacity which could be used by TMC.
8.3 Aberdeen City Council The Aberdeen City Waste Strategy 2014-2025 sets out our long term plans to reduce the social, economic and environmental consequences of waste. It introduces the next generation of waste infrastructure and recycling services which will meet the needs of our city. Aberdeen City Council is currently in a 25-year contract with SITA to manage, recycle, compost, treat and disposal of the City’s household waste. This contract commenced in 2000 so will be due to expire in 2025. Recent press release (Letsrecycle 7th May 2014) states “However, the council now again intends to develop a combined heat and power (CHP) EfW facility and hopes to secure ‘further significant investment’ from government, the private sector and ‘other alternative outlets’. Until the EfW is built, the council also hopes to develop facilities to produce and export a refuse derived fuel (RDF) from its black bag waste. Additionally, the strategy sets out plans to develop a MRF that uses ‘a range of mechanical and optical sorting technologies’ in order to accommodate Aberdeen’s future commingled recycling collections”.

ALB/TMC/APR2014 Residual Waste Treatment: Feasibility Study Version1 Page 43
TMC are proactively discussing what opportunities exist for working with Aberdeen City Council and in particular whether there is spare capacity which could be used by TMC
9.0 Commercial Facilities One common barrier to waste management infrastructure is the lack of sites with suitable planning and regulatory permissions. A brief review of commercial waste facilities in the area has been carried out.
9.1 Facilities within TMC There are currently two main commercial facilities within TMC. Due to this lack of facilities TMC may also wish to consider what facilities exist within the council ownership which may be suitable for a waste transfer, MRF, RDF and waste to energy facility.
9.1.1 Grays Recycling Services Ltd, Their waste transfer station is located at the Old Airfield, Fochabers, IV32 7PL. The company currently offers waste and recyclate collection service and also operates a MRF to process the commercial waste they currently collect. Space within the site is limited however there is some opportunity for further expansion. There is the potential to operate a MRF and / or RDF preparation facility if further work and investment was undertaken.
9.1.2 J Gordon Williamson Ltd J Gordon Williamson is a scrap metal merchant who has been based in Elgin for 47 years. They also provide skip hire and waste collection. More recently they applied and successfully gained planning permission in 2009, for a 30,000 tonne per annum energy from waste facility. The application appears to have lapsed and re application would be required. 9.2 Facilities outwith TMC The following operators have facilities which are located in Inverness.
9.2.1 SITA UK SITA UK currently hold the contract for Aberdeen City and Aberdeenshire Council. They also previously held the transportation and disposal contract with Highland Council and still retain a licensed waste transfer station in Inverness. SITA UK is one of the largest producers of RDF in the UK and have established routes in UK and Europe for use of this fuel. In 2013 they sent 284,000 tonnes of RDF to mainland Europe.
9.2.2 Wm. Munro Construction (Highland) Limited Wm. Munro Construction (Highland) Limited currently holds the transportation and disposal contract with Highland Council. They have two licensed waste transfer and treatment facilities the first is Beechwood Waste Transfer Station facility in Alness and the second Cromwell Road Waste Transfer Station in Inverness. The Cromwell Road facility has the added advantage of being on the harbour side and direct export of RDF by ship could be possible.
9.2.3 Shore Energy A facility which involves autoclaving, received planning permission in June 2011 and a waste management licence in December 2011. Similarly this facility has the added advantage of being on the harbour side and direct export of material by ship could be possible. The current status and ownership of this facility is not clear. 9.3 Review of Waste to Energy Facilities The range of possible Waste to Energy facilities is equally limited. A list of the existing or proposed waste to energy facilities in Scotland is listed in appendix 1.
ALB/TMC/APR2014 Residual Waste Treatment: Feasibility Study Version1 Page 44
9.3.1 Clean Power Properties A scoping report was submitted for a proposed pyrolysis-type incinerator (6MW Advanced Combustion Technology Facility). The scoping request was submitted in May 2012 and a public exhibition held in 2012. No further work has been carried out.
9.3.2 J Gordon Williamson Ltd J Gordon Williamson applied and successfully gained planning permission in 2009, for a 30,000 tonne per annum energy from waste facility. The application appears to have lapsed and re application would be required.
9.3.3 Combined Power and Heat (Highlands) Ltd Permission was granted on appeal in November 2012 for a 100-130,000 tonne per annum facility. In January 2013 two legal challenges were brought against the decision to grant planning permission. The facility is located at Cromarty Firth Industrial Estate, Invergordon
9.3.4 Operational facilities within Scotland The number of waste to energy facilities currently constructed in Scotland is very limited and comprise
• Shetland Islands facility – Lerwick Status – Operational
• Baldovie Incinerator, Dundee Status – Major fire in 2012
• Scotgen Facility, Dumfries Status – a number of fires and compliance issues, site has not cleared commissioning stages.
A number of sites have secured planning permission however limited progress on site has been made. These sites are listed in appendix 1.
ALB/TMC/APR2014 Residual Waste Treatment: Feasibility Study Version1 Page 45
10.0 Procurement Methods In much the same way as the waste and how we handle it has been evolving over the last 10-15 years the procurement process councils use to secure a waste management facility have also altered. The main changes which have occurred have been detailed below.
10.1 PFI (Public Finance Initiative) / PPP (Public Private Partnership) Contracts. 10-15 years ago it was relatively common for councils to sign up to long term 25 years contracts. The logic was that a 25 year contract was required to allow the company to make the necessary level of investment in the waste management infrastructure. Typical examples of these contracts include –
Argyll and Bute Council – Shanks was contracted to take over the landfill sites and put in place a waste treatment process which was based on a compost type process.
Dumfries and Galloway Council – Shanks was contracted to take over the landfill sites and put in place an “ECO DECO” waste treatment process which produced recyclate and SRF (Solid Recovered Fuel)
Both of these contracts have had contractual difficulties, as the legislation has altered considerably since the contracts were initially proposed.
Aberdeen City Council – contracted SITA for a 25 year contract which was based on a waste to energy facility. Due to delays in the planning process the facility has never been built, and again what was initially envisaged will not meet the current regulations.
There is obviously a risk to signing up for a 25 year contract while there is still uncertainty regarding the way the legislation is going to be applied and enforced. This risk must be balanced against the security that a long term contract could provide to a council. There is insufficient clarity within the current regulations and guidance, which could have major implications on the quantity and composition of waste. These risks must be fully assessed if a long term contract is to be considered.
10.2 Short Term Contracts 1- 5years TMC has already got a number of contractual arrangements in place for managing the overall waste stream. Contracts are in place for food / green waste and dry recyclate and TMC has been successfully managing the disposal of residual waste to landfill for many years. As residual waste is becoming a smaller and smaller component of the overall material stream that the council is handling it is ideally suited to short term contracts.
The tendering of a 5 year contract for 20,000 tonnes per annum of residual waste would provide an opportunity for local companies to tender and also allow companies with spare capacity at their own facilities to tender.
Prior to considering putting any short term tender out to contact the council should also consider whether it has the resources and capabilities in house to carry out his work. TMC obviously has a considerable amount of experience handling residual waste and a simple MRF / RDF facility would be well within the existing staff experience providing the necessary support was provided.
10.3 Scotland EXCEL Framework Contracts There are a number of framework agreements the Central Procurement Unit (CPU) has worked to develop in conjunction with Service users and the national body for joint local government procurement, Scotland Excel. Any public sector contracting authority, as defined by The Public Contracts (Scotland) Regulations 2012, or any service provider acting on its behalf, can use these framework agreements. Call off requirements can be made through the use of “mini competitions” involving the providers listed under each of the lots.
These framework contracts are already being used by councils for provision of services relating to recyclate, composting and anaerobic digestion (AD) facilities. They provide a far greater degree of flexibility to the council and can provide other options in the event that a contractor is not meeting their contractual requirements. A framework contract for residual waste has already been let and will be available for councils to use by June 2014. This framework will provide a number of opportunities to TMC and use of this framework should be actively considered. A summary of the key components was provided by Andy Law at

ALB/TMC/APR2014 Residual Waste Treatment: Feasibility Study Version1 Page 46
the recent LARAC Conference, Wednesday 14th May 2014 Framework Contracts for Residual Waste and Recycling Services.
10.4 Scotland Wide Brokerage There are currently tentative plans within Scottish Government to develop a brokering scheme across all the local authorities in Scotland for both residual waste and recyclate. Contract capacity would be secured at a number of waste treatment facilities across Scotland and then the capacity would be used by individual councils. This has the potential to provide councils with access to large scale treatment facilities without the need to directly procure the service. It would also provide the necessary economy of scale for the private contractors to invest in the infrastructure.
ALB/TMC/APR2014 Residual Waste Treatment: Feasibility Study Version1 Page 47
11.0 Best Strategy Considerations Prior to proposing any strategy for TMC the following considerations need to be taken into account. These considerations have been discussed in detail in previous sections but are summarised below.
• Waste compositional analysis has shown that a significant quantity of waste in the residual bin should be placed in the recycling bins. The recycling service is operating under capacity and there is significant capacity within the existing system to increase recycling rates.
• Increasing recycling rates within the home has the potential to release savings in landfill tax and disposal.
• As the Waste (Scotland) Regulations 2012 take effect residual waste shall become a relatively minor component of the waste stream, at 25% or less of the overall waste stream
• There may be current opportunities to partner with Aberdeenshire Council and they should be further investigated. There would be a possibility of partnership with Highland Council on expiry of the next residual waste contract which is due to be tendered this year.
• The restoration costs of the landfill site have not been considered within this report but should be carefully considered when assessing a chosen strategy.
• There are a number of contractors who have waste treatment facilities in the area who would be capable of providing a MRF / RDF facility on a contract basis.
• There are no sites with planning permission for a waste to energy facility in TMC. Sites, which do have planning permission, within Scotland, have not progressed past the planning stage. At this stage this is likely to limit any procurement process.
• The fragmentation of the overall waste stream has resulted in the recent trend of using short term and framework contracts to provide the necessary level of flexibility.
• The use of the Scotland Excel framework contract for residual waste should be considered once it is released.
The individual options for managing the residual waste have been discussed in section 6 above. However, due to the limitations and timescales with each of these options we would propose a phased approach.
A summary of the three phrases is presented over the page.

ALB/TMC/APR2014 Residual Waste Treatment: Feasibility Study Version1 Page 48
Timescale Phase 1 - Increase Use of Recycling Service
Phase 2 - MRF / RDF Facility tender Phase 3 - Waste to energy
Immediate 2017/18 2019
Cost Initial cost, but then savings from landfill tax and disposal
By 2017/18 costs are liable to be comparable +/- 10%
Will depend whether a bespoke TMC solution or a large scale merchant facility.
Risk None
Statutory targets will be met by phase 1, therefore little or no risk. Residual waste treatment required when landfill ban comes in force in 2025, so time to address any issues.
Under phase 2 RDF will be produced and exported. The quantity and quality of the RDF will be known, reducing the risk for any proposed development.
Opportunities for
improvement
Reduction in residual waste collection to drive waste into the recycling service
Will need to find balance between extracting recyclate and producing RDF. The treating of residual waste could be increased in a phased manner
Identify suitable location for a facility and TMC secures planning, this can then be offered to potential contractors.
Additional Work Required
Review of current bin capacity and service provided, to assess what changes could be made to increase diversion of recyclate.
Comprehensive review of restoration costs for TMC landfill site to ensure sufficient waste quantities are available to ensure cost effective closure and restoration
Partnership Opportunities
Support available from ZWS
Discussions ongoing with neighbouring authorities
Discussions ongoing with neighbouring authorities
In house / contractor
In house team to deliver In house or contractor In house or contractor
Procurement options None required Short term contract or Scotland
Excel framework Framework contract or long term 25 year contract
Waste (Scotland) Regulations 2012 Targets
Phase 1 Increase Use of Recycling Service
Phase 2 - MRF / RDF Facility tender Phase 3 - Waste to energy
60% Recycling target by 2020
A ban on biodegradable
municipal waste going to landfill
by 2020.
1.
70% Recycling target by 2025 2. 3.
5% max. to landfill by 2025 ×
Note 1 If sufficient progress is made to ensure public use the food waste system this target can be met.
Note 2 Theoretically possible but additional recycling may need to be achieved under phase 2.
Note 3 Assumption is that RDF is produced and exported until local market is developed.
ALB/TMC/APR2014 Residual Waste Treatment: Feasibility Study Version1 Page 49
It is clear from the above analysis that the immediate priority should be focussing on maximising the potential from the existing recycling services. This can be put in place very quickly at little or no additional cost or risk to the council. If developed fully this will result in compliance with three of the four main targets contained within the Waste (Scotland) Regulations 2012.
With the immediate targets met TMC can then focus on the maximum 5% to landfill target. While the waste to energy market in Scotland is still developing a MRF / RDF facility can either be constructed or procured under contract. This would be handled in the same manner that the council currently handles the dry recyclate. It will also provide valuable waste quantity and composition data for the design of any future waste to energy facility.
As the legal requirements can be met by phase 1 and 2, phase 3 is optional, and the opportunities which such a facility would present to TMC can be explored further with this additional information.

ALB/TMC/APR2014 Residual Waste Treatment: Feasibility Study Version1 Page 50
Appendix 1 Table of Energy from Waste projects across Scotland Status* Region Site Name Operator Capacity Comments
P Moray
Railway Marshalling
Yard (by the railway
station), Forres
Clean Power
Properties
Ltd.
~100,000 Proposed pyrolysis-type
incinerator
X Morayshire Elgin J Gordon
Williamson 30,000
Granted planning permission in
2009.
P Highlands Cromarty Firth Ind
Estate, Invergordon
Combined
Power and
Heat
(Highlands)
Ltd
100-
130,000
Permission granted in Nov
2012. In Jan 2013 legal
challenges brought against the
planning decision
P Aberdeenshire
Paper Mill Building, 4
Kirkwood Commercial
Park, Thainstone,
Inverurie
Kirkwood
Homes
Investments
Ltd
150,000
“Small scale” plasma
gasification incinerator
intended for RDF derived from
C&I and MSW.
X Aberdeenshire Stoneyhill Landfill (close
to Peterhead) SITA 60,000
The park would include a
mechanical biological
treatment facility, an in-vessel
composting unit and a
gasification plant”.
X Aberdeenshire Upperton Industrial
Estate, Peterhead
Buchan
Combined
Heat and
Power Ltd
100,000 Planning permission refused in
April 2010
P East Lothian Dunbar Landfill,
Oxwellmains, Dunbar Viridor
300-
450,000
Granted planning permission in
December 2010 following a
public inquiry
P East
Renfrewshire
Loganswell Farm (by
Newton Mearns
/Barrhead)
Lifetime
Recycling
~900,000
primarily commercial and
industrial waste is intended to
be processed at the facility
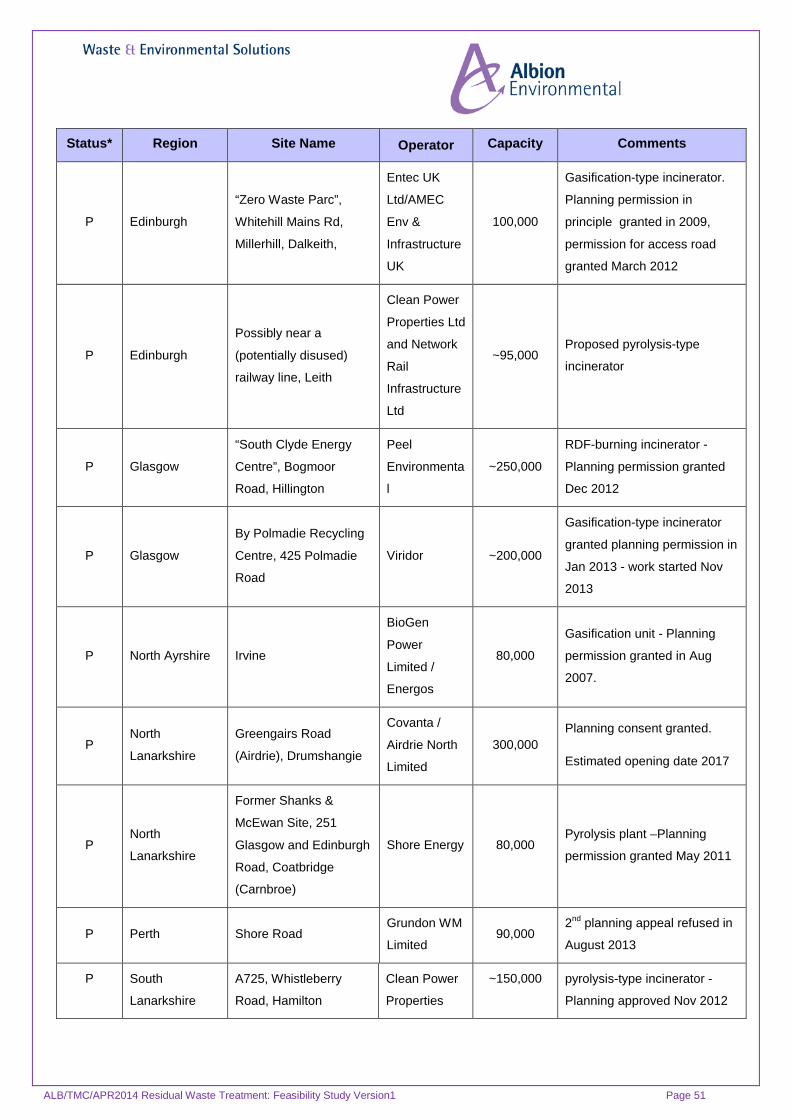
ALB/TMC/APR2014 Residual Waste Treatment: Feasibility Study Version1 Page 51
Status* Region Site Name Operator Capacity Comments
P Edinburgh
“Zero Waste Parc”,
Whitehill Mains Rd,
Millerhill, Dalkeith,
Entec UK
Ltd/AMEC
Env &
Infrastructure
UK
100,000
Gasification-type incinerator.
Planning permission in
principle granted in 2009,
permission for access road
granted March 2012
P Edinburgh
Possibly near a
(potentially disused)
railway line, Leith
Clean Power
Properties Ltd
and Network
Rail
Infrastructure
Ltd
~95,000 Proposed pyrolysis-type
incinerator
P Glasgow
“South Clyde Energy
Centre”, Bogmoor
Road, Hillington
Peel
Environmenta
l
~250,000
RDF-burning incinerator -
Planning permission granted
Dec 2012
P Glasgow
By Polmadie Recycling
Centre, 425 Polmadie
Road
Viridor ~200,000
Gasification-type incinerator
granted planning permission in
Jan 2013 - work started Nov
2013
P North Ayrshire Irvine
BioGen
Power
Limited /
Energos
80,000
Gasification unit - Planning
permission granted in Aug
2007.
P North
Lanarkshire
Greengairs Road
(Airdrie), Drumshangie
Covanta /
Airdrie North
Limited
300,000 Planning consent granted.
Estimated opening date 2017
P North
Lanarkshire
Former Shanks &
McEwan Site, 251
Glasgow and Edinburgh
Road, Coatbridge
(Carnbroe)
Shore Energy 80,000 Pyrolysis plant –Planning
permission granted May 2011
P Perth Shore Road Grundon WM
Limited 90,000
2nd planning appeal refused in
August 2013
P South
Lanarkshire
A725, Whistleberry
Road, Hamilton
Clean Power
Properties
~150,000 pyrolysis-type incinerator -
Planning approved Nov 2012

ALB/TMC/APR2014 Residual Waste Treatment: Feasibility Study Version1 Page 52
Status* Region Site Name Operator Capacity Comments
P South
Lanarkshire
Dovesdale Farm,
Carlisle Rd, Stonehouse Scotgen
80,000 –
160,000
Gasification-type incinerator.
Permit app withdrawn in Sept
2012, but the Company have
notified SEPA that Scotgen
would re-apply for licence
P South
Lanarkshire
Levenseat Waste
Management Site, By
Forth, Lanark
Levenseat Ltd
60,000 –
67,000
Gasification-type incinerator
granted planning permission in
Dec 2010
P West Lothian
Pond Green Energy
Park, Whitburn Road,
Bathgate
The Banks
Group
(partnership
with
Scotwaste)
80,000
Pyrolysis and/or gasification
incinerator proposed to treat
municipal and C&I waste
E Dumfrieshire Dargavel Stores,
Lockerbie Rd, Dumfries Scotgen 60,000
Constructed Gasification-type
incinerator - facility burnt down
in July 2013
E Dundee, Angus
(Tayside)
Forties Road, Baldovie
Industrial Estate
Dundee
Energy
Recycling Ltd
(DERL)
120,000 Insurance payout over £1m
following a fire in May 2012
E Shetland
Islands
Peak Load Boiler
Station, Gremista,
Lerwick
Shetland
Heat Energy
& Power Ltd
26,000
Incinerator burning domestic
and commercial waste from
Shetland, Orkney and offshore
oil industry.
X Perthshire Binn Farm, nr Glenfarg SITA 60,000
Gasification-type incinerator
planning permission granted
Oct 2011 but no environmental
permit in place yet.
X Stirling Bandeath Ind Estate,
Throsk
Powercrofters
(Scotland) Ltd ~60,000
Gasification-type incinerator.
permission in principle refused
in Nov 2012
*Status Key: P potential incinerator (proposed, in planning, or under construction) E existing incinerator (currently operating) X an incinerator that has been proposed but does not have permissions
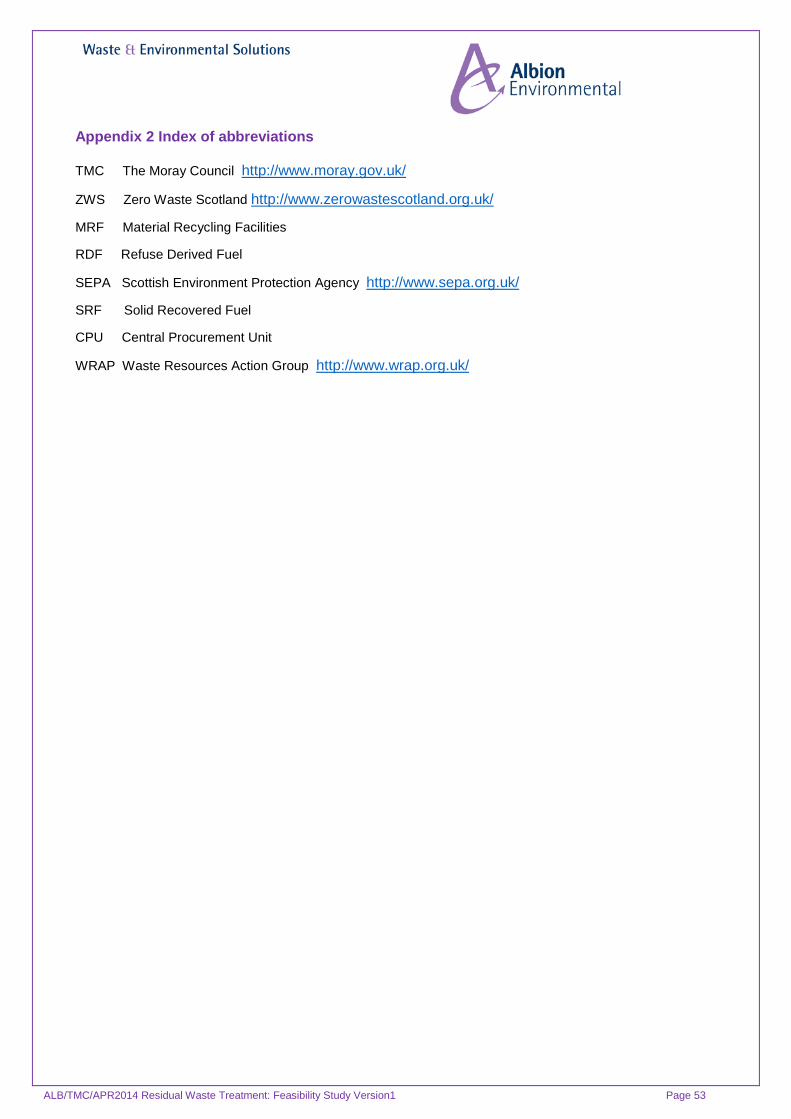
ALB/TMC/APR2014 Residual Waste Treatment: Feasibility Study Version1 Page 53
Appendix 2 Index of abbreviations TMC The Moray Council http://www.moray.gov.uk/
ZWS Zero Waste Scotland http://www.zerowastescotland.org.uk/
MRF Material Recycling Facilities
RDF Refuse Derived Fuel
SEPA Scottish Environment Protection Agency http://www.sepa.org.uk/
SRF Solid Recovered Fuel
CPU Central Procurement Unit
WRAP Waste Resources Action Group http://www.wrap.org.uk/
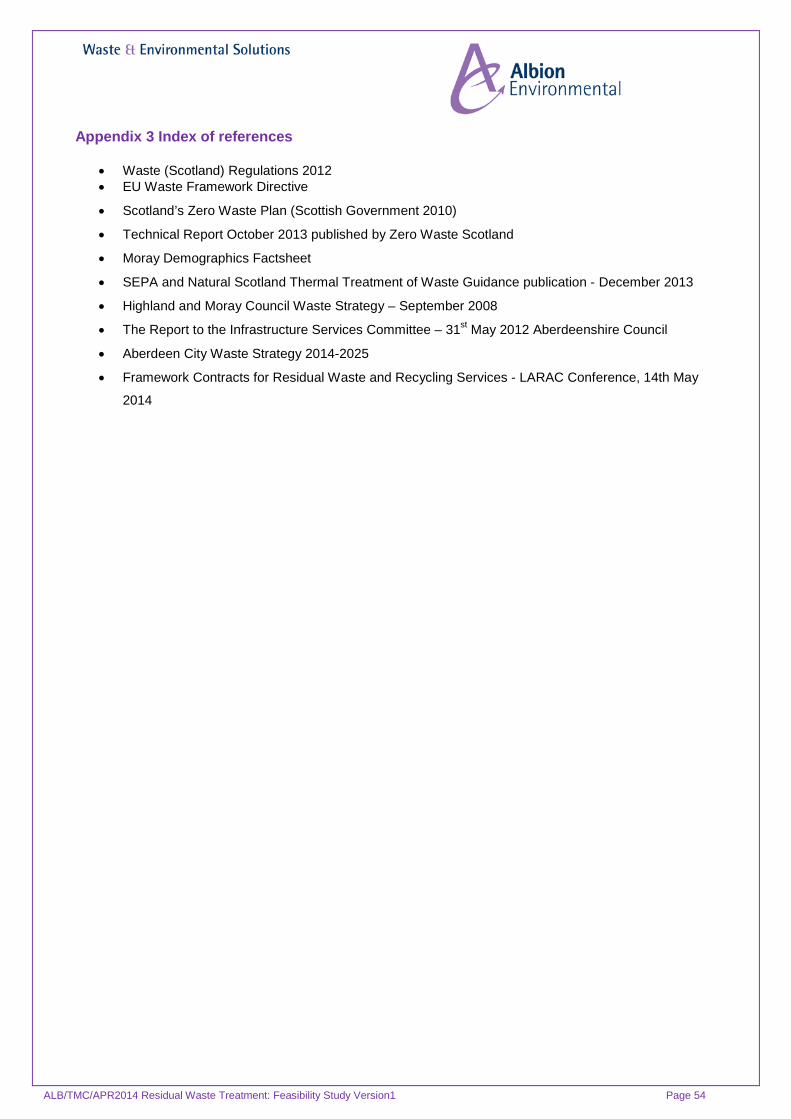
ALB/TMC/APR2014 Residual Waste Treatment: Feasibility Study Version1 Page 54
Appendix 3 Index of references
• Waste (Scotland) Regulations 2012 • EU Waste Framework Directive
• Scotland’s Zero Waste Plan (Scottish Government 2010)
• Technical Report October 2013 published by Zero Waste Scotland
• Moray Demographics Factsheet
• SEPA and Natural Scotland Thermal Treatment of Waste Guidance publication - December 2013
• Highland and Moray Council Waste Strategy – September 2008
• The Report to the Infrastructure Services Committee – 31st May 2012 Aberdeenshire Council
• Aberdeen City Waste Strategy 2014-2025
• Framework Contracts for Residual Waste and Recycling Services - LARAC Conference, 14th May
2014
ALB/TMC/APR2014 Residual Waste Treatment: Feasibility Study Version1 Page 55
Appendix 4 Index of Tables and Graphs
Tables 1. Residual and recycling trends 2001 to 2014 Page 10 2. Commercial Residual and recycling trends 2013 and 2014 Page 10 3. 2012 Waste compositional analysis Page 11 4. 2014 Waste compositional analysis Page 12 5. Theoretical recycling diversion rate assuming 100% diversion. Page 12 6. Theoretical recycling diversion rate assuming 100% diversion plus nappy recovery. Page 12 7. Cost Revenue Based on Do Nothing & Achieving 25% Diversion from Residual Waste Stream Page 14 8. Cost/Revenue Based on Achieving 50% and 100% Diversion from Residual Waste Stream Page 15 9. Base tonnages for 2013 / 14 and average 2006 – 12 Page 17 10. Diversion of 50% recyclate as per analysis Page 17 11. Diversion of 100% recyclate as per analysis Page 18 12. Diversion as per legal targets Page 18 13. Base tonnage for MRF facility Page 22 14. Tonnage remaining for Refuse Derived Fuel (RDF) or waste to energy facility Page 22 15. Advantages / Disadvantages of Recycling at Source versus recycling at MRF Page 23 16. Projected waste composition after 100% removal of recyclate Page 25 17. Carbon Factors for Household Wastes – (kgCo2eq per tonne of material) Page 27 18. Recycling with balance to Landfill Page 28 19. Recycling with balance to Incineration Page 29 20. Carbon Impact Summary Page 29 21. WRAP Gate Fees Report 2013 Incineration gate fees Page 31 22. Typical calorific values for materials Page 34 23. Renewable Obligations Certificate Rates Page 35
Graphs 1. Projected Waste Tonnages Page 20