Embed Size (px)
Citation preview
1
THE “MONTSERRAT-2000” FLASH-FLOOD EVENT: A COMPARISON WITH THE
FLOODS THAT HAVE OCCURRED IN THE NORTHEAST IBERIAN PENINSULA
SINCE THE 14th CENTURY
María del Carmen Llasat, Tomeu Rigo and Mariano Barriendos
Group of Analysis of Adverse Meteorological Situations (GAMA). Department of Astronomy and
Meteorology. University of Barcelona. Av. Diagonal 647. 08028 Barcelona
Tel: (+34) 93 402 11 24 Fax: (+34) 93 402 11 33
E-mail: [email protected] / [email protected]
Int. J. Climatol. 23: 453–469 (2003)

2
ABSTRACT
This paper presents an analysis of the flash floods that occurred in Catalonia (NE Iberian Peninsula)
on 10 June 2000, in the context of the historical floods recorded since the 14th century. The study
starts with pluviometric and meteorological analysis (essentially synoptic and thermodynamic) of
the episode. There follows a comparison of this event with previous floods for which we have
instrumental information, information from archives, or both types of information. In some cases
this permitted us to make a meteorological comparison of episodes similar to that of June 2000,
while the complete series was used to carry out a frequency analysis of floods which have occurred
in the basin under study. The conclusions show that although catastrophic flooding in spring is not
as typical a phenomenon as autumn flooding, such floods have been recorded at least once each
century, while it can be stated that the synoptic meteorological situation, where recorded, was of
similar characteristics in all cases.
KEY WORDS: Catalonia, Mediterranean sea, historical data, synoptic and thermodynamic
analysis, climatic analysis, floods.
,
1. INTRODUCTION
During the early morning of 10 June 2000 there occurred a downpour over Catalonia (NE Spain)
that caused serious damage in the Llobregat, Besós, Francolí and Riera de la Bisbal river basins
(Figure 1), due both to the rainfall and flooding and the landslides and debris flows. The most
notable damage consisted in partial destruction of infrastructure at Montserrat Monastery (720 m
a.s.l, Figure 1), where some 500 people had to be evacuated, and the destruction of some roads
leading up the mountain, total destruction of many bridges and sections of roadways, and the
flooding of built-up and residential zones with the attendant destruction of some dwellings,
especially in the tourist municipality of El Vendrell (Figure 1). The episode caused material damage
estimated at over 65,000,000 euros. There were five fatalities, which, while tragic in itself, could

3
have been much worse if the episode had occurred only a few hours later, as the affected zones
were prominent for their tourist activity.
The episode was spectacular indeed and can be classified as a catastrophic flood episode (Llasat and
Puigcerver, 1994). The most marked hydrometeorological feature was the considerable intensity of
sustained precipitation, with accumulated hourly quantities of over 100 mm and six-hour
maximums of over 200 mm. But that was not the first such case recorded this century, neither in
terms of rainfall intensity or flows nor in terms of the counties affected. We need only think back to
25 September 1962, 20-23 September 1971, 6-8 November 1982 and 2-5 October 1987 (Llasat,
1987, 1990, 1991; Ramis et al, 1994). The most unusual feature of this episode, however, lay in the
season of the year at which it occurred. In Catalonia, high-intensity (highly convective) episodes
usually occur in summer and at the beginning of the autumn (Llasat and Puigcerver, 1997; Llasat,
2001), and are characterised by their brevity and the fact that they give rise to sudden swelling of
Pyrenean watercourses and coastal stream beds. Catastrophic floods, with over 200 mm of
precipitation in 24 hours, occur in autumn, and only exceptionally this century have two or three
cases been recorded in winter (as, for example, in January 1996, Llasat et al, 2000). Those odd
events caused less damage due to the situation being much less convective and longer lasting, which
allowed better control of freshets to be implemented.
This study analyses the flooding episode of 10 June 2000 within the context of historical floods and
the climatic framework. To this end, the study starts with pluviometric and meteorological analysis
(essentially synoptic and thermodynamic) of the episode from a dual objective: to understand the
main factors which gave rise to rainfall exceeding 150 mm in three hours, and to be able to compare
it with previous situations. Such situations have been classified, in the light of the information
available, into: a) episodes after 1950, for which synoptic and thermodynamic information is
available; b) historical floods for which instrumental information is available in relation to surface
data (1780-1950); c) historical floods for which no instrumental information is available (from the
14th century). In cases a) and b) a meteorological comparison of episodes similar to that of June
2000 has been made. Those classified under c) were used to carry out a frequency analysis of the
floods.

4
2. PLUVIOMETRIC EVOLUTION
The most intense rainfall affected all the Interior Basins of Catalonia (I.B.C.), for which reason this
detailed analysis of its pluviometric evolution has been undertaken exclusively for those
hydrological basins (Figure 1). To that end the 5-minute rainfall data recorded at the automatic
stations of the Automatic Hydrological Information System (S.A.I.H) for the I.B.C. have been used.
It includes a total of 126 automatic pluviometric stations distributed over an area of 16,000 km2.
Those pluviometric stations are calibrated once every three months. Besides this, an objective
analysis scheme of the precipitation cumulated in 72 hours is made for each pluviograph. Finally,
for those events in which the rainfall rate or the cumulated rainfall are high (usually flood events),
precipitation data are compared with other official pluviometric networks
Figure 2 shows the accumulated rainfall distribution in the I.B.C. from 21:00 UTC on 9 June to
21:00 on 10 June. It can be observed that the maximum quantities were recorded in the basin of the
River Llobregat, with 224 mm at Rajadell, and in the basin of the Riera de la Bisbal, with 134 mm
at Bisbal del Penedés, over 100 mm of which was recorded in less than 2 hours. A value of over 100
mm was also recorded in the basins of the Francolí, Gaià and Foix. All the sub-basins of the I.B.C.
recorded accumulated rainfall above 50 mm.
Figure 3a shows the rainfall distribution at half-hourly intervals from 21:00 UTC on 9 June to
09:00 UTC on 10 June. The rainfall was basically distributed along a SE-NW orientated axis,
whose translation was very slow, remaining stationary for several hours over the same zones. The
first rains in the I.B.C. were recorded on 9 June just before 21:30 UTC, mainly affecting the river-
stream basins of the Costa Sud. The rainfall band had a NE movement linked to the movement of
the surface low located over the Mediterranean Sea, with a translation speed estimated at some 10
km/h. Rainfall evolution in the pluviographs of Rajadell and of La Bisbal corroborates this
movement (Figure 3b)
Between 01:00 UTC and 03:30 UTC the system hardly moved and gave rise to abundant
precipitation over the basins of the south of Catalonia, with 5-minute intensities exceeding 120
mm/h. The first rainfall in the River Llobregat basin was recorded around 00:00 UTC and reached
maximum values between 02:00 and 05:00 UTC. During the morning of the 10th the rain extended
to the basins of Northeast Catalonia, though large rises did not occur there.

5
3. ANALYSIS OF THE MONTSERRAT EVENT
Given that the purpose of this study is to analyse the floods of 10 June 2000 within the historical-
climatic context of the last 500 years, this meteorological analysis will only focus on the main
synoptic, thermodynamic and hydrologic aspects of the event.
3.1 Synoptic evolution
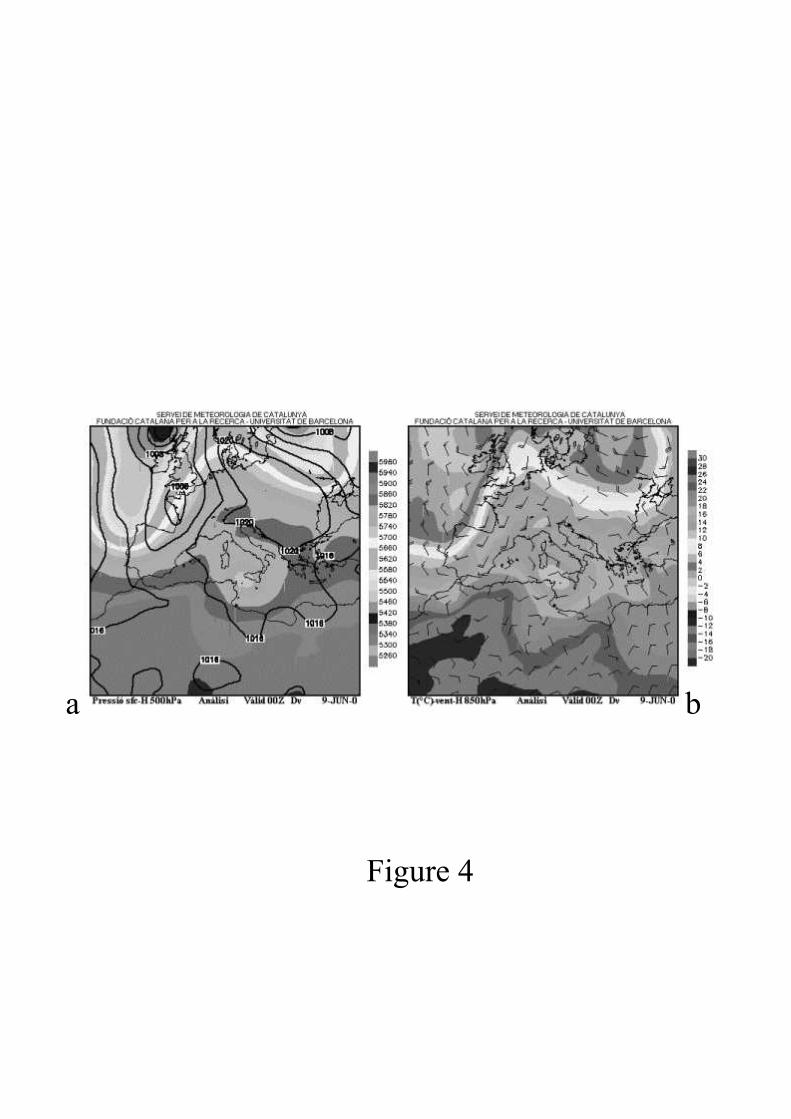
The synoptic situation on 9 June shows the entry from the western part of the Iberian Peninsula of a
cold front associated with a low situated to the north of the British Isles, while Catalonia itself was
under the influence of an anticyclone that affected Central and Eastern Europe and much of the
Mediterranean (Figure 4a). At high altitude a cold trough could be detected (Figure 4a), the axis of
which was situated at 00:00 UTC over Portugal and gave rise at 850 hPa (Figure 4b) to cold
westerly winds over the western sector of the Iberian Peninsula, and warm southerly winds over the
eastern sector. Notable at 850 hPa (Figure 4b) was a strong confluence of SE and SW winds over
Catalonia. Thus the region had the basic factors that precede heavy rainfall situations in the East of
the Iberian Peninsula (Llasat and Puigcerver, 1994): an anticyclonic situation over Catalonia and the
Mediterranean sea, with an influx of very warm and moist air, which permits the generation of
considerable instability that remains latent until some factor, whether orographic or dynamic,
triggers the convection.
On 10 June at 00:00 UTC the cold front was situated around the longitude meridian of 0º, to the
west of Catalonia. Over the previous few hours a surface depression had been forming, centred on
the Balearic Islands, reaching 1008 hPa (Figure 5a). Also over the previous few hours, the flow
from the west that dominated most of the Peninsula at 850 hPa had been veering, so that by that
time it was coming mainly from the north (Figure 5b) and had advected very cold air that extended
right to the upper troposphere and was responsible for the snow that fell that day over the north and
centre of Spain. In this case, everything seems to point to the presence of a cold air pool over the
northern coastline of Spain in the strictest sense of the term: minimum of pressure and temperature
at 500 hPa that was not detectable at the surface (Llasat and Puigcerver, 1990). It was also capable

6
of playing an active role in the production of rain and snowfall over part of the Peninsula, for it
went up to 850 hPa. But that was not the only factor responsible for the torrential rains recorded in
Catalonia. Indeed, the dominant synoptic situation in this region between 00:00 UTC and 12:00
UTC, the interval over which practically all the rain fell, showed a conjunction of the following
factors:
• Mesoscalar depression (meso-α) at the surface which extended from the Balearic Islands to the
I.B.C and led to the convergence of water vapour at low levels, while playing a direct part in
triggering the potential instability accumulated previously (the location of the convective
system on the radar imagery pointed to the existence of a line of convergence that was
advancing over Catalonia along a SE-NW axis), as will emerge from the thermodynamic
analysis.
•
Conjunction of the cold depression in the upper atmosphere and the surface depression, thus
deepening the depression.
• Strong wind from the E-SE at low levels (more than 30 kt at 950 hpa) and from the SSW at
high levels, over the affected area, that produced a marked shearing, a phenomenon which
favours the production of multicellular storms. This wet flow from the Mediterranean impinged
perpendicularly to the mountain ranges at 850 hPa..
• Strong orographic component in sustaining the convection, which combined with the advance
of the depression at low levels, was to cause emergence of the spatial evolution features of the
heaviest rainfalls. Figure 6 shows a convergence line in surface over the region in which the
main rainfalls were produced at 00:00 UTC (winds are measured at 2 m above the soil),
3.2 Thermodynamic evolution
The thermodynamic analysis was carried out on the basis of information provided by the 24
aerological stations show in Figure 7, with particular prominence accorded to the radiosondes
situated between 32-46º latitude North and 10ºE-10ºW. The Barcelona radiosonde, though
currently in an experimental phase, was also taken into consideration; however, given that the
episode took place within the warm zone and with a strong southerly component, the Palma
radiosonde was felt to be a useful tool for identifying the mass of air at low levels that would later
affect Catalonia (Llasat, 1987; Llasat, 1990). Figure 8 shows the sounding of Palma de Mallorca
and Madrid (center of the Iberian Peninsula) at 00:00 UTC. It is interesting to see the presence of
7
cold air in all the troposphere, in Madrid, meanwhile in Palma de Mallorca there is a strongest
temperature gradient in all the troposphere.
Analysis of the Lifted Index on 9 June at 12:00 UTC permitted delimitation of a clear line of
differentiation between the unstable part (Mediterranean zone) and the stable zone (peninsular
zone), situated roughly over an axis running through Murcia, Zaragoza and Bordeaux, which
between 00:00 UTC and 12:00 UTC on 10 June shifted strongly towards the east (Figure 9).
Analysis of the CAPE (Convective Available Potential Energy,) shows a significant maximum of
over 3000 J/kg which on 9 June at 1200 UTC was centred on Cagliari and twelve hours later was
centred on Palma (Figure 10), with a reading of less than 1700 J/Kg. It is important to remember
that CAPE values above 1500 J/kg point to a major risk of a severe weather or heavy rainfall
situations arising in this region (Tudurí and Ramis, 1997). The precipitable water mass followed a
similar evolution, with a maximum over Sardinia on 9 June at 12:00 UTC that 12 hours later was
located over the Majorca island with a value of 17 kg/m2 between the surface and 850 hPa (Figure
11). This high concentration of water vapour at low levels was a result of the anticyclonic situation
that had been prevailing over proceeding days, accompanied by strong heating and evaporation of
sea water. Here it is worth noting the layer of dry air recorded on 9 June and the early morning of
10 June, between 600 and 850 hPa, a feature of severe weather situations associated with strong
winds (Doswell et al., 1996), a phenomenon also recorded in coastal zones of Catalonia and one
that corroborated the Barcelona radiosonde.
The compound maps (Ramis et al, 1994, 1995) for 9 June 12:00 UTC and 10 June 00:00 UTC have
been made on the basis of distribution of instability, CAPE and precipitable water mass in low
levels (Figure 12). It can be seen that the area where the three effects overlap was over the
Mediterranean Sea, off Catalonia (due to the strong wind over Barcelona on 10 June 00:00 UTC the
globe of the radiosonde burst and no vertical data are available) . The flow from the South in low
and medium levels blew this area into Catalonia. The convergence line created by the mesoscalar
low was enough to trigger this instability. The fact that the rainfall was most intense in the
mountainous regions shows the important role of relief in the development of convection, with
forced updrafts between 500 and 1500 m (Riosalido, 1998). In this case, the mountain ranges were
also important in favouring the stationarity of the convective systems.
8
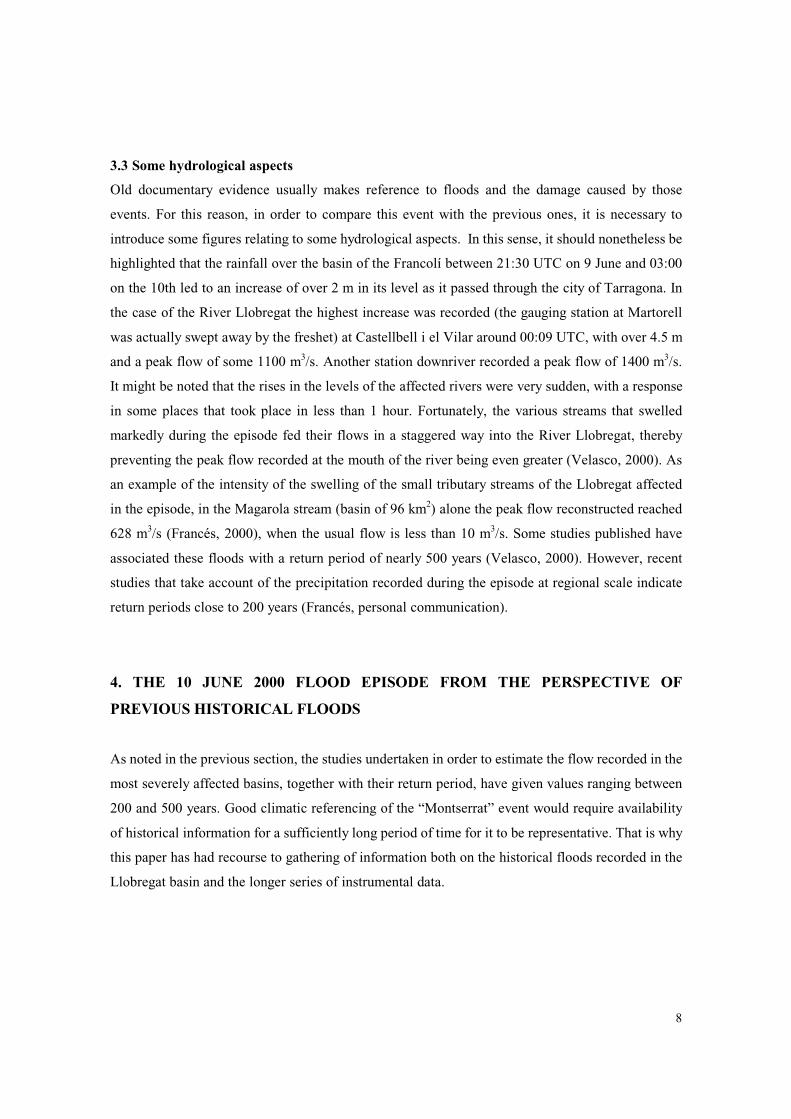
3.3 Some hydrological aspects
Old documentary evidence usually makes reference to floods and the damage caused by those
events. For this reason, in order to compare this event with the previous ones, it is necessary to
introduce some figures relating to some hydrological aspects. In this sense, it should nonetheless be
highlighted that the rainfall over the basin of the Francolí between 21:30 UTC on 9 June and 03:00
on the 10th led to an increase of over 2 m in its level as it passed through the city of Tarragona. In
the case of the River Llobregat the highest increase was recorded (the gauging station at Martorell
was actually swept away by the freshet) at Castellbell i el Vilar around 00:09 UTC, with over 4.5 m
and a peak flow of some 1100 m3/s. Another station downriver recorded a peak flow of 1400 m3/s.
It might be noted that the rises in the levels of the affected rivers were very sudden, with a response
in some places that took place in less than 1 hour. Fortunately, the various streams that swelled
markedly during the episode fed their flows in a staggered way into the River Llobregat, thereby
preventing the peak flow recorded at the mouth of the river being even greater (Velasco, 2000). As
an example of the intensity of the swelling of the small tributary streams of the Llobregat affected
in the episode, in the Magarola stream (basin of 96 km2) alone the peak flow reconstructed reached
628 m3/s (Francés, 2000), when the usual flow is less than 10 m3/s. Some studies published have
associated these floods with a return period of nearly 500 years (Velasco, 2000). However, recent
studies that take account of the precipitation recorded during the episode at regional scale indicate
return periods close to 200 years (Francés, personal communication).
4. THE 10 JUNE 2000 FLOOD EPISODE FROM THE PERSPECTIVE OF
PREVIOUS HISTORICAL FLOODS
As noted in the previous section, the studies undertaken in order to estimate the flow recorded in the
most severely affected basins, together with their return period, have given values ranging between
200 and 500 years. Good climatic referencing of the “Montserrat” event would require availability
of historical information for a sufficiently long period of time for it to be representative. That is why
this paper has had recourse to gathering of information both on the historical floods recorded in the
Llobregat basin and the longer series of instrumental data.

9
Such information is not homogeneous, however, for which reason it is advisable to distinguish
between:
a) Episodes recorded after 1950 and for which pluviometric, hydrological, synoptic and
thermodynamic information is available.
b) Episodes recorded between 1780 and 1950, for which mean monthly surface pressure is available
for various places in Europe and daily pressure for Barcelona (situated near the mouth of the River
Llobregat), together with technical and handwritten reports. Daily precipitation data for Barcelona
is available from 1850.
c) Episodes recorded prior to 1780 for which only information from archives and handwritten
papers is available. This work with proxy data has been done by collecting the continuous records
of floods in municipal and private documentary sources, from various places in Catalonia. The
information relates to the damage and destruction caused to infrastructure and crops by water
courses bursting their banks. This information occasionally contains references to the
meteorological episode itself, and even to hydrological aspects. This documentary information
permits reconstruction of the flood series for the last 500 years at various localities in Catalonia.
The information gathered is of considerable reliability due to its being contained mostly in official
documents, and its dating and verification poses no problem since the information is organised at
daily resolution.
In order to have a minimum homogeneity in all the flood series, three types of high water situations
have been differentiated according to their impact (Barriendos and Pomés, 1993; Llasat et al, 1999).
Along general lines, they are as follows:
1) simple rises or ordinary floods: precipitation episodes, which cause increases in the flow of the
course of rivers or streams, but do not lead to them bursting their banks. They can cause damage
and loss of life if work is being engaged in near or actually in the river bed at the time of the rise,
quite independently of its intensity.
2) extraordinary floods: episodes of precipitation that lead to overflowing of banks, with an
intensity or duration that does not cause important damage in the locality. They can give rise to
disturbances of the day-to-day life of the population.
3) catastrophic floods: episodes of precipitation that cause overflowing with serious damage or
destruction of infrastructure (bridges, mills, walls, roads), buildings and crops.

10
In the light of this classification, the episode of 10 June 2000 would clearly lie within the type
termed catastrophic floods.
4.1 Comparison with the catastrophic flood events recorded in the Llobregat basin between
1950 and 2000.
Over the last 50 years precipitation levels of 250 mm in 24 hours have been exceeded in various
episodes affecting the River Llobregat basin. On 25 September 1962 that amount was recorded in
less than three hours and led to 441 deaths and 374 missing persons. On 20 September 1971, 308
mm were recorded in less than 24 hours, and as consequence of the rainfalls that occurred between
the 20 and 23 September 18 people died. From 6 to 8 November 1982, 341 mm were recorded in 24
hours and 510 mm were recorded in less than 3 days, causing 14 deaths in Catalonia, although this
episode mainly affected the upper reaches of the River Llobregat. Finally, the floods recorded
between 28 September and 5 October 1987 totalled 431 mm over the entire episode near the mouth
of the Llobregat river, causing 10 deaths in Catalonia and substantial material losses. In the 1962
episode, the material damage was estimated at the time at Ptas. 2,650 million (16 million Euros), a
figure which rose to Ptas. 7,000 million (42 million Euros) in the floods of 1971 and Ptas. 45,000
million (270 million Euros) in those of 1982. This damage amount for the 1982 episode only
includes damage in Catalonia. The floods also affected Andorra and France.
While in the recent episode of 10 June the peak flow of the Llobregat at its mouth has been
estimated at 1300 m3/s, the floods recorded in this period for the River Llobregat have shown higher
peak flows. The Martorell gauging station is usually taken as the point of reference: 1550 m3/s in
the 1962 episode, 1600 m3/s in the 1982 episode and the maximum known value of 3080 m3/s in
1971. The floods recorded in the springtime nevertheless also show peak flow values almost as
large as those of the autumn floods (Junta de Aguas, 1994): on 17 April 1916 Martorell recorded a
peak flow of 1300 m3/s and on 28 April 1942 the flow reached 1500 m3/s. Neither of these two
episodes can be classified as catastrophic, however.
Although neither episode occurred in spring, the most similar one from a meteorological point of
view and in terms of the area affected was the one in September 1962. In that case, too, the
maximums were recorded over the basins of the rivers Llobregat and Besós (Figure 13), only a few
kilometres from those recorded in June 2000. Many of the synoptic features certainly coincided

11
with ones that had arisen before and during the serious flash floods of 10 June 2000. During the
flood event of 1962, in addition to the prior situation previously noted and common to this type of
episodes (Llasat and Puigcerver, 1994), some notable features were: focusing of the instability at
very low levels; the advance of a cold front over the Peninsula leading to rain and hail in many
parts; the advance of the rains in Catalonia from SE to NE; and the fact that the episode occurred at
night-time. The precipitable water mass on 25 September at 1200 UTC exceeded 39 mm, a figure
equivalent to 131% of the mean figure for the month of September. At that time the LI and the
CAPE achieved values of –3 and 1850 J/kg, respectively. Figure 14 shows a comparison between
the evolution of the various thermodynamic variables for the episodes of 1962 and June 2000.
4.2 Comparison with the catastrophic flood events recorded in the Llobregat basin between
1780 and 1950
Between 1780 and 1950 there are records of 44 flood episodes in the mouth of the River Llobregat,
of which 6 were catastrophic, and 38 extraordinary. From all of them, 8 events were recorded in
spring: one catastrophic, on 26 May 1853, and the other seven were extraordinary.
In addition to the information from the historical archives, instrumental surface-pressure,
temperature and rainfall data are available at some stations for this period. However, the fact that
for part of the period no data at daily resolution are available (except for certain stations) limits the
analysis to a search for coherence between the conceptual models developed for later periods and
the available data. This is the case of the analysis of the flood event of June 1794. This event could
be considered as extraordinary in the mouth of the Llobregat river, but it was catastrophic in
Barcelona and other little basins near to the Llobregat basin (it is not possible to have information
about the complete Llobregat basin due to the ongoing war at that time).
The 1794 episode shows certain similarities to the 2000 episode: The precipitation recorded
between the evening of 8 June and the morning of 9 June was sufficient to have catastrophic effects
on various towns. Throughout the description of the 1794 event it is said that the flooding was so
sudden that the population had no time to respond, which allows it to be identified as a flash flood.
Analysis of the mean monthly pressure (CRU database, Norwich) shows the presence of a strong
anticyclonic area situated over the North Atlantic and extending across to Central Europe (Figure
15a). Evolution of the daily surface pressure in Barcelona (Figure 15b) shows the passage of a deep

12
depression between 8 and 9 June 1794. Besides this, the temperature before the event reaches high
values, something that had been observed with other flash-flood events in the Western
Mediterranean (Llasat et al., 1996) . This low probably encouraged a confluence of the warm and
moist Mediterranean air mass with the masses of cold air from the N and NE that were advected by
the strong anticyclone situated in the North Atlantic. Finally, the reconstruction of the charts using
the daily mean surface pressure data of 10 European stations (data obtained into the framework of
the European projects IMPROVE and SPHERE) corroborates the presence of the low over
Catalonia and the presence of a relative high pressure over Europe. These hypotheses fit with the
typical situation of floods over Catalonia (Llasat and Puigcerver, 1994), and the 2000 episode itself.
4.3 The climatic context on the basis of analysis of floods recorded in Catalonia from the 15th
century
In order to provide an idea of how these episodes are distributed over the course of the year, the
complete series of catastrophic floods recorded in the lower part of the Llobregat River (El Prat de
Llobregat) has been reconstructed from 1315 down to 1971 (Codina, 1966, 1994). The analysis of
this information besides the other one obtained into the framework of the SPHERE project, drives
to the conclusion that 171 flood events have been recorded between the years 1300 and 2000 in the
mouth of the Llobregat river. 69 of them were ordinary, 81 were extraordinary and 21 were
catastrophic. Although most of them were recorded during the autumn, it is possible to find some
cases that occurred in the spring, such as the floods of 2 May 1603, 9 June 1794 and between 24
and 26 May 1853.
Figure 16 shows the climatic evolution of the standardised values of frequencies of such floods.
Firstly, flood data have been weighted giving value 1 to extraordinary events and value 2 to
catastrophic events. Once this annual index has been calculated, a series of its standardised values
have been built for the period 1300-2000. Finally, a smooth filter of 31 years moving average has
been applied. The frequency of the floods in the lower reaches of the River Llobregat, despite the
smoothing applied to the standardised values, shows non-regular oscillating behaviour. More
specifically, a marked oscillation occurred in the last decades of the 16th century and first two
decades of the 17th century. The second half of the 18th century showed another moderate increase
and, finally, there was a second lengthy and intense oscillation in the middle of the 19th century.
These last three oscillations lie within the framework of the climatic episode known as the Little Ice

13
Age, in its most intense and widespread period between the 16th and 19th centuries, the first signs of
which can be detected in Northern Europe around the beginning of the 14th century.
Despite the fact that the intense precipitation events that cause floods arise out of singular and not
necessarily similar atmospheric situations, their concentration over the course of the centuries in
intervals of some 40 years’ duration is a noteworthy climatic aspect. Furthermore, such oscillations
constitute a point of connection between climatic variability in the Mediterranean region and in
higher latitudes: during the Little Ice Age the oscillations coincided with the pulses of advance of
the Alpine glaciers, and are nearly synchronous particularly with the studied behaviour of the
Grindelwald glacier, thereby showing that these are different effects of the same climatic patterns
(Barriendos and Martín-Vide, 1998; Pfister, 1988).
5. CONCLUSIONS
During the early hours of 10 June 2000 heavy rainfalls and flash floods were recorded in Catalonia
that caused damage calculated at over 66 million euros and caused five fatalities. The worst affected
zones were the basins of the River Llobregat and many of the coastal watercourses. The rain was
characterised by its high intensity, in some localities exceeding 100 mm in one hour, with a
maximum accumulated amount of 224 mm in less than 24 hours, according to official sources.
Amounts of that magnitude or greater still have nonetheless been recorded on more than one
occasion over the course of the last century at certain localities in Catalonia, and probably – though
we do not have quantitative rainfall data for the episodes in question – also in previous centuries, as
may be deduced from the presence of catastrophic flash-floods. The fact that the episode occurred
in the spring makes it rarer, as this kind of episode normally occurs in Catalonia at the end of the
summer and particularly in the autumn. Historical data show that in the 17th, 18th and 19th centuries,
too, at least one catastrophic flood episode was recorded in the spring season. Similarly, the
increase of flow recorded in this case in the lower reaches of the Llobregat was not the highest of
the last century. It might have been highest, however – though there are no records of it due to an
absence of gauging stations – in some of the normally dry beds of streams that experienced sudden
overflows.

14
Among the meteorological aspects, we might note the stationary nature of the convective system
that led to the accumulation of a large amount of precipitation in a short time. That system,
presenting an essentially linear structure (squall line) with the formation of various convective cells
within it, was detected for the first time in the SW of Catalonia on 9 June around 23:00 UTC, with a
slow translation in a NE direction. In addition to the orography itself, factors that favoured its
development were the advection of very warm and moist air at low levels, with the presence of a
surface low off the Catalan coast, which induced a flow from the SE and convergence, while a cold
air pool was detected in the upper atmosphere (a factor not always recorded in flood episodes in
Catalonia). Analysis of the vertical thermodynamic structure of the atmosphere points to
focalisation of potential instability around the northeastern sector of the Western Mediterranean.
The three episodes of spring catastrophic flooding known prior to the 20th century and affecting the
River Llobregat basin (May 1603, June 1794 and May 1853) took place within the climatic episode
known as the Little Ice Age; the episode of 1794 in particular (similar to that of 2000) took place
within the “Maldà Oscillation” (Barriendos and Llasat, in prep.), was characterised by exceptionally
anomalous climatic behaviour in the Mediterranean basin, with a simultaneous increase of droughts
and floods. In the case of the heavy rainfall recorded in June 2000 and analysed in this paper, it is
not possible to reach a conclusion about whether or not it forms part of a generalised climatic
anomaly or climatic trend or is simply an exceptional ad hoc anomaly or episode.
ACKNOWLEDGEMENTS
Our most sincere thanks to the Agencia Catalana de l’Aigua of the Department of the Environment
of the Government of Catalonia for allowing us access to the S.A.I.H. data for the Interior Basins of
Catalonia. Our thanks to the Servei de Meteorologia de Catalunya for the meteorological
information provided. This work has been carried out thanks to financing under the European
project Systematic, Palaeoflood and Historical data for the Improvement of Flood Risk Estimation
(SPHERE), EVG1-CT-1999-00010. Some results from the IMPROVE project (ENV4-CT97-511)
have been used. Our acknowledgement to Thomas Molloy for translating the present paper.

15
REFERENCES
Barriendos, M. 1994. El clima histórico de Catalonia. Aproximación a sus características
generales (Siglos XV-XIX). Unpublished Ph. D. Thesis, Geography Faculty, University of
Barcelona, Barcelona, 500 p.
Barriendos, M. 2000. Els aiguats catastròfics de primavera a Catalunya. Referents històrics a la seva
freqüència, distribució i impactes. Proceedings of the “VI Jornades de Meteorologia Eduard
Fontseré”, Barcelona, 25th November 2000: 107-116.
Barriendos, M., Martín-Vide, J. 1998. Secular Climatic Oscillations as Indicated by Catastrophic
Floods in the Spanish Mediterranean Coastal Area (14th-19th Centuries). Climatic Change, 38:
473-491.
Barriendos, M., Pomés, J. 1993. L'aigua a Mataró. Inundacions i recursos hídrics (Segles XVIII-XX).
Mataró, Caixa d’Estalvis Laietana, 278 p.
Barriendos, M., Gómez, B., Peña, J.C. 1997. Old series of meteorological readings for Madrid and
Barcelona (1780-1860). Documentary and observed characteristics. In Martín-Vide, J. (ed.):
Advances in Historical Climatology in Spain, Barcelona, Oikos-Tau: 157-172.
Barriendos, M., Llasat, M.C. The study of climatic anomalies by means of zonality and NAO indices.
The case of ‘Malda’ anomaly in the Western Mediterranean Basin (AD 1760-1800), submitted to
Climatic Change.
Bentabol, H. 1900. Las aguas de España and Portugal. Madrid, Vda. e Hijos de M. Tello.
Burgueño, A. 1980. Diversos aspectos climatológicos de la lluvia en Barcelona. First-degree
dissertation, Facultad de Física, Universidad de Barcelona, Barcelona.
Codina, J. 1966. Delta del Llobregat. La gent del fang. El Prat: 965-1965. Granollers, Montblanc.

16
Codina, J. 1994 Inundacions al Delta del Llobregat. Barcelona, R. Dalmau, Col. Episodis de la
Història, nos. 147-148
Doswell, Ch. A. III, Brooks, H.E., Maddox, R.A. 1996. Flash flood forecasting: an ingredients
based methodology. Wea. Forecasting, 11: 560-581
Fontana Tarrats, J.M. 1976 a. Historia del clima en Cataluña. Noticias antiguas, medievales y en
especial de los siglos XV, XVI and XVII. Madrid, unpublished, typewritten work, 248 pp.
Fontana Tarrats, J.M. 1976 b. Historia del clima en el litoral mediterráneo: Reino de Valencia más
Provincia de Murcia. Javea, unpublished, typewritten work, 206 pp.
Francés, F. 2000. Consecuencia de la lluvia del 10 June 2000 sobre el comportamiento hidrológico
de la Riera de Magarola y sus afluentes. Proceedings of the “VI Jornades de Meteorologia Eduard
Fontseré”, Barcelona, 25th November 2000: 129-140.
Junta d’Aigües. 1994. Recomanacions sobre mètodes d’estimació d’avingudes màximes. Barcelona,
Generalitat de Catalonia.
Llasat, M.C. 1987. Episodes de lluvias copiosas en Cataluña: genesis, evolución y factores coadyu-
vantes. Barcelona, Publicacions de la Universitat de Barcelona, 543 pp., 84-7528-235-0.
Llasat, M.C. 1990. Influencia de la orografia y de la inestabilidad convectiva en la distribucion
espacial de lluvias extremas en Cataluña. Acta Geológica Hispánica, 25, nº3: 197-208
Llasat, M.C. 1991. Gota fría. Barcelona, Marcombo, (colec. Boixareu Universitaria), nº6, 165 p.,
84-267-0829-3.
Llasat, M.C., Puigcerver, M. 1990. Cold air pools over Europe. Meteorology and Atmospheric
Physics, 42: 171-177.
Llasat, M.C., Puigcerver, M. 1994. Meteorological factors associated with floods in the northeastern
part of the Iberian peninsula. Natural Hazards, 9: 81-93.

17
Llasat, M.C., Ramis, C., Barrantes, J. 1996. The meteorology of high-intensity rainfall events over
the West Mediterranean Region. Remote Sensing Reviews, 14: 51-90.
Llasat, M.C., Puigcerver, M. 1997. Total rainfall and convective rainfall in Catalonia, Spain.
International Journal of Climatology, 17: 1-13.
Llasat, M.C. 1999. Una clasificación de los episodios pluviométricos para utilization en hidrología.
Aplicación a la intensidad de lluvia de Barcelona. Revista de Ingeniería Civil, nº 112: 35-46
Llasat, M.C., Barriendos, M., Rodriguez, R., Martín-Vide, J. 1999. Evolución de las inundaciones
en Cataluña en los últimos quinientos años. Ingeniería del Agua, 6, nº4: 353-362.
Llasat, M.C., Rigo, T., Montes, J.M. 2000. Orographic role in the temporal and spatial distribution
of precipitation. The case of the internal basins of Catalonia (Spain). Proceedings of the EGS
Plinius Conference held at Maratea, Italy, October 1999: 41-55
Llasat, M.C. 2001. An objective classification of rainfall events on the basis of their convective
features. Application to rainfall intensity in the North-East of Spain. Int. J. Climatol. 21: 1385-1400.
Pfister, C. 1988. Klimageschichte der Schweiz. 1525-1860. Bern, Paul Haupt, 184 p.
Ramis, C., Llasat, M.C., Genovés, A., Jansà, A. 1994. The October-87 floods in Catalonia. Synoptic
and mesoscale mechanisms. Meteorological Applications, 1: 337-350.
Ramis, C.,Llasat, M.C., Alonso, S. 1995. A comparative study between two cases of extreme
rainfall events in Catalonia.Surveys in Geophysics Journal, 16: 141-161.
Rico Sinobas, M. 1851. Memoria sobre las causas meteorológico-físicas que producen las
constantes sequías de Murcia y Almería, señalando los medios de atenuar sus efectos, Madrid, D.S.
Compagni.

18
Riosalido, R. 1998. Estudio meteorológico de la situation del 7 de Agosto de 1996 (Biescas). Nota
Técnica STAP nº 26, Ministerio de Medio Ambiente, Dirección General del INM, 90 p.
Sanz, M. 1983. El Ripoll i les seves avingudes, Sabadell, Col.legi Oficial de Llicenciats i Doctors de
Catalonia i Balears.
Tudurí, E., Ramis, C., 1997. The environments of significant convective events in the Western
Mediterranean. American Meteorological Society, 12: 294-306.
Velasco, E. 2000. Les riuades del 10/06/00 a les conques vessants al Llobregat. Proceedings of the
“VI Jornades de Meteorologia Eduard Fontseré”, Barcelona, 25th November 2000: 41-50.
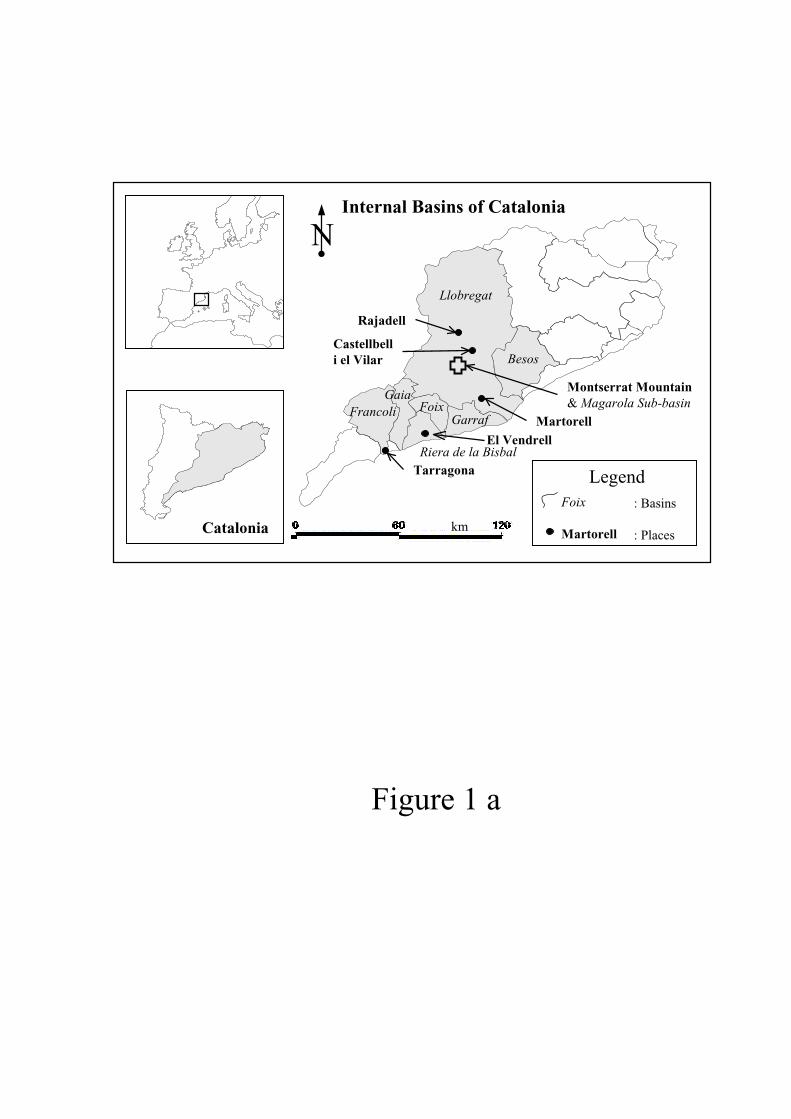
Figure 1 a
Riera de la Bisbal
Llobregat
El Vendrell
Garraf
Besos
Francoli Foix
Montserrat Mountain& Magarola Sub-basin
Martorell
Rajadell
Castellbelli el Vilar
Tarragona
Gaia
Catalonia
Internal Basins of Catalonia
Foix
Martorell
: Basins
: Places
Legend
km
N

Figure 1 b
<500 m.500-1000
1000-15001500-2000
>2000
Altitude (meters a.s.l.)
L i t o r a
l R a n g e
L i t o r a
l R a n g e
P r e l i
t o r a l
R a n g e
P r e l i
t o r a l
R a n g e
P Y R E N E E S
P Y R E N E E S
N

km
Figure 2

Figure 3 a

Figure 3 b
a b
Figure 4

a b
Figure 5

Figure 6

Figure 7

a b
Figure 8

Figure 9

Figure 10

Figure 11

a
b
Figure 12

Figure 13

0
200
400
600
800
1000
1200
1400
1600
1800
2000
CA
PE
(J/
kg)
I II III IV
-7
-6
-5
-4
-3
-2
-1
0
1
2
3
4
LI
a
b
Figure 14

L
h
∗ ∗∗ ∗ ∗ ∗ ∗ ∗ ∗ ∗ ∗
25 26 27 28 29 30 31 1 2 3 4 5 6 7 8 9 10 11 12 1312
18
24
30
36Temperature (ºC)
980
990
1000
1010
1020Pressure (hPa)
Temperature Pressure Day with rainfall∗
H
L
GRUP GAMA: MSLP JUN/1794
L
L
h
a) b)
c)
Figure 15

1300 1350 1400 1450 1500 1550 1600 1650 1700 1750 1800 1850 1900 1950 2000
0
0,4
0,8
1,2
-0,4
-0,8
Figure 16