Embed Size (px)
Citation preview
March 2017
The Monthly Stress-Test on Family Finances JPMorgan Chase Institute Insight
1
Families of all kinds face uncertainty when it comes to their finances each month. Income and spending volatility has been on the rise, and this has important ramifications for families.1
Volatility creates a type of monthly “stress-test” on families’ balance sheets, for which families need to be prepared. A recent Federal Reserve survey found that 42 percent of adults with volatile incomes or expenses struggled to pay their bills at times because of this volatility, and 46 percent of families could not readily pay for a $400 emergency expense or would borrow or sell something to do so. Volatility exacts not just a financial toll but also a psychological toll on families: a recent study by Pew highlights that people increasingly favor income stability over income growth.
The JPMorgan Chase Institute has assembled data assets and perspectives on income and spending volatility over the last three years and examined the impacts of extraordinary income changes from job loss and extraordinary expense changes, notably from medical payments.2 Here we take a holistic view of this work and highlight a few of the key takeaways. We underscore what this volatility means for the financial resilience of American by estimating the everyday cash buffer families need to weather such volatility.
1. Americans across the income spectrum experience high levels of income and spending volatility. We observe that family income and spending both fluctuate by about 30 percent on a month-to-month basis.3 On the expense side, this is equivalent to spending fluctuations of roughly $1,300 for middle-income households, about the same as adding or subtracting a mortgage or rent payment in any given month. Income and spending volatility is prevalent across all income quintiles. Moreover, this monthly volatility is double the year-over-year volatility we observe (about 15 percent)—the typical perspective offered by existing annual public surveys.
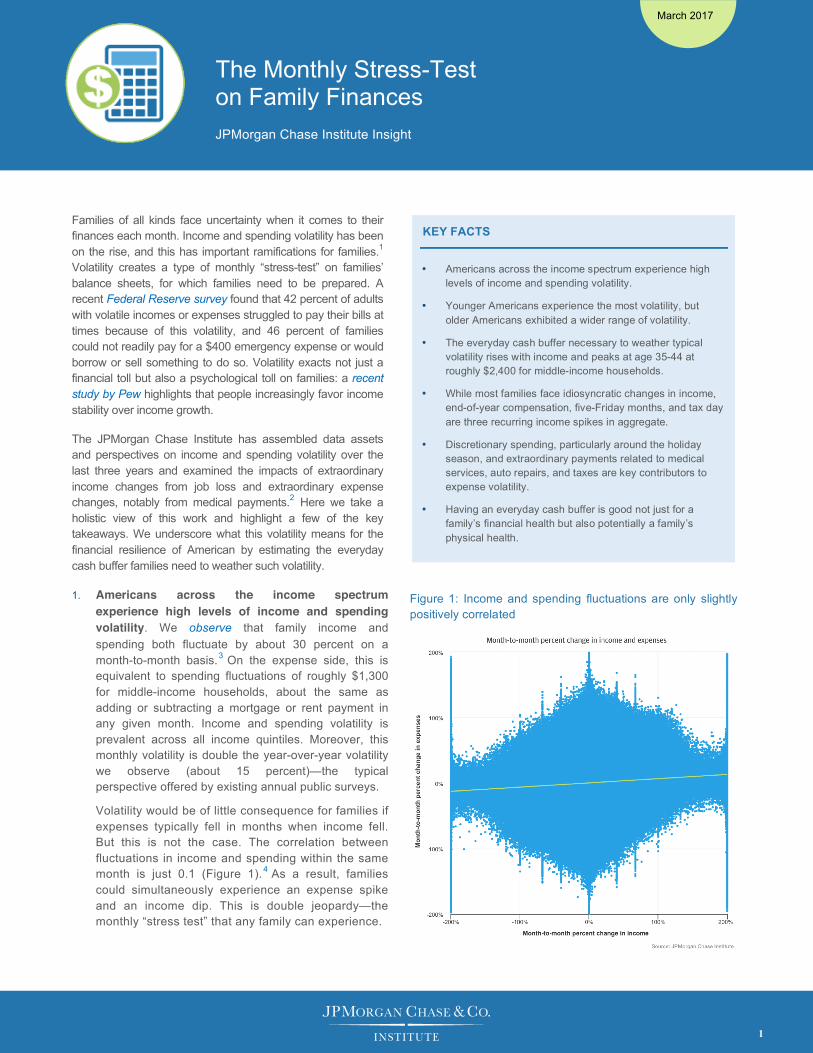
Volatility would be of little consequence for families if expenses typically fell in months when income fell. But this is not the case. The correlation between fluctuations in income and spending within the same month is just 0.1 (Figure 1). 4 As a result, families could simultaneously experience an expense spike and an income dip. This is double jeopardy—the monthly “stress test” that any family can experience.
Figure 1: Income and spending fluctuations are only slightly positively correlated
KEY FACTS
• Americans across the income spectrum experience high levels of income and spending volatility.
• Younger Americans experience the most volatility, but older Americans exhibited a wider range of volatility.
• The everyday cash buffer necessary to weather typical volatility rises with income and peaks at age 35-44 at roughly $2,400 for middle-income households.
• While most families face idiosyncratic changes in income, end-of-year compensation, five-Friday months, and tax day are three recurring income spikes in aggregate.
• Discretionary spending, particularly around the holiday season, and extraordinary payments related to medical services, auto repairs, and taxes are key contributors to expense volatility.
• Having an everyday cash buffer is good not just for a family’s financial health but also potentially a family’s physical health.
JPMorgan Chase Institute The Monthly Stress-Test on Family Finances
2
The risk of this combination—an expense spike hitting at the same time as a drop in income—means that families need not only emergency savings but also a cash buffer in order to manage such fluctuations. In Weathering Volatility we estimated the liquid financial buffer families in each income quintile would need to weather 90 percent of adverse income and spending fluctuations. We found that for median-income households this number was roughly $4,800. According to the Survey of Consumer Finance median-income households had just $3,000 in liquid savings, a shortfall of $1,800 from the necessary liquid financial buffer. The size of this buffer increases in absolute terms for families with higher levels of income and spending, and only families in the top income quintile had sufficient cash reserves to weather 90 percent of adverse income and spending fluctuations.
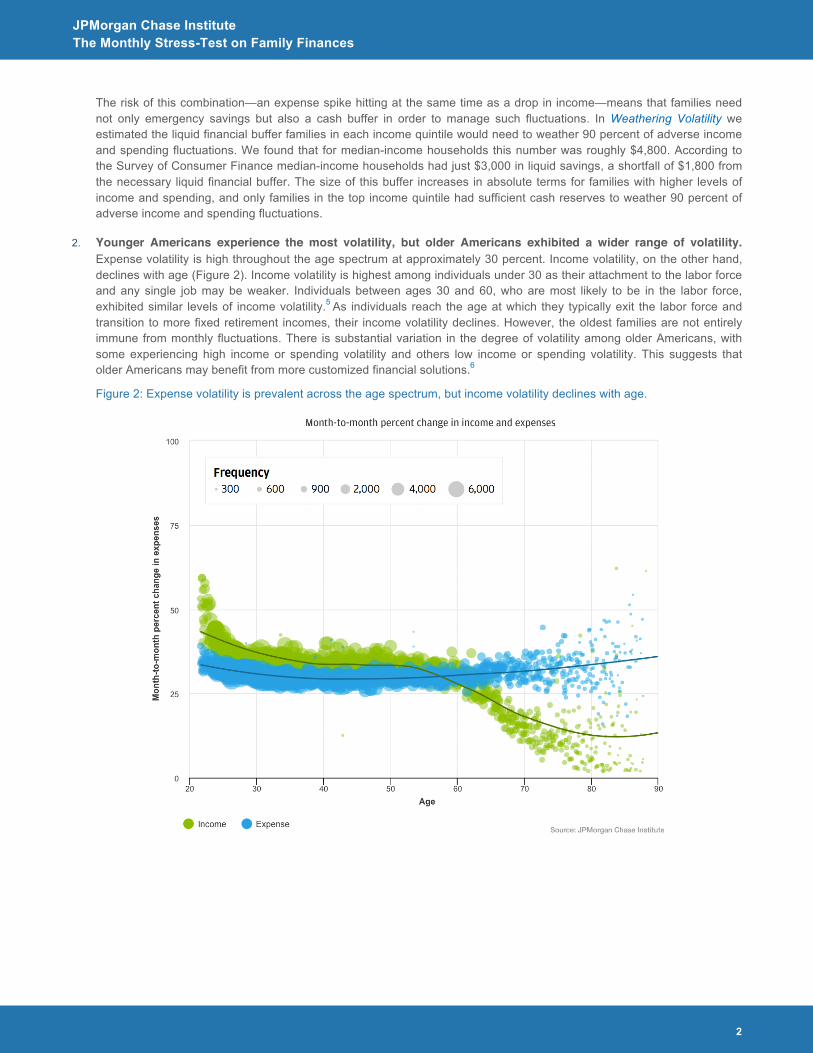
2. Younger Americans experience the most volatility, but older Americans exhibited a wider range of volatility. Expense volatility is high throughout the age spectrum at approximately 30 percent. Income volatility, on the other hand, declines with age (Figure 2). Income volatility is highest among individuals under 30 as their attachment to the labor force and any single job may be weaker. Individuals between ages 30 and 60, who are most likely to be in the labor force, exhibited similar levels of income volatility.5 As individuals reach the age at which they typically exit the labor force and transition to more fixed retirement incomes, their income volatility declines. However, the oldest families are not entirely immune from monthly fluctuations. There is substantial variation in the degree of volatility among older Americans, with some experiencing high income or spending volatility and others low income or spending volatility. This suggests that older Americans may benefit from more customized financial solutions.6
Figure 2: Expense volatility is prevalent across the age spectrum, but income volatility declines with age.
JPMorgan Chase Institute The Monthly Stress-Test on Family Finances
3
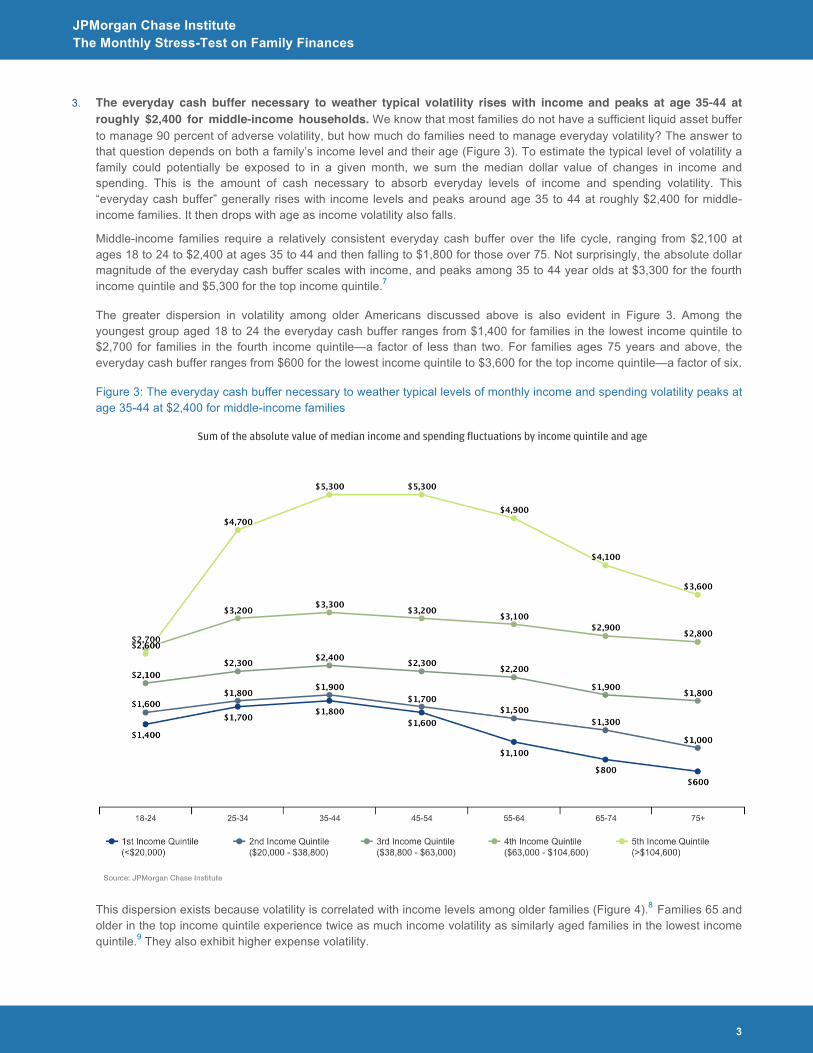
3. The everyday cash buffer necessary to weather typical volatility rises with income and peaks at age 35-44 at roughly $2,400 for middle-income households. We know that most families do not have a sufficient liquid asset buffer to manage 90 percent of adverse volatility, but how much do families need to manage everyday volatility? The answer to that question depends on both a family’s income level and their age (Figure 3). To estimate the typical level of volatility a family could potentially be exposed to in a given month, we sum the median dollar value of changes in income and spending. This is the amount of cash necessary to absorb everyday levels of income and spending volatility. This “everyday cash buffer” generally rises with income levels and peaks around age 35 to 44 at roughly $2,400 for middle-income families. It then drops with age as income volatility also falls.
Middle-income families require a relatively consistent everyday cash buffer over the life cycle, ranging from $2,100 at ages 18 to 24 to $2,400 at ages 35 to 44 and then falling to $1,800 for those over 75. Not surprisingly, the absolute dollar magnitude of the everyday cash buffer scales with income, and peaks among 35 to 44 year olds at $3,300 for the fourth income quintile and $5,300 for the top income quintile.7
The greater dispersion in volatility among older Americans discussed above is also evident in Figure 3. Among the youngest group aged 18 to 24 the everyday cash buffer ranges from $1,400 for families in the lowest income quintile to $2,700 for families in the fourth income quintile—a factor of less than two. For families ages 75 years and above, the everyday cash buffer ranges from $600 for the lowest income quintile to $3,600 for the top income quintile—a factor of six.
Figure 3: The everyday cash buffer necessary to weather typical levels of monthly income and spending volatility peaks at age 35-44 at $2,400 for middle-income families
This dispersion exists because volatility is correlated with income levels among older families (Figure 4).8 Families 65 and older in the top income quintile experience twice as much income volatility as similarly aged families in the lowest income quintile.9 They also exhibit higher expense volatility.
JPMorgan Chase Institute The Monthly Stress-Test on Family Finances
4
4. While most families face idiosyncratic changes in income, end-of-year compensation, five-Friday months, and tax day are three recurring income spikes in aggregate. Labor income represents roughly 70 percent of total income and is the main contributor to income volatility.10 Most of the month-to-month volatility in take-home pay (86 percent) comes from variation in pay within a single job due to fluctuations in paycheck amounts and the number of paychecks received each month.
Job transitions account for the other 14 percent of labor income volatility. Almost four in ten families experience a job transition over the course of a year. One type of job transition, job loss, is relatively common and is a substantial source of adverse income volatility.11 Roughly one in four working adults experience a period of joblessness in a given year. Unemployment insurance (UI) is effective for the short-term unemployed (those unemployed for six months or less) and, within 6 months, mitigates 66 percent of the loss of income and 74 percent of the loss in spending stemming from unemployment. Despite the fact that roughly 90 percent of workers have the types of jobs that make them eligible for UI, just 27 percent of the unemployed in 2015 received unemployment insurance. Unemployment insurance is, therefore, an effective policy tool for those who receive it but does not reach the majority of those who could benefit from it.
Although much of income volatility is idiosyncratic to each family, there are in aggregate three key recurring sources of positive income volatility. First, about 60 percent of families experience a spike in labor income between December and March, which could be related to extended holiday hours as well as end-of-year bonuses. Second, labor income predictably spikes in five-Friday months as workers that are paid weekly or every two weeks on a Friday receive an additional paycheck. Third, tax refunds in April contribute positive income volatility and are typically comparable in size to an entire month’s take-home labor income.12 These relatively common and recurring income spikes are prime moments when families could be encouraged to save, or that could potentially trigger financial management tools to automatically allocate funds to savings for families.
5. Discretionary spending, particularly around the holiday season, and extraordinary payments related to medical services, auto repairs, and taxes are key contributors to expense volatility. Discretionary spending categories, such as retail, travel, and durable purchases fluctuate by 56 percent on a month-to-month basis.13 They are also the first categories that families cut when in financial distress. Families that experience a job loss and receive unemployment insurance quickly cut their spending on discretionary spending categories, such as flights, hotels, restaurant, entertainment, and retail, by about 10 percent.
Not all volatility stems from discretionary spending categories, however. Four in ten families (37 percent) make an extraordinary payment of roughly $1,500 related to medical services, auto repair, or taxes in a given year. Families headed by adults 65 years and older are roughly twice as likely as families under age 25 to have made extraordinary payments for medical services, auto repair, or taxes (44 percent compared to 22 percent). Often these payments are more difficult to predict and absorb.
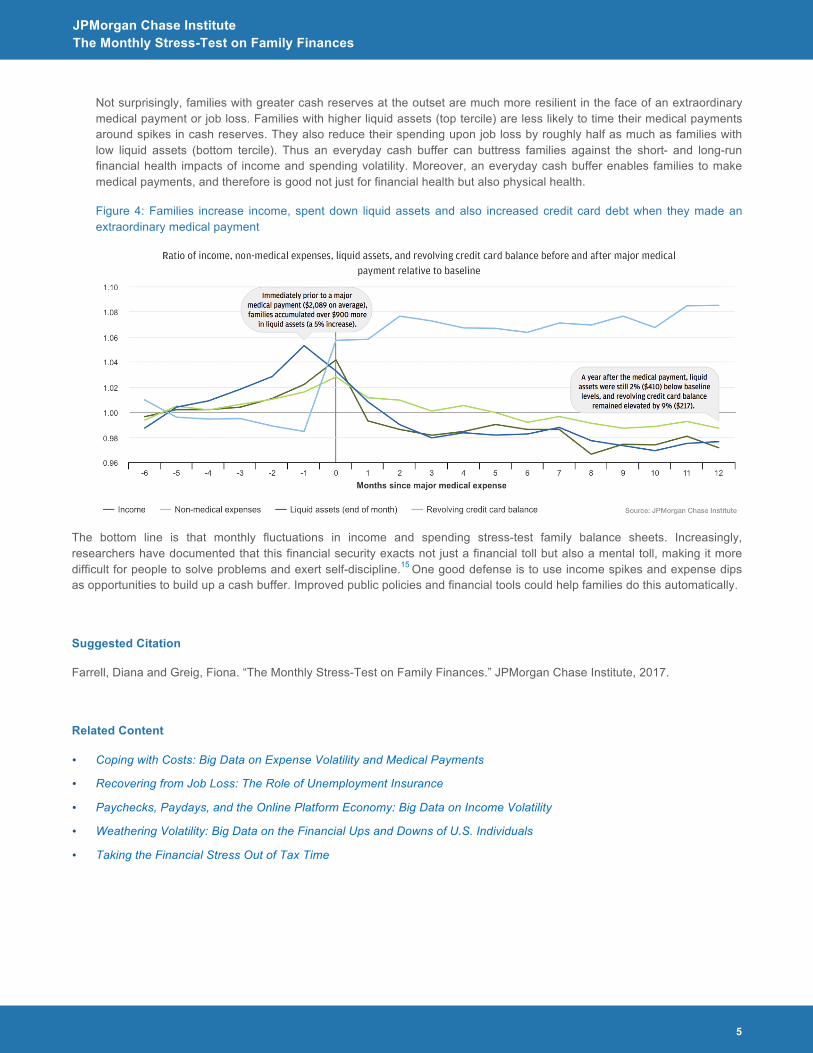
6. Having an everyday cash buffer is good not just for a family’s financial health but also potentially a family’s physical health. Cash reserves are typically a first line of defense when families experience a major income or expense shock.14 As a result, a family’s choice to go to the doctor or pay their medical bill is sensitive to fluctuations in ability to pay. We found that families are more likely to make a medical payment in months when their income or liquid assets spikes (Figure 4). Specifically, medical payments occur most frequently in April when many families receive a tax refund. While medical payments are more common when income spikes, they are less likely when income dips. Families who experience a job loss and subsequently run out of unemployment insurance benefits (i.e. remain jobless for at least 6 months), cut medical payments by 24 percent.
Perhaps more importantly, volatility in the form of extraordinary medical payments or job loss can have lasting destabilizing impacts on a family’s finances. We found that a year after a major medical payment or job loss, families have not fully recovered financially. For many families liquid savings alone are not sufficient to cover a major medical payment: roughly one third of families takes on additional revolving credit card debt to cover part or all of an extraordinary medical payment. A year after the extraordinary medical payment families still have 9 percent more revolving credit card debt and 2 percent lower cash reserves than baseline levels. Similarly, a year after job loss, families’ income and spending levels have still not recovered to baseline levels.
JPMorgan Chase Institute The Monthly Stress-Test on Family Finances
5
Not surprisingly, families with greater cash reserves at the outset are much more resilient in the face of an extraordinary medical payment or job loss. Families with higher liquid assets (top tercile) are less likely to time their medical payments around spikes in cash reserves. They also reduce their spending upon job loss by roughly half as much as families with low liquid assets (bottom tercile). Thus an everyday cash buffer can buttress families against the short- and long-run financial health impacts of income and spending volatility. Moreover, an everyday cash buffer enables families to make medical payments, and therefore is good not just for financial health but also physical health.
Figure 4: Families increase income, spent down liquid assets and also increased credit card debt when they made an extraordinary medical payment
The bottom line is that monthly fluctuations in income and spending stress-test family balance sheets. Increasingly, researchers have documented that this financial security exacts not just a financial toll but also a mental toll, making it more difficult for people to solve problems and exert self-discipline.15 One good defense is to use income spikes and expense dips as opportunities to build up a cash buffer. Improved public policies and financial tools could help families do this automatically.
Suggested Citation
Farrell, Diana and Greig, Fiona. “The Monthly Stress-Test on Family Finances.” JPMorgan Chase Institute, 2017.
Related Content
• Coping with Costs: Big Data on Expense Volatility and Medical Payments
• Recovering from Job Loss: The Role of Unemployment Insurance
• Paychecks, Paydays, and the Online Platform Economy: Big Data on Income Volatility
• Weathering Volatility: Big Data on the Financial Ups and Downs of U.S. Individuals
• Taking the Financial Stress Out of Tax Time
JPMorgan Chase Institute The Monthly Stress-Test on Family Finances
6
1 See our report Coping with Costs: Big Data on Expense Volatility and Medical Payments for a summary of the academic literature on this topic.
2 This brief draws upon new data analyses as well as insights from Weathering Volatility: Big Data on the Financial Ups and Downs of U.S. Individuals; Paychecks, Paydays and the Online Platform Economy: Big Data on Income Volatility; Recovering from Job Loss: The Role of Unemployment Insurance; Coping with Costs: Big Data on Expense Volatility and Medical Payments; and Taking the Financial Stress Out of Tax Time.
3 For the purposes of our research, the unit of analysis is the primary account holder, whom we subsequently refer to as a family. In many cases the family may consist of a single individual.
4 This finding was consistent across two independent samples of 100,000 families in Weathering Volatility and roughly 250,000 families in Coping with Costs.
5 The Bureau of Labor Statistics indicates that labor force participation increases from 55 percent among 16 to 24 year olds to 81 percent for 25 to 54 year olds and then drops to 64 percent for 55 to 64 year olds and 19 percent for those who are 65 and older.
6 See Coping with Costs: Big Data on Expense Volatility and Medical Payments for more detailed discussion of these results and their implications.
7 It is important to note that families are unlikely to remain in the same income quintile for their entire lives. In Weathering Volatility we estimated that 28 percent of families move income quintiles from one year to the next. This transition rate varied by income level and was 22 percent for income quintile 1, 32 percent for income quintile 2, 35 percent for income quintile 3, 33 percent for income quintile 4, and 18 percent for income quintile 5. More specifically, income levels generally rise with age and peak at ages 45 to 54, so families in this age range are more likely to find themselves in the top two income quintiles.
8 Levels of income and spending volatility are broadly similar across the income spectrum and among families in the 35 to 54 year-old range. Within age groups we do see that income volatility negatively correlated with income levels for families under 54 and positively correlated with income levels for families 55 and older.
9 Some income volatility among higher-income older families may stem from distributions from privately managed retirement accounts that are withdrawn annually or periodically throughout the year. Social security income, in contrast, is received on a fixed per-month schedule.
10 For a more in depth discussion of the levels and sources of income volatility, see Paychecks, Paydays and the Online Platform Economy: Big Data on Income Volatility.
11 See Recovering from Job Loss: The Role of Unemployment Insurance for additional insights about the impacts of job loss and unemployment insurance on consumer spending.
12 As shown in Taking the Financial Stress Out of Tax Time tax refunds are larger in magnitude (mean of $2,733) than the change in labor income from gaining or losing a job ($2,451).
13 See Coping with Costs: Big Data on Expense Volatility and Medical Payments for an in depth discussion of the sources of expense volatility.
14 Results pertaining to job loss come from Recovering from Job Loss: The Role of Unemployment Insurance. Results pertaining to medical payments come from Coping with Costs: Big Data on Expense Volatility and Medical Payments.
15 See several studies by Sendhil Mullainathan and Eldar Shafir and others recently summarized in their book: Scarcity: Why Having Too Little Means So Much.
This material is a product of JPMorgan Chase Institute and is provided to you solely for general information purposes. Unless otherwise specifically stated, any views or opinions expressed herein are solely those of the authors listed, and may differ from the views and opinions expressed by J.P. Morgan Securities LLC (JPMS) Research Department or other departments or divisions of JPMorgan Chase & Co. or its affiliates. This material is not a product of the Research Department of JPMS. Information has been obtained from sources believed to be reliable, but JPMorgan Chase & Co. or its affiliates and/or subsidiaries (collectively J.P. Morgan) do not warrant its completeness or accuracy. Opinions and estimates constitute our judgment as of the date of this material and are subject to change without notice. The data relied on for this report are based on past transactions and may not be indicative of future results. The opinion herein should not be construed as an individual recommendation for any particular client and is not intended as recommendations of particular securities, financial instruments, or strategies for a particular client. This material does not constitute a solicitation or offer in any jurisdiction where such a solicitation is unlawful.
©2017 JPMorgan Chase & Co. All rights reserved. This publication or any portion hereof may not be reprinted, sold, or redistributed without the written consent of J.P. Morgan.