Embed Size (px)
Citation preview
60 • monitor • SEP/OCT 2013
For purposes of presenting market share and trends, the leasing company population comprising the Monitor 100 is conclusively an accurate portrayal of the entire U.S. equipment leasing and finance industry.
of the top 100 equipment leasing and finance institu-tions operating in the U.S. (included 1991 data). This list became recognized throughout the industry as the Monitor 100. Remarkably, given the simple set of data points requested, most all major active equipment finance operations welcomed the opportunity to be represented in what has become a prestigious leasing industry roll call. Today, it’s rare for any large lessor to not be included in this listing. No other industry publi-cation offers such a list of company standings by assets or business volume like the Monitor 100.
Statistical RelevanceMany people scan the Monitor 100 list in the same way we may occasionally glance at the Billboard Magazine ranking of current top 40 songs. Most of us look to see where our own company is positioned and then where our favorite competitors are ranked. Regrettably, many then park the list in a filing cabinet. That tragi-cally overlooks the power of the “hidden” information waiting to be unlocked from within the Monitor 100 data. I find this to be a formidable benchmarking tool that I regularly use in my consulting practice with leasing industry clients.
Like any useful tool, statistical data can be very helpful in unlocking where we have been, with some insights on how we got there, if effectively used in knowledgeable hands. As a starting point, this data can be an aid during annual assessments with your outside experts who provide strategic business guidance.
Is the Monitor 100 statistically representative? Yes. The bottom 50 companies only represent 3% of the total assets in the Monitor 100. So expanding this list to include — say — the next 50 companies would not add that much in terms of total lease volume. For purposes of presenting market share and trends, the
W here were you four decades ago? In leasing? In school? In diapers? Or just an apple in your daddy’s eyes? Did you know that 40
years ago the Financial Accounting Standards Board was created? That was five years before FASB-13 provided a clear definition of an off balance sheet lease (which ironically is under serious deliberation for revision again). And, more than ten years would go by before MACRS depreciation became part of the U.S. tax code.
In reading this issue of the Monitor, you join me in witnessing an unprecedented industry milestone that began in 1974. In that year, an executive recruiting firm made the decision to publish an independent trade magazine to serve the equipment leasing industry, giving birth to what we recognize today as the Monitor. Now almost two generations later with more than 300 issues, and some 2.5 million total copies distributed, this 40-year-old industry publication retains a stalwart position in both print and electronic media within the equipment finance community.
Fast forward 18 years from that first issue. For an industry that has its contemporary roots back to the 1950s, even at the end of the 1980s there was no published listing available that showcased the top 100 firms active in equipment leasing. In May 1992, the Monitor published the first ever national-rank listing
The Monitor 100 — A Retrospective Review…What a Deeper Data Dive Can Reveal About Your Company and Your CompetitionBY DAVID WIENER
The Alta Group’s David Wiener pays tribute to the Monitor by presenting a retrospective of the Monitor 100 and describes the power of its data in providing insights into where the ranked companies have been and how they got there.
DAVID WIENER Managing Director, The Alta Group
MTR-SEPOCT13_Anniversary-Features.indd 60 10/7/13 1:40 PM
SEP/OCT 2013 • monitor • 61
leasing company population comprising the Monitor 100 is conclusively an accurate portrayal of the entire U.S. equipment leasing and finance industry.
It also reveals that there is a natural selection within the industry. Of the original companies listed in the inaugural Monitor 100, only 21 remain on the list today, 22 editions later.
In 1991 these 21 companies comprised 46% of the Monitor 100 assets, or $62 billion of the total $135 billion. In 2012 these same 21 companies represent 52%, or $284 billion of the $548 billion in net earning assets. Overall, the Monitor 100 showed a compounded net asset growth rate of 7.3%, and these 21 companies combined kept pace with a compounded growth rate of 7.5% for more than 22 years. Industry longevity has a demonstrated strong correlation to industry scalability. While it is often said that evolution favors the survival of the fittest, in reality it favors survival of the most adapt-able. Otherwise, at the end of our morning commute, we
© 2013 The Alta Group, LLC
$135
$612 $612
$548
$-
$100
$200
$300
$400
$500
$600
$700
'91 '92 '93 '94 '95 '96 '97 '98 '99 '00 '01 '02 '03 '04 '05 '06 '07 '08 '09 '10 '11 '12
Total Net Earning Assets Outstanding
Total Net Earning Assets Outstanding
Chart 1: Monitor 100 Total Assets ($ billion) CHART 1: MONITOR 100 TOTAL ASSETS ($B)
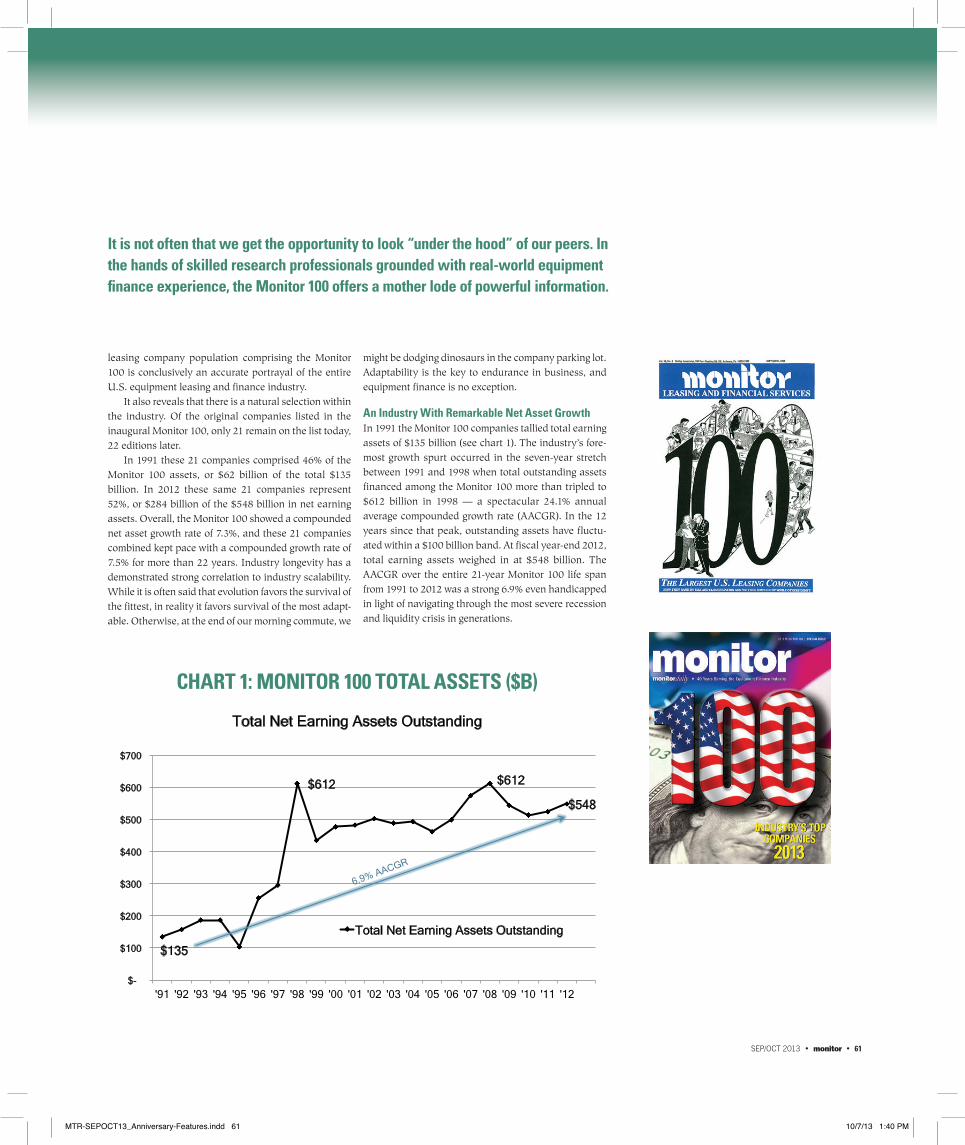
It is not often that we get the opportunity to look “under the hood” of our peers. In the hands of skilled research professionals grounded with real-world equipment finance experience, the Monitor 100 offers a mother lode of powerful information.
might be dodging dinosaurs in the company parking lot. Adaptability is the key to endurance in business, and equipment finance is no exception.
An Industry With Remarkable Net Asset GrowthIn 1991 the Monitor 100 companies tallied total earning assets of $135 billion (see chart 1). The industry’s fore-most growth spurt occurred in the seven-year stretch between 1991 and 1998 when total outstanding assets financed among the Monitor 100 more than tripled to $612 billion in 1998 — a spectacular 24.1% annual average compounded growth rate (AACGR). In the 12 years since that peak, outstanding assets have fluctu-ated within a $100 billion band. At fiscal year-end 2012, total earning assets weighed in at $548 billion. The AACGR over the entire 21-year Monitor 100 life span from 1991 to 2012 was a strong 6.9% even handicapped in light of navigating through the most severe recession and liquidity crisis in generations.
MTR-SEPOCT13_Anniversary-Features.indd 61 10/7/13 1:40 PM

62 • monitor • SEP/OCT 2013
Marked Change in Share of Net Earning Assets by Lessor Type While total outstandings for all lessor company types grew over the past 20 years, expansion was not evenly distributed. U.S. banks and manufacturer captives have become the frontrunners in industry growth. At year-end 2012, U.S. banks had a total of $182 billion of total lease assets outstanding, for an AACGR of 9.7% from just $26 billion in 1991. Captives had a 10.6% AACGR from $18 billion to $154 billion over that same period (see chart 2).
The share of total leased assets for U.S. banks stood at 33% in 2012, up from 19% in 1991. Captives’ market share stood at 28%, double their 14% share in 1991 (see chart 3). Independents’ total earning asset share fell from 8% to 5%, and finance subsidiaries of U.S. industrial companies’ market share went from 47% to 23%. While the total number of independents represented in the Monitor 100 started at 24, dipped into the teens a decade ago, and is now at 28, the number of U.S. industrial company finance subsidiaries in the listing fell from 17 companies in 1991 to just one in 2012. Ranked first in total assets for each of the past 23 annual Monitor 100 listings, that lone survivor is none other than GE Capital (see chart 4).
Why the general exodus of industrials from leasing? While the scope of this statistical snapshot is not intended to research root causes, I have conjectured why this mass departure occurred. Lessor equip-ment financing generally involves a higher level of borrowings than is customary for a manufacturer resulting in leverage ratios higher than peer companies without equipment financing activities. The advent of the alternative minimum tax caused the tax shelter advantages enjoyed in the early to mid-1980s to dissipate, which meant that leasing plat-forms lost their attractiveness to many industrial companies. Publicly traded multi-line conglomerates generally went out of favor with stock analysts. Borrowing capacity was increasingly reserved for other core businesses. A few U.S. industrials retreated to providing financing exclusively for products they manufactured and were re-characterized under the captive category. Most exited the business.
© 2013 The Alta Group, LLC
Chart 3: Monitor 100 Total Assets by Lessor Type
24.5%
29.3% 11.0% 2.7%
2.5%
30.0%
2001
33.1%
28.1% 4.7%
3.8%
7.1%
23.2%
2012
2012 Total Assets O/S $548 B2001 Total Assets O/S $482B
Total Earning Assets Outstanding have grown – with Bank and Captive Share of assets increasing
18.7%
13.7%
7.5% 12.6%
47.4%
1991
1991 Total Assets O/S $135 B
Banks US
Independents NEC
Captives Foreign Companies
US Industrial Subsidiaries
CHART 3: MONITOR 100 TOTAL ASSETS BY LESSOR TYPE
© 2013 The Alta Group, LLC
Chart 4: Monitor 100 Census by Lessor Type
40
23
18
10
2 7
2001
46
18
28
7 3
1 2012
36
9 24
14
17
1991
Banks US
Independents NEC
Captives Foreign Companies
US Industrial Subsidiaries
CHART 4: MONITOR 100 CENSUS BY LESSOR TYPE
© 2013 The Alta Group, LLC
$182
$154
$26 $21
$39
$127
$-
$50
$100
$150
$200
'91 '92 '93 '94 '95 '96 '97 '98 '99 '00 '01 '02 '03 '04 '05 '06 '07 '08 '09 '10 '11 '12
Banks, US Captives Independents Foreign NEC US Industrial
Chart 2: Total Assets ($ billion): by Lessor Type CHART 2: TOTAL ASSETS ($B): BY LESSOR TYPE
MTR-SEPOCT13_Anniversary-Features.indd 62 10/7/13 1:40 PM
SEP/OCT 2013 • monitor • 63
While average assets per independent lessor doubled over the past 22 years, average lease assets outstanding increased four-fold for U.S. bank lessors and captive lessors. Why this marked shift? It is a fact that the leasing industry was founded and developed by the nimble community of independent lessors. By law, banks were precluded by the Comptroller of the Currency from engaging in lease financing until the early 1960s — and from participating as a lessor in operating leases until the late 1980s. Banks’ competitive funding advantage accounts for much of this sea of change. Independents created the vendor finance model, though their success led to a number of manufacturers electing to launch their own captives to gain channel control, which also siphoned lease volume from independents.
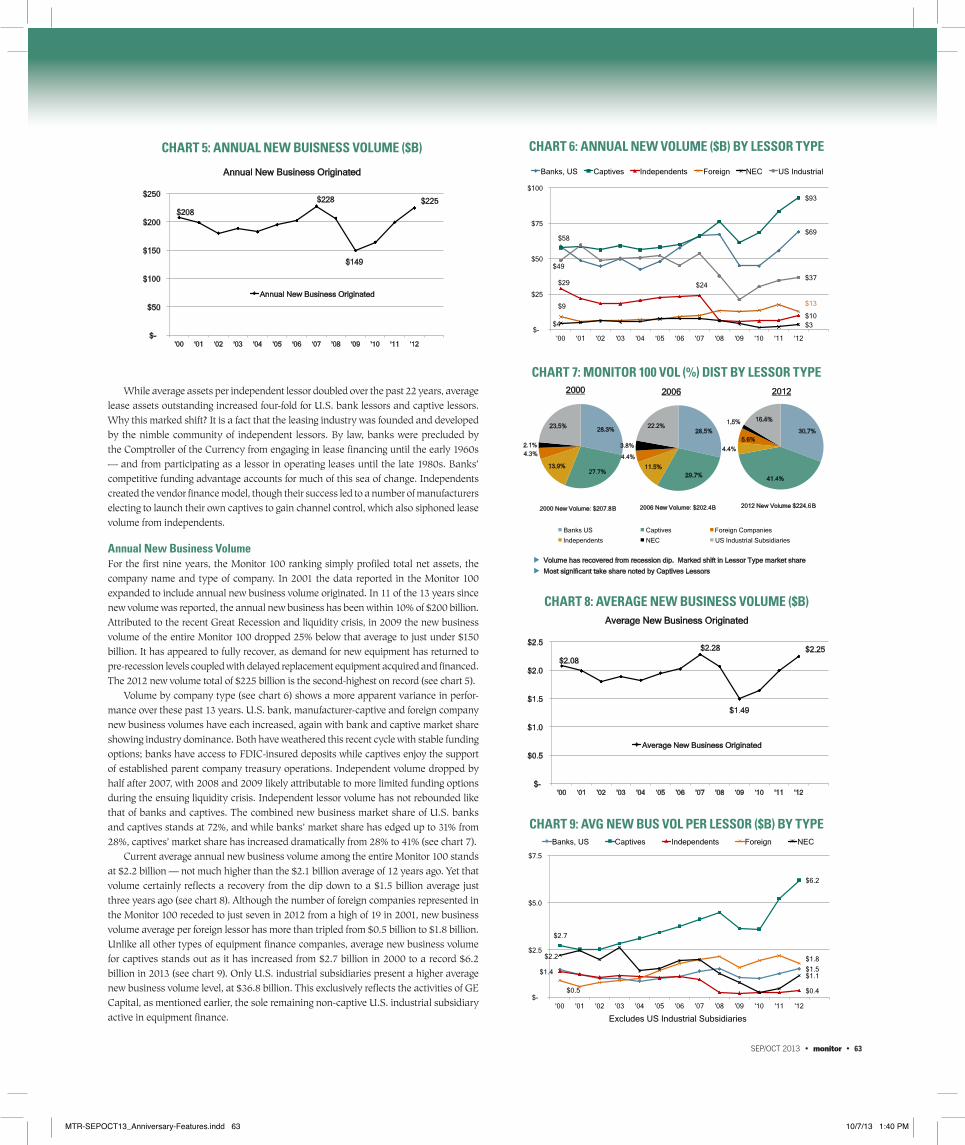
Annual New Business Volume For the first nine years, the Monitor 100 ranking simply profiled total net assets, the company name and type of company. In 2001 the data reported in the Monitor 100 expanded to include annual new business volume originated. In 11 of the 13 years since new volume was reported, the annual new business has been within 10% of $200 billion. Attributed to the recent Great Recession and liquidity crisis, in 2009 the new business volume of the entire Monitor 100 dropped 25% below that average to just under $150 billion. It has appeared to fully recover, as demand for new equipment has returned to pre-recession levels coupled with delayed replacement equipment acquired and financed. The 2012 new volume total of $225 billion is the second-highest on record (see chart 5).
Volume by company type (see chart 6) shows a more apparent variance in perfor-mance over these past 13 years. U.S. bank, manufacturer-captive and foreign company new business volumes have each increased, again with bank and captive market share showing industry dominance. Both have weathered this recent cycle with stable funding options; banks have access to FDIC-insured deposits while captives enjoy the support of established parent company treasury operations. Independent volume dropped by half after 2007, with 2008 and 2009 likely attributable to more limited funding options during the ensuing liquidity crisis. Independent lessor volume has not rebounded like that of banks and captives. The combined new business market share of U.S. banks and captives stands at 72%, and while banks’ market share has edged up to 31% from 28%, captives’ market share has increased dramatically from 28% to 41% (see chart 7).
Current average annual new business volume among the entire Monitor 100 stands at $2.2 billion — not much higher than the $2.1 billion average of 12 years ago. Yet that volume certainly reflects a recovery from the dip down to a $1.5 billion average just three years ago (see chart 8). Although the number of foreign companies represented in the Monitor 100 receded to just seven in 2012 from a high of 19 in 2001, new business volume average per foreign lessor has more than tripled from $0.5 billion to $1.8 billion. Unlike all other types of equipment finance companies, average new business volume for captives stands out as it has increased from $2.7 billion in 2000 to a record $6.2 billion in 2013 (see chart 9). Only U.S. industrial subsidiaries present a higher average new business volume level, at $36.8 billion. This exclusively reflects the activities of GE Capital, as mentioned earlier, the sole remaining non-captive U.S. industrial subsidiary active in equipment finance.
© 2013 The Alta Group, LLC
Chart 8: Monitor 100 Volume Distribution by Lessor Type
28.3%
27.7% 13.9%
4.3%
2.1%
23.5%
2000
30.7%
41.4%
4.4%
5.6%
1.5% 16.4%
2012
2012 New Volume $224.6 B2000 New Volume: $207.8 B
Volume has recovered from recession dip. Marked shift in Lessor Type market share
Most significant take share noted by Captives Lessors
28.5%
29.7% 11.5%
4.4%
3.8%
22.2%
2006
2006 New Volume: $202.4 B
Banks US
Independents NEC
Captives Foreign Companies
US Industrial Subsidiaries
CHART 7: MONITOR 100 VOL (%) DIST BY LESSOR TYPE
© 2013 The Alta Group, LLC
$2.08
$2.28
$1.49
$2.25
$-
$0.5
$1.0
$1.5
$2.0
$2.5
'00 '01 '02 '03 '04 '05 '06 '07 '08 '09 '10 '11 '12
Average New Business Originated
Average New Business Originated
Chart 9: Average New Business Volume ($ billion) CHART 8: AVERAGE NEW BUSINESS VOLUME ($B)
© 2013 The Alta Group, LLC
$1.5
$2.7
$6.2
$1.4
$0.4 $0.5
$1.8 $2.2
$1.1
$-
$2.5
$5.0
$7.5
'00 '01 '02 '03 '04 '05 '06 '07 '08 '09 '10 '11 '12
Banks, US Captives Independents Foreign NEC
Chart 10: Avg. New Volume per Lessor ($ billion): by Type
Excludes US Industrial Subsidiaries
CHART 9: AVG NEW BUS VOL PER LESSOR ($B) BY TYPE
© 2013 The Alta Group, LLC
$208
$228
$149
$225
$-
$50
$100
$150
$200
$250
'00 '01 '02 '03 '04 '05 '06 '07 '08 '09 '10 '11 '12
Annual New Business Originated
Annual New Business Originated
Chart 6: Annual New Business Volume ($ billion) CHART 5: ANNUAL NEW BUISNESS VOLUME ($B)
© 2013 The Alta Group, LLC
$69 $58
$93
$29 $24
$10 $9 $13
$4 $3
$49
$37
$-
$25
$50
$75
$100
'00 '01 '02 '03 '04 '05 '06 '07 '08 '09 '10 '11 '12
Banks, US Captives Independents Foreign NEC US Industrial
Chart 7: Annual New Volume ($ billion): by Lessor Type CHART 6: ANNUAL NEW VOLUME ($B) BY LESSOR TYPE
MTR-SEPOCT13_Anniversary-Features.indd 63 10/7/13 1:40 PM

64 • monitor • SEP/OCT 2013
leasing and finance firms. By FYE 2012, this number had been cut by 10,000 to about 26,000 (see chart 10). What does this imply?
Total captive, U.S. bank and foreign lessors’ staffing levels have been trailing down slightly over the past 12 years, likely reflecting gained efficiencies. There were six U.S. industrial subsidiaries who exited equipment finance entirely, and at one point they had total staffing summing to over 7,500. Total employees in the independent lessor category fell from 10,000 to 5,000 (see chart 11).
Trends in Equipment Finance StaffingThe Monitor 100 began including staffing per company in the 2001 Monitor 100 for the fiscal year ending (FYE) in 2000. One outlier was evident as the staffing level of several full-service vehicle/fleet lessors reported signifi-cantly higher staffing levels (likely including mainte-nance, truck operators and other functions unique to their business operation). Another major lessor did not report staffing statistics each year, therefore, I have set them aside in this portion of the analysis. For FYE 2000, about 36,000 employees were active within equipment
© 2013 The Alta Group, LLC
36,572
41,831
25,890
0
15,000
30,000
45,000
60,000
'00 '01 '02 '03 '04 '05 '06 '07 '08 '09 '10 '11 '12
Staff Census (excluding Outliers)
Staff Census (excluding Outliers)
Chart 11: Total Staffing of Monitor 100 Participants CHART 10: TOTAL STAFFING OF MON100 PARTICIPANTS
© 2013 The Alta Group, LLC
9,897 8,783
5,116
2,513 1,771
323 0
5,000
10,000
15,000
20,000
'00 '01 '02 '03 '04 '05 '06 '07 '08 '09 '10 '11 '12
Banks, US Captives Independents Foreign NEC US Industrial
Chart 12: Staffing Census - by Lessor Type CHART 11: STAFFING CENSUS – BY LESSOR TYPE
The AACGR over the entire 21-year Monitor 100 life span
from 1991 to 2012 was a strong 6.9% even handicapped in light of navigating through the most severe recession and liquidity
crisis in generations.
MTR-SEPOCT13_Anniversary-Features.indd 64 10/7/13 1:40 PM

SEP/OCT 2013 • monitor • 65
It is not often that we get the opportunity to look “under the hood” of our peers. In the hands of skilled research professionals grounded with real-world equip-ment finance experience, the Monitor 100 offers a mother lode of powerful information. We have just scratched the surface in this commentary. Some self-assessments and comparisons provide a good starting point to deter-mine where we can improve. However, like an annual physical and an occasional stress test, a scheduled checkup with an outside expert should be part of the strategic plan of every healthy equipment finance firm that expects to remain competitive over the next ten years and be honored among the Monitor 100 when the Monitor celebrates its golden anniversary. m
DAVID WIENER, a managing director with The Alta Group, has been respected in the disciplines of sales, credit and capital markets/syndications within the equipment finance industry for more than 35 years. He is regarded as a leading authority on equipment finance data and demographics analysis.
This drop in staff census yielded a significant increase of more than 50% in average assets outstanding per staff member — jumping from $9 million to $15 million between 2000 and 2012 (see chart 12). Per-staff-member average assets also improved for U.S. banks, captives and foreign companies. Only independent lessors showed a drop in average assets per employee (see chart 13).
As expected, a similar trend is evident as average annual new business volume per staff member rose from $4 million to more than $6 million (see chart 14). Impressive efficiency gains are seen in annual new volume per employee in bank, captive and foreign lessor categories, while independent lessors saw a drop over this same time frame (see chart 15).
Scale in both outstanding portfolio and new business origination favors larger bank, captive and foreign lessors in these categories of per-staff statistics. This macro view begs a closer look at your own micro view. How do you compare with your peers? Where your company may fit in a stack ranking by lessor type or origination channel can provide you either a reassuring — or a sobering — report card.
© 2013 The Alta Group, LLC
$4.0
$6.5
$0
$2
$4
$6
$8
$10
'00 '01 '02 '03 '04 '05 '06 '07 '08 '09 '10 '11 '12
Average New Business Originated Per Staff Member
Average New Business Originated Per Staff Member
Chart 15: Avg New Business Vol per Staff Member ($ MM) CHART 14: AVG NEW BUS VOL PER STAFF MEMBER ($MM)
© 2013 The Alta Group, LLC
$5.5 $7.0
$5.1
$8.5
$2.7 $1.6
$3.6
$7.1
$0
$3
$5
$8
$10
'00 '01 '02 '03 '04 '05 '06 '07 '08 '09 '10 '11 '12
Banks, US Captives Independents Foreign
Chart 16: Avg New Volume / Employee ($ million) CHART 15: AVG NEW VOLUME PER EMPLOYEE ($MM)
© 2013 The Alta Group, LLC
$9.1
$14.9
$0
$5
$10
$15
$20
'00 '01 '02 '03 '04 '05 '06 '07 '08 '09 '10 '11 '12
Average Assets Outstanding Per Staff Member
Average Assets Outstanding Per Staff Member
Chart 13: Average Assets O/S per Staff Member ($ million) CHART 12: AVG ASSETS O/S PER STAFF MEMBER ($MM)
© 2013 The Alta Group, LLC
$12.9
$18.4
$9.9
$13.9
$6.6
$4.4
$9.2
$11.6
$0
$5
$10
$15
$20
'00 '01 '02 '03 '04 '05 '06 '07 '08 '09 '10 '11 '12
Banks, US Captives Independents Foreign
Chart 14: Avg Assets O/S per Staff Member ($ million) CHART 13: AVG ASSETS O/S PER STAFF MEMBER ($MM)
MTR-SEPOCT13_Anniversary-Features.indd 65 10/7/13 1:40 PM