Embed Size (px)
Citation preview

https://themoneycharity.org.uk
The Money
Statistics
September
2021

Welcome to the September 2021 edition of The Money Statistics, The Money Charity’s completemonthly round-up of statistics about how we use money in the UK.
If you have any questions, comments, or want any information about the source of these statistics,please email us at [email protected]. Throughout this report, statistics that are writtenin colour have been calculated by The Money Charity. All the other statistics come from externalsources such as Bank of England, the ONS and UK Finance and are written in black. All statistics aretaken from the latest available at the time of writing.
You may use any of the statistics here, as long as:o You don’t make any commercial or financial gain from their use;o You clearly acknowledge The Money Charity as the providers of the information and
point your audience towards signing up themselves for the monthly report; ando You do not make substantive adjustments to the presentation of the statistics, such as
amending the statistic phrasing, or for example, repurposing the statistics into a formatthey are not appropriate for, such as an editorial/’opinion piece’ from the charity.
If you’d like this report emailed to you every month as soon as it’s published, please sign up here. Ifyou would be interested in sponsoring the production of The Money Statistics, we would be veryhappy to hear from you. Please contact us through [email protected]
Section Page Number
1. Striking Numbers – This Month’s Highlights1. Striking Numbers – Every Day in the UK and from Coronavirus
34 + 4.1
2. Personal Debt in the UK 5
3. Mortgages, Rent and Housing 9
4. Spending and Loans 14
5. Savings and Pensions 16
6. Financial Inclusion 17
7. Young People 18
8. The Bigger Picture 19
https://themoneycharity.org.uk2
We update these statistics every month with the latest data.Check our website to make sure you’re reading the most recent edition.

https://themoneycharity.org.uk
1.3%Increase in private rental prices
in the year to August 2021
£2,030Average credit card debt per
household in July 2021
7.7%Increase in average first-time
buyer house price in the year to July 2021
£3,734Total unsecured debt per
UK adult in July 2021
3
1. Striking NumbersThis Month’s Highlights
9 yearsTime to save for a first-time buyer house deposit, saving at the average rate out of
average UK income (at Jan to March 2021rate of household saving)
-8.7%Change in outstanding credit card
balances in year to July 2021
406,000Number of 18-24 year-olds
unemployed in the three months to July 2021
Average total debt perUK household in July 2021
£62,670

https://themoneycharity.org.uk
• The population of the UK grew by an estimated 777 people a day between 2019 and 2020.
• On average, a UK household spends £4.33 a day on water, electricity and gas.
• 305 people a day were declared insolvent or bankrupt in England and Wales in June to August 2021. This was equivalent to one person every 4 minutes and 43 seconds.
• In Northern Ireland in August 2021, there were 4.8 insolvencies per day. In Scotland in the three months to June 2021 there were 20.7 insolvencies per day.
• Citizens Advice Bureaux in England and Wales dealt with 1,873 debt issues every day in the year to August 2021.
• 2.3 properties were repossessed every day in April to June 2021 in the UK, or one every 10 hours and 24 minutes.
• The number of UK mortgages with arrears of over 2.5% of the remaining balance rose by 4 a day in the year to June 2021.
• The number of people unemployed in the UK grew by 222 per day in the twelve months to July 2021.
• 1,022 people a day reported they had become redundant in May to July 2021.
• Net lending to individuals and housing associations in the UK fell by £41.7 million a day in July 2021.
• Government debt increased by £466 million a day in the year to August 2021.
• Borrowers paid £122 million a day in interest in July 2021.
• It costs an average of £23.25 per day for a couple to raise a child from birth to the age of 18.
• For a lone parent family, the cost of raising a child comes to £28.22 per day.
• 27.5 mortgage possession claims and 3.0 mortgage possession orders were made every day in England and Wales in April to June 2021.
• 77 landlord possession claims and 49.5 landlord possession orders were made every day.
4
1. Striking NumbersEvery Day in the UK

https://themoneycharity.org.uk
The decision by the Chancellor not to apply the wage element of the pension triple lock in2022 highlights the unusual way pay rates have changed during the pandemic.
The headline annual growth rate to July 2021 was 8.3% for total pay and 6.8% for regular pay (seepage 21). However, both numbers have been boosted by measuring from when pay droppedduring lockdown at the beginning of the pandemic. According to ONS, there were also changes inthe composition of measured wages, as more low-paid workers than high-paid workers droppedout of the workforce for a period of time. The chart below shows the movement of regular and totalpay since January 2017:
Taking account of the 2020 pay drop and composition effects, ONS calculated the “true” rate ofannual pay growth to May 2021 to be between 3.2% and 4.4%. One way of estimating the true rateof pay growth is to take the annualised rate of change from before the pandemic to now, or theannualised rate of change since late 2020. “Annualised” means the equivalent rate for a 12 monthperiod. This shows that the true rate of pay growth was around half the headline rate:
Annualised % Change in Pay to July 2021
1. Striking NumbersArising from Coronavirus
pandemic
4.1
400
450
500
550
600
Jan
17
Ap
r 17
Jul 1
7
Oct
17
Jan
18
Ap
r 18
Jul 1
8
Oct
18
Jan
19
Ap
r 19
Jul 1
9
Oct
19
Jan
20
Ap
r 20
Jul 2
0
Oct
20
Jan
21
Ap
r 21
Jul 2
1
Weekly Pay £
Total pay
Regular pay
Total Pay Regular Pay
Feb 2020 to July 2021 4.1% 4.2%
October 2020 to July 2021 3.5% 3.6%
https://themoneycharity.org.uk
2. Personal Debt in the UK
Total UK Personal Debt
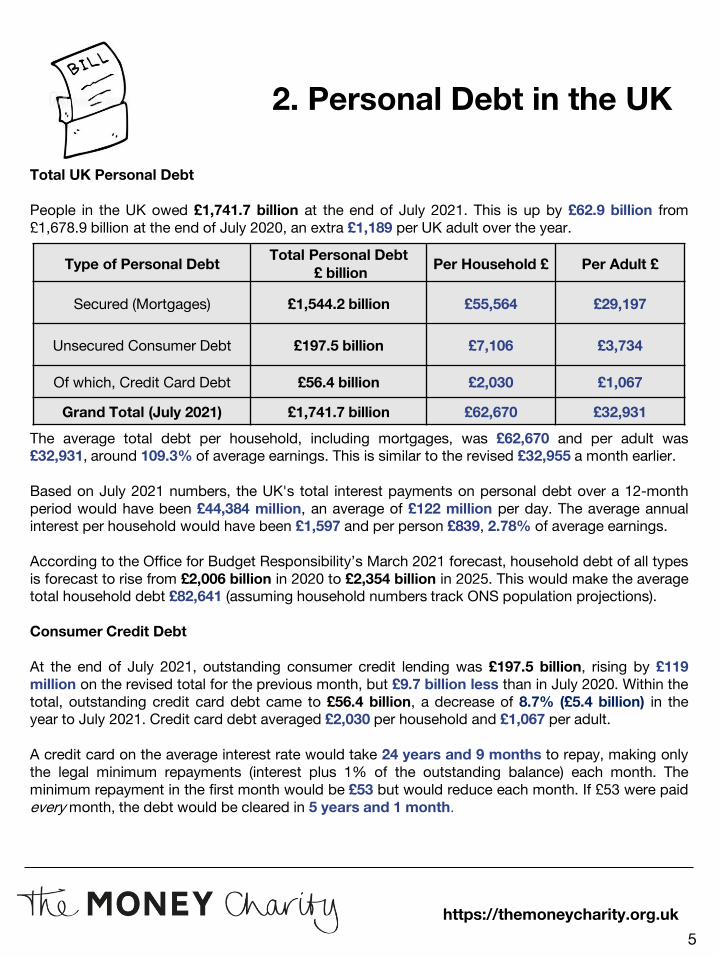
People in the UK owed £1,741.7 billion at the end of July 2021. This is up by £62.9 billion from£1,678.9 billion at the end of July 2020, an extra £1,189 per UK adult over the year.
The average total debt per household, including mortgages, was £62,670 and per adult was£32,931, around 109.3% of average earnings. This is similar to the revised £32,955 a month earlier.
Based on July 2021 numbers, the UK's total interest payments on personal debt over a 12-monthperiod would have been £44,384 million, an average of £122 million per day. The average annualinterest per household would have been £1,597 and per person £839, 2.78% of average earnings.
According to the Office for Budget Responsibility’s March 2021 forecast, household debt of all typesis forecast to rise from £2,006 billion in 2020 to £2,354 billion in 2025. This would make the averagetotal household debt £82,641 (assuming household numbers track ONS population projections).
Consumer Credit Debt
At the end of July 2021, outstanding consumer credit lending was £197.5 billion, rising by £119million on the revised total for the previous month, but £9.7 billion less than in July 2020. Within thetotal, outstanding credit card debt came to £56.4 billion, a decrease of 8.7% (£5.4 billion) in theyear to July 2021. Credit card debt averaged £2,030 per household and £1,067 per adult.
A credit card on the average interest rate would take 24 years and 9 months to repay, making onlythe legal minimum repayments (interest plus 1% of the outstanding balance) each month. Theminimum repayment in the first month would be £53 but would reduce each month. If £53 were paidevery month, the debt would be cleared in 5 years and 1 month.
5
Type of Personal DebtTotal Personal Debt
£ billionPer Household £ Per Adult £
Secured (Mortgages) £1,544.2 billion £55,564 £29,197
Unsecured Consumer Debt £197.5 billion £7,106 £3,734
Of which, Credit Card Debt £56.4 billion £2,030 £1,067
Grand Total (July 2021) £1,741.7 billion £62,670 £32,931

https://themoneycharity.org.uk
Net Lending and Write-Offs
Total net lending to individuals and housing associations by UK banks and building societies fellby £1.3 billion in July 2021 or £41.7 million a day over revised figures for June 2021.
• Net mortgage lending fell by £1.37 billion in the month, while net consumer credit lendingincreased by £0.12 billion.
• In Q2 2021 lenders wrote off £958 million (of which £366 million was credit card debt,amounting to a daily write-off of £4.0 million).
Bank of England Data to July 2021
6
2. Personal Debt in the UK
(The last three columns in the chart are Dec 19, Dec 20 and July 21)
0
200
400
600
800
1000
1200
1400
1600
1800
2000
Dec 94 Dec 97 Dec 00 Dec 03 Dec 06 Dec 09 Dec 12 Dec 15 Dec 18 Jul 21
Overa
ll D
ebt
(£bn)
Total UK Personal Debt (£bn)
Secured Debt Other Consumer Credit Debt Credit Card Debt

https://themoneycharity.org.uk
Advice on Problem Debts
Citizens Advice Bureaux across England and Wales answered 345,235 enquiries in August 2021,11.3% up from August 2020.
Debt was the second largest advice category in August 2021 with 58,438 issues, behind Benefitsand Tax Credits (71,701). Debt calls were 39.2% up compared with August 2020, while calls aboutBenefits and Tax credits were up by 17.1%. Debt represented 15.9% of all issues dealt with in theyear to August 2021. The top three debt categories in August 2021 were fuel debts, Council Taxarrears and credit, store and charge cards. In the year to August 2021, Citizens Advice Bureaux inEngland and Wales dealt with 1,873 debt issues every day.
In Scotland in August 2021, Citizens Advice Scotland gave 84,623 pieces of advice, with debtadvice being 12% of the total, up from 8% in April to June 2020, when numbers were reduced byforbearance measures during the first Covid lockdown. Debt advice in August 2021 was thesecond largest category after benefits.
In Northern Ireland in August 2021, Advice NI's Debt Action service dealt with 298 cases involvingdebt issues, covering £1.8 million of debt. The top three debts were credit cards, personal loansand mortgage shortfalls.
In its July 2021 report, StepChange Debt Charity reports that 13,000 new clients received full debtadvice in June 2021. StepChange reports that the advice given in June reflects the difficult situationmany clients have been facing during the pandemic, with 34% of new clients in receipt of UniversalCredit and 31% having a negative budget at the time of seeking advice. In June, there was anincrease in the numbers of renters and clients with children seeking advice.
7
2. Personal Debt in the UK

https://themoneycharity.org.uk
8
Individual Insolvencies
There were 28,050 individual insolvencies in England and Wales in June to August 2021, anincrease of 27.5% from 21,998 for the same period in 2020. This was equivalent to 305 people aday or one person every 4 minutes and 43 seconds.
Every day on average in England and Wales, 22 people were made bankrupt, 54 Debt Relief Orderswere granted, and 229 Individual Voluntary Arrangements (IVAs) were entered into.
In the 12 months to August 2021, 110,927 individuals, 1 in 424 (0.24%) of the adult population ofEngland and Wales became insolvent.
In Northern Ireland there were 148 individual insolvencies in August 2021, a rate of 4.8 per day. Thiscomprised 127 Individual Voluntary Arrangements, 15 Debt Relief Orders and 6 bankruptcies.Individual insolvencies for the three months to August 2021 were down by 16.0% on the samethree months the previous year, when the Courts and Insolvency Service offices in Northern Irelandreopened after the April 2020 closure due to Covid-19.
In Scotland there were 1,884 personal insolvencies in April to June 2021 (latest available data), arate of 20.7 per day, comprising 586 bankruptcies and 1,298 protected trust deeds. Personalinsolvencies for the three months to June 2021 were 9.6% lower than the same period theprevious year.
County Court Judgements for Debt
2,067 Consumer County Court Judgements (CCJs) were issued every day in England and Wales inApril to June 2021, a 267% increase on the same period in 2020, when the numbers weredepressed by Covid forbearance measures. The average value was £1,585, according to RegistryTrust Ltd.
In Northern Ireland, there were 8 consumer debt judgements every day in April to June 2021, withan average value of £2,303.
In Scotland, 44 consumer debt decrees were registered every day in April to June 2021, with anaverage value of £3,044.
2. Personal Debt in the UK

https://themoneycharity.org.uk
3. Mortgages, Rent and Housing
Mortgage Debt
According to the Bank of England, outstanding mortgage lending stood at £1,544.2 billion at theend of July 2021. This is up from £1,471.7 billion a year earlier, an increase of £72.6 billion.
That means that the estimated average outstanding mortgage for the 11.03 million householdswith mortgage debt was £140,004 in July 2021.
The average mortgage interest rate was 2.05% at the end of July 2021. Based on this, householdswith mortgages would pay an average of £2,870 in mortgage interest over the year.
For new loans, the average mortgage interest rate was 1.84%. Based on this, First-Time Buyerswith mortgages would pay an average of £3,035 in mortgage interest over the year.
According to the FCA and Bank of England, gross mortgage lending in April to June 2021 was£89.0 billion, 102% higher than the same quarter the previous year (depressed by lockdown) andthe highest quarterly total since before the 2008 crash.
The Financial Conduct Authority reports that 60.4% of mortgage lending in Q2 2021 was for 75%or less of a property’s value. 2.0% of lending was for mortgages for over 90% of a property’s value.
60.0% of mortgage lending was for three or more times the borrowers’ incomes.
According to UK Finance, in December 2019 (latest publicly available data), the mortgage aspercentage of house value was on average 77.0% for first-time buyers, 67.6% for home moversand 58.8% for re-mortgagors, slightly higher than the previous year.
9
https://themoneycharity.org.uk
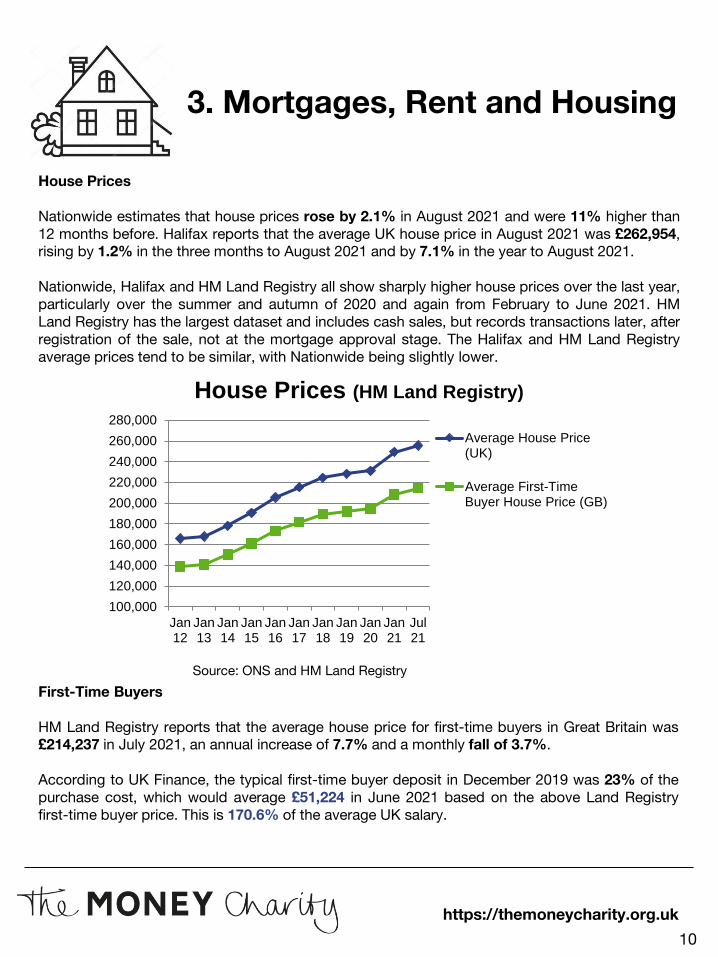
House Prices
Nationwide estimates that house prices rose by 2.1% in August 2021 and were 11% higher than12 months before. Halifax reports that the average UK house price in August 2021 was £262,954,rising by 1.2% in the three months to August 2021 and by 7.1% in the year to August 2021.
Nationwide, Halifax and HM Land Registry all show sharply higher house prices over the last year,particularly over the summer and autumn of 2020 and again from February to June 2021. HMLand Registry has the largest dataset and includes cash sales, but records transactions later, afterregistration of the sale, not at the mortgage approval stage. The Halifax and HM Land Registryaverage prices tend to be similar, with Nationwide being slightly lower.
First-Time Buyers
HM Land Registry reports that the average house price for first-time buyers in Great Britain was£214,237 in July 2021, an annual increase of 7.7% and a monthly fall of 3.7%.
According to UK Finance, the typical first-time buyer deposit in December 2019 was 23% of thepurchase cost, which would average £51,224 in June 2021 based on the above Land Registryfirst-time buyer price. This is 170.6% of the average UK salary.
Source: ONS and HM Land Registry
10
3. Mortgages, Rent and Housing
100,000
120,000
140,000
160,000
180,000
200,000
220,000
240,000
260,000
280,000
Jan12
Jan13
Jan14
Jan15
Jan16
Jan17
Jan18
Jan19
Jan20
Jan21
Jul21
House Prices (HM Land Registry)
Average House Price(UK)
Average First-TimeBuyer House Price (GB)

https://themoneycharity.org.uk
House Prices in Government Office Regions, Northern Ireland, Scotland and Wales
According to HM Land Registry, average house prices in the UK increased by 8.0% in the year toJuly 2021 to £255,535. The highest rates of increase were in Scotland (14.6%) and Wales (11.6%).The lowest price increases were in London (2.2%) and South West (5.2%). In most areas pricesdecreased in July 2021.
The average house price was highest in London (£494,673) and lowest in the North East(£144,935).
11
Average House Prices: Nations and Regions – July 2021
Source: ONS and HM Land Registry. Ranked by Annual Change.
3. Mortgages, Rent and Housing
Country and Government Office
RegionPrice Monthly Change Annual change
Scotland £177,166 2.0% 14.6%Wales £187,960 -4.0% 11.6%
North East £144,935 -3.5% 10.8%Northern Ireland (Quarter 2 - 2021)
£153,449 2.9% 9.0%
South East £354,278 -1.3% 8.8%West Midlands £220,759 -4.9% 8.5%
North West £185,171 -7.6% 8.1%England £270,973 -4.5% 7.0%
East Midlands £214,169 -5.5% 6.9%Yorkshire and The Humber
£180,324 -6.8% 6.9%
East of England £312,076 -3.8% 6.8%South West £277,178 -5.8% 5.2%
London £494,673 -2.0% 2.2%

https://themoneycharity.org.uk
Renting
According to the Office for National Statistics, private rental prices in the UK rose by 1.3% in the 12months to August 2021, the same as for the revised measure for the 12 months to July 2020.
Over the year to August 2021, private rental prices increased in Northern Ireland, Wales, Scotlandand all the English regions except for London. Northern Ireland (4.3%), East Midlands (2.7%) andthe South West (2.6%) saw the highest rates of increase. The lowest increase was in Wales (1.2%).In London, rentals fell by 0.4%.
The median rent in England across all private rental property types for the 12 months to 31 March2021 was £730, according to the Valuation Office Agency and ONS. In London it was £1,430.
For a single room with shared facilities, the median monthly private rent was £412. In London it was£675 (63.8% higher).
For two bedrooms, the median monthly private rent was £700. In London it was £1,450 (107.1%higher).
Figures from the Ministry of Housing, Communities and Local Government show that in 2019-20,private renter households in England spent an average of £871 per month on rental payments.Inclusive of benefits, private renters spent an average of 31.9% of their income on rental payments.The rental share of income was highest for single person (41.1%) and low income households(56.4%).
Monthly rents in the social housing sector in England were £459 for housing association rentersand £429 for local authority renters.
In 2019-20, 34.9% of households owned their home outright, while 29.7% were mortgagors,18.7% rented privately and 16.7% paid a social rent.• Since 2013-14 outright owners have been the largest tenure group.• Since the mid-1990s, the number of renters and outright owners has risen, while the number of
people owning a house with a mortgage has fallen.• In 2019-2020, only 40.9% of 25-34 year-olds were owner occupiers. 41.8% of this age group
were private renters and 17.3% were social renters.
12
3. Mortgages, Rent and Housing

Arrears and Repossessions
According to the Financial Conduct Authority, at the end of Q2 2021 there were 163,326mortgage loan accounts with arrears of more than 1.5% of the current loan balance.• This is 4.3% less than revised numbers for the previous quarter and 5.1% down on Q2 2020.
50.4% of payments due for loans in arrears were received in Q2 2021.
UK Finance reports that 76,270 (0.85%) of homeowner mortgages had arrears equivalent to atleast 2.5% of the outstanding mortgage balance in Q2 2021, 1.8% down on the previous quarter.Over the last year, mortgages in arrears have increased by 4 a day.
UK Finance estimates that there were 210 homeowner properties taken into possession in theUK in Q2 2021, up from 90 in Q2 2020.
This equates to 2.3 properties being possessed every day, or one property being possessedevery ten hours and twenty-four minutes. This low number is due to the pandemic-relatedmoratorium on forced possessions.
In England and Wales, in April to June 2021, according to the Ministry of Justice, every day 27.5mortgage possession claims were issued and 3.0 mortgage possession orders were made.
77 landlord possession claims were issued and 49.5 landlord possession orders were madeevery day.
Compared to January to March 2020 (pre-lockdown), mortgage possession claims fell by 50%and orders by 88%, while landlord possession claims fell by 71% and landlord possessionorders fell by 61%. This was due to forbearance action by Government and the FCA in responseto the Covid-19 pandemic.
However, possession claims and orders increased in Q2 2021 from the very low levels of mid-2020.
https://themoneycharity.org.uk
13
3. Mortgages, Rent and Housing

https://themoneycharity.org.uk
4. Spending and Loans
How We Spend
In the year to July 2021, outstanding consumer credit fell by 4.7% according to the Bank of England,while outstanding levels of credit card borrowing fell by 8.7%. The largest reduction occurred duringthe spring 2020 period of lockdown and furlough due to the Covid-19 pandemic, but after slightgrowth in mid-2020 there were further significant falls from August 2020 to June 2021. In July 2021there were small increases in both credit card debt (+ £214m) and total consumer credit (+ £119m).
After falling steeply at the beginning of the pandemic, LINK transaction volumes have begun torecover. On average, 52.2 cash machine transactions (including balance enquiries and rejectedtransactions) were made every second in August 2021, a decrease of 1.1% on August 2020. Thetotal value of transactions increased by 1.0% over the same period.• In total, cash machine transactions were worth an average of £52.20 per transaction.• These LINK transaction figures do not include transactions or withdrawals made by customers at
their own banks or building societies.• The number of ATMs (in-branch and remote) fell from 60,662 at the end of 2019 to 54,574 at the
end of 2020 (a fall of 10.0%). Free-to-use ATMs fell from 45,355 to 41,727 while pay-to-use ATMsfell from 15,307 to 12,847.
What We Buy
In Q1 2021, households in the UK spent £120.4 million a day on water, electricity and gas, or £4.33per household per day. On a seasonally adjusted basis, this was 0.64% more than the revised figurefor Q4 2020.
In August 2021 the average price of unleaded petrol increased by 2.3ppl to 135.4 ppl.• This meant it cost £67.70 to fill a 50 litre unleaded tank, £1.15 more than last month.The average price of diesel increased by 1.7ppl to 136.7ppl.• This meant it cost £68.35 to fill a 50 litre diesel tank, £0.85 more than last month.• The price difference between the two narrowed to 1.3ppl, a difference of £0.65 per 50 litre tank.
According to Which? the annual cost for home-charging a compact electric car is around £400 peryear, or £7.70 per week, based on 9,000 miles driving per year.
Child Poverty Action Group’s “The Cost of a Child in 2020” report estimates that couple families nowspend £152,747 on raising a child to their 18th birthday, £23.25 a day. This is an increase of 1.4%over the last year and 7.1% since the study began in 2012.• The cost for a lone parent is £185,413, an increase of 19.6% since 2012.• This comes to £28.22 a day.• For couples in 2020, 23% of basic costs are covered by child benefit. For lone-parent families in
2020, 17% of basic costs are covered by child benefit.
14

https://themoneycharity.org.uk
The Cost of Credit
The average interest rate on credit card lending bearing interest was 21.46% in August 2021. Thiswas 21.36% above the Bank of England Base Rate of 0.1%.
UK Finance figures show that 53.3% of credit card balances were bearing interest in June 2021.
In August 2021, the average APR for a £5,000 personal loan was 7.90%, according to the Bank ofEngland. For a £10,000 loan it was 3.90%, while the average rate for an overdraft was 33.75%.
As shown in the chart, the gap between credit card, overdraft and other interest rates has widenedsubstantially since 2008. The dramatic increase in overdraft rates in 2020 was due to new FCAoverdraft rules, which banned high fixed charges penalising accidental and short-durationoverdrafts, but at the cost of a rise in the average overdraft rate.
Why overdraft and credit card rates are so high when the bank base rate is only 0.1% is an openquestion.
15
4. Spending and Loans
0
5
10
15
20
25
30
35
40
Jan 0
7
Sep 0
7
Ma
y 0
8
Jan 0
9
Sep 0
9
Ma
y 1
0
Jan 1
1
Sep 1
1
Ma
y 1
2
Jan 1
3
Sept
13
Ma
y 1
4
Jan 1
5
Sep 1
5
Ma
y 1
6
Jan 1
7
Sep 1
7
Ma
y 1
8
Jan 1
9
Sep 1
9
Ma
y 2
0
Jan 2
1
Source: Bank of England
Interest Rates (% per year to August 2021)
Credit Card
Overdraft
£5k Loan
£10k Loan
Mortgage
Bank of EnglandBase Rate

https://themoneycharity.org.uk
5. Savings and Pensions
Savings
The average interest rate for an instant access savings account was 0.09% in August 2021. For acash ISA, the rate was 0.16%, down from 0.21% a year ago.
In Q1 2021, households saved an average of 19.6% of their post-tax income, including benefits,down from the record 25.1% (revised) in Q2 2020, which was more than double the previous peaksin the late 1970s and early 1990s. From 2000 to 2015, the savings rate fluctuated mostly within the7-10% range, with the most recent pre-Covid peak being 12.7% in Q1 2010. If someone on theaverage salary saved 19.6% of their income in an average instant access savings account for ayear, they would receive £4.25 in interest after tax. If they saved it in an average cash ISA, theywould receive £9.45.
It would take 9 years for someone on the average salary, saving the average amount perhousehold every year in an average instant access savings account, to afford the average first-timebuyer deposit. If they saved into a cash ISA at the same rate it would also take 9 years.
In 2020, according to the FCA, 27-34% of UK adults (14-18 million people) had either no savingsor less than £1,000 in savings. This was skewed toward younger age groups with at least 47% of18-24 year-olds having less than £1,000 in savings.
Pensions
According to The Pensions Regulator’s Compliance Report, at least 10.55 million workers hadjoined a pension scheme under auto-enrolment by the end of August 2021, making a total of 22.86million members of pensions schemes, but leaving 10.14 million workers unenrolled, out of thetotal declared workforce of 33.0 million.
According to the Family Resources Survey, 52% of working age adults actively participated in apension in 2019-20, up 1% on the previous year. Participation was 75% for employees and 18%for the self-employed.
According to ONS, in 2020, 34.8% of employees with a pension were in an occupational DefinedBenefit scheme, 36.5% were in an occupational Defined Contribution scheme and 26.6% were ingroup personal or stakeholder schemes. The Annual Survey of Hours and Earnings reports that in2020, 47.2% of members of Defined Benefit schemes received an employer contribution of 20% ormore of their income, compared with only 2.0% of members of Defined Contribution schemes.
In February 2021, there were 12.4 million recipients of the State Pension, a fall of 1.1% on the yearbefore. Of these, 1.9 million were on the new State Pension (nSP) introduced in 2016, an increaseof 460,000 on a year earlier.
16

https://themoneycharity.org.uk
6. Financial Inclusion
According to the FCA Financial Lives Survey, in the UK in 2020 there were 1.2 million UK adultswho did not have a bank account (either a current account or an alternative e-money account). Thiswas 2.3% of the UK adult population. The highest unbanked rates were for the unemployed, thosein a marginal or vulnerable situation and those aged 18-21.
There were 7.2 million basic bank accounts (BBAs) on 30 June 2020, according to HM Treasury.BBAs are the no-frills bank accounts that the nine largest personal current account providers arerequired to offer under the Payment Accounts Regulations 2015.
According to ONS, in 2019 there were 10,405 bank and building society branches in the UK. Thiswas a reduction of 2,940 branches (-22%) since 2012. According to Which? 4,188 branches haveeither been closed or scheduled for closure between January 2015 and December 2021, with thelargest numbers of closures in the South East, Scotland, North West and London.
According to the 2019 Access to Cash Review, 2.2 million people use only cash in their dailytransactions.
In 2020, 44.4 million UK adults (85% of the total) used some form of credit, according to the FCAFinancial Lives Survey. This includes unregulated credit (4% of adults) and running credit such ascredit cards that are paid off each month (30% of adults). Around 7.8 million people (15% of totalUK adults) either chose not to access credit or did not have access to credit.
According to the Bank of England, 1.90 million adults were members of credit unions in January toMarch 2021, a decrease of 0.2% over the same period in 2020. There were 404 credit unions, withloans to members to a value of £1.59 billion, 36.5% of which was in Northern Ireland.
According to the FCA Financial Lives Survey, 17.8 million UK adults (34% of the total) did not havehome contents insurance in 2020. According to Ofcom, 1.5 million households did not have accessto the Internet in March 2021. This included 18% of households with members aged 65+.
Recent research by Turn2us and Fair By Design found that low-income households pay a ‘povertypremium’ in buying their goods and services of £478 per year. The poverty premium is the extraamount people on low incomes pay from not being able to access the best deals.
According to Turn2us, 4.8 million people are living without at least one essential householdappliance (fridge, freezer, cooker or washing machine).
According to the FCA Financial Lives Survey, in October 2020, 14.6 million UK adults (28% of thetotal) said they had low confidence in managing their money, while 17.7 million UK adults (34%)had poor or low levels of numeracy involving financial concepts.
17

https://themoneycharity.org.uk
7. Young People
Young People in Education and EmploymentAccording to ONS, in May to July 2021 there were 5.33 million people aged 18 to 24. Of these,1.91 million were in full-time education while 3.28 million were in employment (including those infull-time education who were also in employment). From July 2020 to July 2021, the number of 18-24 year-olds in employment grew by 2,000.
Unemployment406,000 18-24 year olds (11.0%) were unemployed in May to July 2021. This was 68,000 fewerthan the same period the previous year, and 35,000 fewer than in February to April 2021.• 167,000 (41.1%) had been unemployed for over 6 months.• 81,000 had been unemployed for over 12 months, 11,000 fewer than from February to April
2021 but an increase of 32,000 (+59%) on a year earlier.
631,000 (9.3%) of 16 to 24-year-olds in the UK were not in education, employment or training(NEET) in April to June 2021, a decrease of 144,000 over the last year.
Minimum WageMinimum wage rates increased in April 2021. For under 18s the new rate is £4.62. The apprenticerate (for those under 19 or in the first year of their apprenticeship) is £4.30. For those aged 18-20,the minimum wage goes up to £6.56. For those aged 21-22, £8.36 and for those aged 23+, £8.91.The age for receiving the National Living Wage has dropped from 25+ to 23+.
Wages Paid by Age and GenderAccording to ONS, in April 2020 the median weekly pay for all full-time employees was £586. Foremployees aged 16-17 it was £207. For those aged 18-21 it was £350 and for those aged 22-29 itwas £499. For those aged 16-21, male and female pay was about the same (within the margin oferror). For those 22-29, the female median was around £26 per week less than the male median.
Student LoansIn 2019-20, the provisional average maintenance loan awarded to full-time students in England was£6,588 (up 5.0% on the revised figure for the previous year). In Wales it was £4,651 and in NorthernIreland £3,117. The provisional average tuition fee loan in England was £8,413 (down 0.3%). InWales it was £6,976 (up 24.2%) and in Northern Ireland £5,287.
Student DebtIn England, the average debt for the latest (2020/21) cohort to enter repayment was £45,060, anincrease of 12.6% on the previous year. In Wales it was £27,600 (+11.4%), in Northern Ireland£24,720 (+5.9%) and in Scotland £15,170 (+9.3%).
18

https://themoneycharity.org.uk
8. The Bigger Picture
Economy and Inflation
The UK economy grew by 0.1% in July 2021, continuing the recovery from the winter Covid-19lockdown, though only slightly. GDP in July 2021 was 2.1% below the level of February 2020,according to the latest estimates from the ONS, as a result of the recession caused by pandemicrestrictions. Global leading indicators remain positive for most territories (including for the UK).
The CPI (Consumer Prices Index) increased by 3.2% in the year to August 2021, 1.2% more thanthe year to July 2021. The highest rates of inflation over the 12 months to August 2021 were fortransport (7.8%) and restaurants and hotels (8.6%). The lowest rate was for food and non-alcoholicbeverages (0.3%). According to ONS, the high rate for restaurants and hotels partly reflects lowerprices in the summer of 2020 due to the Eat Out to Help Out scheme and reduced VAT rate.
Pay Rates
In the three months to July 2021, regular pay increased by 6.8% on the year before. Pay includingbonuses rose by 8.3%. According to ONS, these numbers are amplified by base rate andcomposition effects (see page 4.1). Average weekly pay was £542, or £578 including bonuses; anannual salary of £28,261, or £30,139 with bonuses. In real terms, for the year to July 2021, regularpay grew by 4.5% while total pay grew by 6.0%. Due to pay growth being lower than inflation formost of the last twelve years, total real pay (-0.2%) was below the pre-financial crash peak inFebruary 2008 while regular real pay increased by only 3.2% over the same period.
Public Sector Borrowing
Public Sector Net Borrowing (excluding NatWest Group and Bank of England) in the three monthsto August 2021 was £48.2 billion, an average borrowing of £523 million per day. Spendingincluded £9.5 billion net investment, meaning there was a current budget deficit of £38.6 billionover the same three months. Total net borrowing for the year to August 2021 was £236.2 billion,compared with £212.5 billion for the year to August 2020.
Public sector net debt in August 2021 (excluding NatWest and Bank of England) was £1,966.6billion (87.1% of GDP). This was £170.2 billion more than in August 2020, an increase of £466.3million per day, mainly due to the economic impact of Covid-19.
According to the March 2021 Forecast from the Office for Budget Responsibility, public sector netdebt will be 106% of GDP in 2024-25. However, interest on public debt is forecast to be lower inrelation to revenue in 2024-25 than in 2019-20 due to lower interest rates and the Bank ofEngland’s Asset Purchase Facility.
19

https://themoneycharity.org.uk
Population, Taxpayers and Benefit Recipients
According to the latest ONS estimate, the population of the UK grew by 777 people per daybetween mid 2019 and mid 2020.
Out of a total population aged 15+ of 55.5 million, there are projected to be 32.2 million incometaxpayers in 2021-22. Of these, 27 million will be basic rate taxpayers, 4.1 million people will fallinto the 40% income tax band and 440,000 will pay the 45% rate, which replaced the 50% rate in2013-14. People who do not pay income tax still pay indirect taxes such as VAT, non-EU importduties, insurance premium tax and excise duties on tobacco, alcohol and fuel.
There were 9.9 million working-age people claiming benefits in February 2021, according to DWP.In May 2021, housing benefit was received by 2.8 million people (of whom 1.7 million were workingage). In July 2021, 5.9 million people were receiving Universal Credit, an increase of 2.9 millionfrom March 2020 (before the first lockdown).
Unemployment
The number of people classed as unemployed in May to July 2021 was 1.55 million (4.6% of theworkforce), 86,000 fewer than the previous quarter, 935 fewer per day, but up 81,000 from theprevious year, 222 a day. The unemployment rate in the UK was highest in London (6.0%) and theNorth East (5.3%) and lowest in the South West (3.3%). 445,000 people had been unemployed forover 12 months in May to July 2021, up by 199,000 (545 a day) from a year earlier. Since thebeginning of 2021, short-term (less than six months) unemployment has fallen, while longer-termunemployment has increased.
Employment and Unemployment – Older Workers
355,000 people aged 50 and over were unemployed in May to July 2021, a decrease of 35,000 onFebruary to April 2021 but an increase of 54,000 on a year earlier. 42.5% of unemployed workersaged 50 and over, a total of 151,000 people, had been out of work for over a year. 93,000 had beenunemployed for more than two years.
1,306,000 (10.6%) people aged 65 and over were in work in May to July 2021, 2,000 more than inFebruary to April 2021, and an increase of 28,000 from the previous year.
Redundancies94,000 people (1,022 per day) reported they had become redundant in May to July 2021, 15,000fewer than in February to April 2021, and 62,000 fewer than the year before.
20
8. The Bigger Picture

The Money Charity is the UK’s Financial Capability charity.
We believe that being on top of your money means you are more in control of your life, your finances and your debts,
reducing stress and hardship. And that being on top of your money increases your wellbeing, helps you achieve your
goals and live a happier more positive life as a result.
Our vision is for everyone to be on top of their money as a part of everyday life. We empower people across the UK to develop the skills, knowledge, attitudes and behaviours to
make the most of their money throughout their lives.
https://themoneycharity.org.uk