Embed Size (px)
Citation preview
The monetary system, prices, and inflation
Outline
1. What is a monetary system?
2. Index numbers
3. The Consumer Price Index (CPI)
4. The CPI and the Inflation Rate
5. Adjusting the money (nominal) wage for inflation using the CPI
6. The Costs of Inflation
7. Is the CPI accurate?
8. Consequences of overstating inflation
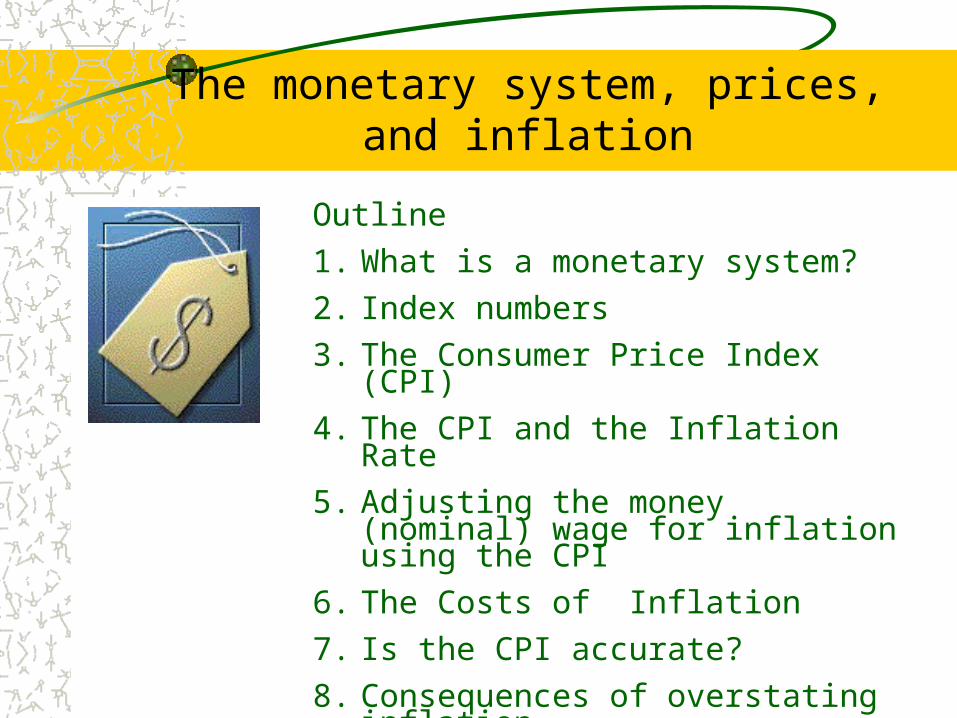
The monetary system
The monetary systems establishes two things:
1. The unit of value (or account)
2. The medium of exchange

In England, the pound is our unit of value. The price of bus fare, dry
cleaning, soft drinks, and GDP is expressed in
pounds.
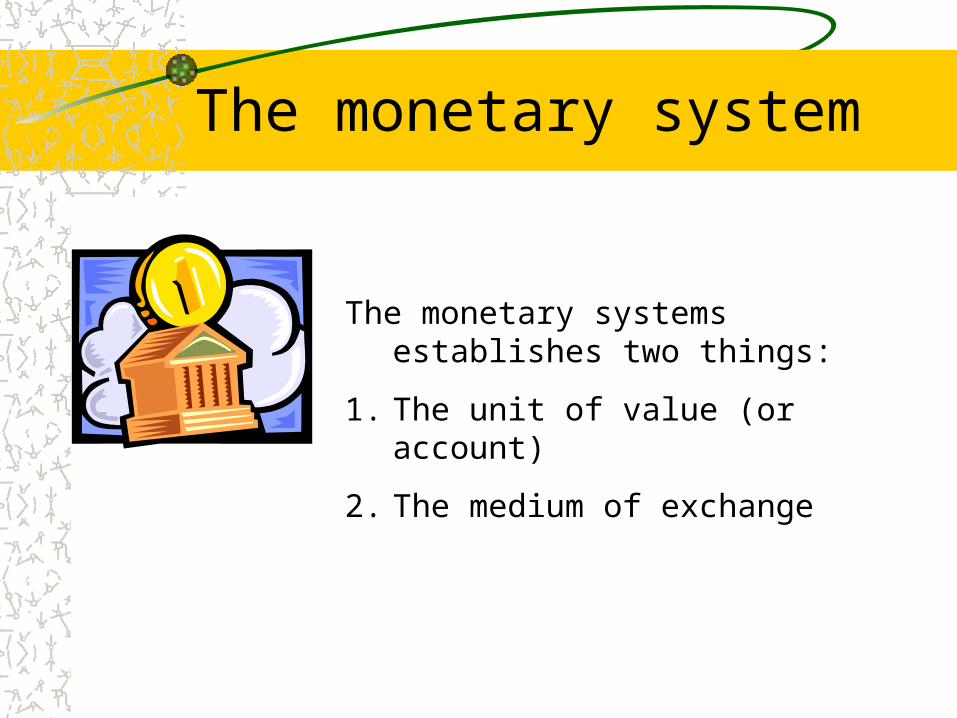
In the U.S., the dollar serves as the unit of value and
medium of exchange. If you want to by goods and
services here, you need dollars.
Recall that GDP in 1999 was 9.256 trillion dollars

This Note Is Legal Tender For All Debts, Public and Private
Fiat Money: Anything which serves as a means of payment by government declaration
You are willing to accept money not because it is
“backed” by precious metals; but rather because you know it is generally acceptable in
exchange
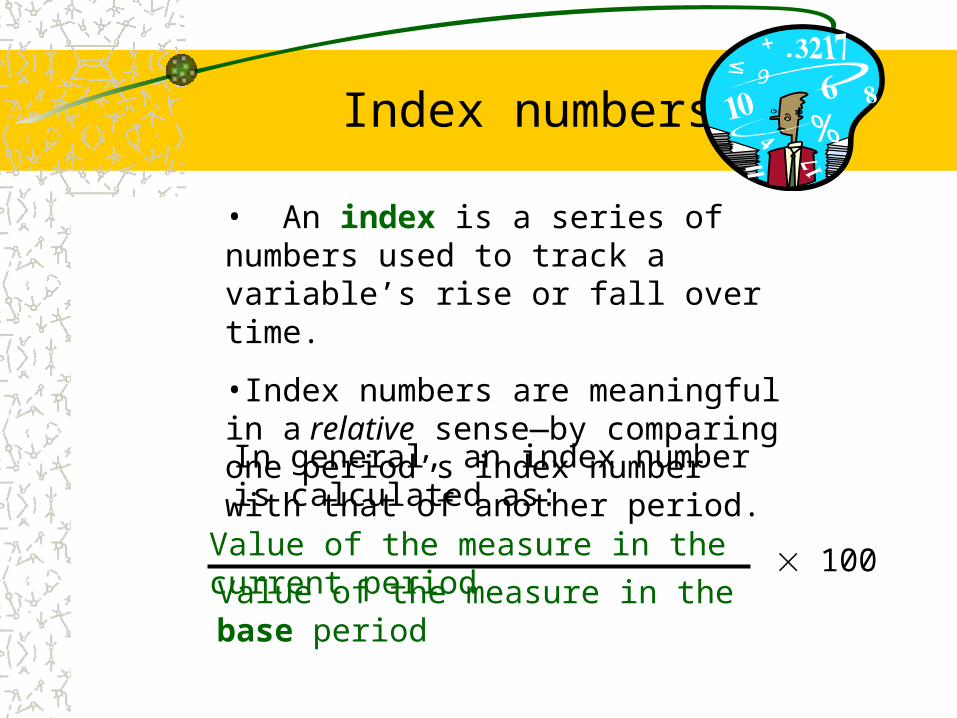
Index numbers
• An index is a series of numbers used to track a variable’s rise or fall over time.
•Index numbers are meaningful in a relative sense—by comparing one period’s index number with that of another period.
In general, an index number is calculated as:
Value of the measure in the current periodValue of the measure in the base period
100
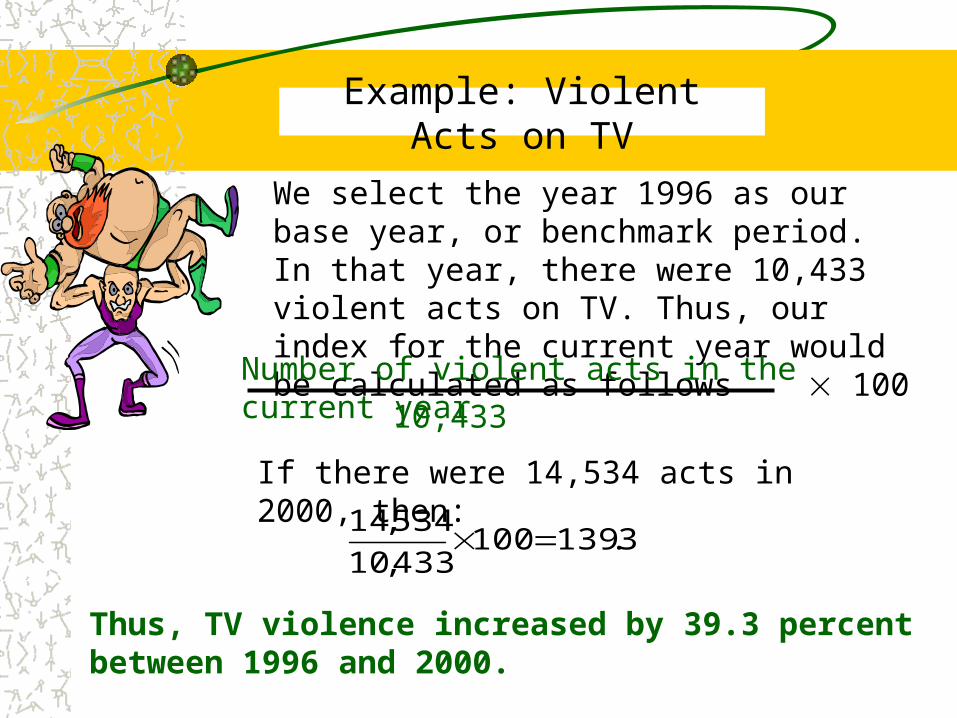
Example: Violent Acts on TV
We select the year 1996 as our base year, or benchmark period. In that year, there were 10,433 violent acts on TV. Thus, our index for the current year would be calculated as follows
Number of violent acts in the current year
10,433 100
If there were 14,534 acts in 2000, then:
3.139100433,10
534,14
Thus, TV violence increased by 39.3 percent between 1996 and 2000.
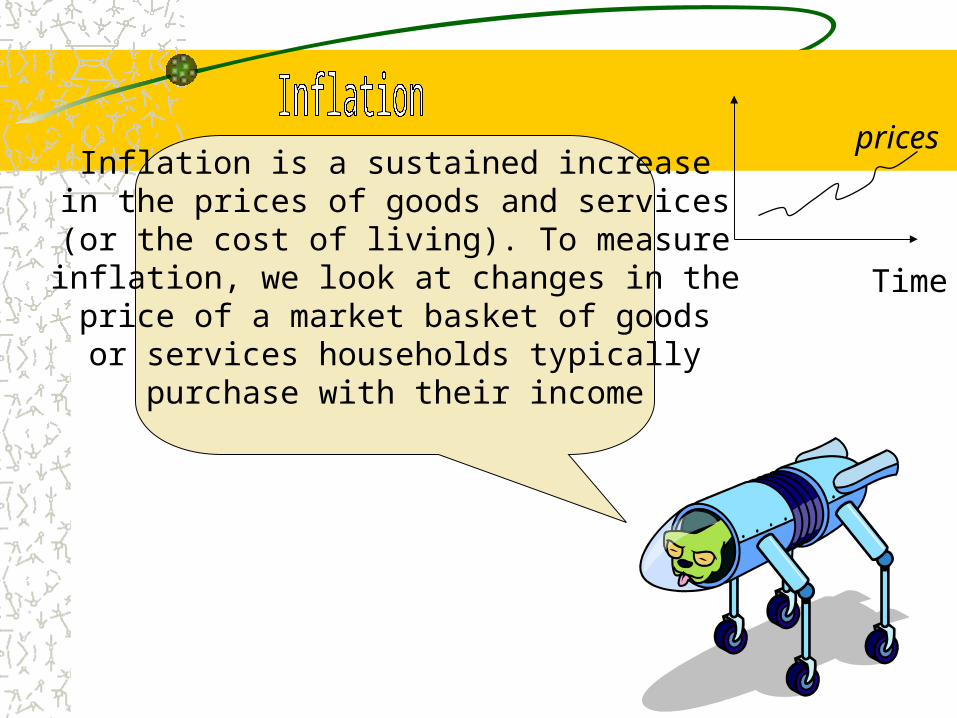
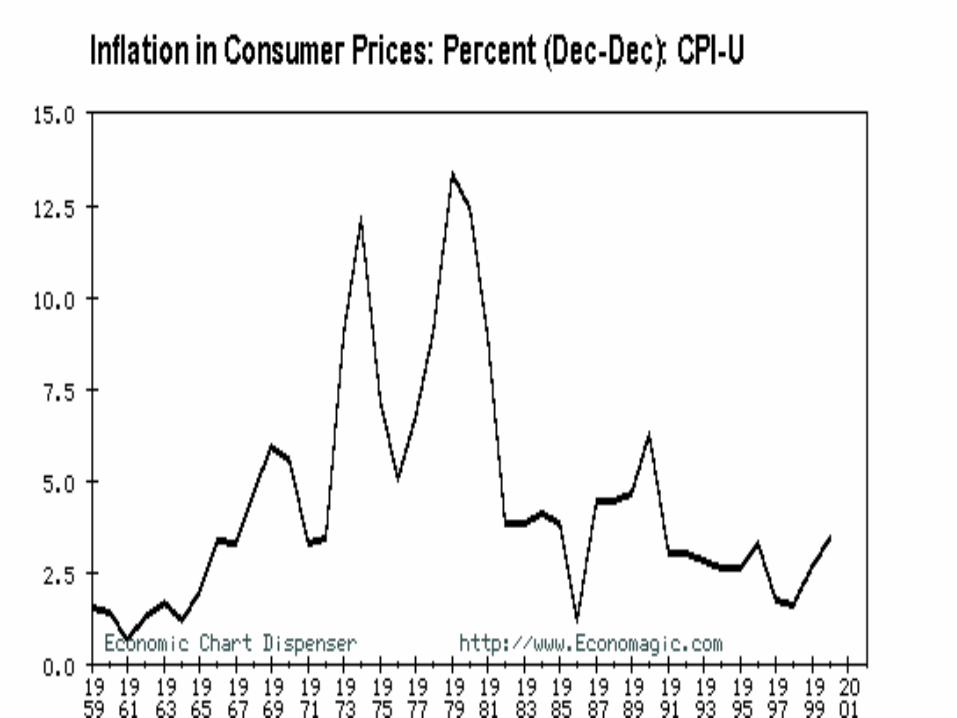
Inflation is a sustained increasein the prices of goods and services(or the cost of living). To measureinflation, we look at changes in theprice of a market basket of goodsor services households typically
purchase with their income
Time
prices
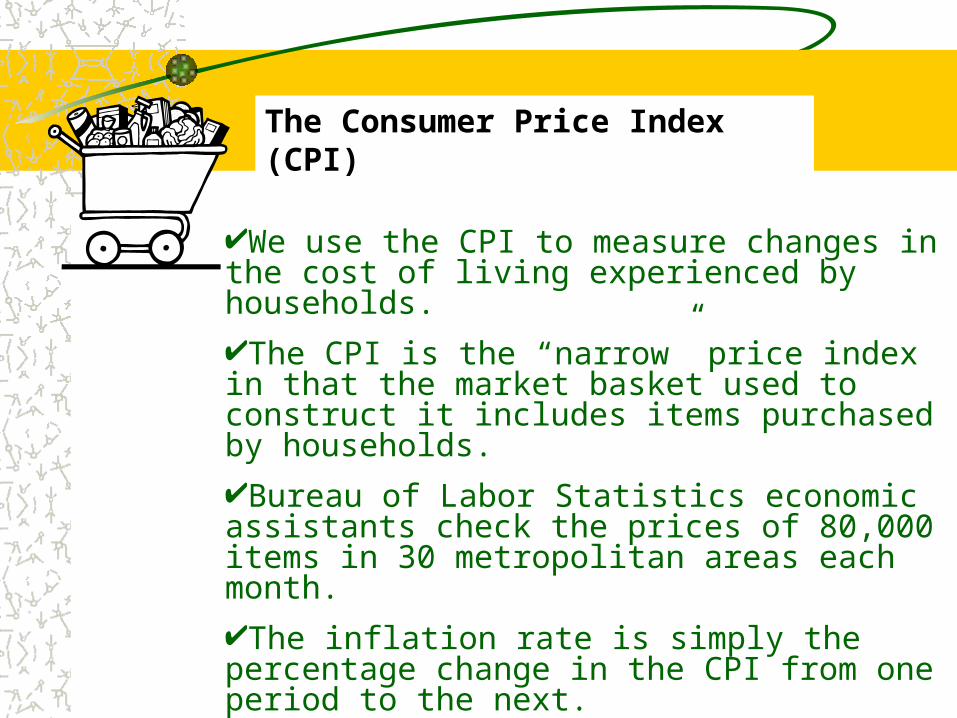
We use the CPI to measure changes in the cost of living experienced by households.The CPI is the “narrow” price index in that the market basket used to construct it includes items purchased by households.Bureau of Labor Statistics economic assistants check the prices of 80,000 items in 30 metropolitan areas each month. The inflation rate is simply the percentage change in the CPI from one period to the next.1982-84 is the base period
The Consumer Price Index (CPI)
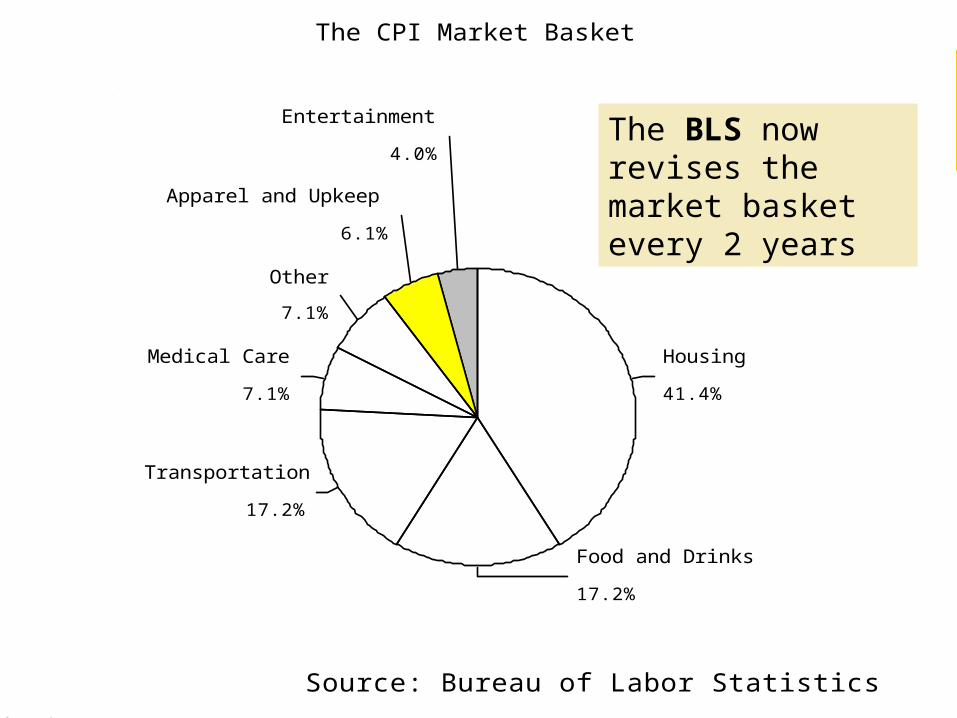
The CPI Market Basket
Source: Bureau of Labor Statistics
4.0%
6.1%
7.1%
7.1%
17.2%
17.2%
41.4%
Entertainment
Apparel and Upkeep
Other
Medical Care
Transportation
Food and Drinks
Housing
The BLS now revises the market basket every 2 years
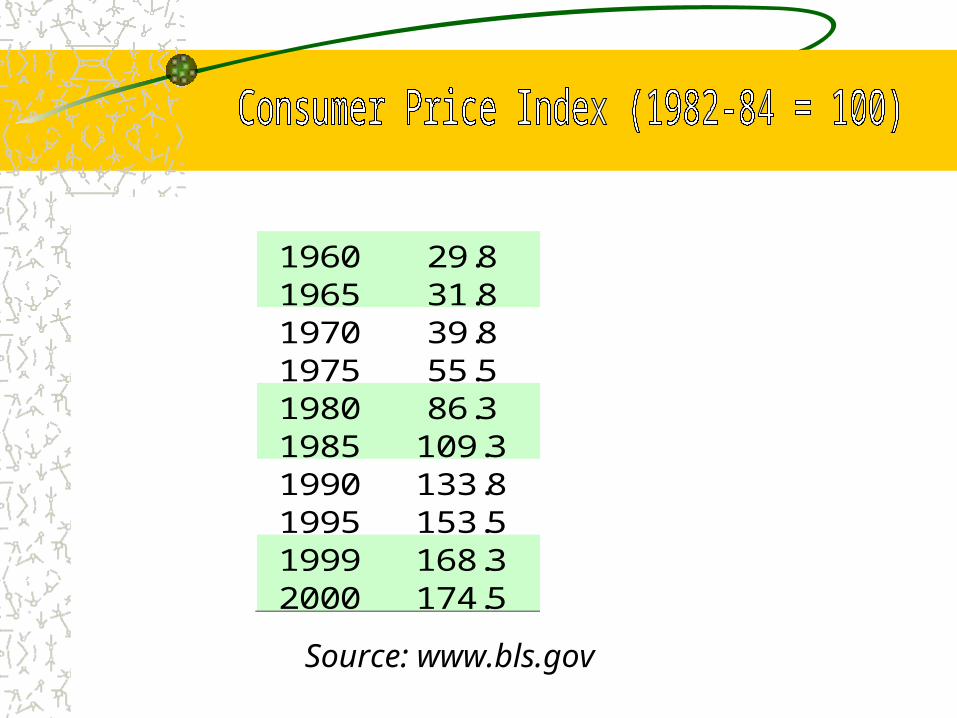
Source: www.bls.gov
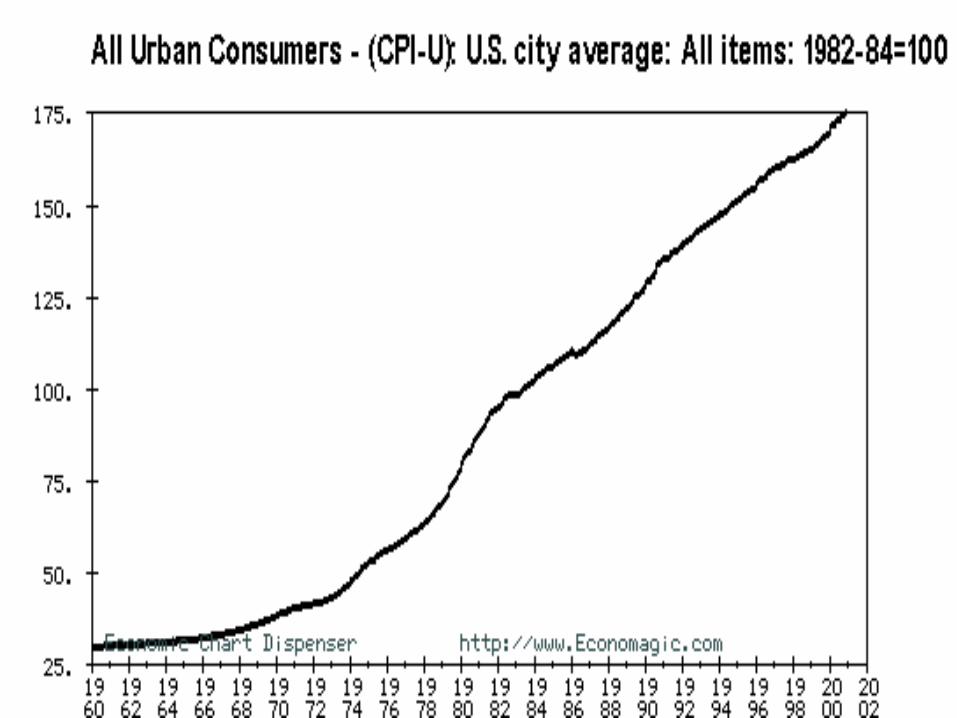
Year CPI1960 29.81965 31.81970 39.81975 55.51980 86.31985 109.31990 133.81995 153.51999 168.32000 174.5
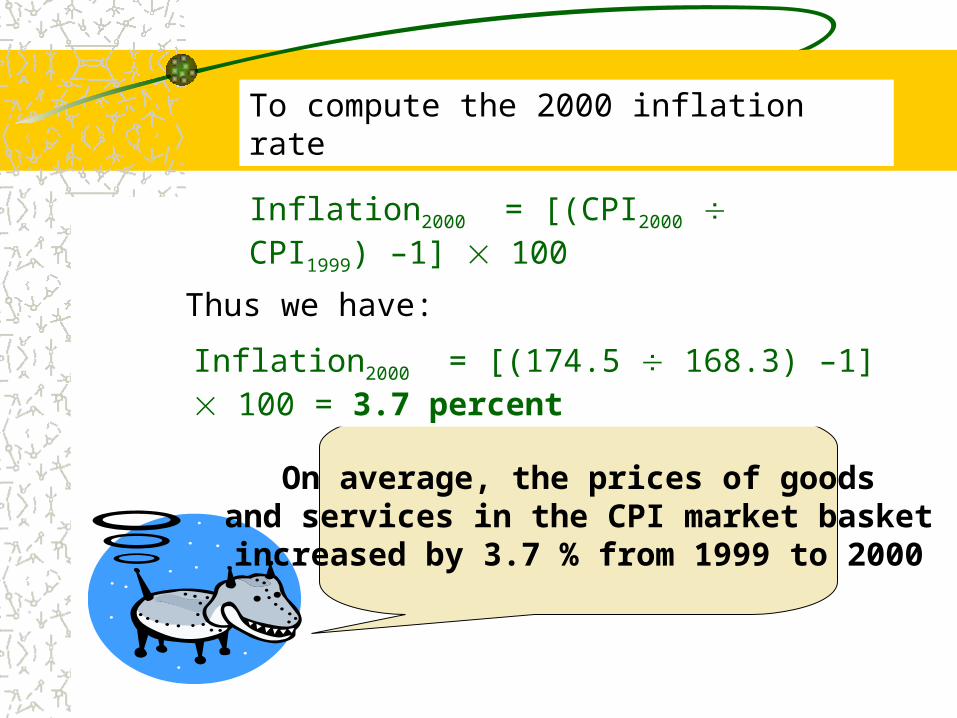
On average, the prices of goodsand services in the CPI market basketincreased by 3.7 % from 1999 to 2000
To compute the 2000 inflation rate
Inflation2000 = [(CPI2000 CPI1999) –1] 100
Thus we have:
Inflation2000 = [(174.5 168.3) –1] 100 = 3.7 percent
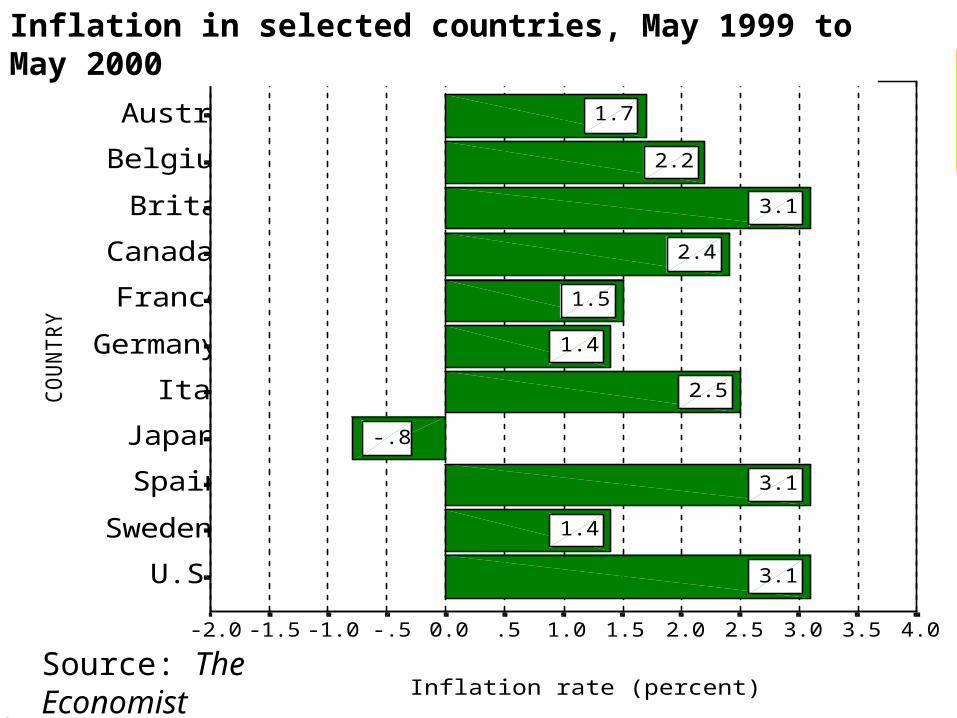
CO
UN
TR
Y
Austria
Belgium
Britain
Canada
France
Germany
Italy
Japan
Spain
Sweden
U.S.
Inflation rate (percent)
4.03.53.02.52.01.51.0.50.0-.5-1.0-1.5-2.0
3.1
1.4
3.1
-.8
2.5
1.4
1.5
2.4
3.1
2.2
1.7
Inflation in selected countries, May 1999 to May 2000
Source: The Economist
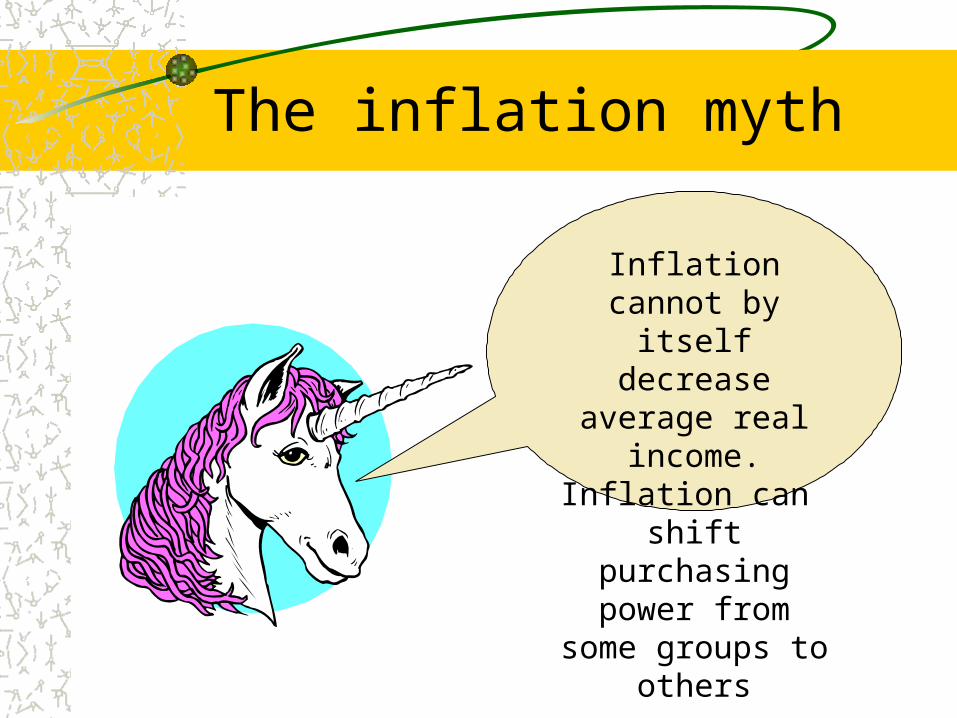
The inflation myth
Inflation cannot by itself decrease
average real income. Inflation can shift purchasing power
from some groups to others
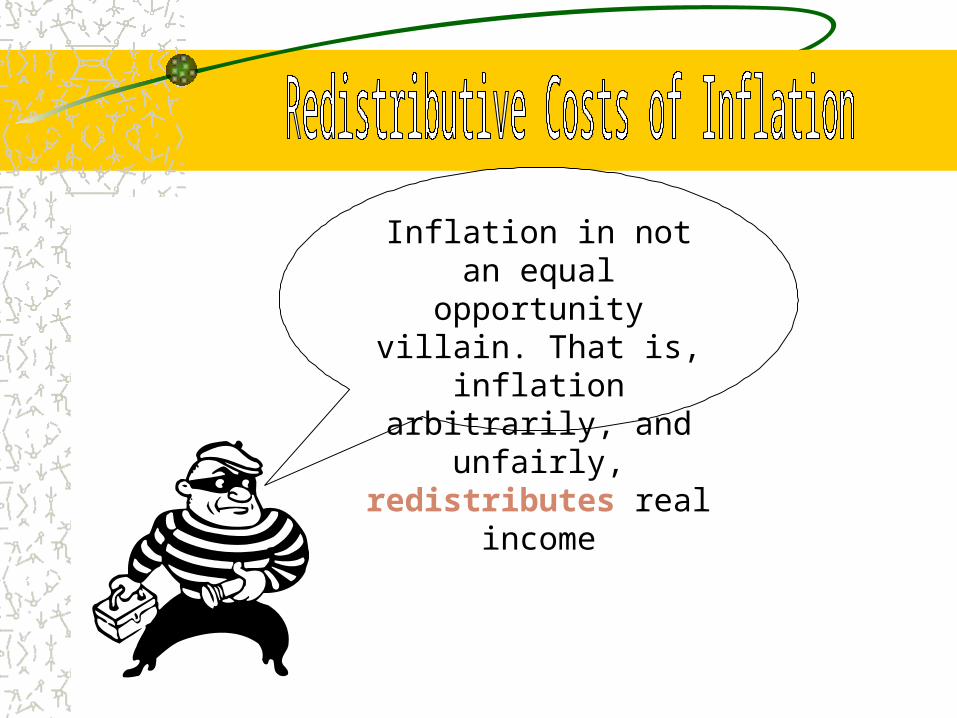
Inflation in not an equal opportunity villain. That
is, inflation arbitrarily, and unfairly, redistributes
real income
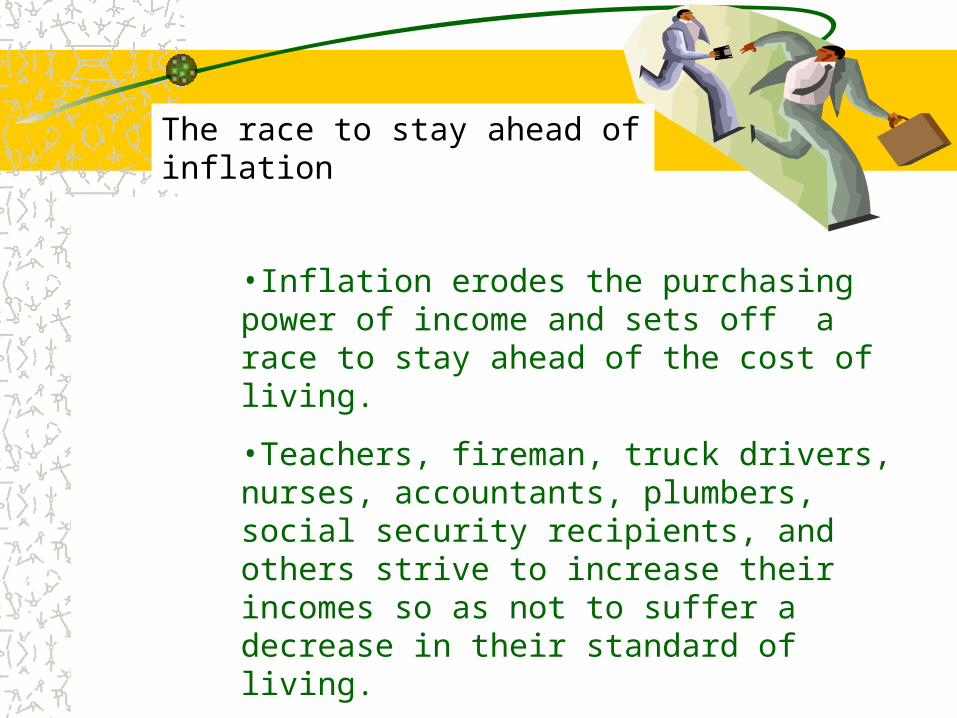
The race to stay ahead of inflation
•Inflation erodes the purchasing power of income and sets off a race to stay ahead of the cost of living.
•Teachers, fireman, truck drivers, nurses, accountants, plumbers, social security recipients, and others strive to increase their incomes so as not to suffer a decrease in their standard of living.
•Some groups do better than others.
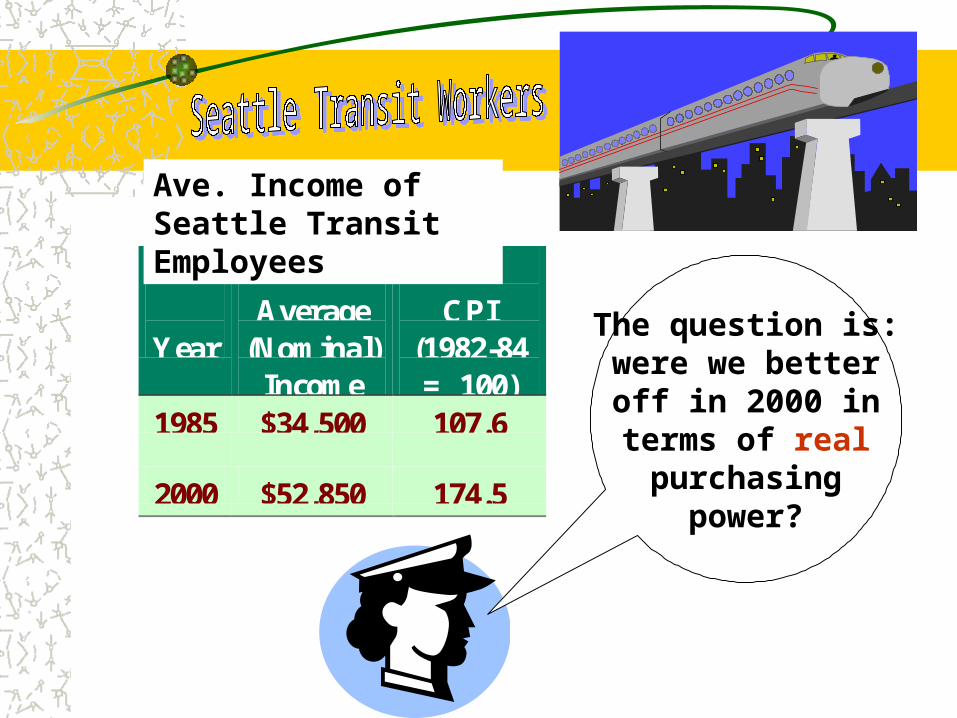
Year
Average
(Nominal) Income
CPI
(1982-84 = 100)
1985 $34,500 107.6
2000 $52,850 174.5
Ave. Income of Seattle Transit Employees
The question is:were we betteroff in 2000 interms of realpurchasing
power?
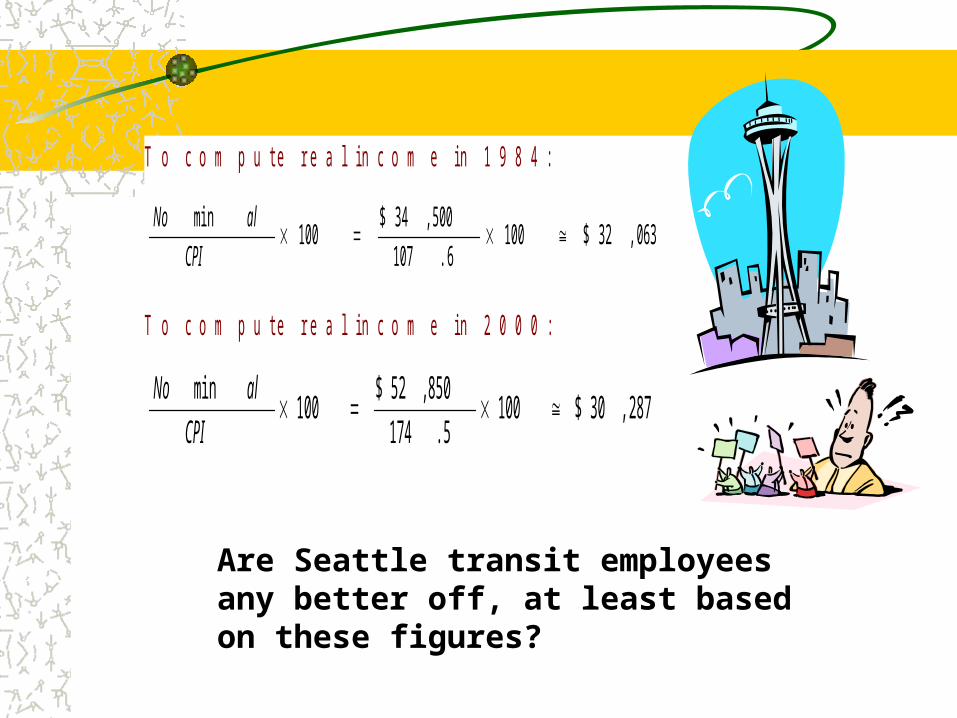
T o c o m p u t e r e a l i n c o m e i n 1 9 8 4 :
063,32$1006.107
500,34$100
min
CPI
alNo
T o c o m p u t e r e a l i n c o m e i n 2 0 0 0 :
287,30$1005.174
850,52$100
min
CPI
alNo
Are Seattle transit employees any better off, at least based on these figures?

Why are we smiling? Because our social
security benefits are indexed to the CPI
Why doesn’t Congress index the minimum wage to the CPI?
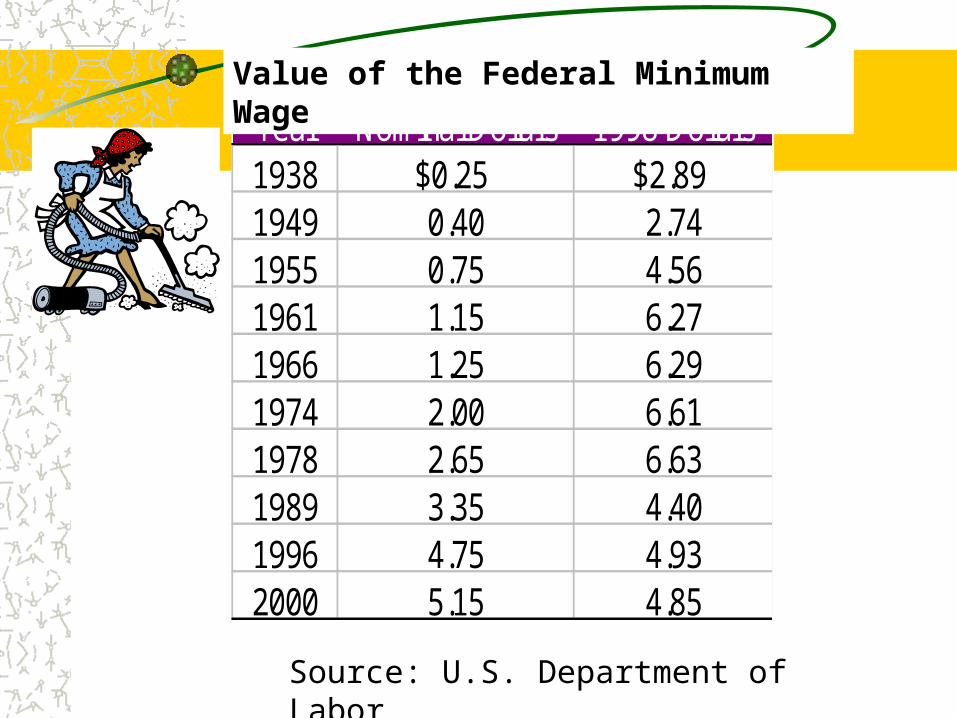
Year Nominal Dollars 1998 Dollars1938 $0.25 $2.891949 0.40 2.741955 0.75 4.561961 1.15 6.271966 1.25 6.291974 2.00 6.611978 2.65 6.631989 3.35 4.401996 4.75 4.932000 5.15 4.85
Source: U.S. Department of Labor
Value of the Federal Minimum Wage
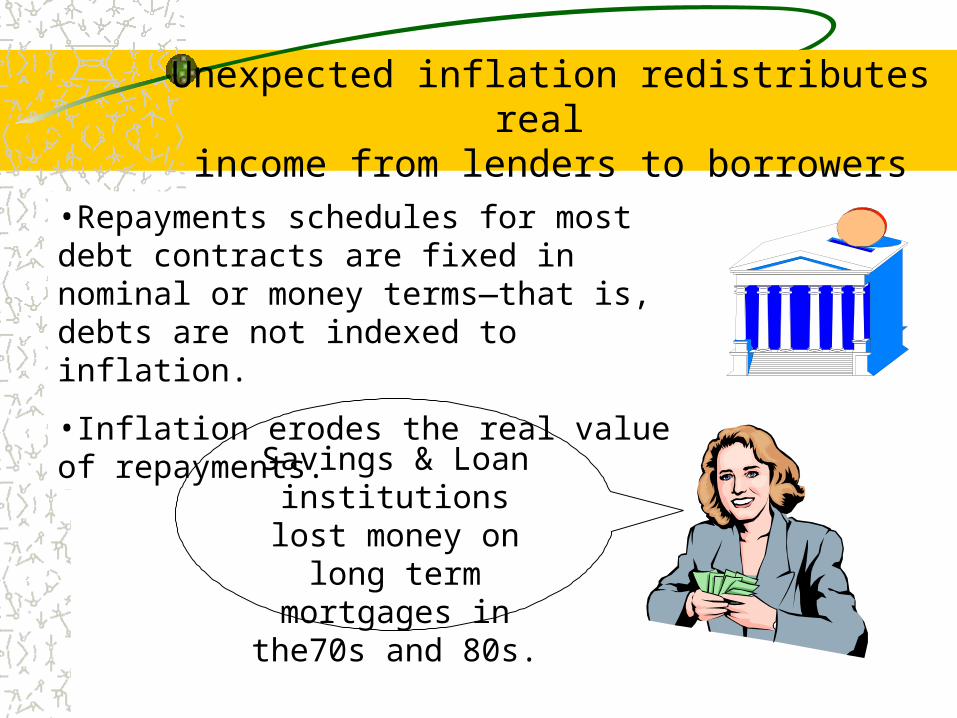
Unexpected inflation redistributes real income from lenders to borrowers
•Repayments schedules for most debt contracts are fixed in nominal or money terms—that is, debts are not indexed to inflation.
•Inflation erodes the real value of repayments.
Savings & Loan institutions lost
money on long term mortgages in the70s
and 80s.
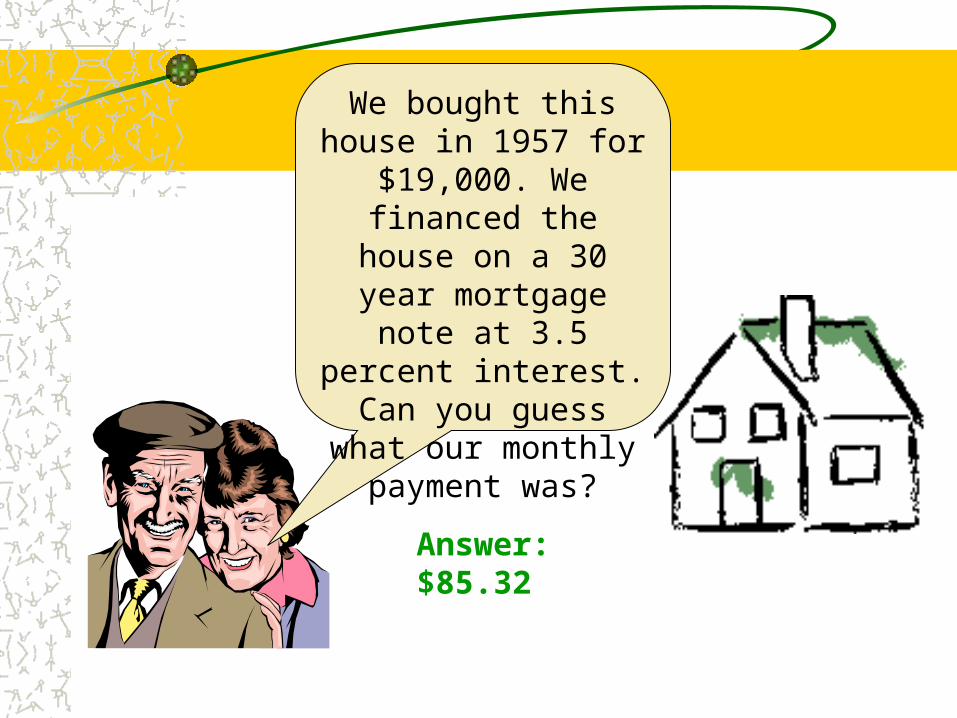
We bought this house in 1957 for $19,000. We
financed the house on a 30 year mortgage note at 3.5 percent interest. Can
you guess what our monthly payment was?
Answer: $85.32

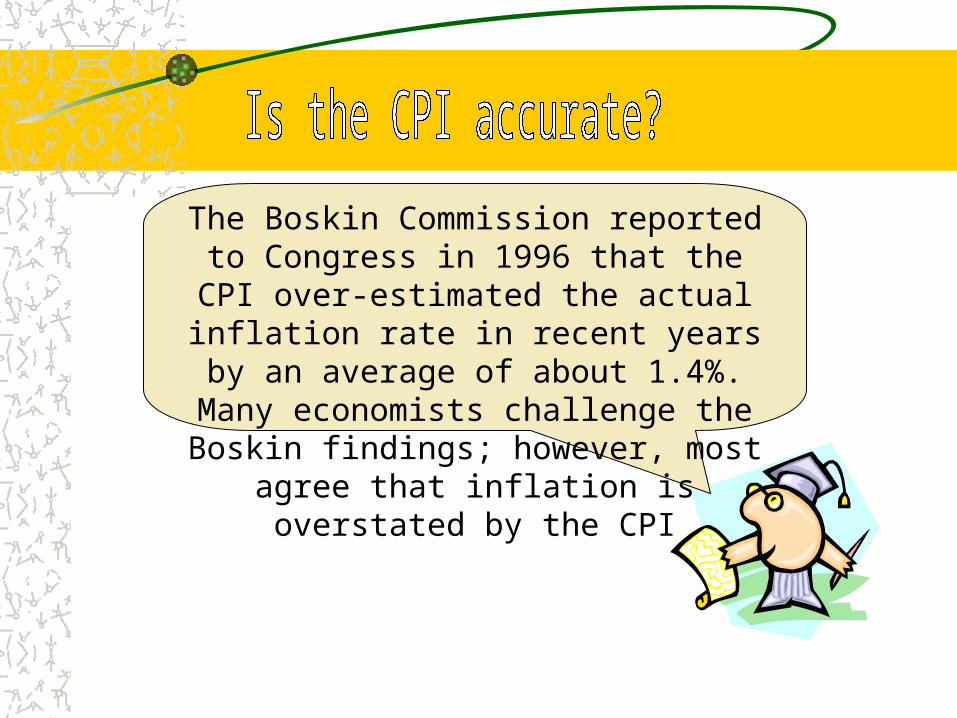
The Boskin Commission reported to Congress in 1996 that the CPI over-estimated the actual inflation rate in recent years by an average of about 1.4%. Many economists challenge the Boskin findings; however, most agree that
inflation is overstated by the CPI
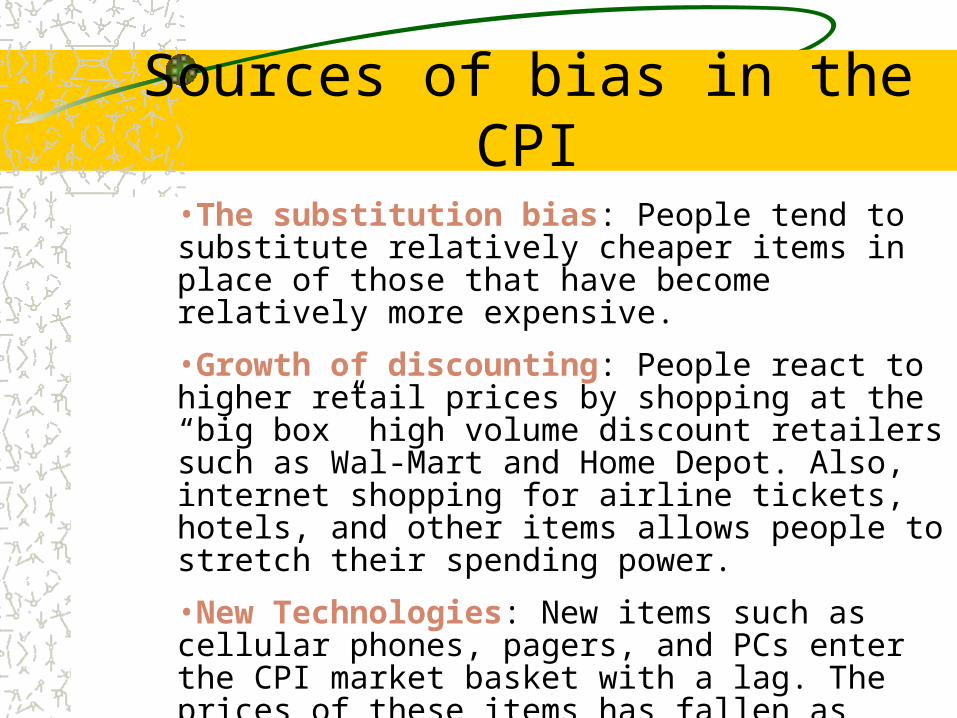
Sources of bias in the CPI
•The substitution bias: People tend to substitute relatively cheaper items in place of those that have become relatively more expensive.•Growth of discounting: People react to higher retail prices by shopping at the “big box” high volume discount retailers such as Wal-Mart and Home Depot. Also, internet shopping for airline tickets, hotels, and other items allows people to stretch their spending power. •New Technologies: New items such as cellular phones, pagers, and PCs enter the CPI market basket with a lag. The prices of these items has fallen as their popularity has risen.•Quality bias: For example, the CPI does not fully adjust for the fact car prices rise because of new features such as air bags and antilock brakes. Another example: the cost of hospitalization.

•Changes in real income over time are not measured properly.
•Private contracts are distorted.
•Increase in government outlays
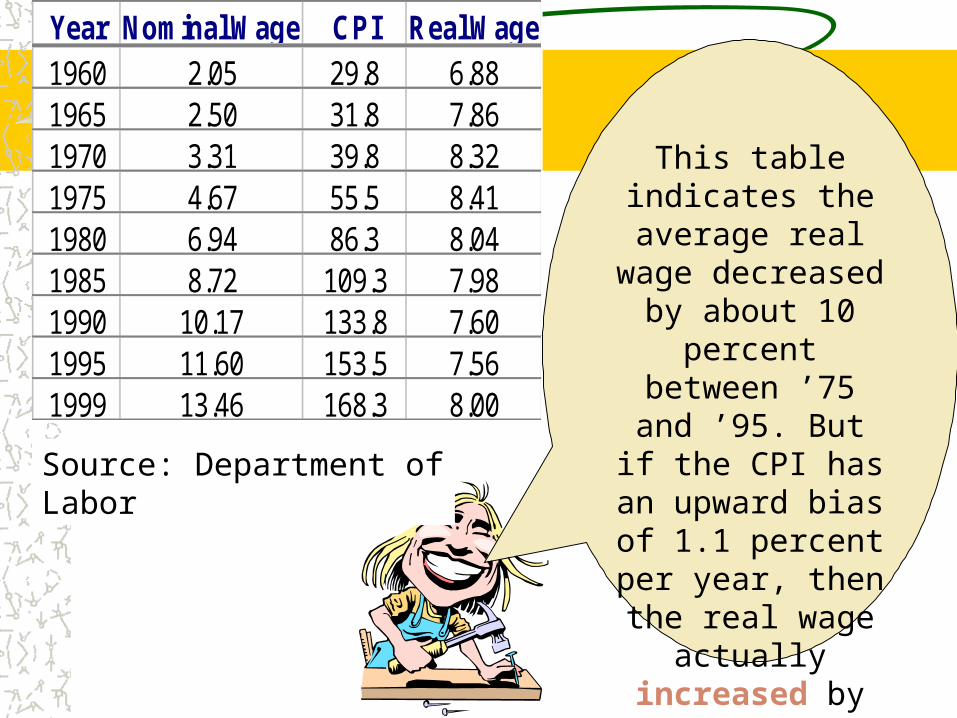
Year Nominal Wage CPI Real Wage1960 2.05 29.8 6.881965 2.50 31.8 7.861970 3.31 39.8 8.321975 4.67 55.5 8.411980 6.94 86.3 8.041985 8.72 109.3 7.981990 10.17 133.8 7.601995 11.60 153.5 7.561999 13.46 168.3 8.00
This table indicates the average real
wage decreased by about 10 percent
between ’75 and ’95. But if the CPI has an upward bias of 1.1 percent per year,
then the real wage actually increased
by 11 percent during this period
Source: Department of Labor

We have a three-year contract with our hourly
employees that is indexed to the CPI
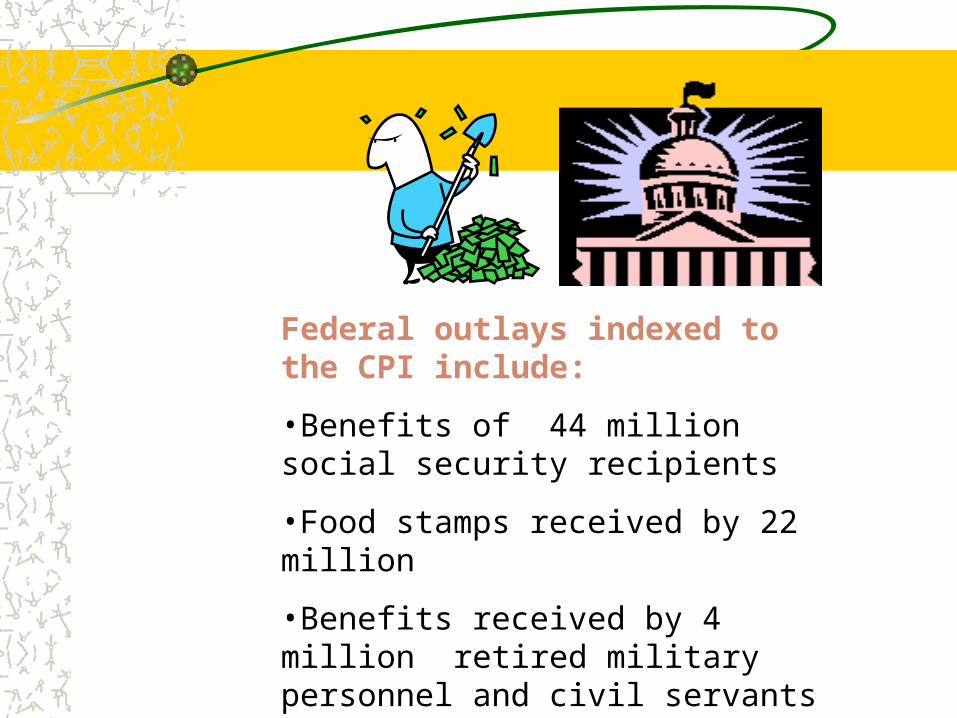
Federal outlays indexed to the CPI include:
•Benefits of 44 million social security recipients
•Food stamps received by 22 million
•Benefits received by 4 million retired military personnel and civil servants (or surviving spouses).