Embed Size (px)
Citation preview
The Moderating Effect of Cultural Values on the Relationship between Corporate Social Performance and Corporate Financial Performance
Wei Shi Jesse H. Jones Graduate School of Business
Rice University [email protected]
Kevin Veenstra* DeGroote School of Business
McMaster University [email protected]
August 30, 2015
Acknowledgments: We are thankful for constructive comments and suggestions from one anonymous reviewer, participants at the 2015 JCF conference on Culture & Finance held at Wake Forest University, North Carolina, participants at the 2015 EAA conference held at University of Strathclyde, Glasgow, and participants at the 2015 AAA annual conference held at Chicago, Illinois. Veenstra gratefully acknowledges the financial support of McMaster University. All errors are our own. ∗ Corresponding Author: Kevin Veenstra, Assistant Professor of Accounting, DeGroote School of Business, McMaster University, 1280 Main Street West, Hamilton, ON L8S 4M4, Canada. Email: [email protected] Tel: 1-905-525-9140 ext. 23991; Fax: 1-905-526 0852.
The Moderating Effect of Cultural Values on the Relationship between Corporate Social Performance and Corporate Financial Performance
ABSTRACT
Using Hofstede’s six cultural value dimensions to proxy for national culture, we show a strong
interaction effect between culture and firms’ corporate social performance (CSP), which
significantly influences corporate financial performance. Specifically, Tobin’s Q is higher in
those firms where CSR initiatives are congruent with the cultural environment. CSP has a
negative impact on firm valuation for those firms domiciled in countries which are
individualistic and indulgent, and a positive impact on valuation in those countries which are
characterized by long-term orientation and high power distance. Using a data set covering 3,591
firms from 36 different countries, our results show that cultural values and CSR initiatives have a
powerful interaction effect in determining firm valuation, suggesting that CSP’s impact is
dependent upon the culture of the country where the firm resides.
JEL Classification: A13, D22, D63, M14. Keywords: Cultural value, corporate social performance, corporate financial performance.
2
I. INTRODUCTION
The relationship between corporate social performance (CSP) and corporate financial
performance (CFP) has attracted great attention from scholars of different disciplines (Brammer
and Millington 2008; Dowell, Hart and Yeung 2000; Eccles, Ioannou and Serafeim 2014;
Flammer 2014; King and Lenox 2002; Luo et al. 2015; Margolis, Elfenbein and Walsh 2009;
Margolis and Walsh 2003; Orlitzky, Schmidt and Rynes 2003). To understand such a
relationship becomes even more important as managers face increasing pressures from activist
groups and the media to enhance CSP on the one hand and from investors to deliver desirable
CFP on the other. Empirical studies have generated conflicting findings regarding the CSP-CFP
relationship (Margolis et al. 2009; Orlitzky et al. 2003). Such conflicting findings may be
attributable to complicated relationships between CSP and CFP, but could also imply that the
CSP-CFP relationship depends on different institutional and organizational contingencies.
This study examines the moderating effect of cultural values on the CSP-CFP
relationship. The overarching thesis of this study is that stakeholders’ cultural values influence
their social perceptions about CSP, which in turn affects the magnitude of the CSP-CFP
relationship. We examine contingency effects of cultural values because cultural values shape
people’s beliefs and attitudes and regulate their behaviors (Chen, Leung and Chen 2009; Guiso,
Sapienza and Zingales 2006; Stulz and Williamson 2003).
Specifically, we focus on Hofstede’s six cultural value dimensions –
individualism/collectivism, indulgence, long-term/short-term orientation, power distance,
masculinity/femininity, and uncertainty avoidance.
We propose a cultural value conformity hypothesis regarding how these cultural values
affect the magnitude of the CSP-CFP relationship. This hypothesis contends that the interactions
3
between CSP and individualism/indulgence/masculinity should have a negative effect on CFP
whereas the interaction between CSP and long-term orientation/power distance/uncertainty
avoidance should have a positive effect on CFP because high CSP is more aligned with social
norms and expectations of stakeholders in collective, long-term oriented, power distant,
feminine, and uncertainty avoidant countries which also practice restraint. Consequently, firms
with high CSP tend to have high levels of organizational legitimacy in such countries and are
more likely to be endorsed by stakeholders (Aldrich and Fiol 1994; Dowling and Pfeffer 1975;
Suchman 1995).
To test this hypothesis, we use a sample of 3,591 firms from 36 countries and regions
covered by the Thomson Reuters’ ASSET4 dataset. We use Tobin’s q to measure CFP as our
theoretical interest is to show how social perceptions shaped by cultural values influence market
valuation of firms’ corporate social investments. We measure CSP using each firm’s
environmental performance score, social performance score, and an equal-weighted index of
environmental and social performance scores from the ASSET4 dataset. Consistent with the
cultural value conformity hypothesis, we find that the interactions between CSP and
individualism/indulgence have a negative effect on CFP while the interaction between CSP and
long-term orientation/power distance have a positive effect on CFP. Such findings highlight the
importance of cultural values in influencing the valuation of a firm’s CSP by the market. In
countries which prioritize individualism and indulgence, shareholders are more likely to perceive
that corporate social investments are a form of wasted resources and attach lower premiums to
high CSP firms. In contrast, in countries which prioritize long-term orientation and power
distance, shareholders are more likely to perceive that socially responsible behavior is critical to
4
a firm’s long-run competitiveness and therefore grant higher premiums to firms with high CSP.
We do not find significant interactions between CSP and masculinity/uncertainty avoidance.
This study makes two main contributions. First, this study contributes to the existing
CSP-CFP research paradigm by demonstrating the important contingency effect of cultural
values. Cultural values in a society are “the most central feature of culture” and express “shared
conceptions of what is good and desirable in the culture” (Schwartz, 2006, p. 139). Our findings
not only illustrate that the CSP-CFP relationship hinges on stakeholders’ cultural values but also
show that the magnitude of the interaction effects between cultural values and CSP is
economically meaningful, suggesting the importance of exploring contingency factors that
influence the CSP-CFP relationship.
Second, this paper contributes to a growing line of research examining the influence of
cultural values on economic outcomes. The role of culture in affecting economic exchanges has
received attention in both experimental research designs (Chen et al. 2009) and in large scale
empirical analyses (Chui, Lloyd and Kwok 2002; Guiso, Sapienza and Zingales 2003, 2009; Li
et al. 2011, 2013). Our findings suggest that when firms undertake strategic investments
consistent with stakeholders’ embedded cultural values, shareholders are more likely to value
such investments, leading to positive CFP. In contrast, when firms make investments that
conflict with stakeholders’ cultural values, these firms tend to have lower organizational
legitimacy and such investments are less likely to be valued by shareholders, translating into
lower CFP.
The rest of this paper is organized as follows. We first describe existing research on the
CSP-CFP relationship as well as on cultural values. We then develop our empirical hypothesis –
the cultural value conformity hypotheses. Following that, we describe the data and present
5
empirical tests of the moderating effects of cultural values on the CSP-CFP relationship. We then
present results from supplementary analyses. The paper concludes with a brief discussion of our
findings.
II. BACKGROUND AND HYPOTHESES
2.1 Corporate Social Performance and Corporate Financial Performance
The debate on the relationship between CSP and CFP has been contentious. Friedman
(1970) and other neoclassical economists argue that adopting environmental and social policies
(high CSP) can be detrimental to shareholders’ wealth and value. The underlying logic is that
corporate social investments can be a form of agency cost - managers may make investments in
corporate social responsibility to improve stakeholder relationships and to achieve their own
objectives (Friedman 1970; Jensen 2002; Kock et al. 2012). The agency costs associated with
high CSP may exceed the benefits that stem from corporate social investments, leading to a
competitive disadvantage and adversely affecting financial performance. The costs of CSP are
immediate (Brammer and Millington 2008) with unknown payback periods (Slawinksi and
Bansal 2015). In contrast, scholars adopting a stakeholder theory perspective argue that high
CSP can translate into high CFP because managing relationships with stakeholders, in addition to
shareholders, are conducive to hiring talented personnel, garnering employee and customer
loyalty, and creating reputational capital, which are all critical to a company’s competitive
advantage and financial performance (Donaldson and Preston 1995; Freeman 1984; Eccles et al.
2014).
Empirical evidence regarding the CSP-CFP relationship is mixed. Two meta-analyses
studies (Margolis et al. 2009; Orlitzky et al. 2003) find a positive relationship between CSP and
CFP. Nevertheless, some studies observe a negative or inconclusive relationship between CSP
6
and CFP (Fogler and Nutt 1975; Frooman 1997; Griffin and Mahon 1997; Vance 1975). Such
mixed findings may be suggestive of either: (1) an unstable relationship between CSP and CFP,
or (2) organizational and institutional factors that moderate the CSP-CFP relationship. Goll and
Rasheed (2004), for example, find that CSP exerts a stronger effect on CFP when the external
environment is highly dynamic and munificent.
2.2 Cultural Values
Culture is a foundational institution of societies and represents systems of values and
beliefs that support specific formal and informal institutions (North 1990; Williamson 2000).
Cultural values represent shared conceptions of what is desirable and good in a society. Because
cultural values can have a direct impact on people’s expectations and preferences, which in turn
guide their behaviors and decisions, cultural values can exert an indirect influence on economic
outcomes (Guiso et al. 2006). In fact, existing research has already examined the direct influence
of cultural values on corporate decisions in a number of instances. For example, national
cultural value similarity increases cross-border merger volume and synergy gains (Ahern,
Daminelli and Fracassi forthcoming), bilateral trust increases trade and direct investment
between two countries (Guiso et al. 2009), individualism is positively associated with firms’ risk
taking behaviors (Li et al. 2013; Shao, Kwok and Zhang 2013) and cultural value differences
affect capital structures that firms choose (Li et al. 2011). A recent study (Adams, Licht and
Sagiv 2011) also shows the influence of cultural values on how board of directors make
decisions regarding shareholders and other stakeholders. Specifically, findings from this study
suggest directors are more pro-shareholder, instead of pro-stakeholder, when they have higher
achievement, power, and self-direction values and lower universalism values.
7
Scholars have developed different theories of cultural values (Hofstede 1980; House et al.
2002; Inglehart and Welzel 2005). This study focuses on cultural value orientations developed by
Hofstede (Hofstede 1980; Hofstede 2001; Hofstede et al. 2010). Specifically, we examine
Hofstede’s six cultural dimensions – individualism/collectivism, indulgence, long-term/short-
term orientation, power distance, masculinity/femininity, and uncertainty avoidance. Hofstede
developed his original model using factor analysis to examine the results of a world-wide survey
of employee values at IBM (International Business Machines) in the 1960s and 1970s. The
theory was one of the first which could be used to quantify and explain the observed differences
between cultures. It has inspired a number of other cross-cultural studies of values (i.e.
Schwartz, World Values Survey).
Hofstede’s measures are widely used as a proxy for culture and have stood the test of
time. Recently, Karolyi (2015) conducted an empirical analysis of the role of cultural distance
for explaining the foreign bias in international portfolio holdings, and affirmed the statistical
explanatory power of culture for these investment biases. In his study, Karolyi used both
Hofstede and the World Values Survey (WVS) as proxies for culture and found that Hofstede’s
measures consistently outperformed WVS.
Departing from the cited studies examining the direct influence of cultural values, this
paper conceptualizes six Hofstede cultural value dimensions as contingency factors that interact
with CSP to affect CFP. Building on organizational legitimacy and salience in social judgment
research, we propose the following hypothesis to explain the moderating effects of these six
cultural value dimensions on the CSP-CFP relationship.
8
The Cultural Value Conformity Hypothesis
The cultural value conformity hypothesis contends that the interactions between CSP and
individualism/indulgence/masculinity should have a negative effect on CFP while the interaction
between CSP and long-term orientation/power distance/uncertainty avoidance should have a
positive effect on CFP. These proposed effects stem from the assertion that firms with high CSP
tend to have lower levels of organizational legitimacy in individualistic, indulgent, and
masculine cultures but higher levels of organizational legitimacy in long-term oriented, power
distant, and uncertainty avoidant cultures. Organizational legitimacy stems from congruence
between the organization and its cultural environment (Suchman 1995; Aguilera and Jackson
2003). When firms’ behaviors conform to socially constructed systems of norms, values, and
beliefs, such firms tend to have higher levels of organizational legitimacy. Firms with high
organizational legitimacy not only tend to be reputable but also may find it easier to obtain
needed resources (Dowling and Pfeffer 1975; Suchman 1995). The level of organizational
legitimacy is largely determined by the alignment between corporate actions and dominant social
values and beliefs. When firm actions are in alignment with cultural values and social beliefs,
such actions will be espoused by stakeholders. In contrast, when firm actions violate commonly
held cultural values and social beliefs, stakeholders tend to develop negative social perceptions
and censor such firms.
The individualism cultural dimension has been argued to be the most important
dimension of Hofstede’s cultural framework (Triandis 2001). Individualism emphasizes a
loosely knit social framework in which individuals are expected to pursue their own interests
whereas collectivism, the polar opposite of individualism, emphasizes the importance of working
for group interests and achieving harmony. Corporate social investments are, in many cases,
9
designed for a fair distribution of economic gains among various stakeholders and to attain
societal sustainability. As such, stakeholders in highly individualistic cultures are less likely to
espouse socially responsible firms because high CSP is incompatible with stakeholders’ social
values. Stakeholders, especially investors, are more likely to perceive that corporate social
investments are a waste of shareholders’ resources and discount the value of such investments in
highly individualistic cultures. In contrast, the promotion of the welfare of others and harmony is
espoused in collectivistic societies. Firms with high CSP are more likely to receive high levels of
organizational legitimacy in such cultures because stakeholders believe corporate social
investments help facilitate social welfare and harmony. Thus, the market is likely to attach
greater value to firms’ corporate social investments in such collectivistic cultures.
Hypothesis 1: The interaction between CSP and the individualism (collectivism) cultural value is negatively (positively) associated with firm value.
The indulgence-restraint dimension is a cultural dimension recently added to the
Hofstede cultural framework (Hofstede et al. 2010) (Hofstede, Hofstede and Minkov 2010).
Indulgent societies tend to allow relatively free gratification of natural human desires with
respect to enjoying life and having fun whereas restraint societies are more prone to believe that
such gratification should be curbed and regulated by strict norms. In this regard, indulgent
societies are less likely to give up pleasures for the sake of saving the environment. As a strong
commitment to CSP suggests that individuals may need to withhold from pursuing their own
happiness, high CSP is incommensurate with the indulgence cultural value. On the contrary, in
restraint cultures, individuals do not attach much importance to the pursuit of hedonic pleasures
and instead expect their behaviors to be strictly regulated by social norms. Given that high CSP
reflects a firm’s willingness to forego short-run financial returns and associated hedonic
10
pleasures, firms with high CSP should receive a higher level of organizational legitimacy and
thereby be valued higher in restraint cultures.
Hypothesis 2: The interaction between CSP and the indulgence (restraint) cultural value is negatively (positively) associated with firm value.
The long-term orientation cultural dimension suggests that a society attaches much
importance on the future whereas the short-term orientation cultural dimension implies that a
society pays more attention to the past and the present. As long-term oriented cultures are
willing to conserve for the future and corporate social investments may contribute to a firm’s
sustainable and long-run competitiveness and prosperity, stakeholders in such cultures are less
likely to consider corporate social investments as an agency cost and a waste of shareholders’
resources (Cheng et al. 2014). On the contrary, in short-term oriented cultures, it may be hard to
justify the value of corporate social investments given that the payoffs from such investments
take a long time to materialize (Weigelt and Camerer 1988; Fombrun and Shanley 1990; Porter
and Kramer 2011; Eccles et al. 2014). Therefore, high levels of investment in corporate social
responsibility may be detrimental to a firm’s organizational legitimacy because stakeholders in
short-term orientation cultures expect firms to focus on generating quick returns. Thus, all else
being equal, firms with high CSP are likely to be valued higher in long-term orientation cultures.
Hypothesis 3: The interaction between CSP and the long-term (short-term) orientation cultural value is positively (negatively) associated with firm value.
The power distance dimension deals with the need for dependence versus independence
in society. Inequality in a lower power distance society is seen as a necessary evil that should be
minimized whereas in a high power distance society, inequality is seen as the basis of societal
order. In other words, hierarchies are seen as an arrangement of convenience in low power
11
distance countries but as existential (superiors are seen as superior persons) in high power
distance countries (Hofstede 2001). Over the past two generations, dependence on the power of
others in a large part of the world has been reduced, commensurate with the improvement in
educational opportunities and related economic gains. Those cultures emphasizing power
distance and its emphasis on dependence within an organization’s hierarchy may spend more
resources on CSP in order to keep employees and more generally, the broader stakeholder
community “happy” and minimize the threat of revolt. On the other hand, firms in low power
distance countries need not spend as many resources on CSP since the employment environment
is already characterized by independence where subordinates are encouraged to freely interact
with their superiors. Thus, the market is likely to attach a higher value to firms’ corporate social
investments in high power distant cultures.
Hypothesis 4: The interaction between CSP and the power distance cultural value is positively associated with firm value.
The discussion of gender differences in values has been popularized by Tannen (1992),
who has shown that the key difference in discourse between males and females in the United
States (likely generalizable to all human societies) is that men are more focused on transferring
information (report talk) whereas women are more interested in exchanging feelings and
establishing relationships (rapport talk). Gender differentiation in child socialization is strong in
the masculine culture and weak in the feminine culture (Van Rossum 1998). In short,
masculinity emphasizes the importance of the “ego” side i.e. up-to-dateness, advancement,
training, earnings with little emphasis on the “social” side espoused by femininity i.e. manager,
cooperation, friendly atmosphere, physical conditions. Corporate social investments, by
definition, are focused on factors that are related to the “social” side, such as maintaining the
12
company’s reputation within the general community, being a good corporate citizen, promoting
an effective life-work balance, and focusing on long-term stability by promoting from within,
avoiding lay-offs and maintaining relations with trade unions. As a result, stakeholders in highly
masculine cultures are less likely to support socially responsible firms. Shareholders are more
likely to perceive that corporate social investments are an inefficient use of shareholders’
resources and discount the value of such investments. However, the promotion of the welfare of
others is very important in feminine societies. Firms with high CSP are more likely to receive
high levels of legitimacy because stakeholders believe corporate social investments improve
social welfare. Thus, the market is likely to attach greater value to firms’ corporate social
investments in such feminine cultures.
Hypothesis 5: The interaction between CSP and the masculinity (femininity) cultural value is negatively (positively) associated with firm value.
Uncertainty avoidance refers to the extent to which members of a culture feel threatened
by uncertain or unknown situations (Hofstede 2001). The term derives from U.S. organization
theorists Richard M. Cyert and James G. March. Organizations, they argue, avoid uncertainty in
their environment in two major ways: (1) they avoid the requirement that they correctly
anticipate events in the distant future by using decision rules emphasizing short-run reaction to
short-run feedback rather than anticipation of long-run uncertain events; and (2) they arrange a
negotiated environment by imposing plans, standard operating procedures, and industry tradition
which do not depend upon prediction of uncertain future events (Cyert and March 1963). As a
result, firms in cultures characterized by high uncertainty avoidance may face difficulties in
making profitable, strategic long-term investments and may allocate more of their investment
dollars to corporate social activities in an effort to keep the broader stakeholder community
13
satisfied when the dollars allocated to traditional investments in capital assets and research and
development underperform. In cultures that are low on the uncertainty avoidance scale,
managers are better able to anticipate long-run uncertain events and as such, do not need to
allocate as many resources to corporate social investments to hedge their risk. Thus, all else
being equal, firms with high CSP are likely to be valued higher in those cultures which are high
on the uncertainty avoidance dimension.
Hypothesis 6: The interaction between CSP and the uncertainty avoidance cultural value is positively associated with firm value.
III. SAMPLE SELECTION AND VARIABLES
3.1 Sample Selection
Our primary data source is Thomson Reuters’ ASSET4, previously used by Cheng et al.
(2014), Ioannou and Serafeim (2012), and Eccles et al. (2014). Founded in 2003 in Switzerland,
ASSET4 is a leading provider of objective, comparable and systematic information that offers
professional investors and corporations with the world’s largest database of environmental,
social, and governance (ESG) information. ASSET4 employs over 100 analysts to collect
relevant, comparable and up-to-date information from publicly available data sources, including
CSR annual reports, stock exchange filings, and news sources. Sample selection bias is reduced
by using all firms listed on the ASX 300, Bovespa, CAC 40, DAX, FTSE 250, MSCI Emerging
Markets, MSCI World, NASDAQ 100, S&P500, SMI, and STOXX 600 stock exchanges. The
ASSET4 ESG ratings are equally weighted assessments of company performance based on over
250 key performance indicators. These ratings are standardized and normalized to position the
score between 0% and 100%. Annually, more than 750 data points are used as inputs to a default
equal-weighted framework to calculate more than 280 key performance indicators (KPIs). The
14
overall ESG performance score can be further organized into 18 categories under four pillars: (1)
environmental performance score, which includes resource reduction, emission reduction and
product innovation; (2) social performance score, which considers employment quality, health
and safety, training and development, diversity, human rights, community, and product
responsibility; (3) corporate governance score, which addresses board structure, compensation
policy, board functions, shareholder rights, vision and strategy; and (4) economic performance
score, which considers client loyalty, performance, and shareholder loyalty. A firm receives a z-
score in each year t for each of the four pillars by benchmarking its performance against the rest
of the firms based on the information available in fiscal year t-1. For example, an environmental
performance score in 2005 reflects a firm’s investments in resource reduction, emission
reduction and production in 2004. Thus, ESG rating scores are lagged by one year by
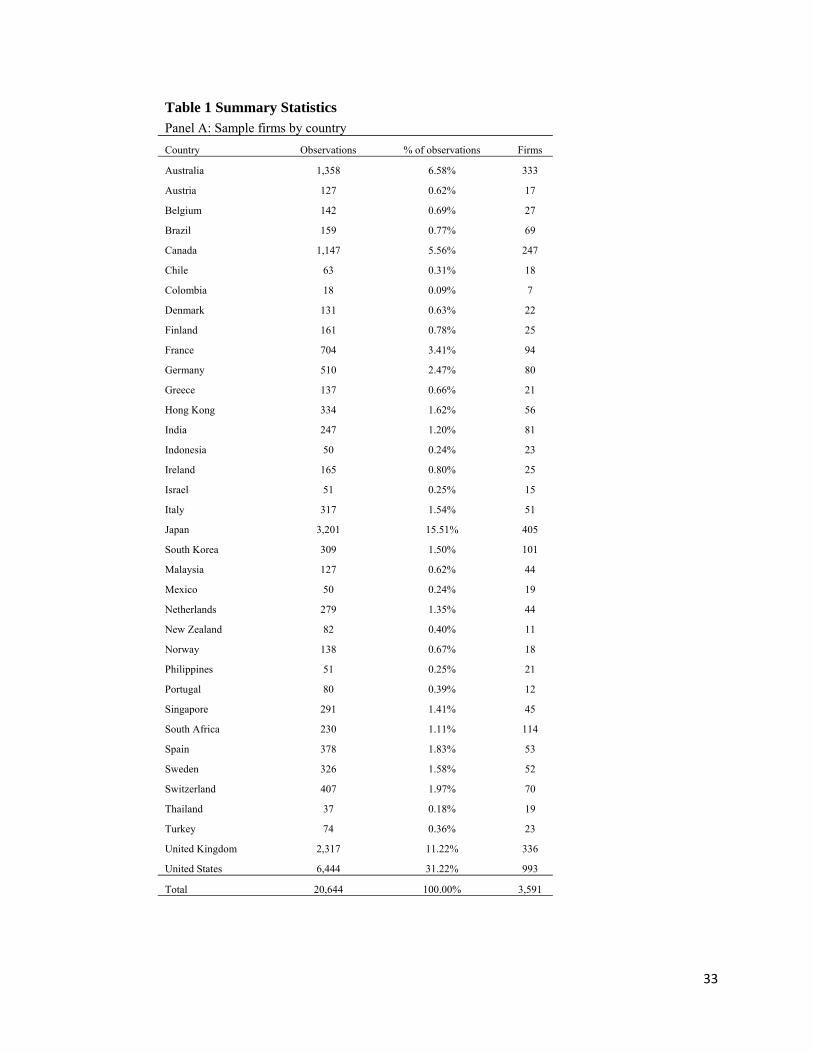
construction. After matching with all other variables, we have 20,644 firm-year observations
from 36 countries between 2001 and 2011. The breakdown of observations by country is shown
in Table 1, Panel A. The United States represents 31.22% of sample firm-year observations,
followed by Japan (15.51%), the United Kingdom (11.22%), Australia (6.58%) and Canada
(5.56%).
3.2 Variables
3.2.1 Measures of CSP and CFP.
Three proxies are used to measure corporate social performance. The first measure is a
composite CSP index. Following Ioannou and Serafeim (2012), we use the annual environmental
and social scores to create a composite CSP index. We exclude annual economic and corporate
governance scores because these two pillars do not bear direct relationship with CSP. Because
we do not have theoretical guidance regarding the weights of the environmental and social scores
15
to create the CSP index, we follow convention and assign equal weights to the two pillars
(Hillman and Keim 2001; Waddock and Graves 1997). The variable “CSP index” is thus an
equally weighted average of the environmental and social pillars of ASSET4 for the focal firm
for each year in the panel dataset. We also use the two pillars independently to measure CSP:
environmental performance score (environmental) and social performance score (social).
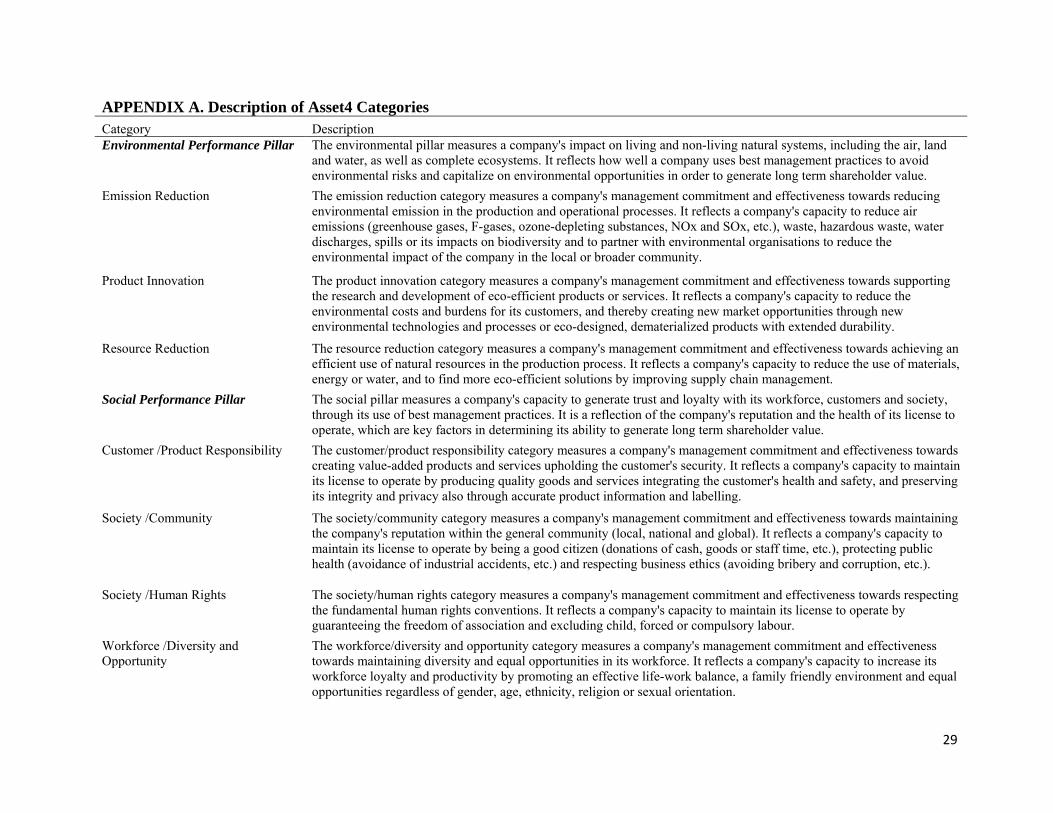
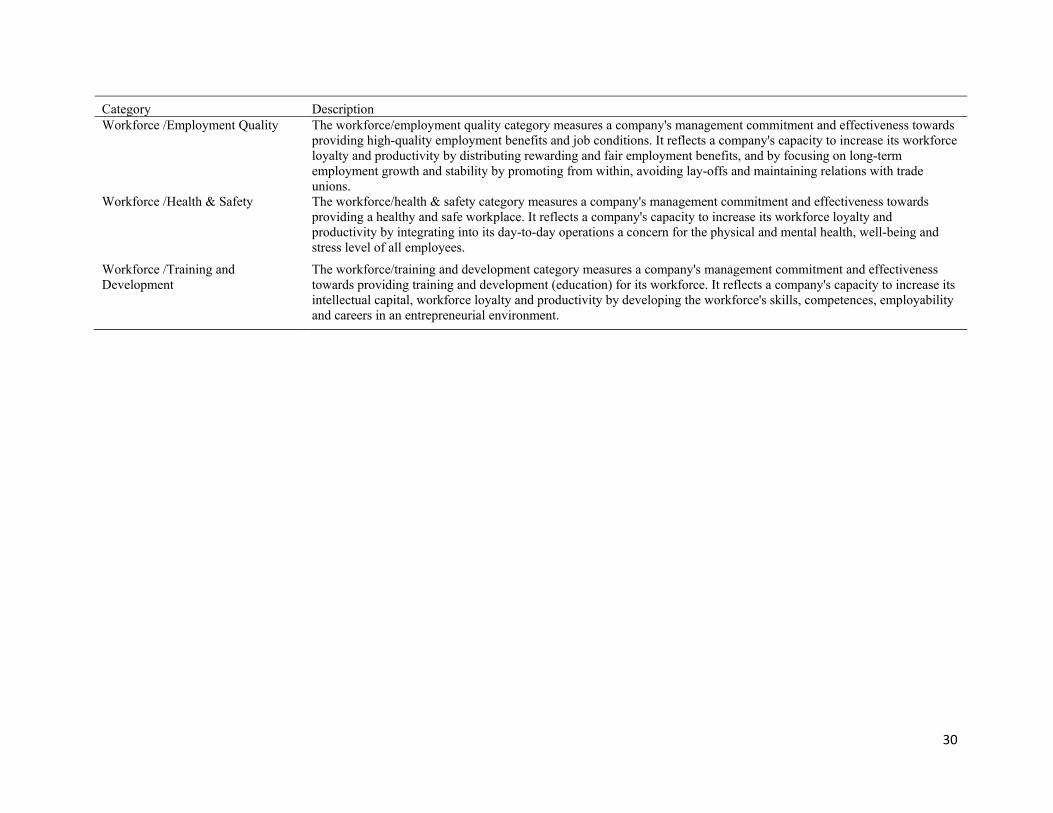
Detailed descriptions of the components of these two scores are presented in Appendix A.
We measure firm value using Tobin’s q. Tobin’s q has been widely used in finance and
accounting to proxy for firm valuation (Lang, Lins and Miller 2004; Lewellen and Badrinath
1997) and as an indicator of intangible value in economics (Lindenberg and Ross 1981). Tobin’s
q is defined as (book value of assets + (market value of equity – book value of equity))/book
value of assets. The use of Tobin’s q in this study is two-fold: first, it reflects historical firm
performance; and second, it encompasses investors’ perception of likely future performance. To
the extent that investors’ perceptions about a company are influenced by culture and corporate
social investments, there should be an impact on firm valuation.
3.2.2 Measures of culture.
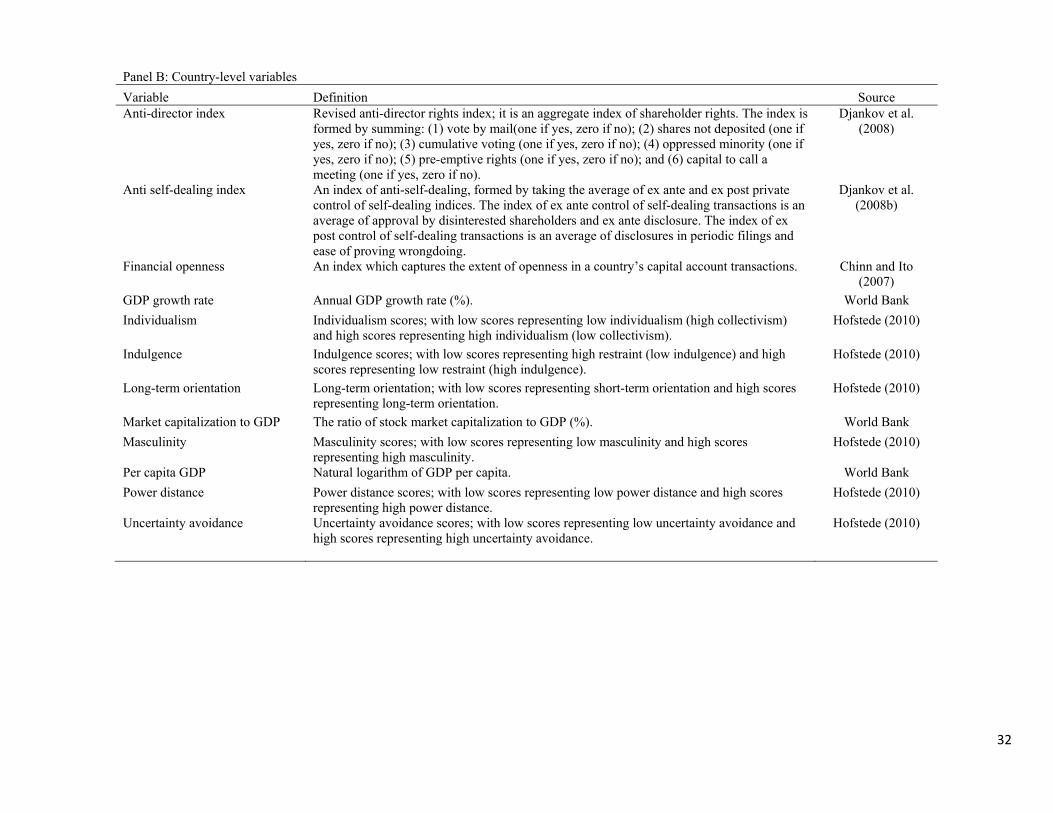
The six measures of national cultural values that we use in our study are Hofstede’s
(1980, 2001, 2010) dimensions of individualism, indulgence, long-term orientation, power
distance, masculinity, and uncertainty avoidance. Similar to other recent studies using
Hofstede’s cultural values (Li et al. 2011, 2013; Lievenbruck and Schmid 2014; Shao et al.
2013), these measures are time-invariant. Given that cultural values are relatively stable over
time, we do not perceive that such invariant measures will significantly affect our findings.
16
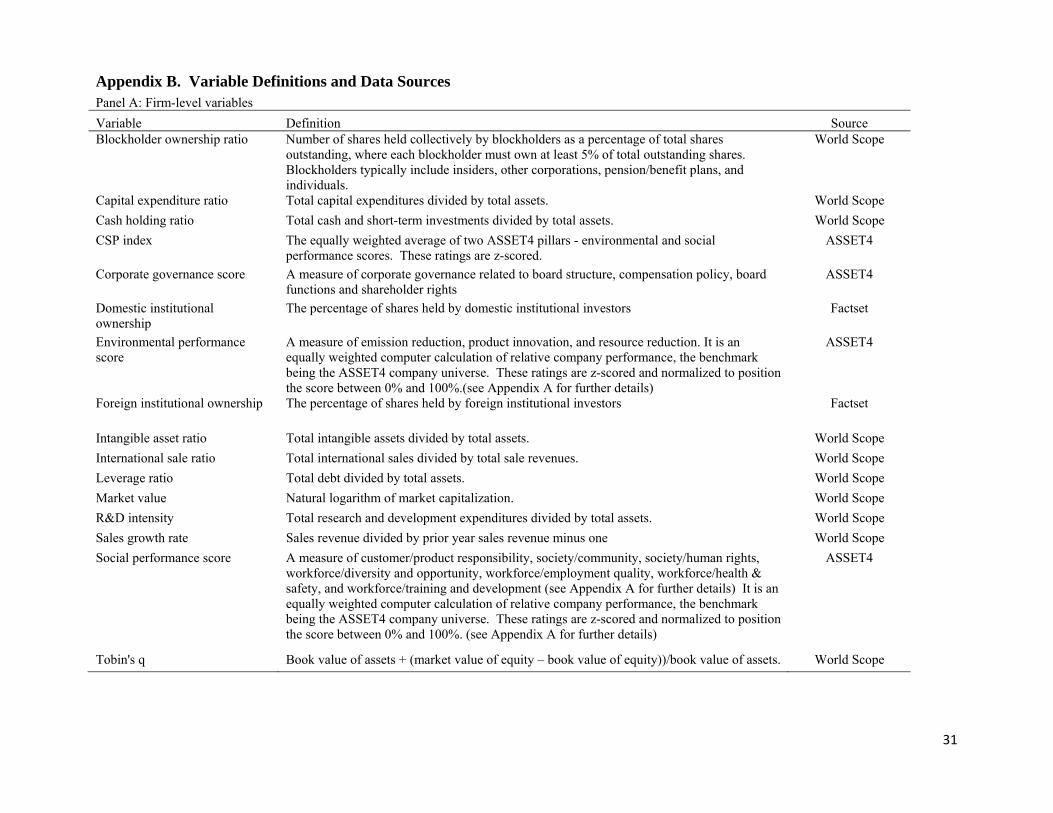
3.2.3 Other variables of interest
We include a number of firm-level variables that can affect CFP. First, we control for
firm size, capital investment intensity (capital intensity), research and development intensity
(R&D intensity), percentage of shares held by block holders (blockholder ratio), corporate
governance score, cash holding ratio, intangible asset ratio, leverage ratio, the percentage of
shares held by foreign and domestic institutional owners (foreign institutional
ownership/domestic institutional ownership), and the sales growth rate. In addition, we include
international sale ratio as a control variable because foreign stakeholders’ cultural values may
play a more salient role in affecting CFP when firms have high levels of international sales. At
the country level, we include the following variables as controls: per capital gross domestic
product (per capita GDP), market capitalization to GDP, annual GDP growth rate, anti-director
index, anti self-dealing index, and financial openness. The definitions of variables and data
sources used in this study are presented in Appendix B.
IV. EMPIRICAL METHODS
After matching all the variables used in our study, we have firms from 36 different
countries. At the firm level, we have over 3,500 firms. Given the multilevel data structure (with
culture being a country-level variable and CSP/CFP being firm-specific variables), it is important
to distinguish the effects at the country level from those at the individual firm level, to
understand the role of country- versus firm-level factors, and to model their interactions
properly. Following existing literature, we employ a hierarchical linear model (HLM) to examine
the multilevel data (Goldstein 2003; Peterson, Arregle and Martin 2012; Raudenbush and Bryk
2002). The set of firms within countries form the base-level observations while countries form
17
the higher-level observations. Using a HLM has three advantages (Li et al. 2013). First, HLM
separates the variance in firm-level financial performance into what is determined at the firm-
level versus country-level predictors by using a mean-centered approach to firm-level variables.
Second, the HLM framework allows for correction of the distortion caused by varying sample
sizes across countries. Third, HLM can better incorporate cross-level interactions between the
firm- and country-level variables because HLMs enable the pooling of firm-level effects across
countries while examining country-level relationships simultaneously.
We pre-process the data to decompose the country- and firm-level variance in firm
financial performance (Li et al. 2013). For country-level variables, we center by their grand
means (averaged across countries) with every transformed variable having a mean of zero. We
add the suffix “_ctry” to denote these variables. For firm-level variables, we center by their
grand means (averaged across firms and countries), with these transformed variables also having
a mean of zero. Afterwards, we create country-level mean values (averaged within a country) on
these grand-mean-centered variables and add the suffix “_ctrymean”. Lastly, we create within-
country residuals by taking the grand-mean adjusted variables and subtracting the corresponding
within-country means. These firm-level deviations from their corresponding country-level means
are named by adding the suffix “_firmdev”.
Such a treatment of data has the following advantages (Li et al. 2011, 2013). By centering
within-country variables (varying by firm) and adding country-level means, we are able to
separate the between-country covariance from the within-country covariance. Moreover, this
decomposition helps examine the potentially distinct effects of firm characteristics at the
individual firm- and average country-level. In addition, mean-centered independent variables
enable more efficient estimation and interpretation of interactions.
18
To explore the interaction effect of cultural values and CSP on CFP, we regress CFP
measures on variables that capture firm characteristics and country-level cultural values. The
HLM specification is shown as following, with the intercept term set as a random coefficient:
j 1 i,j 2 i,j 3 i,j
4 i,j 5 i,j 6 i,j 7
Firm performance = α +β capital_intensity_firmdev +β blockholder_firmdev +β RD_i _firmdev
+β intangible_ratio_firmdev +β firm_size_firmdev +
ntensity
β debt_ratio_firmdev +β international_sal i,j
8 i,j 9 i,j 10 i,j 11 i,j
12 i,j 13 i,j 14 i,j
e
ntens
_firmdev
+β CSP_firmdev +β capital_intensity_ctrymean +β blockholder_ctrymean +β RD_i _ctrymean
+β intangible_ratio_ctrymean +β firm_size_ctrymean +β debt_ratio_ctrymean
ity
+ 15 i,j
16 j 17 j 18 j 19 j 21 j 22 j
23 j 24
ale
apital_GDP creditor shar
β international_s _ctrymean
+β CSP_ctrymean +β per_c _ctry +β _ctry +β _ctry +β GDP_growth_ctry +β gini_ctry
+β market_capitalization_ctry +β cultural_va
eho
lu
lder
e_ct j
25 i,j j i,j
ry +Industry FEs+Year FEs
+β CSP_firmdev *cultural_value_ctry + e
For firm i from country j, our performance measure is Tobin’s q. CSP can be the CSP
index, environmental performance, or social performance. Cultural values can be individualism,
indulgence, long-term orientation, power distance, masculinity, or uncertainty avoidance.
Following Li et al. (2013), we interact national cultural values with firm-level CSP deviations.
We also include two-digit SIC code dummies and year dummies in all regression models. The
dependent variable is measured at time t, with all other variables measured at time t-1.
V. RESULTS
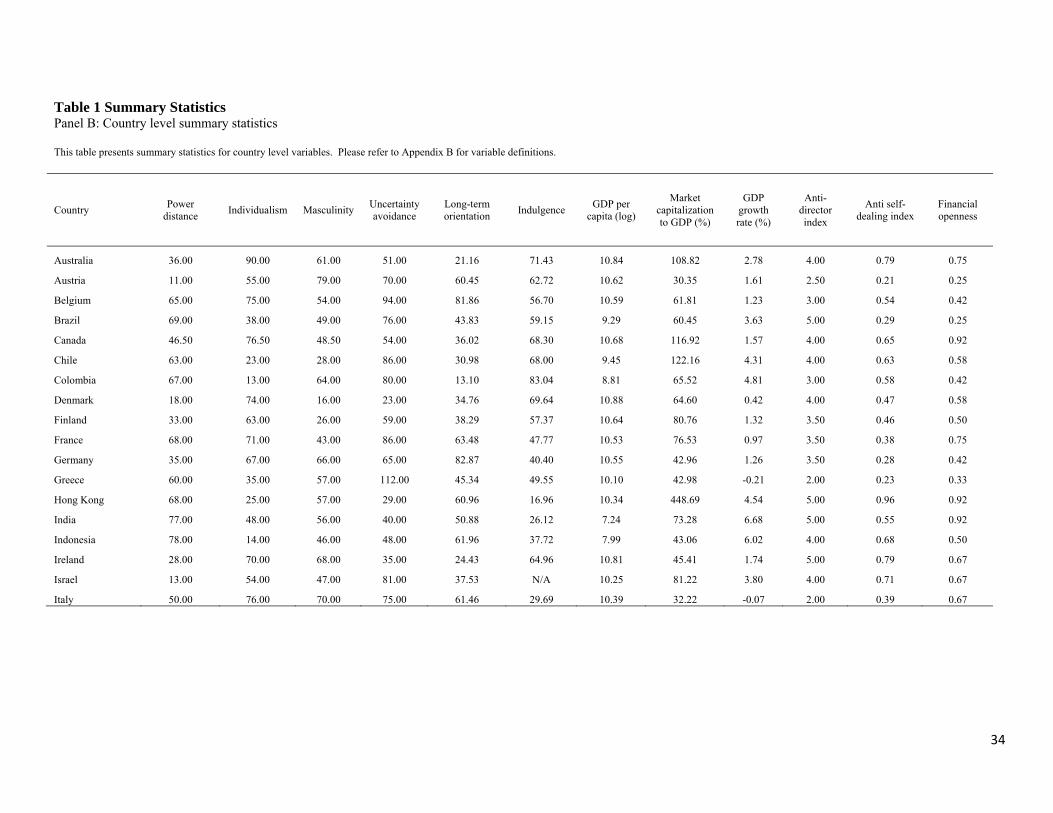
Table 1, Panel B and Panel C show summary statistics for country-level and firm-level
variables respectively.
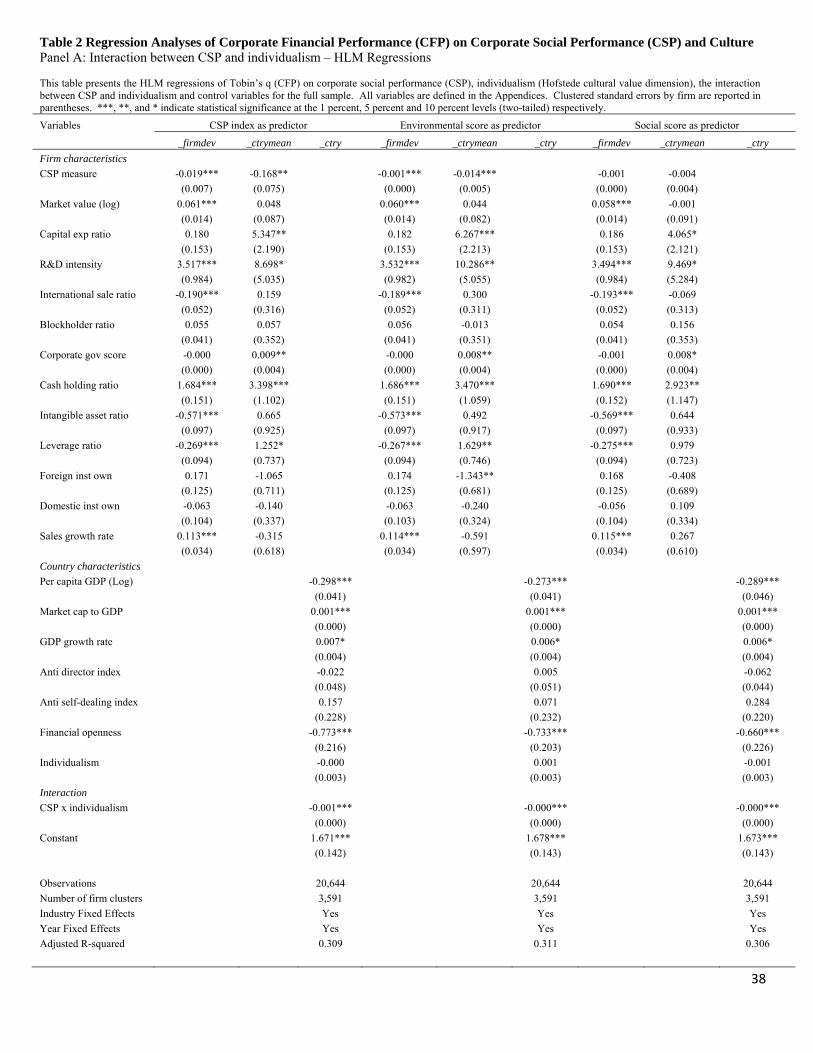
Table 2 presents the estimation results. Panel A reports interactions between
individualism and the three CSP measures. In Table 2, Panel A we find that the coefficient
estimate of the CSP measure “_firmdev” is negative and statistically significant for the CSP
index and the environmental score CSP proxy (-0.019 for CSP index, -0.001 for environmental
score), while the coefficient estimate of the CSP measure “_ctrymean” is also negative and
statistically significant for these two proxies (-0.168 for CSP index, -0.014 for environmental
19
score). Such a finding suggests that at the country level, high CSP is negatively associated with
Tobin’s q and that a firm’s deviation above the country-level average CSP is also negatively
associated with Tobin’s q. The interactions between individualism and all three CSP measures
(CSP index, environmental performance, and social performance) are all negative and
statistically significant, lending support to Hypothesis 1.
Table 2, Panel B reports interactions between uncertainty avoidance and the three CSP
measures. We find no statistically significant interactions between uncertainty avoidance and the
three measures of CSP and as such, no support for Hypothesis 6. Table 2, Panel C reports
interactions between long-term orientation and the three CSP measures. We find statistically
significant positive interactions between long-term orientation and the three measures of CSP,
lending support to Hypothesis 3. Table 2, Panel D reports interactions between indulgence and
the three CSP measures. We find statistically significant negative interactions between
indulgence and the three measures of CSP, lending support to Hypothesis 2. Table 2, Panel E
reports interactions between power distance and the three CSP measures. We find statistically
significant positive interactions between power distance and the three measures of CSP, lending
support to Hypothesis 4. Table 2, Panel F reports interactions between masculinity and the three
CSP measures. We find no statistically significant interactions between masculinity and the
three measures of CSP and as such, no support for Hypothesis 5.
In summary, results from Table 2 suggest that the interactions between
individualism/indulgence and CSP exert a negative influence on firm value whereas the
interactions between long-term orientation/power distance and CSP measures exert a positive
influence on firm value, supporting the cultural value conformity hypothesis. The negative and
statistically significant coefficient estimate of CSP “_ctrymean” for CSP index and
20
environmental score corroborates the findings of previous studies by Fogler and Nutt 1975,
Frooman 1997, Griffin and Mahon 1997, and Vance 1975.
VI. SUPPLEMENTARY ANALYSES
6.1. OLS Regressions
Our main analyses use a hierarchical linear model to estimate the interaction effect of
culture and CSP on firm valuation. However, recognizing the fact that OLS regressions are more
commonly used, we supplement our analyses with pooled time-series OLS regressions. Table 3
summarizes the results. In general, the results are consistent with the HLM analyses. More
specifically, the interaction effect between CSP and individualism is negative (-0.027 coefficient
estimate), the interaction effect between CSP and indulgence is negative (-0.018 coefficient
estimate), and the interaction effect between CSP and power distance is positive (0.033
coefficient estimate). However, the interaction effect between CSP and long-term orientation,
while positive (0.006 coefficient estimate), is now statistically insignificant. The relation
between CSP and Tobin’s q is negative, consistent with results from our HLM analyses above.
Lastly, the main effect of the cultural dimensions on firm valuation is positive for individualism
and indulgence but negative for long-term orientation, uncertainty avoidance, power distance,
and masculinity. For all OLS regressions, both industry and year fixed effects are included.
6.2. Subgroup Analyses
The cultural value conformity hypothesis states that the optimal strategy to maximize
firm performance is to conform to social norms with respect to CSP expenditures. As such, the
question remains as to why some firms still deviate from this optimal point. In an attempt to
address this question, Table 4, Panel A splits the sample into two time periods: (1) early –
21
defined as the years 2003 to 2008; and (2) late – defined as the years 2009 to 2012. Since focus
on CSP is a relatively new phenomenon in many countries, we expect to see the interaction
effect of CSP and culture to be stronger in the later years as firms attempt to reach this optimal
point. The results are broadly consistent with expectations. For example, looking at
individualism, the significance on the interaction term has increased from 5% significance in the
early period to 1% significance in the later period (co-efficient magnitude of -0.001 for both
periods). Turning to long-term orientation, the magnitude/significance of the interaction term
has increased from 0.000 (10% significance) to 0.001 (5% significance). For indulgence, the
magnitude/significance of the interaction term has increased from -0.001 (10% significance) to -
0.002 (1% significance). Finally, for power distance, the magnitude/significance has increased
from 0.001 (10% significance) to 0.002 (1% significance).
Table 4, Panel B presents a similar analysis to that shown in Panel A. However, instead
of partitioning on years, Panel B partitions on low and high levels of institutional ownership
where low/high is defined as below/above median. Based on firm fundamentals, then, a
pragmatic investor (i.e. institutional investor) is not influenced by firm “window dressing” i.e.
spending resources on CSP to meet cultural convention. Retail investors, on the other hand, are
likely influenced by firms’ strategic allocation of resources to CSP expenditures. Panel B results
are in line with expectations. For each of individualism, long-term orientation, indulgence, and
power distance, the interaction of CSP with culture is only significant for the subsample where
institutional ownership is low. More specifically, the coefficient on individualism is -0.001, the
coefficient on long-term orientation is 0.001, the coefficient on indulgence is -0.002, and the
coefficient on power distance is 0.002.
22
6.3. Other Robustness Checks
To verify that our results are not driven by the one year time lag between a CSP
performance score in year t reflecting a firm’s corresponding CSP investment in year t-1, we lag
our dependent variables by two years instead of one year. We find similar results to those
reported in Table 2. Third, Kreft (1996) suggests that there needs to be at least 30 observations
per group in HLM models. As the number of firm-year observations for some countries is less
than 30 in our dataset, we re-examine our hypotheses without including these countries and find
similar results.
VII. CONCLUSION
Using Hofstede’s six cultural value dimensions – individualism, indulgence, long-term
orientation, power distance, masculinity, and uncertainty avoidance - to proxy for country level
cultural values, we investigate how firm financial performance is affected by corporate social
performance initiatives and national cultural values. Based on a sample of 3,591 firms from 36
countries, we find that the interactions between CSP measures and individualism/indulgence
negatively affect firm value whereas the interactions between CSP measures and long-term
orientation/power distance positively impact firm value.
The impact of CSP initiatives on corporate financial performance has been contentious,
from both a theoretical perspective and from related empirical evidence. While Friedman (1970)
and other neoclassical economists would argue that adopting environmental and social policies
can be detrimental to shareholders’ wealth and value, other scholars adopting a stakeholder
theory perspective would argue that high CSP can translate into high CFP because managing
23
relationships with stakeholders, in addition to shareholders, are conducive to building a
company’s competitive advantage (Donaldson & Preston, 1995; Freeman, 1984).
We provide strong empirical support for a cultural value conformity hypothesis, whereby
corporate financial performance is maximized when a firm’s CSP initiatives are aligned with the
cultural values of the country where the firm resides (i.e. “when in Rome, do as the Romans
do”). Said another way, our findings highlight the importance of stakeholders’ cultural values in
shaping their perceptions about CSP initiatives, which in turn influences the CSP-CFP
relationship. High CSP is more likely to be evaluated positively in those countries where
national cultural values are compatible with the theme of corporate social investments.
This paper contributes to a growing field of research that explores the influence of CSP
on CFP by illustrating the moderating effect of cultural values. Future research could examine
whether cultural and CSP initiatives interact in a similar way when CSP initiatives are explored
at the individual CEO level in addition to the firm level. In conclusion, we strongly believe that
identifying the boundary of cultural values and its impact on the CSP/CFP relationship is an
emerging area of interest; one that will continue to provide useful insights to our society in the
future.
24
REFERENCES
Adams, R.B., A.N. Licht, L. Sagiv. 2011. Shareholders and stakeholders: How do directors decide? Strategic Management Journal 32(12): 1331-1355.
Aguilera, R.V., and G. Jackson. 2003. The cross-national diversity of corporate governance: Dimensions and determinants. Academy of Management Review 28(3): 447-465.
Ahern, K.R., D. Daminelli, C. Fracassi. forthcoming. Lost in translation? The effect of cultural values on mergers around the world. Journal of Financial Economics(0).
Aldrich, H.E., C.M. Fiol. 1994. Fools rush in? The institutional context of industry creation. Academy of Management Review 19(4): 645-670.
Brammer, S., A. Millington. 2008. Does it pay to be different? An analysis of the relationship between corporate social and financial performance. Strategic Management Journal 29(12): 1325-1343.
Chen, Y.R., K. Leung, C.C. Chen. 2009. Bringing national culture to the Table: Making a difference with cross-cultural differences and perspectives. Academy of Management Annals 3: 217-249.
Cheng, B., I. Ioannou, and G. Serafeim. 2014. Corporate social responsibility and access to finance. Strategic Management Journal 35(1): 1-23.
Chui, A.C.W., A.E. Lloyd, C.C.Y. Kwok. 2002. The determination of capital structure: Is national culture a missing piece to the puzzle? Journal of International Business Studies 33(1): 99-127.
Cyert, R.M., J.G. March. 1963. A behavioral theory of the firm. Prentice Hall, Englewood Cliffs, NJ.
Djankov, S., C. McLeish, A. Shleifer. 2007. Private credit in 129 countries. Journal of Financial Economics 84: 299-329.
Donaldson, T., L.E. Preston. 1995. The stakeholder theory of the corporation: Concepts, evidence, and implications. Academy of Management Review 20(1): 65-91.
Dowell, G., S. Hart, B. Yeung. 2000. Do corporate global environmental standards create or destroy market value? Management Science 46(8): 1059-1074.
Dowling, J., J. Pfeffer. 1975. Organizational legitimacy: Social values and organizational behavior. Pacific Sociological Review 18(1): 122-136.
25
Eccles, R.G., I. Ioannou, G. Serafeim. 2014. The Impact of Corporate Sustainability on Organizational Processes and Performance. Management Science, forthcoming.
Flammer, C. 2014. Does Corporate Social Responsibility Lead to Superior Financial Performance? A Regression Discontinuity Approach. Management Science, forthcoming.
Fogler, H.R., F. Nutt. 1975. A Note on Social Responsibility and Stock Valuation. Academy of Management Journal 18(1): 155-160.
Fombrun, C., and M. Shanley. 1990. What's in a name? Reputation building and corporate strategy. Academy of Management Journal 33(2): 233-258.
Freeman, R.E. 1984. Strategic management: A stakeholder approach. Pitman, Boston.
Friedman, M. 1970. The social responsibility of business is to increase its profits. New York Times Magazine, 32-33, 122, 124, 126.
Frooman, J. 1997. Socially Irresponsible and Illegal Behavior and Shareholder Wealth: A Meta-Analysis of Event Studies. Business & Society 36(3): 221-249.
Goldstein, H. 2003. Multilevel statistical models, 3rd ed. E. Arnold, London.
Goll, I., A.A. Rasheed. 2004. The moderating effect of environmental munificence and dynamism on the relationship between discretionary social responsibility and firm performance. Journal of Business Ethics 49(1): 41-54.
Griffin, J.J., J.F. Mahon. 1997. The corporate social performance and corporate financial performance debate: Twenty-five years of incomparable research. Business and Society 36(1): 5-31.
Guiso, L., P. Sapienza, L. Zingales. 2003. People's opium? Religion and economic attitudes. Journal of Monetary Economics 50(1): 225-282.
Guiso, L., P. Sapienza, L. Zingales. 2006. Does culture affect economic outcomes? Journal of Economic Perspectives 20(2): 23-48.
Guiso, L., P. Sapienza, L. Zingales. 2009. Cultural biases in economic exchange? Quarterly Journal of Economics 124(3): 1095-1131.
Hillman, A.J., G.D. Keim. 2001. Shareholder value, stakeholder management, and social issues: What's the bottom line? Strategic Management Journal 22(2): 125-139.
Hofstede, G. 1980. Culture's consequences: International differences in work-related values. Sage, Thousand Oaks.
26
Hofstede, G.H. 2001. Culture's consequences: Comparing values, behaviors, institutions, and organizations across nations, 2nd ed. Sage Thousand Oaks, CA.
Hofstede, G.H., G.J. Hofstede, M. Minkov. 2010. Cultures and organizations: Software of the mind, 3rd ed. McGraw-Hill, New York.
House, R., M. Javidan, P. Hanges, P. Dorfman. 2002. Understanding cultures and implicit leadership theories across the globe: an introduction to project GLOBE. Journal of World Business 37(1): 3-10.
Inglehart, R., C. Welzel. 2005. Modernization, cultural change, and democracy : the human development sequence. Cambridge University Press, Cambridge, UK ; New York.
Ioannou, I., G. Serafeim. 2012. What drives corporate social performance? The role of nation-level institutions. Journal of International Business Studies 43(9): 834-864.
Jensen, M.C. 2002. Value maximization, stakeholder theory, and the corporate objective function. Business Ethics Quarterly 12(2): 235-256.
Karolyi, G.A. 2015. The gravity of culture for finance. Available at SSRN: http://ssrn.com/abstract=2600702.
King, A., M. Lenox. 2002. Exploring the locus of profitable pollution reduction. Management Science 48(2): 289-299.
Kock, C.J., J. Santalo, and L. Diestre. 2012. Corporate governance and the environment: What type of governance creates greener companies. Journal of Management Studies 49(3): 492-514.
Kreft, I.G.G. 1996. Are multilevel techniques necessary? An overview, including simulation studies. California State University at Los Angeles, Los Angeles, CA.
Lang, M.H., K.V. Lins, D.P. Miller. 2004. Concentrated control, analyst following, and valuation: Do analysts matter most when investors are protected least? Journal of Accounting Research 42(3): 589-623.
Lev, B., C. Petrovits, and S. Radhakrishnan. 2010. Is doing good good for you? How corporate charitable contributions enhance revenue growth. Strategic Management Journal 31(2): 182-200.
Lewellen, W.G., S.G. Badrinath. 1997. On the measurement of Tobin's q. Journal of Financial Economics 44(1): 77-122.
27
Li, K., D. Griffin, H. Yue, L.K. Zhao. 2011. National culture and capital structure decisions: Evidence from foreign joint ventures in China. Journal of International Business Studies 42(4): 477-503.
Li, K., D. Griffin, H. Yue, L.K. Zhao. 2013. How does culture influence corporate risk-taking? Journal of Corporate Finance 23: 1-22.
Lievenbruck, M., T. Schmid. 2014. Why do firms (not) hedge? - Novel evidence on cultural influence. Journal of Corporate Finance 25: 92-106.
Lindenberg, E.B., S.A. Ross. 1981. Tobin's q ratio and industrial organization. Journal of Business 54(1): 1-32.
Luo, X., H. Wang, S. Raithel, and Q. Zheng. 2015. Corporate social performance, analyst stock recommendations, and firm future returns. Strategic Management Journal 36(1): 123-136.
Margolis, J.D., H.A. Elfenbein, J.P. Walsh. 2009. Does it pay to be good ... and does it matter? A meta-analysis of the relationship between corporate and financial performance. Harvard Business School.
Margolis, J.D., J.P. Walsh. 2003. Misery loves companies: Rethinking social initiatives by business. Administrative Science Quarterly 48(2): 268-305.
North, D. 1990. Institutions, institutional change, and economic performance. Cambridge University Press, Cambridge.
Orlitzky, M., F.L. Schmidt, S.L. Rynes. 2003. Corporate social and financial performance: A meta-analysis. Organization Studies 24(3): 403-441.
Peterson, M.F., J.L. Arregle, X. Martin. 2012. Multilevel models in international business research. Journal of International Business Studies 43(5): 451-457.
Porter, M.E., and M.R. Kramer. 2011. Creating shared value. Harvard Business Review January-February.
Raudenbush, S.W., A.S. Bryk. 2002. Hierarchical linear models: Applications and data analysis methods. Sage, Thousands Oak, CA.
Shao, L., C.C.Y. Kwok, R. Zhang. 2013. National culture and corporate investment. Journal of International Business Studies 44(7): 745-763.
Slawinski, N., and P. Bansal. 2015. Short on time: Intertemporal tensions in business sustainability. Organization Science in press, doi: 10.1287/orsc.2014.0960.
28
Stulz, R.M., R. Williamson. 2003. Culture, openness, and finance. Journal of Financial Economics 70(3): 313-349.
Suchman, M.C. 1995. Managing legitimacy: Strategic and institutional approaches. Academy of Management Review 20(3): 571-610.
Tannen, D. 1992. You just don't understand: women and men in conversation. Virago, London.
Treisman, D. 2000. The causes of corruption: a cross-national study. Journal of Public Economics 76(3): 399-457.
Triandis, H.C. 2001. Individualism-collectivism and personality. Journal of Personality 69(6): 907-924.
Van Rossum, J.H. 1998. Why children play: American versus Dutch boys and girls. In G. Hofstede & Associates, Masculinity and femininity: The taboo dimension of national cultures 130-138 Sage, Thousand Oaks, CA.
Vance, S. 1975. Are socially responsible firms good investment risks? Management Review 64: 18-24.
Waddock, S.A., S.B. Graves. 1997. The corporate social performance - financial performance link. Strategic Management Journal 18(4): 303-319.
Weigelt, K., and C. Camerer. 1988. Reputation and corporate strategy: A review of recent theory and applications. Strategic Management Journal 9(5): 443-454.
Williamson, Q.E. 2000. The new institutional economics: Taking stock, looking ahead. Journal of Economic Literature 38(3): 595-613.
29
APPENDIX A. Description of Asset4 Categories
Category Description Environmental Performance Pillar The environmental pillar measures a company's impact on living and non-living natural systems, including the air, land
and water, as well as complete ecosystems. It reflects how well a company uses best management practices to avoid environmental risks and capitalize on environmental opportunities in order to generate long term shareholder value.
Emission Reduction The emission reduction category measures a company's management commitment and effectiveness towards reducing environmental emission in the production and operational processes. It reflects a company's capacity to reduce air emissions (greenhouse gases, F-gases, ozone-depleting substances, NOx and SOx, etc.), waste, hazardous waste, water discharges, spills or its impacts on biodiversity and to partner with environmental organisations to reduce the environmental impact of the company in the local or broader community.
Product Innovation The product innovation category measures a company's management commitment and effectiveness towards supporting the research and development of eco-efficient products or services. It reflects a company's capacity to reduce the environmental costs and burdens for its customers, and thereby creating new market opportunities through new environmental technologies and processes or eco-designed, dematerialized products with extended durability.
Resource Reduction The resource reduction category measures a company's management commitment and effectiveness towards achieving an efficient use of natural resources in the production process. It reflects a company's capacity to reduce the use of materials, energy or water, and to find more eco-efficient solutions by improving supply chain management.
Social Performance Pillar The social pillar measures a company's capacity to generate trust and loyalty with its workforce, customers and society, through its use of best management practices. It is a reflection of the company's reputation and the health of its license to operate, which are key factors in determining its ability to generate long term shareholder value.
Customer /Product Responsibility The customer/product responsibility category measures a company's management commitment and effectiveness towards creating value-added products and services upholding the customer's security. It reflects a company's capacity to maintain its license to operate by producing quality goods and services integrating the customer's health and safety, and preserving its integrity and privacy also through accurate product information and labelling.
Society /Community The society/community category measures a company's management commitment and effectiveness towards maintaining the company's reputation within the general community (local, national and global). It reflects a company's capacity to maintain its license to operate by being a good citizen (donations of cash, goods or staff time, etc.), protecting public health (avoidance of industrial accidents, etc.) and respecting business ethics (avoiding bribery and corruption, etc.).
Society /Human Rights The society/human rights category measures a company's management commitment and effectiveness towards respecting the fundamental human rights conventions. It reflects a company's capacity to maintain its license to operate by guaranteeing the freedom of association and excluding child, forced or compulsory labour.
Workforce /Diversity and Opportunity
The workforce/diversity and opportunity category measures a company's management commitment and effectiveness towards maintaining diversity and equal opportunities in its workforce. It reflects a company's capacity to increase its workforce loyalty and productivity by promoting an effective life-work balance, a family friendly environment and equal opportunities regardless of gender, age, ethnicity, religion or sexual orientation.
30
Category Description Workforce /Employment Quality The workforce/employment quality category measures a company's management commitment and effectiveness towards
providing high-quality employment benefits and job conditions. It reflects a company's capacity to increase its workforce loyalty and productivity by distributing rewarding and fair employment benefits, and by focusing on long-term employment growth and stability by promoting from within, avoiding lay-offs and maintaining relations with trade unions.
Workforce /Health & Safety The workforce/health & safety category measures a company's management commitment and effectiveness towards providing a healthy and safe workplace. It reflects a company's capacity to increase its workforce loyalty and productivity by integrating into its day-to-day operations a concern for the physical and mental health, well-being and stress level of all employees.
Workforce /Training and Development
The workforce/training and development category measures a company's management commitment and effectiveness towards providing training and development (education) for its workforce. It reflects a company's capacity to increase its intellectual capital, workforce loyalty and productivity by developing the workforce's skills, competences, employability and careers in an entrepreneurial environment.
31
Appendix B. Variable Definitions and Data Sources Panel A: Firm-level variables
Variable Definition Source Blockholder ownership ratio Number of shares held collectively by blockholders as a percentage of total shares
outstanding, where each blockholder must own at least 5% of total outstanding shares. Blockholders typically include insiders, other corporations, pension/benefit plans, and individuals.
World Scope
Capital expenditure ratio Total capital expenditures divided by total assets. World Scope
Cash holding ratio Total cash and short-term investments divided by total assets. World Scope
CSP index The equally weighted average of two ASSET4 pillars - environmental and social performance scores. These ratings are z-scored.
ASSET4
Corporate governance score A measure of corporate governance related to board structure, compensation policy, board functions and shareholder rights
ASSET4
Domestic institutional ownership
The percentage of shares held by domestic institutional investors Factset
Environmental performance score
A measure of emission reduction, product innovation, and resource reduction. It is an equally weighted computer calculation of relative company performance, the benchmark being the ASSET4 company universe. These ratings are z-scored and normalized to position the score between 0% and 100%.(see Appendix A for further details)
ASSET4
Foreign institutional ownership The percentage of shares held by foreign institutional investors Factset
Intangible asset ratio Total intangible assets divided by total assets. World Scope
International sale ratio Total international sales divided by total sale revenues. World Scope
Leverage ratio Total debt divided by total assets. World Scope
Market value Natural logarithm of market capitalization. World Scope
R&D intensity Total research and development expenditures divided by total assets. World Scope
Sales growth rate Sales revenue divided by prior year sales revenue minus one World Scope
Social performance score A measure of customer/product responsibility, society/community, society/human rights, workforce/diversity and opportunity, workforce/employment quality, workforce/health & safety, and workforce/training and development (see Appendix A for further details) It is an equally weighted computer calculation of relative company performance, the benchmark being the ASSET4 company universe. These ratings are z-scored and normalized to position the score between 0% and 100%. (see Appendix A for further details)
ASSET4
Tobin's q Book value of assets + (market value of equity – book value of equity))/book value of assets. World Scope
32
Panel B: Country-level variables
Variable Definition Source Anti-director index Revised anti-director rights index; it is an aggregate index of shareholder rights. The index is
formed by summing: (1) vote by mail(one if yes, zero if no); (2) shares not deposited (one if yes, zero if no); (3) cumulative voting (one if yes, zero if no); (4) oppressed minority (one if yes, zero if no); (5) pre-emptive rights (one if yes, zero if no); and (6) capital to call a meeting (one if yes, zero if no).
Djankov et al. (2008)
Anti self-dealing index An index of anti-self-dealing, formed by taking the average of ex ante and ex post private control of self-dealing indices. The index of ex ante control of self-dealing transactions is an average of approval by disinterested shareholders and ex ante disclosure. The index of ex post control of self-dealing transactions is an average of disclosures in periodic filings and ease of proving wrongdoing.
Djankov et al. (2008b)
Financial openness An index which captures the extent of openness in a country’s capital account transactions. Chinn and Ito (2007)
GDP growth rate Annual GDP growth rate (%). World Bank
Individualism Individualism scores; with low scores representing low individualism (high collectivism) and high scores representing high individualism (low collectivism).
Hofstede (2010)
Indulgence Indulgence scores; with low scores representing high restraint (low indulgence) and high scores representing low restraint (high indulgence).
Hofstede (2010)
Long-term orientation Long-term orientation; with low scores representing short-term orientation and high scores representing long-term orientation.
Hofstede (2010)
Market capitalization to GDP The ratio of stock market capitalization to GDP (%). World Bank
Masculinity Masculinity scores; with low scores representing low masculinity and high scores representing high masculinity.
Hofstede (2010)
Per capita GDP Natural logarithm of GDP per capita. World Bank
Power distance Power distance scores; with low scores representing low power distance and high scores representing high power distance.
Hofstede (2010)
Uncertainty avoidance Uncertainty avoidance scores; with low scores representing low uncertainty avoidance and high scores representing high uncertainty avoidance.
Hofstede (2010)
33
Table 1 Summary Statistics Panel A: Sample firms by country
Country Observations % of observations Firms
Australia 1,358 6.58% 333
Austria 127 0.62% 17
Belgium 142 0.69% 27
Brazil 159 0.77% 69
Canada 1,147 5.56% 247
Chile 63 0.31% 18
Colombia 18 0.09% 7
Denmark 131 0.63% 22
Finland 161 0.78% 25
France 704 3.41% 94
Germany 510 2.47% 80
Greece 137 0.66% 21
Hong Kong 334 1.62% 56
India 247 1.20% 81
Indonesia 50 0.24% 23
Ireland 165 0.80% 25
Israel 51 0.25% 15
Italy 317 1.54% 51
Japan 3,201 15.51% 405
South Korea 309 1.50% 101
Malaysia 127 0.62% 44
Mexico 50 0.24% 19
Netherlands 279 1.35% 44
New Zealand 82 0.40% 11
Norway 138 0.67% 18
Philippines 51 0.25% 21
Portugal 80 0.39% 12
Singapore 291 1.41% 45
South Africa 230 1.11% 114
Spain 378 1.83% 53
Sweden 326 1.58% 52
Switzerland 407 1.97% 70
Thailand 37 0.18% 19
Turkey 74 0.36% 23
United Kingdom 2,317 11.22% 336
United States 6,444 31.22% 993
Total 20,644 100.00% 3,591
34
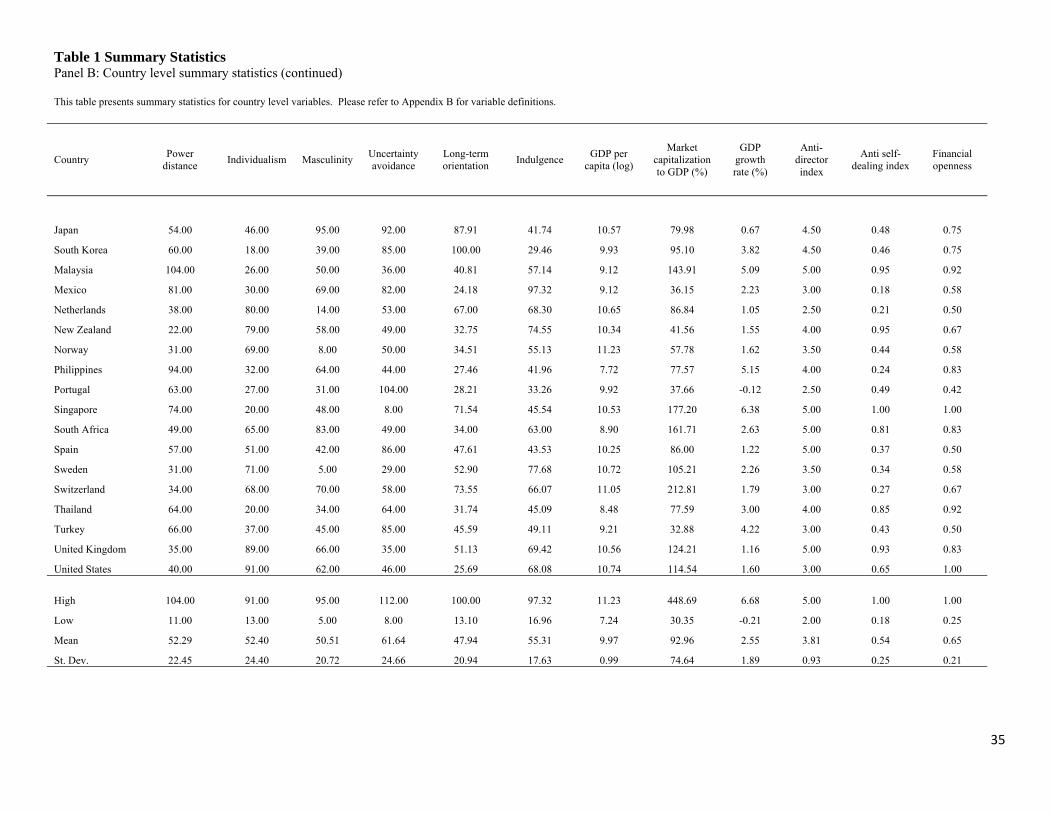
Table 1 Summary Statistics Panel B: Country level summary statistics This table presents summary statistics for country level variables. Please refer to Appendix B for variable definitions.
Country Power
distance Individualism Masculinity
Uncertainty avoidance
Long-term orientation
Indulgence GDP per
capita (log)
Market capitalization to GDP (%)
GDP growth rate (%)
Anti-director index
Anti self-dealing index
Financial openness
Australia 36.00 90.00 61.00 51.00 21.16 71.43 10.84 108.82 2.78 4.00 0.79 0.75
Austria 11.00 55.00 79.00 70.00 60.45 62.72 10.62 30.35 1.61 2.50 0.21 0.25
Belgium 65.00 75.00 54.00 94.00 81.86 56.70 10.59 61.81 1.23 3.00 0.54 0.42
Brazil 69.00 38.00 49.00 76.00 43.83 59.15 9.29 60.45 3.63 5.00 0.29 0.25
Canada 46.50 76.50 48.50 54.00 36.02 68.30 10.68 116.92 1.57 4.00 0.65 0.92
Chile 63.00 23.00 28.00 86.00 30.98 68.00 9.45 122.16 4.31 4.00 0.63 0.58
Colombia 67.00 13.00 64.00 80.00 13.10 83.04 8.81 65.52 4.81 3.00 0.58 0.42
Denmark 18.00 74.00 16.00 23.00 34.76 69.64 10.88 64.60 0.42 4.00 0.47 0.58
Finland 33.00 63.00 26.00 59.00 38.29 57.37 10.64 80.76 1.32 3.50 0.46 0.50
France 68.00 71.00 43.00 86.00 63.48 47.77 10.53 76.53 0.97 3.50 0.38 0.75
Germany 35.00 67.00 66.00 65.00 82.87 40.40 10.55 42.96 1.26 3.50 0.28 0.42
Greece 60.00 35.00 57.00 112.00 45.34 49.55 10.10 42.98 -0.21 2.00 0.23 0.33
Hong Kong 68.00 25.00 57.00 29.00 60.96 16.96 10.34 448.69 4.54 5.00 0.96 0.92
India 77.00 48.00 56.00 40.00 50.88 26.12 7.24 73.28 6.68 5.00 0.55 0.92
Indonesia 78.00 14.00 46.00 48.00 61.96 37.72 7.99 43.06 6.02 4.00 0.68 0.50
Ireland 28.00 70.00 68.00 35.00 24.43 64.96 10.81 45.41 1.74 5.00 0.79 0.67
Israel 13.00 54.00 47.00 81.00 37.53 N/A 10.25 81.22 3.80 4.00 0.71 0.67
Italy 50.00 76.00 70.00 75.00 61.46 29.69 10.39 32.22 -0.07 2.00 0.39 0.67
35
Table 1 Summary Statistics Panel B: Country level summary statistics (continued) This table presents summary statistics for country level variables. Please refer to Appendix B for variable definitions.
Country Power
distance Individualism Masculinity
Uncertainty avoidance
Long-term orientation
Indulgence GDP per
capita (log)
Market capitalization to GDP (%)
GDP growth rate (%)
Anti-director index
Anti self-dealing index
Financial openness
Japan 54.00 46.00 95.00 92.00 87.91 41.74 10.57 79.98 0.67 4.50 0.48 0.75
South Korea 60.00 18.00 39.00 85.00 100.00 29.46 9.93 95.10 3.82 4.50 0.46 0.75
Malaysia 104.00 26.00 50.00 36.00 40.81 57.14 9.12 143.91 5.09 5.00 0.95 0.92
Mexico 81.00 30.00 69.00 82.00 24.18 97.32 9.12 36.15 2.23 3.00 0.18 0.58
Netherlands 38.00 80.00 14.00 53.00 67.00 68.30 10.65 86.84 1.05 2.50 0.21 0.50
New Zealand 22.00 79.00 58.00 49.00 32.75 74.55 10.34 41.56 1.55 4.00 0.95 0.67
Norway 31.00 69.00 8.00 50.00 34.51 55.13 11.23 57.78 1.62 3.50 0.44 0.58
Philippines 94.00 32.00 64.00 44.00 27.46 41.96 7.72 77.57 5.15 4.00 0.24 0.83
Portugal 63.00 27.00 31.00 104.00 28.21 33.26 9.92 37.66 -0.12 2.50 0.49 0.42
Singapore 74.00 20.00 48.00 8.00 71.54 45.54 10.53 177.20 6.38 5.00 1.00 1.00
South Africa 49.00 65.00 83.00 49.00 34.00 63.00 8.90 161.71 2.63 5.00 0.81 0.83
Spain 57.00 51.00 42.00 86.00 47.61 43.53 10.25 86.00 1.22 5.00 0.37 0.50
Sweden 31.00 71.00 5.00 29.00 52.90 77.68 10.72 105.21 2.26 3.50 0.34 0.58
Switzerland 34.00 68.00 70.00 58.00 73.55 66.07 11.05 212.81 1.79 3.00 0.27 0.67
Thailand 64.00 20.00 34.00 64.00 31.74 45.09 8.48 77.59 3.00 4.00 0.85 0.92
Turkey 66.00 37.00 45.00 85.00 45.59 49.11 9.21 32.88 4.22 3.00 0.43 0.50
United Kingdom 35.00 89.00 66.00 35.00 51.13 69.42 10.56 124.21 1.16 5.00 0.93 0.83
United States 40.00 91.00 62.00 46.00 25.69 68.08 10.74 114.54 1.60 3.00 0.65 1.00
High 104.00 91.00 95.00 112.00 100.00 97.32 11.23 448.69 6.68 5.00 1.00 1.00
Low 11.00 13.00 5.00 8.00 13.10 16.96 7.24 30.35 -0.21 2.00 0.18 0.25
Mean 52.29 52.40 50.51 61.64 47.94 55.31 9.97 92.96 2.55 3.81 0.54 0.65
St. Dev. 22.45 24.40 20.72 24.66 20.94 17.63 0.99 74.64 1.89 0.93 0.25 0.21
36
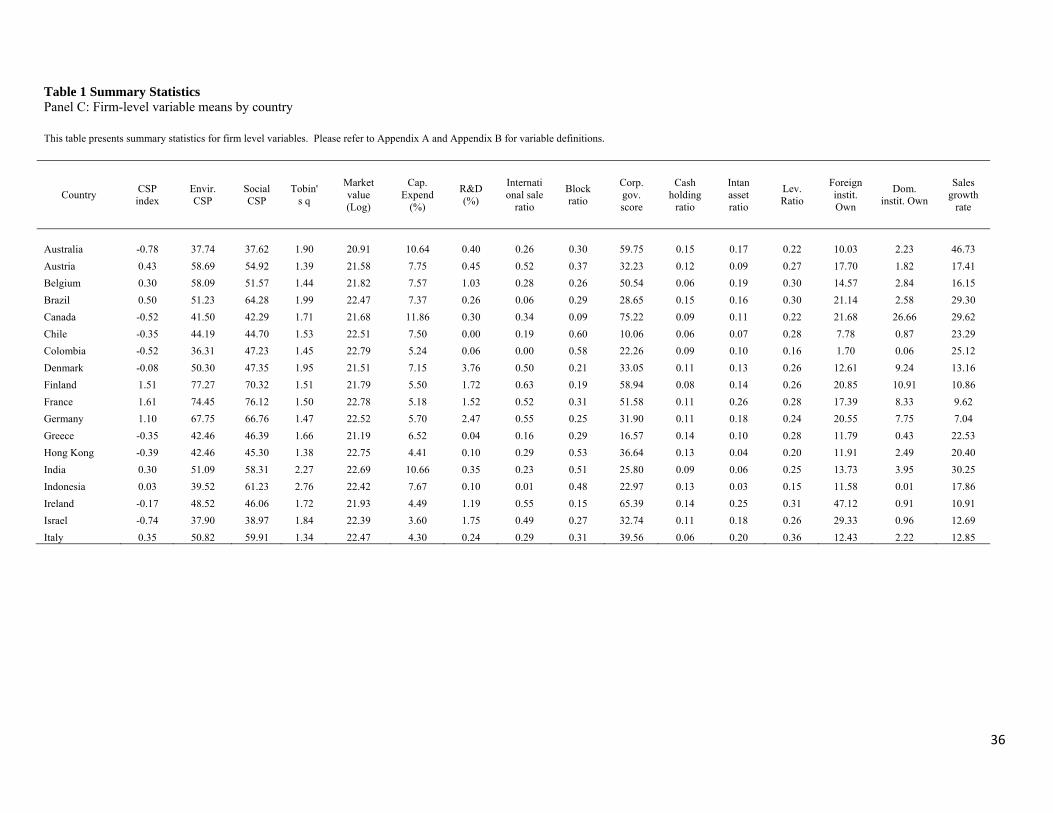
Table 1 Summary Statistics Panel C: Firm-level variable means by country This table presents summary statistics for firm level variables. Please refer to Appendix A and Appendix B for variable definitions.
Country CSP index
Envir. CSP
Social CSP
Tobin's q
Market value (Log)
Cap. Expend
(%)
R&D (%)
International sale
ratio
Block ratio
Corp. gov. score
Cash holding
ratio
Intan asset ratio
Lev. Ratio
Foreign instit. Own
Dom. instit. Own
Sales growth
rate
Australia -0.78 37.74 37.62 1.90 20.91 10.64 0.40 0.26 0.30 59.75 0.15 0.17 0.22 10.03 2.23 46.73
Austria 0.43 58.69 54.92 1.39 21.58 7.75 0.45 0.52 0.37 32.23 0.12 0.09 0.27 17.70 1.82 17.41
Belgium 0.30 58.09 51.57 1.44 21.82 7.57 1.03 0.28 0.26 50.54 0.06 0.19 0.30 14.57 2.84 16.15
Brazil 0.50 51.23 64.28 1.99 22.47 7.37 0.26 0.06 0.29 28.65 0.15 0.16 0.30 21.14 2.58 29.30
Canada -0.52 41.50 42.29 1.71 21.68 11.86 0.30 0.34 0.09 75.22 0.09 0.11 0.22 21.68 26.66 29.62
Chile -0.35 44.19 44.70 1.53 22.51 7.50 0.00 0.19 0.60 10.06 0.06 0.07 0.28 7.78 0.87 23.29
Colombia -0.52 36.31 47.23 1.45 22.79 5.24 0.06 0.00 0.58 22.26 0.09 0.10 0.16 1.70 0.06 25.12
Denmark -0.08 50.30 47.35 1.95 21.51 7.15 3.76 0.50 0.21 33.05 0.11 0.13 0.26 12.61 9.24 13.16
Finland 1.51 77.27 70.32 1.51 21.79 5.50 1.72 0.63 0.19 58.94 0.08 0.14 0.26 20.85 10.91 10.86
France 1.61 74.45 76.12 1.50 22.78 5.18 1.52 0.52 0.31 51.58 0.11 0.26 0.28 17.39 8.33 9.62
Germany 1.10 67.75 66.76 1.47 22.52 5.70 2.47 0.55 0.25 31.90 0.11 0.18 0.24 20.55 7.75 7.04
Greece -0.35 42.46 46.39 1.66 21.19 6.52 0.04 0.16 0.29 16.57 0.14 0.10 0.28 11.79 0.43 22.53
Hong Kong -0.39 42.46 45.30 1.38 22.75 4.41 0.10 0.29 0.53 36.64 0.13 0.04 0.20 11.91 2.49 20.40
India 0.30 51.09 58.31 2.27 22.69 10.66 0.35 0.23 0.51 25.80 0.09 0.06 0.25 13.73 3.95 30.25
Indonesia 0.03 39.52 61.23 2.76 22.42 7.67 0.10 0.01 0.48 22.97 0.13 0.03 0.15 11.58 0.01 17.86
Ireland -0.17 48.52 46.06 1.72 21.93 4.49 1.19 0.55 0.15 65.39 0.14 0.25 0.31 47.12 0.91 10.91
Israel -0.74 37.90 38.97 1.84 22.39 3.60 1.75 0.49 0.27 32.74 0.11 0.18 0.26 29.33 0.96 12.69
Italy 0.35 50.82 59.91 1.34 22.47 4.30 0.24 0.29 0.31 39.56 0.06 0.20 0.36 12.43 2.22 12.85
37
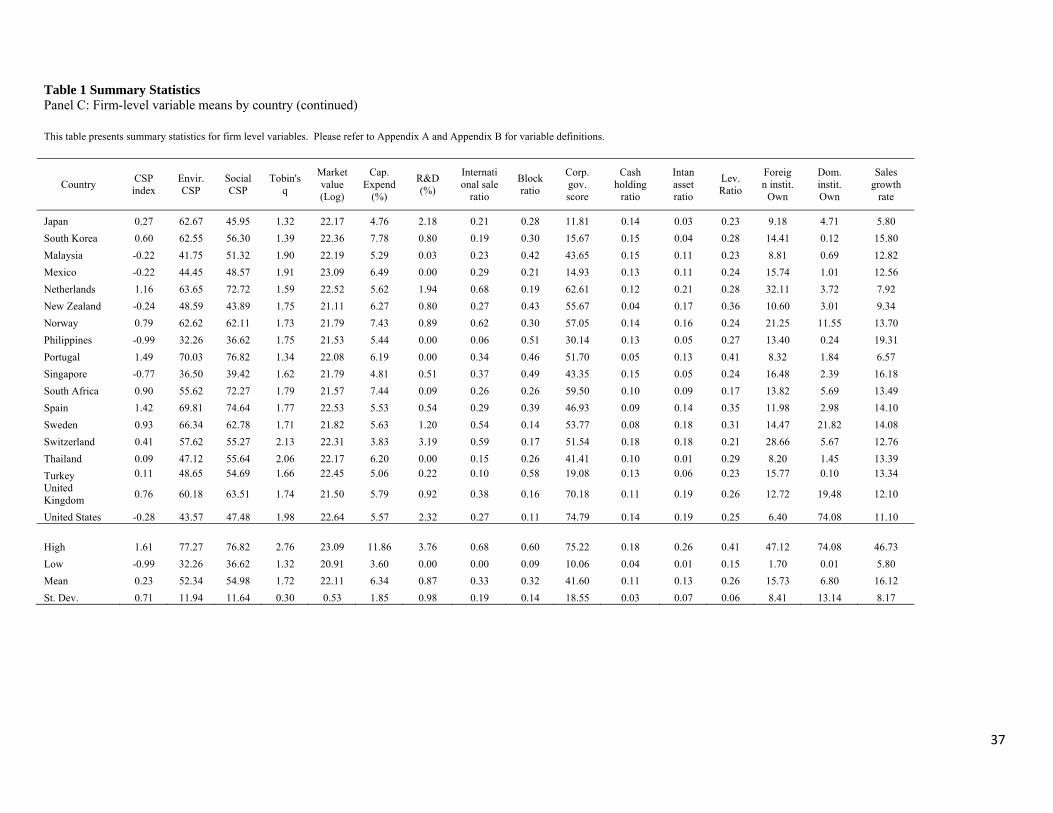
Table 1 Summary Statistics Panel C: Firm-level variable means by country (continued) This table presents summary statistics for firm level variables. Please refer to Appendix A and Appendix B for variable definitions.
Country CSP index
Envir. CSP
Social CSP
Tobin's q
Market value (Log)
Cap. Expend
(%)
R&D (%)
International sale
ratio
Block ratio
Corp. gov. score
Cash holding
ratio
Intan asset ratio
Lev. Ratio
Foreign instit.
Own
Dom. instit. Own
Sales growth
rate
Japan 0.27 62.67 45.95 1.32 22.17 4.76 2.18 0.21 0.28 11.81 0.14 0.03 0.23 9.18 4.71 5.80
South Korea 0.60 62.55 56.30 1.39 22.36 7.78 0.80 0.19 0.30 15.67 0.15 0.04 0.28 14.41 0.12 15.80
Malaysia -0.22 41.75 51.32 1.90 22.19 5.29 0.03 0.23 0.42 43.65 0.15 0.11 0.23 8.81 0.69 12.82
Mexico -0.22 44.45 48.57 1.91 23.09 6.49 0.00 0.29 0.21 14.93 0.13 0.11 0.24 15.74 1.01 12.56
Netherlands 1.16 63.65 72.72 1.59 22.52 5.62 1.94 0.68 0.19 62.61 0.12 0.21 0.28 32.11 3.72 7.92
New Zealand -0.24 48.59 43.89 1.75 21.11 6.27 0.80 0.27 0.43 55.67 0.04 0.17 0.36 10.60 3.01 9.34
Norway 0.79 62.62 62.11 1.73 21.79 7.43 0.89 0.62 0.30 57.05 0.14 0.16 0.24 21.25 11.55 13.70
Philippines -0.99 32.26 36.62 1.75 21.53 5.44 0.00 0.06 0.51 30.14 0.13 0.05 0.27 13.40 0.24 19.31
Portugal 1.49 70.03 76.82 1.34 22.08 6.19 0.00 0.34 0.46 51.70 0.05 0.13 0.41 8.32 1.84 6.57
Singapore -0.77 36.50 39.42 1.62 21.79 4.81 0.51 0.37 0.49 43.35 0.15 0.05 0.24 16.48 2.39 16.18
South Africa 0.90 55.62 72.27 1.79 21.57 7.44 0.09 0.26 0.26 59.50 0.10 0.09 0.17 13.82 5.69 13.49
Spain 1.42 69.81 74.64 1.77 22.53 5.53 0.54 0.29 0.39 46.93 0.09 0.14 0.35 11.98 2.98 14.10
Sweden 0.93 66.34 62.78 1.71 21.82 5.63 1.20 0.54 0.14 53.77 0.08 0.18 0.31 14.47 21.82 14.08
Switzerland 0.41 57.62 55.27 2.13 22.31 3.83 3.19 0.59 0.17 51.54 0.18 0.18 0.21 28.66 5.67 12.76
Thailand 0.09 47.12 55.64 2.06 22.17 6.20 0.00 0.15 0.26 41.41 0.10 0.01 0.29 8.20 1.45 13.39
Turkey 0.11 48.65 54.69 1.66 22.45 5.06 0.22 0.10 0.58 19.08 0.13 0.06 0.23 15.77 0.10 13.34 United Kingdom
0.76 60.18 63.51 1.74 21.50 5.79 0.92 0.38 0.16 70.18 0.11 0.19 0.26 12.72 19.48 12.10
United States -0.28 43.57 47.48 1.98 22.64 5.57 2.32 0.27 0.11 74.79 0.14 0.19 0.25 6.40 74.08 11.10
High 1.61 77.27 76.82 2.76 23.09 11.86 3.76 0.68 0.60 75.22 0.18 0.26 0.41 47.12 74.08 46.73
Low -0.99 32.26 36.62 1.32 20.91 3.60 0.00 0.00 0.09 10.06 0.04 0.01 0.15 1.70 0.01 5.80
Mean 0.23 52.34 54.98 1.72 22.11 6.34 0.87 0.33 0.32 41.60 0.11 0.13 0.26 15.73 6.80 16.12
St. Dev. 0.71 11.94 11.64 0.30 0.53 1.85 0.98 0.19 0.14 18.55 0.03 0.07 0.06 8.41 13.14 8.17
38
Table 2 Regression Analyses of Corporate Financial Performance (CFP) on Corporate Social Performance (CSP) and CulturePanel A: Interaction between CSP and individualism – HLM Regressions This table presents the HLM regressions of Tobin’s q (CFP) on corporate social performance (CSP), individualism (Hofstede cultural value dimension), the interaction between CSP and individualism and control variables for the full sample. All variables are defined in the Appendices. Clustered standard errors by firm are reported in parentheses. ***, **, and * indicate statistical significance at the 1 percent, 5 percent and 10 percent levels (two-tailed) respectively.
Variables CSP index as predictor Environmental score as predictor Social score as predictor
_firmdev _ctrymean _ctry _firmdev _ctrymean _ctry _firmdev _ctrymean _ctry
Firm characteristics
CSP measure -0.019*** -0.168** -0.001*** -0.014*** -0.001 -0.004
(0.007) (0.075) (0.000) (0.005) (0.000) (0.004)
Market value (log) 0.061*** 0.048 0.060*** 0.044 0.058*** -0.001
(0.014) (0.087) (0.014) (0.082) (0.014) (0.091)
Capital exp ratio 0.180 5.347** 0.182 6.267*** 0.186 4.065*
(0.153) (2.190) (0.153) (2.213) (0.153) (2.121)
R&D intensity 3.517*** 8.698* 3.532*** 10.286** 3.494*** 9.469*
(0.984) (5.035) (0.982) (5.055) (0.984) (5.284)
International sale ratio -0.190*** 0.159 -0.189*** 0.300 -0.193*** -0.069
(0.052) (0.316) (0.052) (0.311) (0.052) (0.313)
Blockholder ratio 0.055 0.057 0.056 -0.013 0.054 0.156
(0.041) (0.352) (0.041) (0.351) (0.041) (0.353)
Corporate gov score -0.000 0.009** -0.000 0.008** -0.001 0.008*
(0.000) (0.004) (0.000) (0.004) (0.000) (0.004)
Cash holding ratio 1.684*** 3.398*** 1.686*** 3.470*** 1.690*** 2.923**
(0.151) (1.102) (0.151) (1.059) (0.152) (1.147)
Intangible asset ratio -0.571*** 0.665 -0.573*** 0.492 -0.569*** 0.644
(0.097) (0.925) (0.097) (0.917) (0.097) (0.933)
Leverage ratio -0.269*** 1.252* -0.267*** 1.629** -0.275*** 0.979
(0.094) (0.737) (0.094) (0.746) (0.094) (0.723)
Foreign inst own 0.171 -1.065 0.174 -1.343** 0.168 -0.408
(0.125) (0.711) (0.125) (0.681) (0.125) (0.689)
Domestic inst own -0.063 -0.140 -0.063 -0.240 -0.056 0.109
(0.104) (0.337) (0.103) (0.324) (0.104) (0.334)
Sales growth rate 0.113*** -0.315 0.114*** -0.591 0.115*** 0.267
(0.034) (0.618) (0.034) (0.597) (0.034) (0.610)
Country characteristics
Per capita GDP (Log) -0.298*** -0.273*** -0.289***
(0.041) (0.041) (0.046)
Market cap to GDP 0.001*** 0.001*** 0.001***
(0.000) (0.000) (0.000)
GDP growth rate 0.007* 0.006* 0.006*
(0.004) (0.004) (0.004)
Anti director index -0.022 0.005 -0.062
(0.048) (0.051) (0.044)
Anti self-dealing index 0.157 0.071 0.284
(0.228) (0.232) (0.220)
Financial openness -0.773*** -0.733*** -0.660***
(0.216) (0.203) (0.226)
Individualism -0.000 0.001 -0.001
(0.003) (0.003) (0.003)
Interaction
CSP x individualism -0.001*** -0.000*** -0.000*** (0.000) (0.000) (0.000)
Constant 1.671*** 1.678*** 1.673***
(0.142) (0.143) (0.143)
Observations 20,644 20,644 20,644
Number of firm clusters 3,591 3,591 3,591
Industry Fixed Effects Yes Yes Yes
Year Fixed Effects Yes Yes Yes
Adjusted R-squared 0.309 0.311 0.306
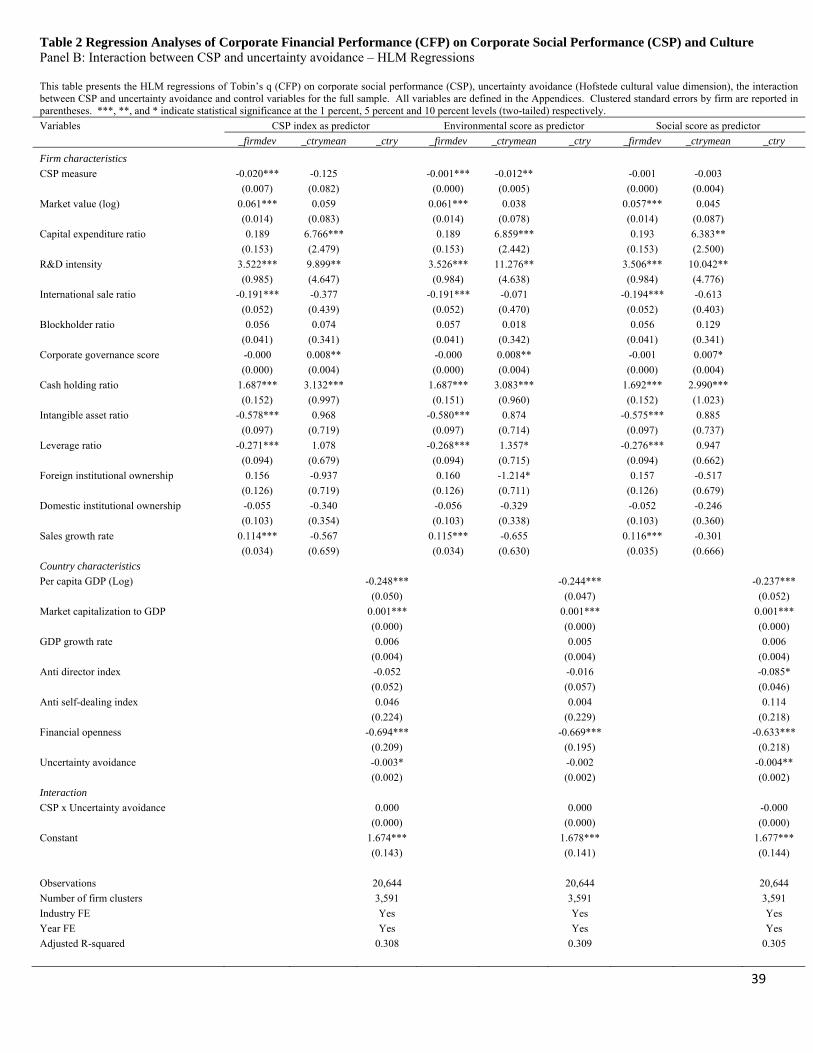
39
Table 2 Regression Analyses of Corporate Financial Performance (CFP) on Corporate Social Performance (CSP) and CulturePanel B: Interaction between CSP and uncertainty avoidance – HLM Regressions This table presents the HLM regressions of Tobin’s q (CFP) on corporate social performance (CSP), uncertainty avoidance (Hofstede cultural value dimension), the interaction between CSP and uncertainty avoidance and control variables for the full sample. All variables are defined in the Appendices. Clustered standard errors by firm are reported in parentheses. ***, **, and * indicate statistical significance at the 1 percent, 5 percent and 10 percent levels (two-tailed) respectively. Variables CSP index as predictor Environmental score as predictor Social score as predictor
_firmdev _ctrymean _ctry _firmdev _ctrymean _ctry _firmdev _ctrymean _ctry
Firm characteristics
CSP measure -0.020*** -0.125 -0.001*** -0.012** -0.001 -0.003
(0.007) (0.082) (0.000) (0.005) (0.000) (0.004)
Market value (log) 0.061*** 0.059 0.061*** 0.038 0.057*** 0.045
(0.014) (0.083) (0.014) (0.078) (0.014) (0.087)
Capital expenditure ratio 0.189 6.766*** 0.189 6.859*** 0.193 6.383**
(0.153) (2.479) (0.153) (2.442) (0.153) (2.500)
R&D intensity 3.522*** 9.899** 3.526*** 11.276** 3.506*** 10.042**
(0.985) (4.647) (0.984) (4.638) (0.984) (4.776)
International sale ratio -0.191*** -0.377 -0.191*** -0.071 -0.194*** -0.613
(0.052) (0.439) (0.052) (0.470) (0.052) (0.403)
Blockholder ratio 0.056 0.074 0.057 0.018 0.056 0.129
(0.041) (0.341) (0.041) (0.342) (0.041) (0.341)
Corporate governance score -0.000 0.008** -0.000 0.008** -0.001 0.007*
(0.000) (0.004) (0.000) (0.004) (0.000) (0.004)
Cash holding ratio 1.687*** 3.132*** 1.687*** 3.083*** 1.692*** 2.990***
(0.152) (0.997) (0.151) (0.960) (0.152) (1.023)
Intangible asset ratio -0.578*** 0.968 -0.580*** 0.874 -0.575*** 0.885
(0.097) (0.719) (0.097) (0.714) (0.097) (0.737)
Leverage ratio -0.271*** 1.078 -0.268*** 1.357* -0.276*** 0.947
(0.094) (0.679) (0.094) (0.715) (0.094) (0.662)
Foreign institutional ownership 0.156 -0.937 0.160 -1.214* 0.157 -0.517
(0.126) (0.719) (0.126) (0.711) (0.126) (0.679)
Domestic institutional ownership -0.055 -0.340 -0.056 -0.329 -0.052 -0.246
(0.103) (0.354) (0.103) (0.338) (0.103) (0.360)
Sales growth rate 0.114*** -0.567 0.115*** -0.655 0.116*** -0.301
(0.034) (0.659) (0.034) (0.630) (0.035) (0.666)
Country characteristics
Per capita GDP (Log) -0.248*** -0.244*** -0.237***
(0.050) (0.047) (0.052)
Market capitalization to GDP 0.001*** 0.001*** 0.001***
(0.000) (0.000) (0.000)
GDP growth rate 0.006 0.005 0.006
(0.004) (0.004) (0.004)
Anti director index -0.052 -0.016 -0.085*
(0.052) (0.057) (0.046)
Anti self-dealing index 0.046 0.004 0.114
(0.224) (0.229) (0.218)
Financial openness -0.694*** -0.669*** -0.633***
(0.209) (0.195) (0.218)
Uncertainty avoidance -0.003* -0.002 -0.004**
(0.002) (0.002) (0.002)
Interaction
CSP x Uncertainty avoidance 0.000 0.000 -0.000 (0.000) (0.000) (0.000)
Constant 1.674*** 1.678*** 1.677***
(0.143) (0.141) (0.144)
Observations 20,644 20,644 20,644
Number of firm clusters 3,591 3,591 3,591
Industry FE Yes Yes Yes
Year FE Yes Yes Yes
Adjusted R-squared 0.308 0.309 0.305
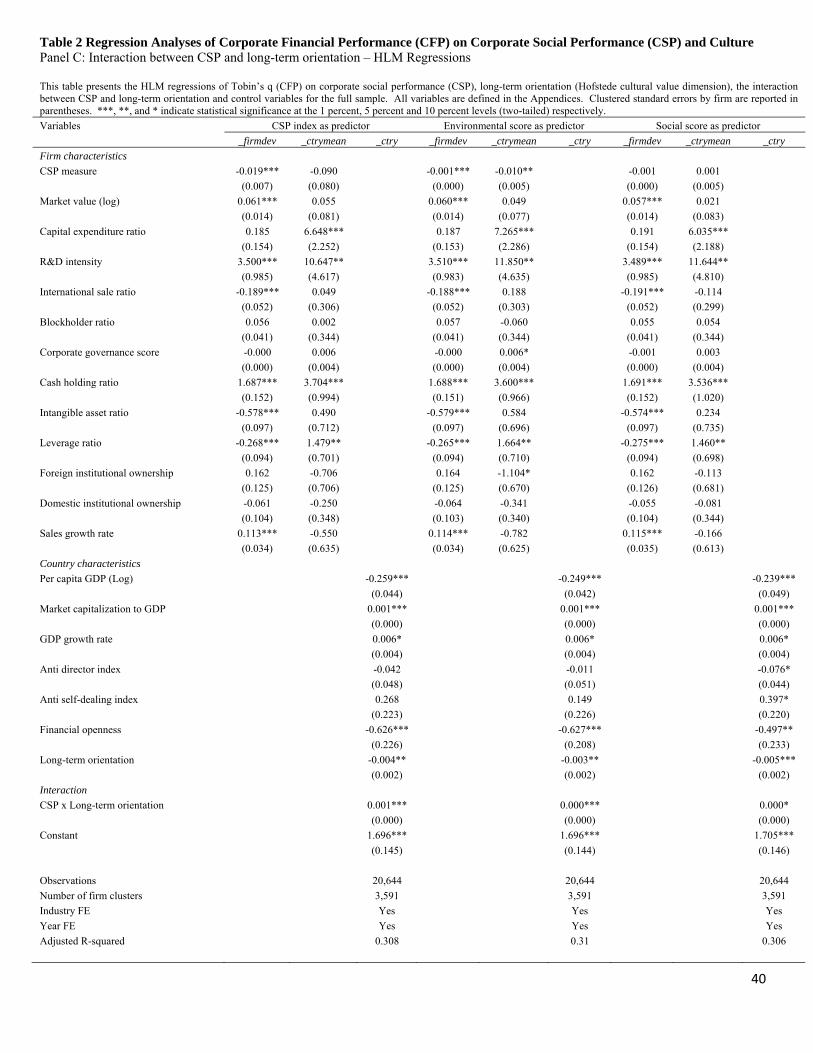
40
Table 2 Regression Analyses of Corporate Financial Performance (CFP) on Corporate Social Performance (CSP) and CulturePanel C: Interaction between CSP and long-term orientation – HLM Regressions This table presents the HLM regressions of Tobin’s q (CFP) on corporate social performance (CSP), long-term orientation (Hofstede cultural value dimension), the interaction between CSP and long-term orientation and control variables for the full sample. All variables are defined in the Appendices. Clustered standard errors by firm are reported in parentheses. ***, **, and * indicate statistical significance at the 1 percent, 5 percent and 10 percent levels (two-tailed) respectively. Variables CSP index as predictor Environmental score as predictor Social score as predictor
_firmdev _ctrymean _ctry _firmdev _ctrymean _ctry _firmdev _ctrymean _ctry
Firm characteristics
CSP measure -0.019*** -0.090 -0.001*** -0.010** -0.001 0.001
(0.007) (0.080) (0.000) (0.005) (0.000) (0.005)
Market value (log) 0.061*** 0.055 0.060*** 0.049 0.057*** 0.021
(0.014) (0.081) (0.014) (0.077) (0.014) (0.083)
Capital expenditure ratio 0.185 6.648*** 0.187 7.265*** 0.191 6.035***
(0.154) (2.252) (0.153) (2.286) (0.154) (2.188)
R&D intensity 3.500*** 10.647** 3.510*** 11.850** 3.489*** 11.644**
(0.985) (4.617) (0.983) (4.635) (0.985) (4.810)
International sale ratio -0.189*** 0.049 -0.188*** 0.188 -0.191*** -0.114
(0.052) (0.306) (0.052) (0.303) (0.052) (0.299)
Blockholder ratio 0.056 0.002 0.057 -0.060 0.055 0.054
(0.041) (0.344) (0.041) (0.344) (0.041) (0.344)
Corporate governance score -0.000 0.006 -0.000 0.006* -0.001 0.003
(0.000) (0.004) (0.000) (0.004) (0.000) (0.004)
Cash holding ratio 1.687*** 3.704*** 1.688*** 3.600*** 1.691*** 3.536***
(0.152) (0.994) (0.151) (0.966) (0.152) (1.020)
Intangible asset ratio -0.578*** 0.490 -0.579*** 0.584 -0.574*** 0.234
(0.097) (0.712) (0.097) (0.696) (0.097) (0.735)
Leverage ratio -0.268*** 1.479** -0.265*** 1.664** -0.275*** 1.460**
(0.094) (0.701) (0.094) (0.710) (0.094) (0.698)
Foreign institutional ownership 0.162 -0.706 0.164 -1.104* 0.162 -0.113
(0.125) (0.706) (0.125) (0.670) (0.126) (0.681)
Domestic institutional ownership -0.061 -0.250 -0.064 -0.341 -0.055 -0.081
(0.104) (0.348) (0.103) (0.340) (0.104) (0.344)
Sales growth rate 0.113*** -0.550 0.114*** -0.782 0.115*** -0.166
(0.034) (0.635) (0.034) (0.625) (0.035) (0.613)
Country characteristics
Per capita GDP (Log) -0.259*** -0.249*** -0.239***
(0.044) (0.042) (0.049)
Market capitalization to GDP 0.001*** 0.001*** 0.001***
(0.000) (0.000) (0.000)
GDP growth rate 0.006* 0.006* 0.006*
(0.004) (0.004) (0.004)
Anti director index -0.042 -0.011 -0.076*
(0.048) (0.051) (0.044)
Anti self-dealing index 0.268 0.149 0.397*
(0.223) (0.226) (0.220)
Financial openness -0.626*** -0.627*** -0.497**
(0.226) (0.208) (0.233)
Long-term orientation -0.004** -0.003** -0.005***
(0.002) (0.002) (0.002)
Interaction
CSP x Long-term orientation 0.001*** 0.000*** 0.000* (0.000) (0.000) (0.000)
Constant 1.696*** 1.696*** 1.705***
(0.145) (0.144) (0.146)
Observations 20,644 20,644 20,644
Number of firm clusters 3,591 3,591 3,591
Industry FE Yes Yes Yes
Year FE Yes Yes Yes
Adjusted R-squared 0.308 0.31 0.306
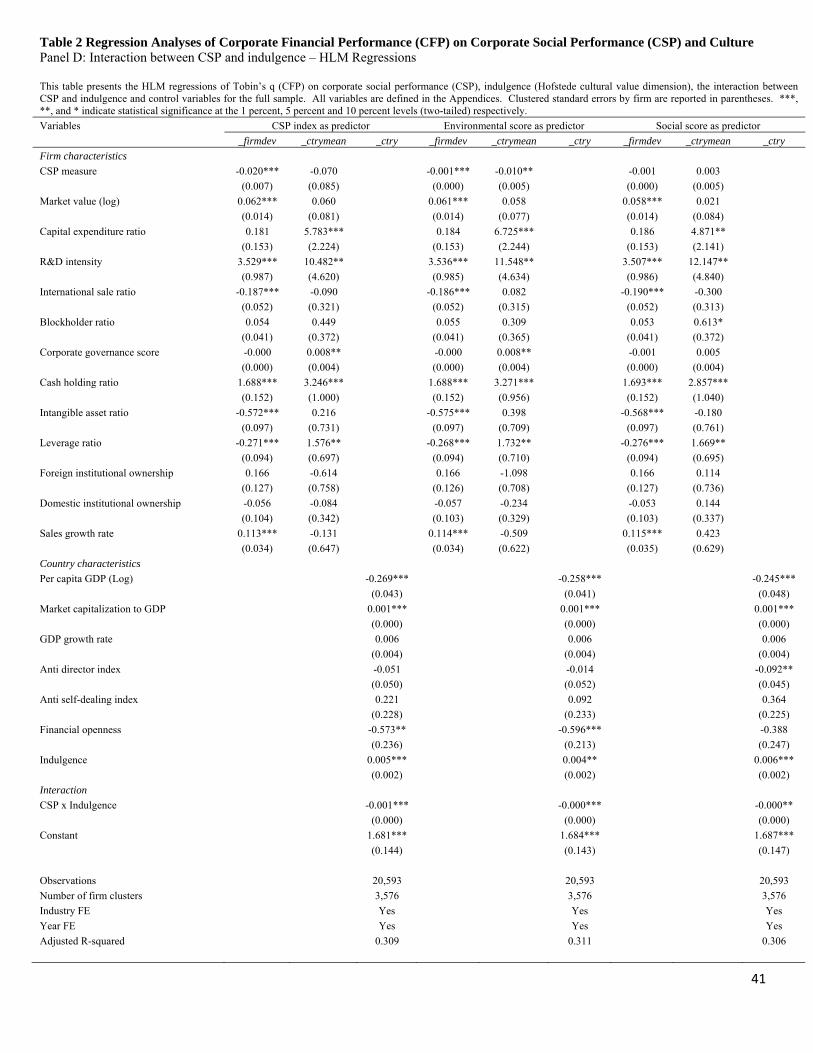
41
Table 2 Regression Analyses of Corporate Financial Performance (CFP) on Corporate Social Performance (CSP) and CulturePanel D: Interaction between CSP and indulgence – HLM Regressions This table presents the HLM regressions of Tobin’s q (CFP) on corporate social performance (CSP), indulgence (Hofstede cultural value dimension), the interaction between CSP and indulgence and control variables for the full sample. All variables are defined in the Appendices. Clustered standard errors by firm are reported in parentheses. ***, **, and * indicate statistical significance at the 1 percent, 5 percent and 10 percent levels (two-tailed) respectively.
Variables CSP index as predictor Environmental score as predictor Social score as predictor
_firmdev _ctrymean _ctry _firmdev _ctrymean _ctry _firmdev _ctrymean _ctry
Firm characteristics
CSP measure -0.020*** -0.070 -0.001*** -0.010** -0.001 0.003
(0.007) (0.085) (0.000) (0.005) (0.000) (0.005)
Market value (log) 0.062*** 0.060 0.061*** 0.058 0.058*** 0.021
(0.014) (0.081) (0.014) (0.077) (0.014) (0.084)
Capital expenditure ratio 0.181 5.783*** 0.184 6.725*** 0.186 4.871**
(0.153) (2.224) (0.153) (2.244) (0.153) (2.141)
R&D intensity 3.529*** 10.482** 3.536*** 11.548** 3.507*** 12.147**
(0.987) (4.620) (0.985) (4.634) (0.986) (4.840)
International sale ratio -0.187*** -0.090 -0.186*** 0.082 -0.190*** -0.300
(0.052) (0.321) (0.052) (0.315) (0.052) (0.313)
Blockholder ratio 0.054 0.449 0.055 0.309 0.053 0.613*
(0.041) (0.372) (0.041) (0.365) (0.041) (0.372)
Corporate governance score -0.000 0.008** -0.000 0.008** -0.001 0.005
(0.000) (0.004) (0.000) (0.004) (0.000) (0.004)
Cash holding ratio 1.688*** 3.246*** 1.688*** 3.271*** 1.693*** 2.857***
(0.152) (1.000) (0.152) (0.956) (0.152) (1.040)
Intangible asset ratio -0.572*** 0.216 -0.575*** 0.398 -0.568*** -0.180
(0.097) (0.731) (0.097) (0.709) (0.097) (0.761)
Leverage ratio -0.271*** 1.576** -0.268*** 1.732** -0.276*** 1.669**
(0.094) (0.697) (0.094) (0.710) (0.094) (0.695)
Foreign institutional ownership 0.166 -0.614 0.166 -1.098 0.166 0.114
(0.127) (0.758) (0.126) (0.708) (0.127) (0.736)
Domestic institutional ownership -0.056 -0.084 -0.057 -0.234 -0.053 0.144
(0.104) (0.342) (0.103) (0.329) (0.103) (0.337)
Sales growth rate 0.113*** -0.131 0.114*** -0.509 0.115*** 0.423
(0.034) (0.647) (0.034) (0.622) (0.035) (0.629)
Country characteristics
Per capita GDP (Log) -0.269*** -0.258*** -0.245***
(0.043) (0.041) (0.048)
Market capitalization to GDP 0.001*** 0.001*** 0.001***
(0.000) (0.000) (0.000)
GDP growth rate 0.006 0.006 0.006
(0.004) (0.004) (0.004)
Anti director index -0.051 -0.014 -0.092**
(0.050) (0.052) (0.045)
Anti self-dealing index 0.221 0.092 0.364
(0.228) (0.233) (0.225)
Financial openness -0.573** -0.596*** -0.388
(0.236) (0.213) (0.247)
Indulgence 0.005*** 0.004** 0.006***
(0.002) (0.002) (0.002)
Interaction
CSP x Indulgence -0.001*** -0.000*** -0.000** (0.000) (0.000) (0.000)
Constant 1.681*** 1.684*** 1.687***
(0.144) (0.143) (0.147)
Observations 20,593 20,593 20,593
Number of firm clusters 3,576 3,576 3,576
Industry FE Yes Yes Yes
Year FE Yes Yes Yes
Adjusted R-squared 0.309 0.311 0.306

42
Table 2 Regression Analyses of Corporate Financial Performance (CFP) on Corporate Social Performance (CSP) and CulturePanel E: Interaction between CSP and power distance – HLM Regressions This table presents the HLM regressions of Tobin’s q (CFP) on corporate social performance (CSP), power distance (Hofstede cultural value dimension), the interaction between CSP and power distance and control variables for the full sample. All variables are defined in the Appendices. Clustered standard errors by firm are reported in parentheses. ***, **, and * indicate statistical significance at the 1 percent, 5 percent and 10 percent levels (two-tailed) respectively.
Variables CSP index as predictor Environmental score as predictor Social score as predictor
_firmdev _ctrymean _ctry _firmdev _ctrymean _ctry _firmdev _ctrymean _ctry
Firm characteristics
CSP measure -0.020*** -0.191** -0.001*** -0.015*** -0.001 -0.004
(0.007) (0.077) (0.000) (0.005) (0.000) (0.005)
Market value (log) 0.062*** 0.081 0.061*** 0.058 0.058*** 0.026
(0.014) (0.089) (0.014) (0.081) (0.014) (0.095)
Capital expenditure ratio 0.183 5.990*** 0.186 6.789*** 0.187 4.309**
(0.153) (2.214) (0.153) (2.224) (0.153) (2.159)
R&D intensity 3.536*** 7.268 3.539*** 9.836** 3.514*** 8.070*
(0.984) (4.510) (0.983) (4.586) (0.984) (4.825)
International sale ratio -0.189*** 0.087 -0.188*** 0.196 -0.192*** -0.075
(0.052) (0.315) (0.052) (0.317) (0.052) (0.308)
Blockholder ratio 0.058 0.154 0.058 0.072 0.057 0.210
(0.041) (0.360) (0.041) (0.361) (0.041) (0.361)
Corporate governance score -0.000 0.010** -0.000 0.009** -0.001 0.008*
(0.000) (0.004) (0.000) (0.004) (0.000) (0.004)
Cash holding ratio 1.685*** 3.600*** 1.685*** 3.427*** 1.691*** 3.195***
(0.151) (0.992) (0.151) (0.943) (0.152) (1.050)
Intangible asset ratio -0.573*** 0.830 -0.575*** 0.815 -0.569*** 0.515
(0.097) (0.699) (0.097) (0.690) (0.097) (0.728)
Leverage ratio -0.273*** 1.182* -0.270*** 1.482** -0.278*** 1.026
(0.094) (0.673) (0.094) (0.690) (0.094) (0.658)
Foreign institutional ownership 0.162 -1.218* 0.164 -1.468** 0.163 -0.435
(0.125) (0.729) (0.125) (0.683) (0.125) (0.724)
Domestic institutional ownership -0.053 -0.259 -0.055 -0.338 -0.050 0.066
(0.104) (0.369) (0.103) (0.345) (0.103) (0.376)
Sales growth rate 0.113*** -0.575 0.114*** -0.771 0.115*** 0.139
(0.034) (0.643) (0.034) (0.614) (0.034) (0.650)
Country characteristics
Per capita GDP (Log) -0.295*** -0.266*** -0.290***
(0.041) (0.041) (0.046)
Market capitalization to GDP 0.001*** 0.001*** 0.001***
(0.000) (0.000) (0.000)
GDP growth rate 0.006* 0.006 0.006*
(0.004) (0.004) (0.004)
Anti director index -0.009 0.017 -0.058
(0.050) (0.052) (0.046)
Anti self-dealing index 0.064 -0.029 0.268
(0.252) (0.250) (0.252)
Financial openness -0.724*** -0.647*** -0.671***
(0.223) (0.213) (0.227)
Power distance -0.002 -0.002 -0.001
(0.002) (0.002) (0.002)
Interaction
CSP x Power distance 0.001*** 0.000*** 0.000*** (0.000) (0.000) (0.000)
Constant 1.669*** 1.676*** 1.672***
(0.143) (0.142) (0.144)
Observations 20,644 20,644 20,644
Number of firm clusters 3,591 3,591 3,591
Industry FE Yes Yes Yes
Year FE Yes Yes Yes
Adjusted R-squared 0.31 0.311 0.306
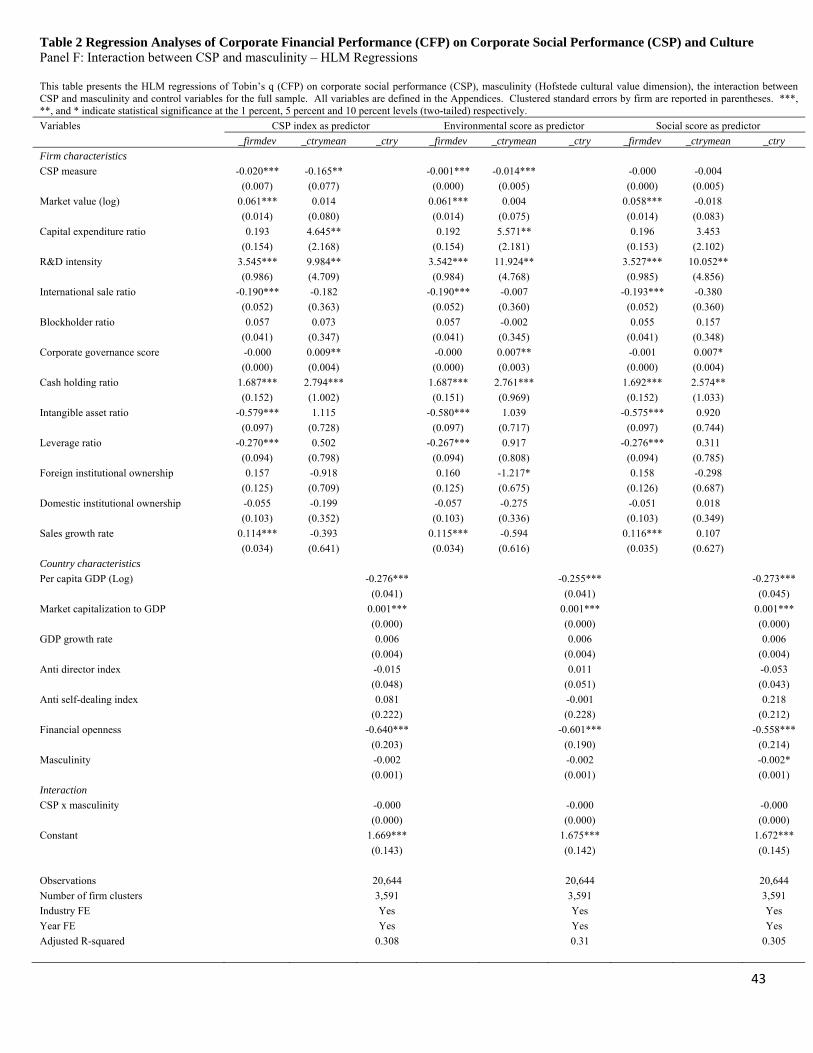
43
Table 2 Regression Analyses of Corporate Financial Performance (CFP) on Corporate Social Performance (CSP) and CulturePanel F: Interaction between CSP and masculinity – HLM Regressions This table presents the HLM regressions of Tobin’s q (CFP) on corporate social performance (CSP), masculinity (Hofstede cultural value dimension), the interaction between CSP and masculinity and control variables for the full sample. All variables are defined in the Appendices. Clustered standard errors by firm are reported in parentheses. ***, **, and * indicate statistical significance at the 1 percent, 5 percent and 10 percent levels (two-tailed) respectively.
Variables CSP index as predictor Environmental score as predictor Social score as predictor
_firmdev _ctrymean _ctry _firmdev _ctrymean _ctry _firmdev _ctrymean _ctry
Firm characteristics
CSP measure -0.020*** -0.165** -0.001*** -0.014*** -0.000 -0.004
(0.007) (0.077) (0.000) (0.005) (0.000) (0.005)
Market value (log) 0.061*** 0.014 0.061*** 0.004 0.058*** -0.018
(0.014) (0.080) (0.014) (0.075) (0.014) (0.083)
Capital expenditure ratio 0.193 4.645** 0.192 5.571** 0.196 3.453
(0.154) (2.168) (0.154) (2.181) (0.153) (2.102)
R&D intensity 3.545*** 9.984** 3.542*** 11.924** 3.527*** 10.052**
(0.986) (4.709) (0.984) (4.768) (0.985) (4.856)
International sale ratio -0.190*** -0.182 -0.190*** -0.007 -0.193*** -0.380
(0.052) (0.363) (0.052) (0.360) (0.052) (0.360)
Blockholder ratio 0.057 0.073 0.057 -0.002 0.055 0.157
(0.041) (0.347) (0.041) (0.345) (0.041) (0.348)
Corporate governance score -0.000 0.009** -0.000 0.007** -0.001 0.007*
(0.000) (0.004) (0.000) (0.003) (0.000) (0.004)
Cash holding ratio 1.687*** 2.794*** 1.687*** 2.761*** 1.692*** 2.574**
(0.152) (1.002) (0.151) (0.969) (0.152) (1.033)
Intangible asset ratio -0.579*** 1.115 -0.580*** 1.039 -0.575*** 0.920
(0.097) (0.728) (0.097) (0.717) (0.097) (0.744)
Leverage ratio -0.270*** 0.502 -0.267*** 0.917 -0.276*** 0.311
(0.094) (0.798) (0.094) (0.808) (0.094) (0.785)
Foreign institutional ownership 0.157 -0.918 0.160 -1.217* 0.158 -0.298
(0.125) (0.709) (0.125) (0.675) (0.126) (0.687)
Domestic institutional ownership -0.055 -0.199 -0.057 -0.275 -0.051 0.018
(0.103) (0.352) (0.103) (0.336) (0.103) (0.349)
Sales growth rate 0.114*** -0.393 0.115*** -0.594 0.116*** 0.107
(0.034) (0.641) (0.034) (0.616) (0.035) (0.627)
Country characteristics
Per capita GDP (Log) -0.276*** -0.255*** -0.273***
(0.041) (0.041) (0.045)
Market capitalization to GDP 0.001*** 0.001*** 0.001***
(0.000) (0.000) (0.000)
GDP growth rate 0.006 0.006 0.006
(0.004) (0.004) (0.004)
Anti director index -0.015 0.011 -0.053
(0.048) (0.051) (0.043)
Anti self-dealing index 0.081 -0.001 0.218
(0.222) (0.228) (0.212)
Financial openness -0.640*** -0.601*** -0.558***
(0.203) (0.190) (0.214)
Masculinity -0.002 -0.002 -0.002*
(0.001) (0.001) (0.001)
Interaction
CSP x masculinity -0.000 -0.000 -0.000 (0.000) (0.000) (0.000)
Constant 1.669*** 1.675*** 1.672***
(0.143) (0.142) (0.145)
Observations 20,644 20,644 20,644
Number of firm clusters 3,591 3,591 3,591
Industry FE Yes Yes Yes
Year FE Yes Yes Yes
Adjusted R-squared 0.308 0.31 0.305
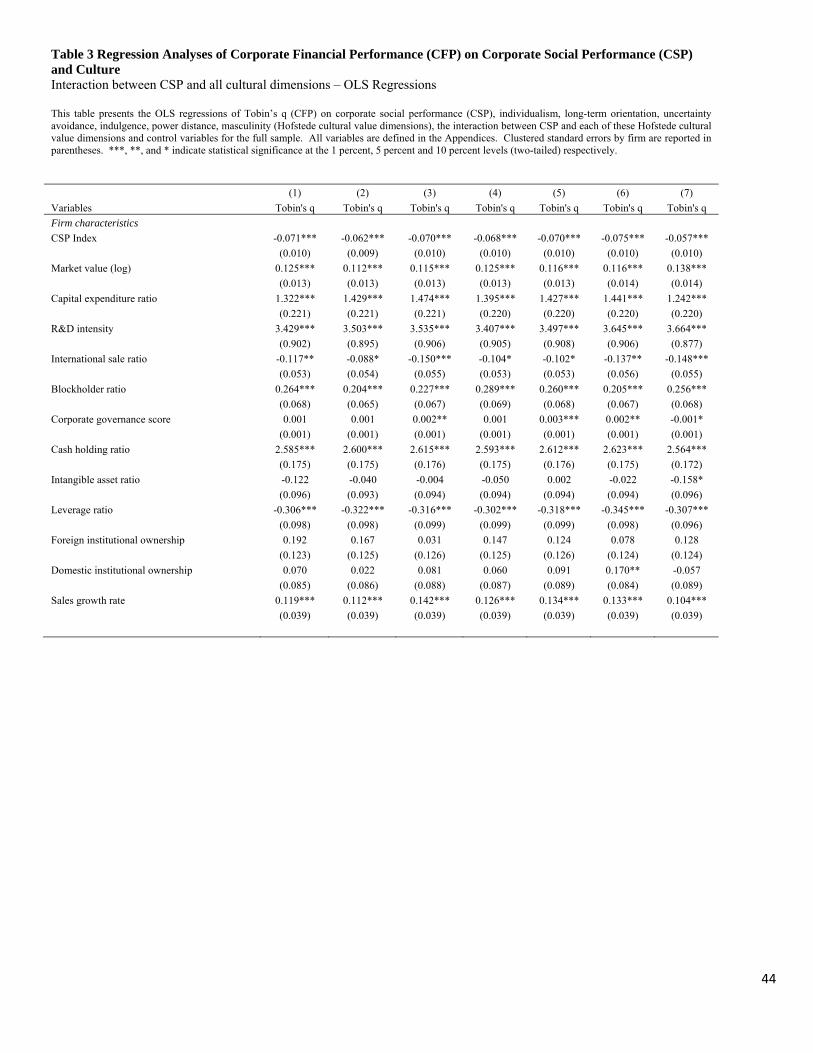
44
Table 3 Regression Analyses of Corporate Financial Performance (CFP) on Corporate Social Performance (CSP) and Culture Interaction between CSP and all cultural dimensions – OLS Regressions This table presents the OLS regressions of Tobin’s q (CFP) on corporate social performance (CSP), individualism, long-term orientation, uncertainty avoidance, indulgence, power distance, masculinity (Hofstede cultural value dimensions), the interaction between CSP and each of these Hofstede cultural value dimensions and control variables for the full sample. All variables are defined in the Appendices. Clustered standard errors by firm are reported in parentheses. ***, **, and * indicate statistical significance at the 1 percent, 5 percent and 10 percent levels (two-tailed) respectively.
(1) (2) (3) (4) (5) (6) (7)
Variables Tobin's q Tobin's q Tobin's q Tobin's q Tobin's q Tobin's q Tobin's q
Firm characteristics
CSP Index -0.071*** -0.062*** -0.070*** -0.068*** -0.070*** -0.075*** -0.057***
(0.010) (0.009) (0.010) (0.010) (0.010) (0.010) (0.010)
Market value (log) 0.125*** 0.112*** 0.115*** 0.125*** 0.116*** 0.116*** 0.138***
(0.013) (0.013) (0.013) (0.013) (0.013) (0.014) (0.014)
Capital expenditure ratio 1.322*** 1.429*** 1.474*** 1.395*** 1.427*** 1.441*** 1.242***
(0.221) (0.221) (0.221) (0.220) (0.220) (0.220) (0.220)
R&D intensity 3.429*** 3.503*** 3.535*** 3.407*** 3.497*** 3.645*** 3.664***
(0.902) (0.895) (0.906) (0.905) (0.908) (0.906) (0.877)
International sale ratio -0.117** -0.088* -0.150*** -0.104* -0.102* -0.137** -0.148***
(0.053) (0.054) (0.055) (0.053) (0.053) (0.056) (0.055)
Blockholder ratio 0.264*** 0.204*** 0.227*** 0.289*** 0.260*** 0.205*** 0.256***
(0.068) (0.065) (0.067) (0.069) (0.068) (0.067) (0.068)
Corporate governance score 0.001 0.001 0.002** 0.001 0.003*** 0.002** -0.001*
(0.001) (0.001) (0.001) (0.001) (0.001) (0.001) (0.001)
Cash holding ratio 2.585*** 2.600*** 2.615*** 2.593*** 2.612*** 2.623*** 2.564***
(0.175) (0.175) (0.176) (0.175) (0.176) (0.175) (0.172)
Intangible asset ratio -0.122 -0.040 -0.004 -0.050 0.002 -0.022 -0.158*
(0.096) (0.093) (0.094) (0.094) (0.094) (0.094) (0.096)
Leverage ratio -0.306*** -0.322*** -0.316*** -0.302*** -0.318*** -0.345*** -0.307***
(0.098) (0.098) (0.099) (0.099) (0.099) (0.098) (0.096)
Foreign institutional ownership 0.192 0.167 0.031 0.147 0.124 0.078 0.128
(0.123) (0.125) (0.126) (0.125) (0.126) (0.124) (0.124)
Domestic institutional ownership 0.070 0.022 0.081 0.060 0.091 0.170** -0.057
(0.085) (0.086) (0.088) (0.087) (0.089) (0.084) (0.089)
Sales growth rate 0.119*** 0.112*** 0.142*** 0.126*** 0.134*** 0.133*** 0.104***
(0.039) (0.039) (0.039) (0.039) (0.039) (0.039) (0.039)
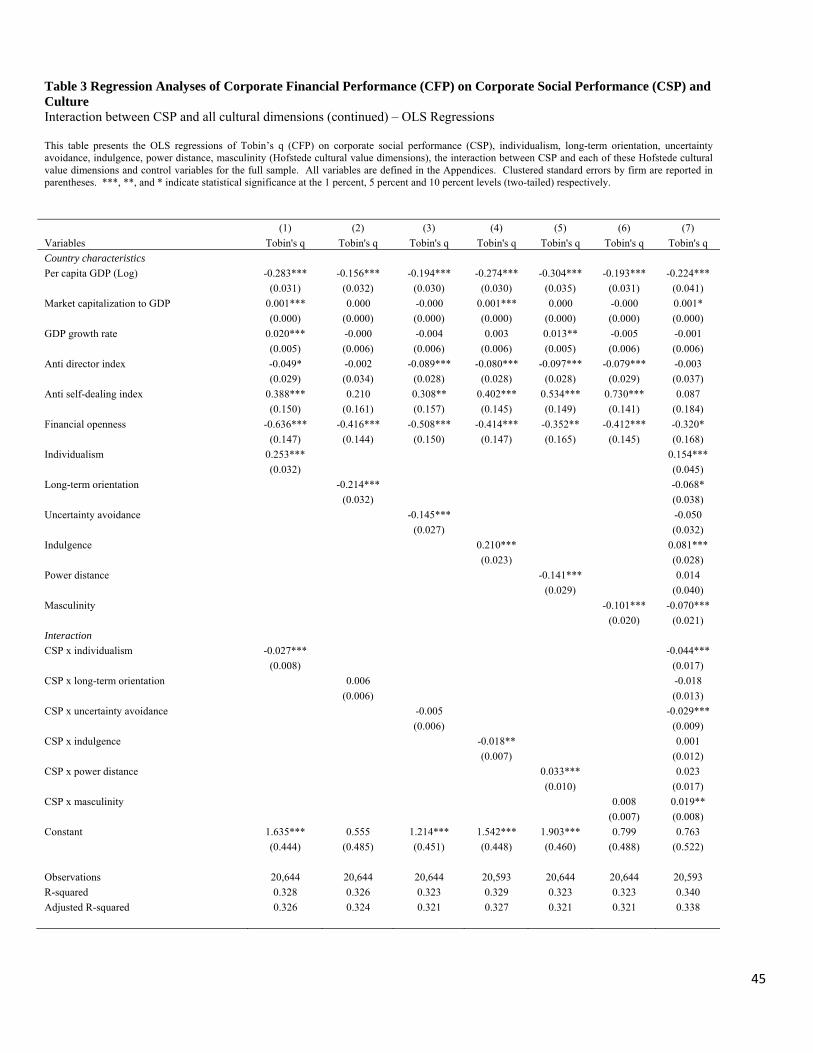
45
Table 3 Regression Analyses of Corporate Financial Performance (CFP) on Corporate Social Performance (CSP) and Culture Interaction between CSP and all cultural dimensions (continued) – OLS Regressions This table presents the OLS regressions of Tobin’s q (CFP) on corporate social performance (CSP), individualism, long-term orientation, uncertainty avoidance, indulgence, power distance, masculinity (Hofstede cultural value dimensions), the interaction between CSP and each of these Hofstede cultural value dimensions and control variables for the full sample. All variables are defined in the Appendices. Clustered standard errors by firm are reported in parentheses. ***, **, and * indicate statistical significance at the 1 percent, 5 percent and 10 percent levels (two-tailed) respectively. (1) (2) (3) (4) (5) (6) (7)
Variables Tobin's q Tobin's q Tobin's q Tobin's q Tobin's q Tobin's q Tobin's q
Country characteristics
Per capita GDP (Log) -0.283*** -0.156*** -0.194*** -0.274*** -0.304*** -0.193*** -0.224***
(0.031) (0.032) (0.030) (0.030) (0.035) (0.031) (0.041)
Market capitalization to GDP 0.001*** 0.000 -0.000 0.001*** 0.000 -0.000 0.001*
(0.000) (0.000) (0.000) (0.000) (0.000) (0.000) (0.000)
GDP growth rate 0.020*** -0.000 -0.004 0.003 0.013** -0.005 -0.001
(0.005) (0.006) (0.006) (0.006) (0.005) (0.006) (0.006)
Anti director index -0.049* -0.002 -0.089*** -0.080*** -0.097*** -0.079*** -0.003
(0.029) (0.034) (0.028) (0.028) (0.028) (0.029) (0.037)
Anti self-dealing index 0.388*** 0.210 0.308** 0.402*** 0.534*** 0.730*** 0.087
(0.150) (0.161) (0.157) (0.145) (0.149) (0.141) (0.184)
Financial openness -0.636*** -0.416*** -0.508*** -0.414*** -0.352** -0.412*** -0.320*
(0.147) (0.144) (0.150) (0.147) (0.165) (0.145) (0.168)
Individualism 0.253*** 0.154***
(0.032) (0.045)
Long-term orientation -0.214*** -0.068*
(0.032) (0.038)
Uncertainty avoidance -0.145*** -0.050
(0.027) (0.032)
Indulgence 0.210*** 0.081***
(0.023) (0.028)
Power distance -0.141*** 0.014
(0.029) (0.040)
Masculinity -0.101*** -0.070***
(0.020) (0.021)
Interaction
CSP x individualism -0.027*** -0.044***
(0.008) (0.017)
CSP x long-term orientation 0.006 -0.018
(0.006) (0.013)
CSP x uncertainty avoidance -0.005 -0.029***
(0.006) (0.009)
CSP x indulgence -0.018** 0.001
(0.007) (0.012)
CSP x power distance 0.033*** 0.023
(0.010) (0.017)
CSP x masculinity 0.008 0.019**
(0.007) (0.008)
Constant 1.635*** 0.555 1.214*** 1.542*** 1.903*** 0.799 0.763
(0.444) (0.485) (0.451) (0.448) (0.460) (0.488) (0.522)
Observations 20,644 20,644 20,644 20,593 20,644 20,644 20,593
R-squared 0.328 0.326 0.323 0.329 0.323 0.323 0.340
Adjusted R-squared 0.326 0.324 0.321 0.327 0.321 0.321 0.338
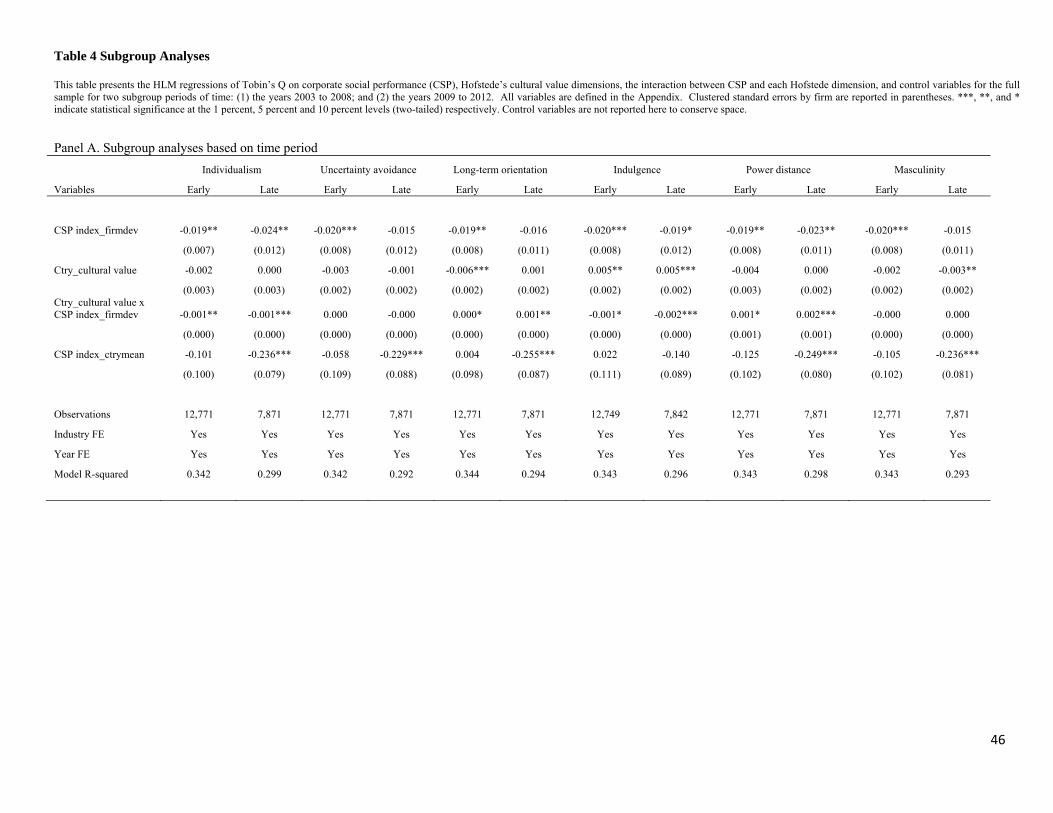
46
Table 4 Subgroup Analyses This table presents the HLM regressions of Tobin’s Q on corporate social performance (CSP), Hofstede’s cultural value dimensions, the interaction between CSP and each Hofstede dimension, and control variables for the full sample for two subgroup periods of time: (1) the years 2003 to 2008; and (2) the years 2009 to 2012. All variables are defined in the Appendix. Clustered standard errors by firm are reported in parentheses. ***, **, and * indicate statistical significance at the 1 percent, 5 percent and 10 percent levels (two-tailed) respectively. Control variables are not reported here to conserve space.
Panel A. Subgroup analyses based on time period
Individualism Uncertainty avoidance Long-term orientation Indulgence Power distance Masculinity
Variables Early Late Early Late Early Late Early Late Early Late Early Late
CSP index_firmdev -0.019** -0.024** -0.020*** -0.015 -0.019** -0.016 -0.020*** -0.019* -0.019** -0.023** -0.020*** -0.015
(0.007) (0.012) (0.008) (0.012) (0.008) (0.011) (0.008) (0.012) (0.008) (0.011) (0.008) (0.011)
Ctry_cultural value -0.002 0.000 -0.003 -0.001 -0.006*** 0.001 0.005** 0.005*** -0.004 0.000 -0.002 -0.003**
(0.003) (0.003) (0.002) (0.002) (0.002) (0.002) (0.002) (0.002) (0.003) (0.002) (0.002) (0.002) Ctry_cultural value x CSP index_firmdev -0.001** -0.001*** 0.000 -0.000 0.000* 0.001** -0.001* -0.002*** 0.001* 0.002*** -0.000 0.000
(0.000) (0.000) (0.000) (0.000) (0.000) (0.000) (0.000) (0.000) (0.001) (0.001) (0.000) (0.000)
CSP index_ctrymean -0.101 -0.236*** -0.058 -0.229*** 0.004 -0.255*** 0.022 -0.140 -0.125 -0.249*** -0.105 -0.236***
(0.100) (0.079) (0.109) (0.088) (0.098) (0.087) (0.111) (0.089) (0.102) (0.080) (0.102) (0.081)
Observations 12,771 7,871 12,771 7,871 12,771 7,871 12,749 7,842 12,771 7,871 12,771 7,871
Industry FE Yes Yes Yes Yes Yes Yes Yes Yes Yes Yes Yes Yes
Year FE Yes Yes Yes Yes Yes Yes Yes Yes Yes Yes Yes Yes
Model R-squared 0.342 0.299 0.342 0.292 0.344 0.294 0.343 0.296 0.343 0.298 0.343 0.293
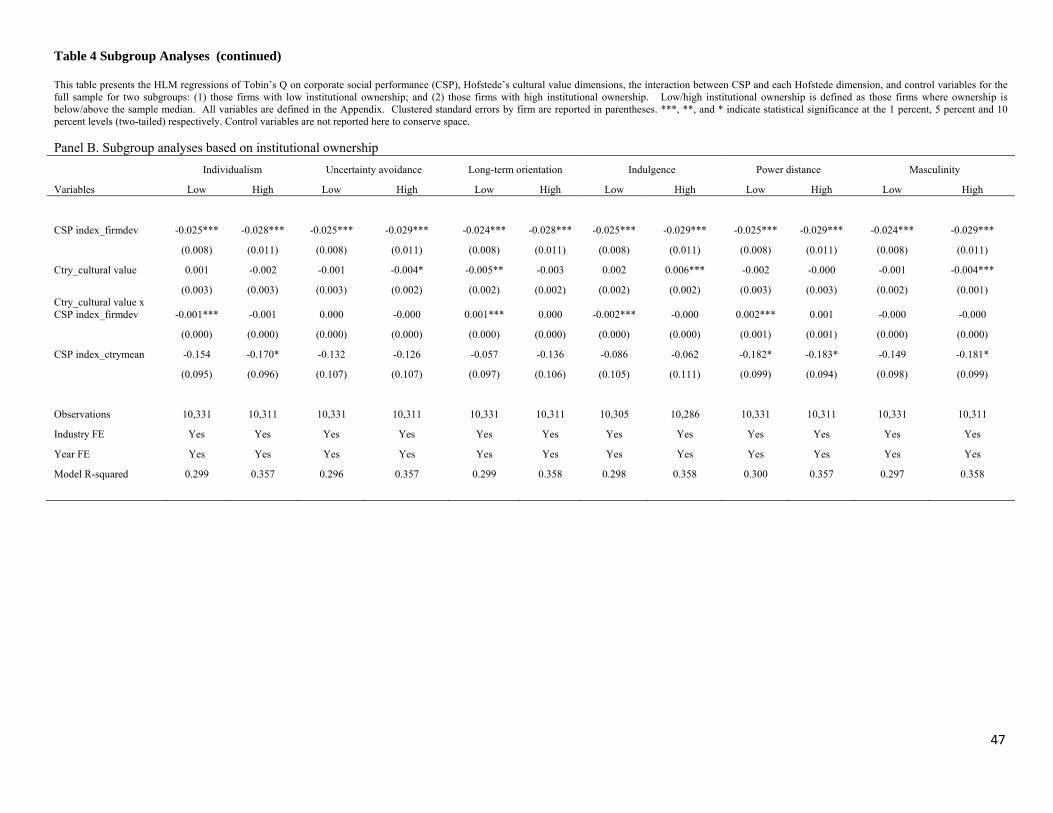
47
Table 4 Subgroup Analyses (continued) This table presents the HLM regressions of Tobin’s Q on corporate social performance (CSP), Hofstede’s cultural value dimensions, the interaction between CSP and each Hofstede dimension, and control variables for the full sample for two subgroups: (1) those firms with low institutional ownership; and (2) those firms with high institutional ownership. Low/high institutional ownership is defined as those firms where ownership is below/above the sample median. All variables are defined in the Appendix. Clustered standard errors by firm are reported in parentheses. ***, **, and * indicate statistical significance at the 1 percent, 5 percent and 10 percent levels (two-tailed) respectively. Control variables are not reported here to conserve space.
Panel B. Subgroup analyses based on institutional ownership
Individualism Uncertainty avoidance Long-term orientation Indulgence Power distance Masculinity
Variables Low High Low High Low High Low High Low High Low High
CSP index_firmdev -0.025*** -0.028*** -0.025*** -0.029*** -0.024*** -0.028*** -0.025*** -0.029*** -0.025*** -0.029*** -0.024*** -0.029***
(0.008) (0.011) (0.008) (0.011) (0.008) (0.011) (0.008) (0.011) (0.008) (0.011) (0.008) (0.011)
Ctry_cultural value 0.001 -0.002 -0.001 -0.004* -0.005** -0.003 0.002 0.006*** -0.002 -0.000 -0.001 -0.004***
(0.003) (0.003) (0.003) (0.002) (0.002) (0.002) (0.002) (0.002) (0.003) (0.003) (0.002) (0.001) Ctry_cultural value x CSP index_firmdev -0.001*** -0.001 0.000 -0.000 0.001*** 0.000 -0.002*** -0.000 0.002*** 0.001 -0.000 -0.000
(0.000) (0.000) (0.000) (0.000) (0.000) (0.000) (0.000) (0.000) (0.001) (0.001) (0.000) (0.000)
CSP index_ctrymean -0.154 -0.170* -0.132 -0.126 -0.057 -0.136 -0.086 -0.062 -0.182* -0.183* -0.149 -0.181*
(0.095) (0.096) (0.107) (0.107) (0.097) (0.106) (0.105) (0.111) (0.099) (0.094) (0.098) (0.099)
Observations 10,331 10,311 10,331 10,311 10,331 10,311 10,305 10,286 10,331 10,311 10,331 10,311
Industry FE Yes Yes Yes Yes Yes Yes Yes Yes Yes Yes Yes Yes
Year FE Yes Yes Yes Yes Yes Yes Yes Yes Yes Yes Yes Yes
Model R-squared 0.299 0.357 0.296 0.357 0.299 0.358 0.298 0.358 0.300 0.357 0.297 0.358