Embed Size (px)
Citation preview

E-Marketing Forum - 24 January 2012
The Mobile Landscape in France and Europe
Blandine Silverman, Director Mobile

Agenda
– Mobile Landscape
� Devices & Platforms
� From Phones Towards Connected Devices
� Mobile Media
� What? Content Consumption
� When? Usage Patterns
2© comScore, Inc. Proprietary.
Mobile Commerce
� Engagement
� Behaviour
� Transactions
� Mobile Marketing
� Several opportunities of contact with consumers

Mobile Landscape
Devices & Platforms
3© comScore, Inc. Proprietary.
Devices & Platforms
From Phones Towards Connected Devices
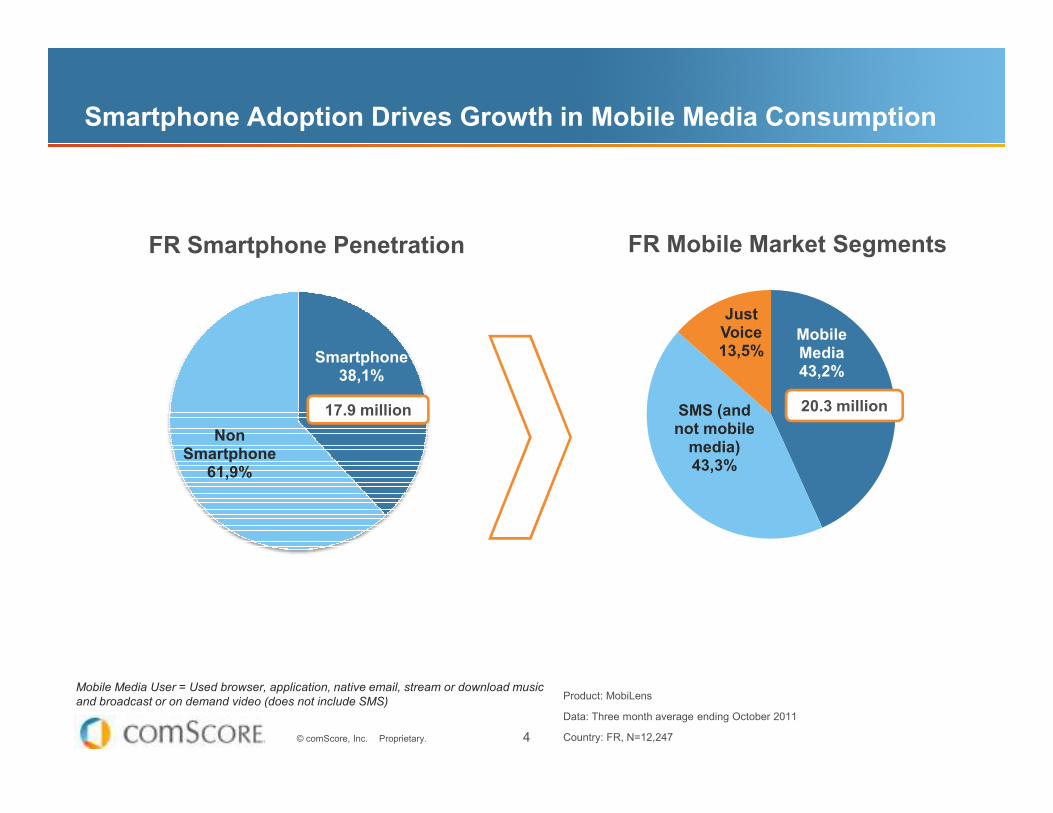
Smartphone 38,1%
FR Smartphone Penetration
Smartphone Adoption Drives Growth in Mobile Media Consumption
17.9 million
Mobile Media43,2%
SMS (and
Just Voice13,5%
FR Mobile Market Segments
20.3 million
4© comScore, Inc. Proprietary.
Non Smartphone
61,9%
Product: MobiLens
Data: Three month average ending October 2011
Country: FR, N=12,247
Mobile Media User = Used browser, application, native email, stream or download music
and broadcast or on demand video (does not include SMS)
17.9 million SMS (and not mobile media)43,3%
20.3 million
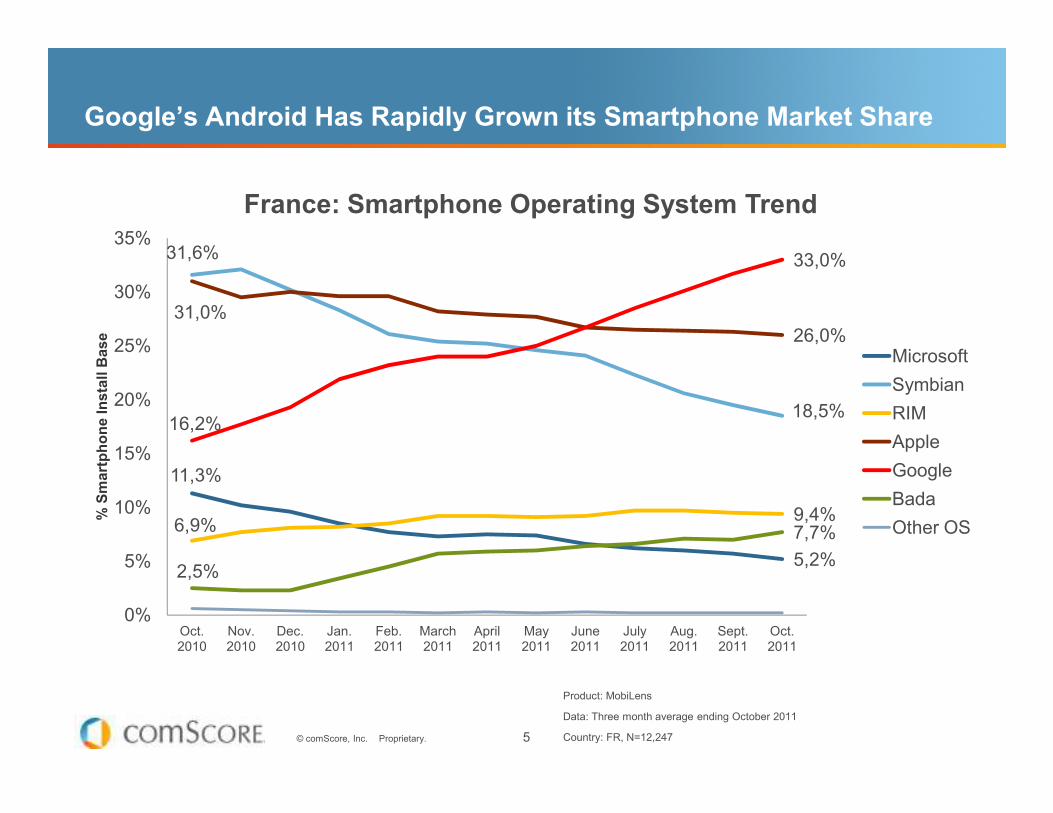
Google’s Android Has Rapidly Grown its Smartphone Market Share
31,6%
18,5%
31,0%
26,0%
33,0%
20%
25%
30%
35%
% Smartphone Install Base
France: Smartphone Operating System Trend
Microsoft
Symbian
RIM
5© comScore, Inc. Proprietary.
Product: MobiLens
Data: Three month average ending October 2011
Country: FR, N=12,247
11,3%
5,2%
18,5%
6,9%9,4%
16,2%
2,5%
7,7%
0%
5%
10%
15%
20%
Oct. 2010
Nov. 2010
Dec. 2010
Jan. 2011
Feb. 2011
March 2011
April 2011
May 2011
June 2011
July 2011
Aug. 2011
Sept. 2011
Oct. 2011
% Smartphone Install Base
RIM
Apple
Bada
Other OS

Google & Apple Gaining in Platform Penetration
� Symbian still represents largest installed base, but declining.
� Google’s Android platform has grown rapidly to represent second largest audience.
3 3 0, 2 %
2 5 0, 0 %3 0 0, 0 %3 5 0, 0 %
2 5 0 0 03 0 0 0 03 5 0 0 0
h
6© comScore, Inc. Proprietary.
Product: MobiLens
Data: Three month average ending October 2010 vs October2011
Country: EU5, N= 67,792
- 6, 2 % 5 4, 3 % 6 3 , 6 % - 1 2 , 0 %1 6 2 , 6 %
- 5 0, 0 %0, 0 %5 0, 0 %1 0 0, 0 %1 5 0, 0 %2 0 0, 0 %
05 0 0 01 0 0 0 01 5 0 0 02 0 0 0 02 5 0 0 0Sy m b ia n Go o g le Ap p le R I M M ic ro so ft O t he r O S
%Y ear onY ear Gr ow th
# Sm ar t ph on es (000 )
Oc t- 2 0 1 1 Gr ow t h

More Than Smartphones: the Tablets are Coming
� 6.6% of EU5 mobile phone owners also used a tablet in October 2011.
� All five countries have similar audiences with between 2.9 million and 3.2 million tablet users.
E U 5E S7© comScore, Inc. Proprietary.
Product: MobiLens
Data: Three month average ending October 2011
Country: EU5, N= 67,792
I TFRU KDE
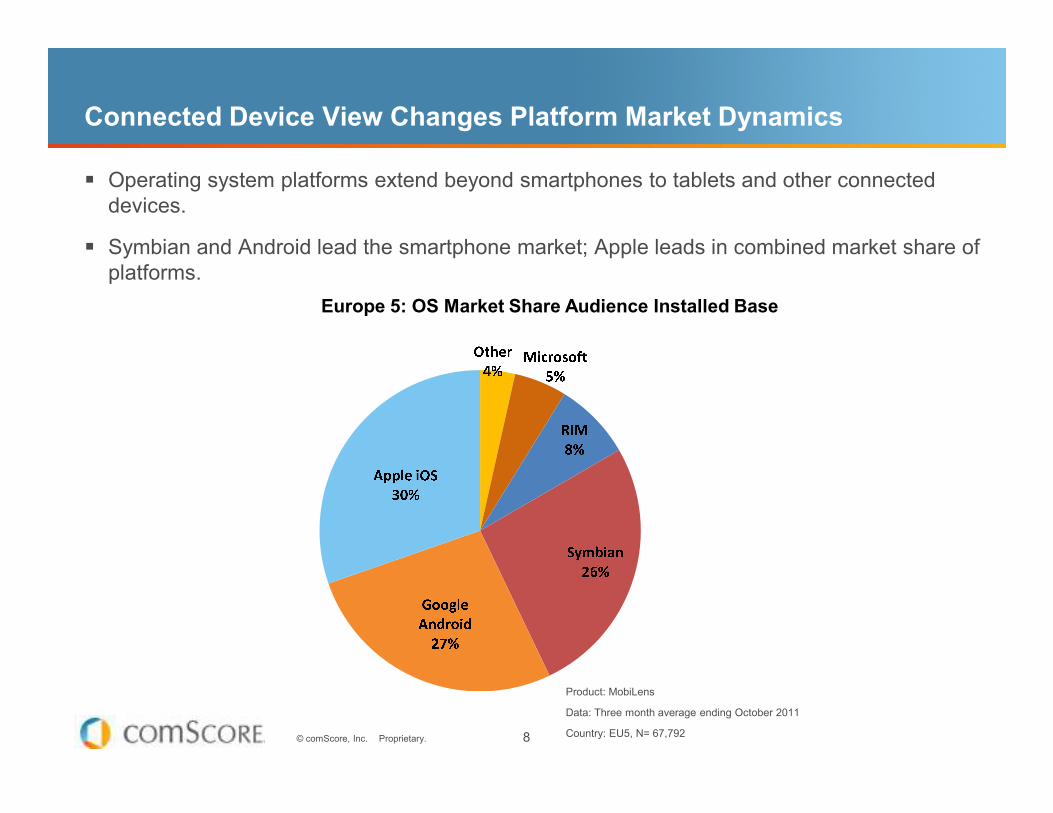
Connected Device View Changes Platform Market Dynamics
� Operating system platforms extend beyond smartphones to tablets and other connected
devices.
� Symbian and Android lead the smartphone market; Apple leads in combined market share of
platforms. O t he r4 % M i c r o s o f t5 %Europe 5: OS Market Share Audience Installed Base
8© comScore, Inc. Proprietary.
Product: MobiLens
Data: Three month average ending October 2011
Country: EU5, N= 67,792
R I M8 %Sy m b ia n2 6 %G o o g l eA n d r o i d27 %
Ap p l e i O S3 0 %
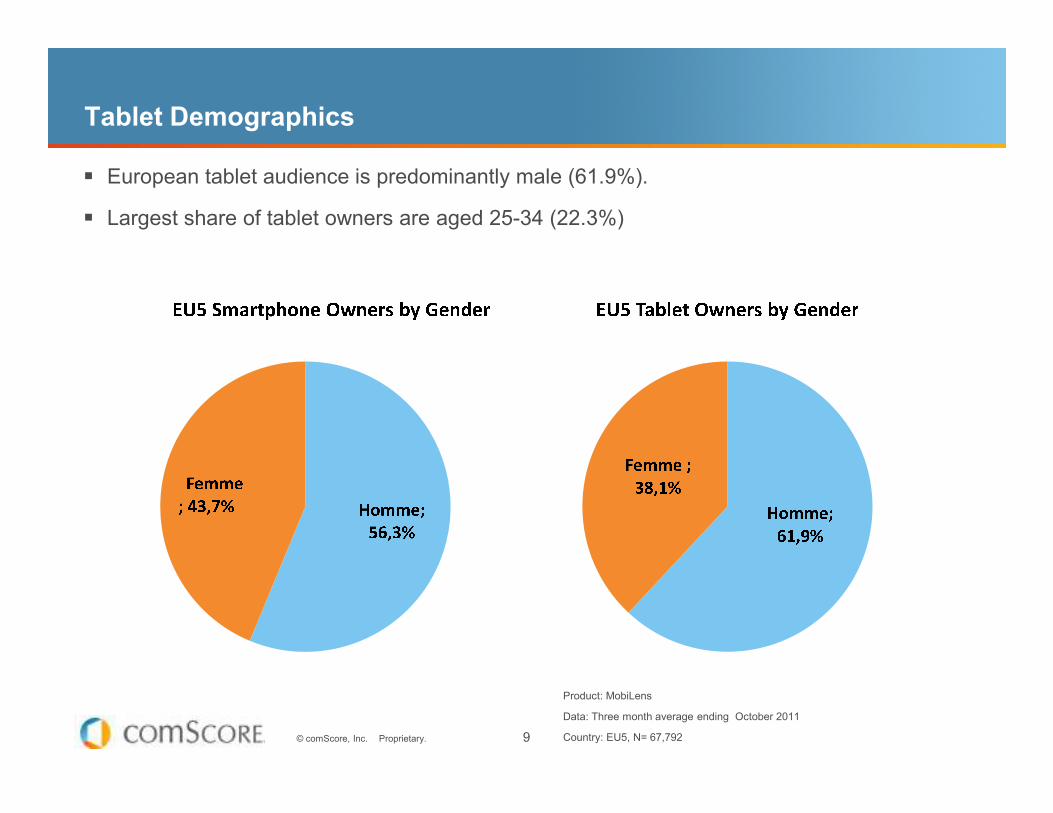
Tablet Demographics
� European tablet audience is predominantly male (61.9%).
� Largest share of tablet owners are aged 25-34 (22.3%)E U 5 S m a r tp ho n e Ow n e r s by G e n d e r E U 5 T a b l e t Ow n e r s by G e n d e r
9© comScore, Inc. Proprietary.
Product: MobiLens
Data: Three month average ending October 2011
Country: EU5, N= 67,792
Ho m me ;5 6, 3 %Fe m me; 4 3 , 7 % Ho m me ;6 1 , 9 %Fe m me ;3 8, 1 %
Mobile Media
Content Consumption
10© comScore, Inc. Proprietary.
Content Consumption
Usage Patterns
42,0%
30,0%
35,0%
40,0%
45,0%
France: Used App OR Browser
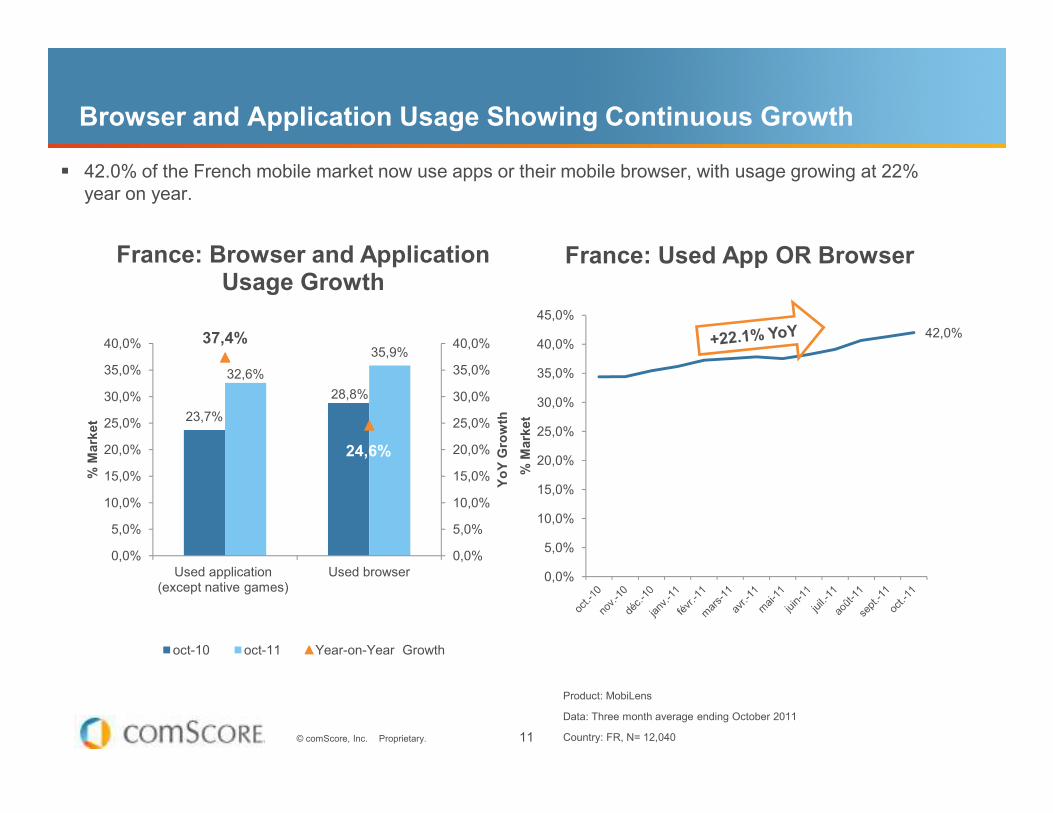
Browser and Application Usage Showing Continuous Growth
� 42.0% of the French mobile market now use apps or their mobile browser, with usage growing at 22%
year on year.
28,8%
32,6%
35,9%37,4%
30,0%
35,0%
40,0%
30,0%
35,0%
40,0%
France: Browser and Application Usage Growth
11© comScore, Inc. Proprietary.
0,0%
5,0%
10,0%
15,0%
20,0%
25,0%
30,0%
% Market
Product: MobiLens
Data: Three month average ending October 2011
Country: FR, N= 12,040
23,7%
24,6%
0,0%
5,0%
10,0%
15,0%
20,0%
25,0%
0,0%
5,0%
10,0%
15,0%
20,0%
25,0%
Used application (except native games)
Used browser
YoY Growth
% Market
oct-10 oct-11 Year-on-Year Growth

Top 10 Smartphone Categories
� Social Networking reached a mobile audience of over 8 million users and was among the fastest growing
categories with an increase of 81.6% year on year.
� France has seen explosive growth in mobile access to bank accounts – almost 100% year-on-year –
75,5%81,6%
99,9%100,0%
120,0%
7 000
8 000
9 000
10 000
Smartphone Owners (000)
France: Top 10 Smartphone Categories
12© comScore, Inc. Proprietary.
Product: MobiLens
Data: Three month average ending October 2011
Country: FR, N=12,247
75,5% 71,7%81,6%
68,0% 68,3%
56,9%63,8%
69,5% 67,8%
0,0%
20,0%
40,0%
60,0%
80,0%
0
1 000
2 000
3 000
4 000
5 000
6 000
7 000
Personal Email
Weather Social Networking
Search News Maps Instant Messaging
Bank Accounts
Sports Information
Work Email
% YoY Growth
Smartphone Owners (000)
Oct-2010 Oct-2011 Year on Year Growth

PCs for Lunch, Tablets for Dinner on Weekdays
� Most tablet activity was observed in the late evening between 9pm and 11pm.
� Computer-based traffic had its highest relative consumption during typical office hours,
spiking around lunchtime.
1 0 %E U 5: S h a re o f De v ic e Pa ge T ra f f ic O ve r a Da y : We d ne s d a y 7 De c e m be r 2 0 1 1Ta b le t Mo b i le Co m p u te r
13© comScore, Inc. Proprietary.
Product: Custom Analytix
Data: 7 December 2011
Country: EU5
0 %1 %2 %3 %4 %5 %6 %7 %8 %9 %1 2: 0 0 A M 6: 0 0 A M 1 2: 0 0 P M 6: 0 0 P M

Mobile Commerce
Engagement
14© comScore, Inc. Proprietary.
Engagement
Behaviour
Transactions
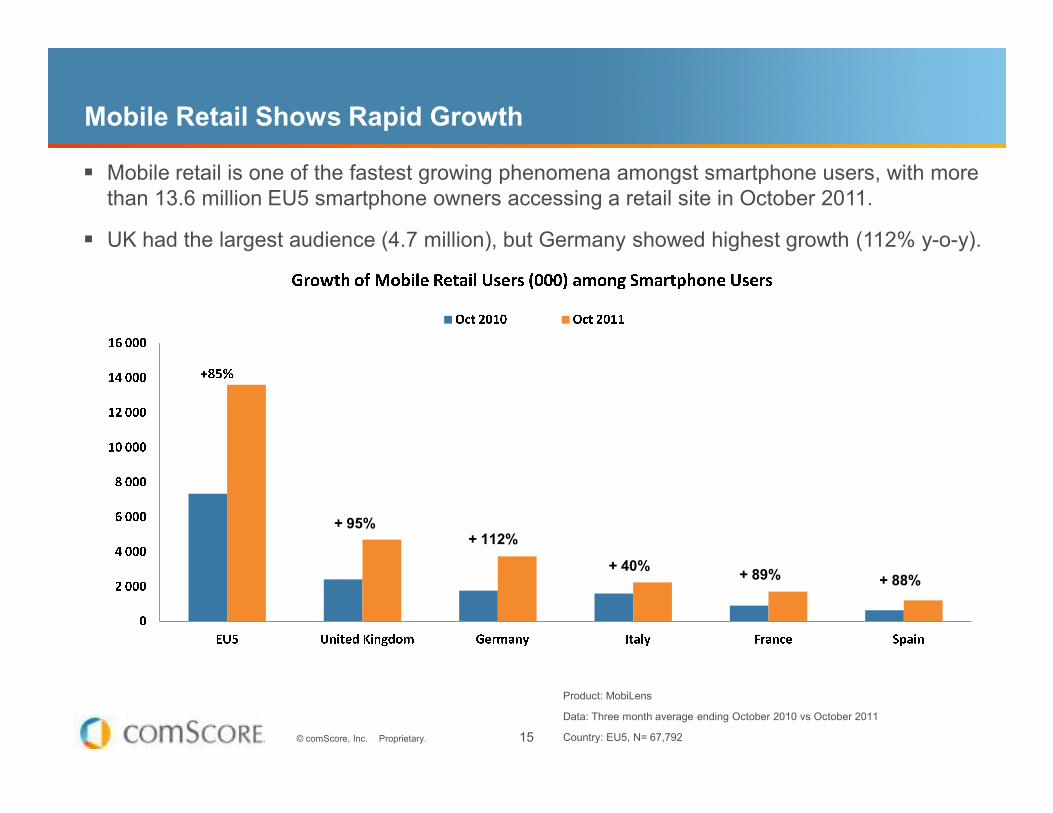
Mobile Retail Shows Rapid Growth
� Mobile retail is one of the fastest growing phenomena amongst smartphone users, with more
than 13.6 million EU5 smartphone owners accessing a retail site in October 2011.
� UK had the largest audience (4.7 million), but Germany showed highest growth (112% y-o-y).
1 4 0 0 01 6 0 0 0 G ro w t h o f Mo b i le Re t a i l U se r s ( 0 0 0 ) a mo n g S m a r t p ho ne U se r sOc t 2 0 1 0 Oc t 2 0 1 1+ 8 5 %15© comScore, Inc. Proprietary.
Product: MobiLens
Data: Three month average ending October 2010 vs October 2011
Country: EU5, N= 67,792
02 0 0 04 0 0 06 0 0 08 0 0 01 0 0 0 01 2 0 0 0E U 5 Un i te d K in g do m Ge r m a n y I t a l y F ra n c e S p a in
+ 95%+ 112%
+ 40%+ 89% + 88%

48% of French Smartphone Owners Use Their Phone for a Shopping
Activity While in Retail Store
� Taking a picture of a product is the most common activity with 23.9% reach amongst all ‘Mobile
Shoppers’, followed by texting or calling friends or family about a product with 16.2% reach
12,1%
13,6%
16,2%
23,9%
Scanned a product barcode
Sent picture of product to family/friends
Texted or called friends/family about a product
Took picture of a product
France: Activities Performed in Retail Store among Smartphone Owners
16© comScore, Inc. Proprietary.
Product: MobiLens
Data: Three month average ending October 2011
Country: FR, N=12,247
1,8%
3,2%
4,3%
5,2%
8,6%
12,1%
0,0% 5,0% 10,0% 15,0% 20,0% 25,0% 30,0%
Checked product availability
Found coupons or deals
Researched product features
Compared product prices
Found store location
Scanned a product barcode
% Smartphone

Deal-A-Day Conquers Mobile in France
Top 5 Deal-a-Day
Brands
% Reach Among
Deal-a-Day Users
� 8.7% of France’s Smartphone owners used deal-a-day services
in October 2011, which accounts for almost 1.6 million.
� 21.2% of deal-a-day users accessed the service almost every
day.
� Groupon is by far the most popular brand among deal-a-day
users with 62.4% reach.
47,2%50,0%
Frequency of Using Deal-a-Day
17© comScore, Inc. Proprietary.
Brands Deal-a-Day Users
Groupon 62.4%
KGB 17.1%
Le Bon Plan Du Jour 6.3%
LivingSocial 5.9%
Lecoindesprivileges 5.0%
Product: MobiLens
Data: Three month average ending October 2011
Country: FR, N=12,247
21,2%
31,6%
47,2%
0,0%
5,0%
10,0%
15,0%
20,0%
25,0%
30,0%
35,0%
40,0%
45,0%
50,0%
Almost every day
At least once each week
Once to three times
throughout the month
% Smartphone Owners Using Deal-a-
Day

Mobile Marketing
Several opportunities of adverting contact
18© comScore, Inc. Proprietary.
Several opportunities of adverting contact

France: Methods of Interacting
Brands Can Choose a Number of Methods to Start a Dialogue with
Consumers Using a Smartphone
� Place banner and text ads on mobile internet sites or in applications: 14 millions of the French
Smartphone market use Mobile Media and 29% of those users already recalled seeing a web/app ad in
October 2011.
� Build a mobile Facebook page: 8,1 millions of all French Smartphone owners access Social
Networking sites and 39% of those read posts from organizations, brands or events.
� Place an ad inside a game: You’ll reach 4,5 millions of the Smartphone market who play games and
43% of those players said, they have already seen in-game ads.
19© comScore, Inc. Proprietary.
14 millions
8,1 millions
4,5 millions
Mobile Media Social Networking Played Games
Base: Smartphone
France: Methods of Interacting among Smartphone Owners
Product: MobiLens
Data: Three month average ending October 2011
Country: FR, N=12,247
29% of Mobile
Media users
recalled seeing a
web/app ad39% of Social
Networking users
read posts from
organizations
/brands / events
43% of Mobile
Games Players
saw in-game ads
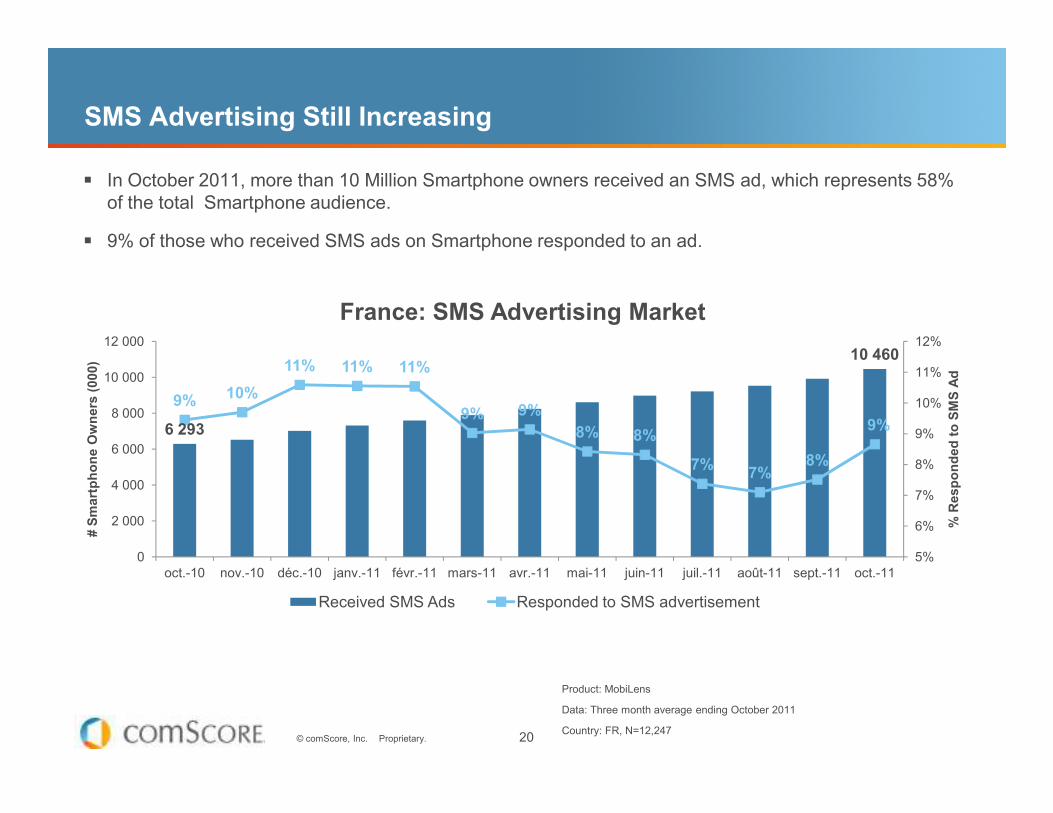
SMS Advertising Still Increasing
� In October 2011, more than 10 Million Smartphone owners received an SMS ad, which represents 58%
of the total Smartphone audience.
� 9% of those who received SMS ads on Smartphone responded to an ad.
10 460
9%10%
11% 11% 11%
9% 9%10%
11%
12%
8 000
10 000
12 000
% Responded to SMS Ad
# Smartphone Owners (000)
France: SMS Advertising Market
20© comScore, Inc. Proprietary.
Product: MobiLens
Data: Three month average ending October 2011
Country: FR, N=12,247
6 293
9%9% 9%
8% 8%
7%7%
8%
9%
5%
6%
7%
8%
9%
10%
0
2 000
4 000
6 000
8 000
oct.-10 nov.-10 déc.-10 janv.-11 févr.-11 mars-11 avr.-11 mai-11 juin-11 juil.-11 août-11 sept.-11 oct.-11
% Responded to SMS Ad
# Smartphone Owners (000)
Received SMS Ads Responded to SMS advertisement

18% of Mobile Games Players with a Smartphone Made In-Game
Purchase
� Most in-game purchases are made to buy cash points or tokens with 48.9% reach among in-game
purchases, followed by purchasing virtual goods with 42.4%.
More than 4.5 million
played mobile games on
their Smartphones48,9%
42,4%50,0%
60,0%
Game Purchase with Smartphone
Type of In-Game Purchase
21© comScore, Inc. Proprietary.
Product: MobiLens
Data: Three month average ending October 2011
Country: FR, N=12,247
18% of
those made
in-game
purchases
42,4%
24,8%
3,7%
0,0%
10,0%
20,0%
30,0%
40,0%
Purchased cash, points, or tokens
Purchased virtual goods
Upgraded game or
added levels
Purchased gift for another player
% Made In-Game Purchase with Smartphone