Embed Size (px)
Citation preview
C A S U A L G A M E S S E C T O R R E P O R T 2 0 1 6
CGA.
THE MOBILE GAMES MARKET HOW TO COMPETE IN THE CROWDED MARKETPLACE
Consumers will spend $6.5 Bn more on mobile games this year than last, how can you claim your share?
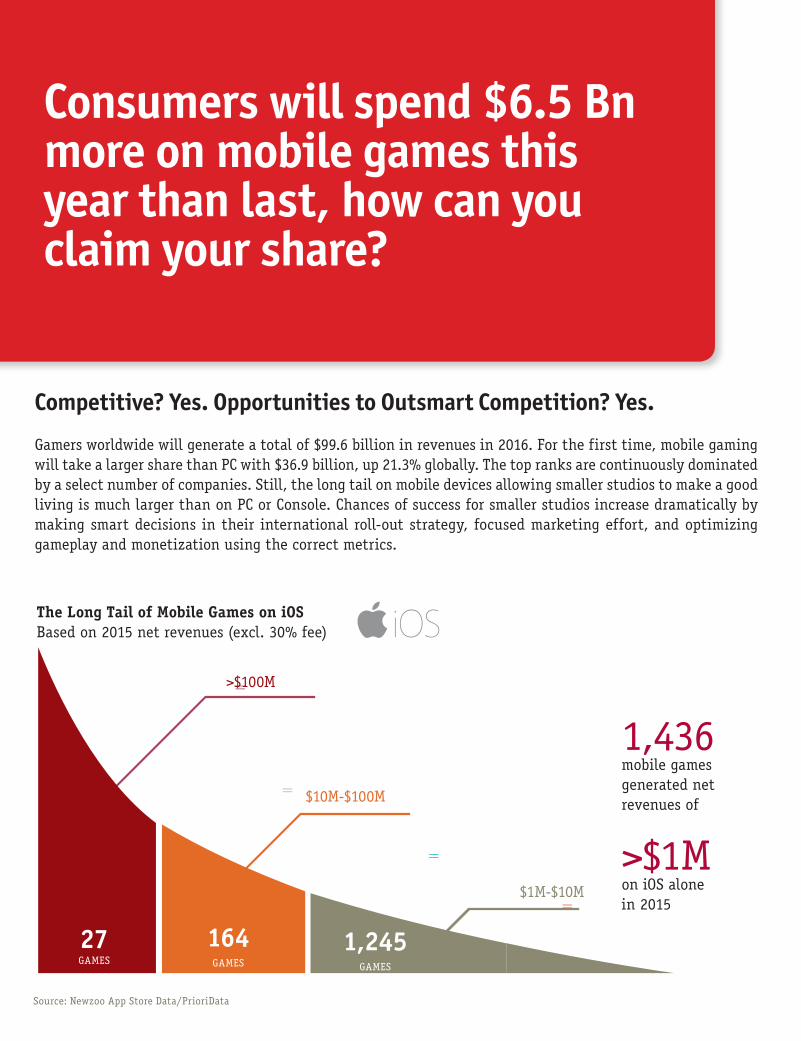
Competitive? Yes. Opportunities to Outsmart Competition? Yes.
Gamers worldwide will generate a total of $99.6 billion in revenues in 2016. For the first time, mobile gaming will take a larger share than PC with $36.9 billion, up 21.3% globally. The top ranks are continuously dominated by a select number of companies. Still, the long tail on mobile devices allowing smaller studios to make a good living is much larger than on PC or Console. Chances of success for smaller studios increase dramatically by making smart decisions in their international roll-out strategy, focused marketing effort, and optimizing gameplay and monetization using the correct metrics.
Source: Newzoo App Store Data/PrioriData
1,436mobile games generated net revenues of
>$1Mon iOS alonein 2015
=
=
=
=
>$100M
$10M-$100M
$1M-$10M
27 GAMES
164 GAMES
1,245GAMES
The Long Tail of Mobile Games on iOSBased on 2015 net revenues (excl. 30% fee)
COMPETING IN MOBILE | CASUAL GAMES ASSOCIATION 3
Source: Newzoo Global Games Market Report Premium
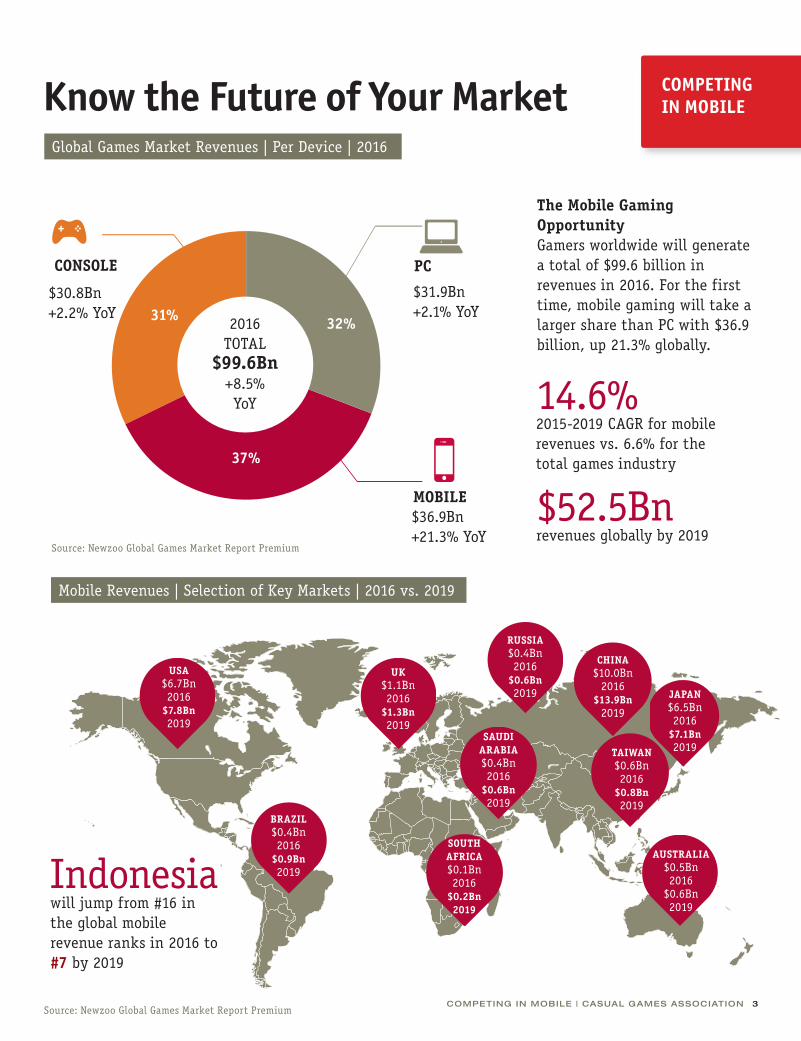
Know the Future of Your Market
Mobile Revenues | Selection of Key Markets | 2016 vs. 2019
Global Games Market Revenues | Per Device | 2016
Source: Newzoo Global Games Market Report Premium
Indonesia will jump from #16 in the global mobile revenue ranks in 2016 to #7 by 2019
$30.8Bn +2.2% YoY
PC
MOBILE
$31.9Bn +2.1% YoY
CONSOLE
$36.9Bn +21.3% YoY
The Mobile Gaming OpportunityGamers worldwide will generate a total of $99.6 billion in revenues in 2016. For the first time, mobile gaming will take a larger share than PC with $36.9 billion, up 21.3% globally.
14.6%2015-2019 CAGR for mobile revenues vs. 6.6% for the total games industry
$52.5Bnrevenues globally by 2019
COMPETING IN MOBILE
2016 TOTAL
$99.6Bn+8.5%YoY
31% 32%
37%
2019
AUSTRALIA$0.5Bn2016
$0.6Bn2019
JAPAN$6.5Bn2016
$7.1Bn2019
SOUTHAFRICA$0.1Bn2016
$0.2Bn2019
RUSSIA$0.4Bn2016
$0.6Bn2019
CHINA$10.0Bn
2016$13.9Bn
2019
UK$1.1Bn2016
$1.3Bn2019
SAUDIARABIA$0.4Bn2016
$0.6Bn2019
BRAZIL$0.4Bn2016
$0.9Bn2019
USA$6.7Bn2016
$7.8Bn2019
TAIWAN$0.6Bn2016
$0.8Bn2019
4
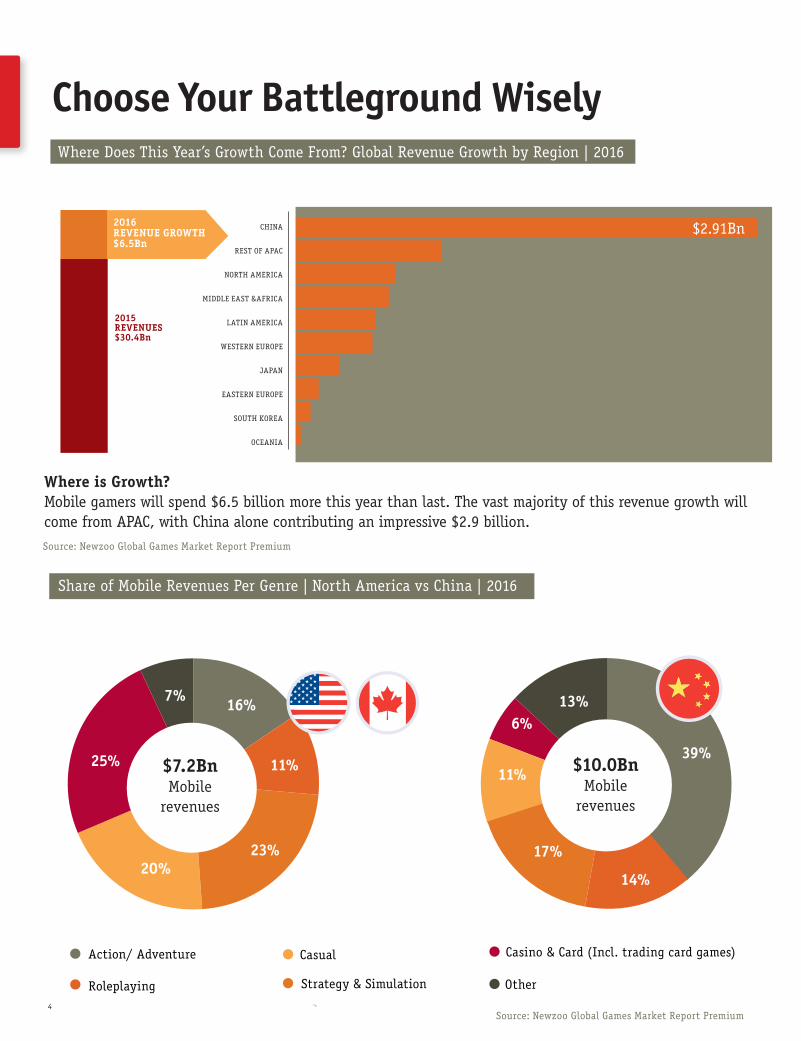
Where Does This Year’s Growth Come From? Global Revenue Growth by Region | 2016
Source: Newzoo Global Games Market Report Premium
Source: Newzoo Global Games Market Report Premium
Choose Your Battleground Wisely
2016REVENUE GROWTH$6.5Bn
2015REVENUES$30.4Bn
Where is Growth?Mobile gamers will spend $6.5 billion more this year than last. The vast majority of this revenue growth will come from APAC, with China alone contributing an impressive $2.9 billion.
CHINA
REST OF APAC
NORTH AMERICA
MIDDLE EAST &AFRICA
LATIN AMERICA
WESTERN EUROPE
JAPAN
EASTERN EUROPE
SOUTH KOREA
OCEANIA
$0.89Bn
$2.91Bn
$0.61Bn$0.57Bn
$0,49Bn$0.47Bn
$0.27Bn$0.14Bn
$0.09Bn$0.03Bn
Share of Mobile Revenues Per Genre | North America vs China | 2016
16%
20%23%
7%
11%25% 39%
13%6%
17%
11%
14%
Other
Action/ Adventure
Roleplaying Strategy & Simulation
Casual Casino & Card (Incl. trading card games)
$7.2BnMobile
revenues
$10.0BnMobile
revenues
COMPETING IN MOBILE | CASUAL GAMES ASSOCIATION 5
COMPETING IN MOBILE
39%
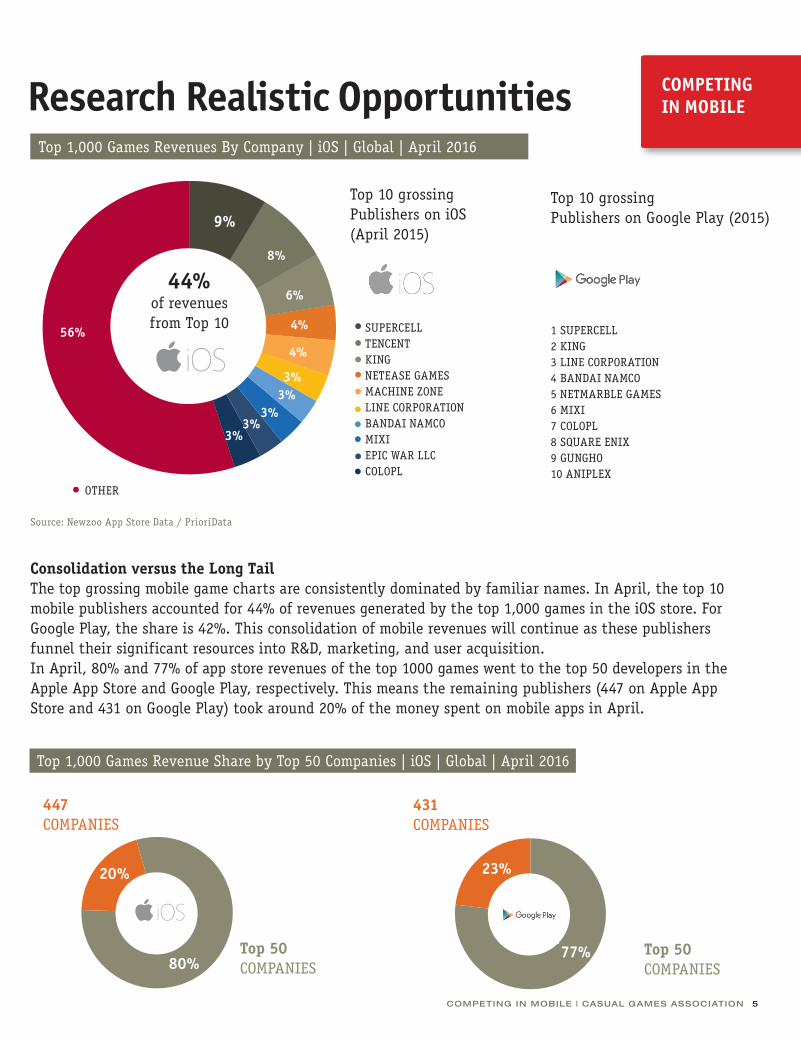
Research Realistic OpportunitiesTop 1,000 Games Revenues By Company | iOS | Global | April 2016
Source: Newzoo App Store Data / PrioriData
Consolidation versus the Long TailThe top grossing mobile game charts are consistently dominated by familiar names. In April, the top 10 mobile publishers accounted for 44% of revenues generated by the top 1,000 games in the iOS store. For Google Play, the share is 42%. This consolidation of mobile revenues will continue as these publishers funnel their significant resources into R&D, marketing, and user acquisition. In April, 80% and 77% of app store revenues of the top 1000 games went to the top 50 developers in the Apple App Store and Google Play, respectively. This means the remaining publishers (447 on Apple App Store and 431 on Google Play) took around 20% of the money spent on mobile apps in April.
Top 1,000 Games Revenue Share by Top 50 Companies | iOS | Global | April 2016
COMPETING IN MOBILE
431COMPANIES
447COMPANIES
Top 50COMPANIES
Top 50COMPANIES
56%
9%
8%
6%
4%
20%
80%
23%
77%
44%
of revenues from Top 10
Top 10 grossingPublishers on iOS (April 2015)
Top 10 grossingPublishers on Google Play (2015)
1 SUPERCELL2 KING3 LINE CORPORATION4 BANDAI NAMCO5 NETMARBLE GAMES6 MIXI7 COLOPL8 SQUARE ENIX9 GUNGHO10 ANIPLEX
SUPERCELLTENCENT KINGNETEASE GAMES MACHINE ZONELINE CORPORATION BANDAI NAMCOMIXI EPIC WAR LLCCOLOPL
4%
3%3%
3%3%
3%
OTHER
6
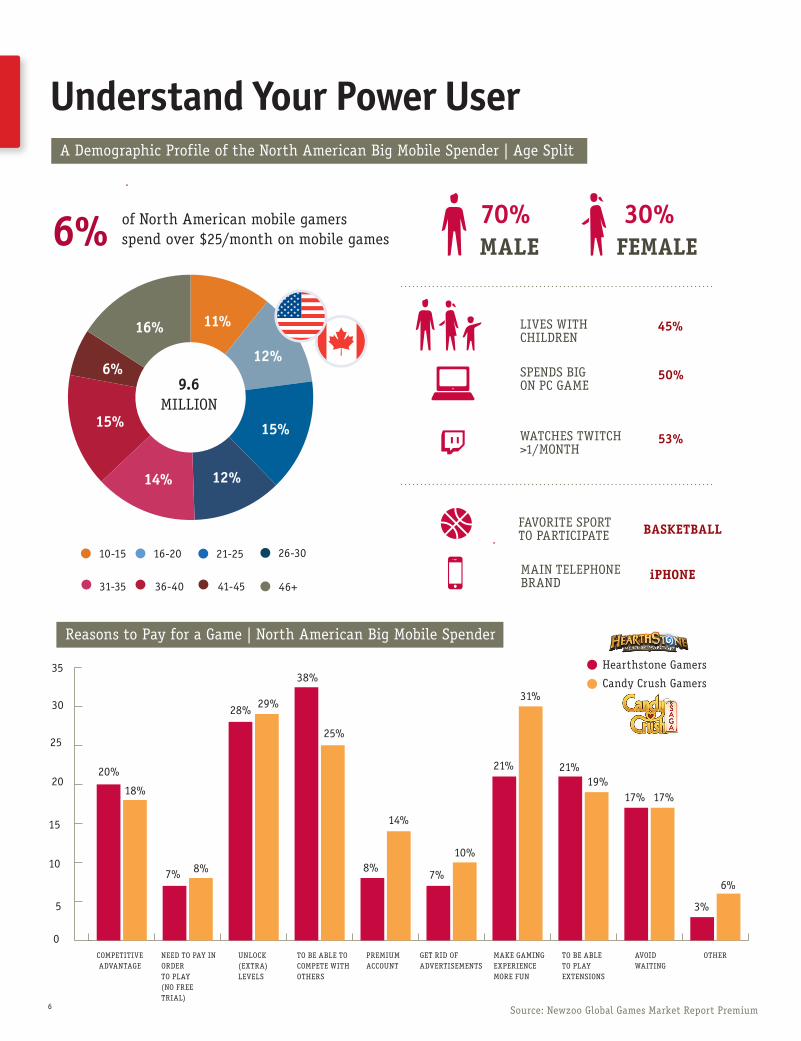
Understand Your Power UserA Demographic Profile of the North American Big Mobile Spender | Age Split
Reasons to Pay for a Game | North American Big Mobile Spender
of North American mobile gamers spend over $25/month on mobile games
Source: Newzoo Global Games Market Report Premium
35
30
25
20
15
10
5
0
20%
18%
7% 8% 8%7%
10%
14%
28% 29%
38%
25%
21%
31%
21%19%
17% 17%
3%
6%
COMPETITIVE ADVANTAGE
NEED TO PAY IN ORDERTO PLAY (NO FREE TRIAL)
UNLOCK(EXTRA)LEVELS
TO BE ABLE TO COMPETE WITH OTHERS
PREMIUM ACCOUNT
GET RID OF ADVERTISEMENTS
MAKE GAMINGEXPERIENCE MORE FUN
TO BE ABLE TO PLAY EXTENSIONS
AVOID WAITING
OTHER
Hearthstone Gamers
Candy Crush Gamers
6%
11%
12%
15%
12%
9.6MILLION
16%
14%
15%
6%
LIVES WITH CHILDREN
SPENDS BIG ON PC GAME
FAVORITE SPORT TO PARTICIPATE
WATCHES TWITCH >1/MONTH
FEMALEMALE70% 30%
45%
53%
50%
MAIN TELEPHONE BRAND
BASKETBALL
iPHONE
10-15 16-20 21-25 26-30
31-35 36-40 41-45 46+
COMPETING IN MOBILE | CASUAL GAMES ASSOCIATION 7
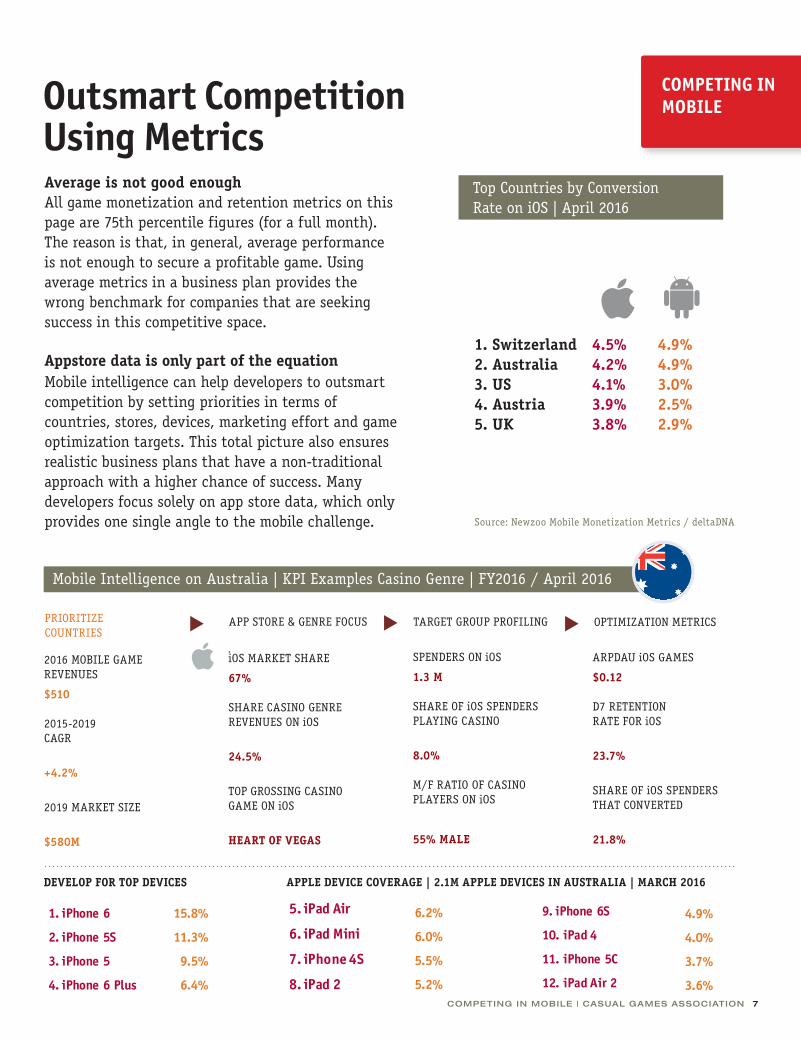
Outsmart Competition Using Metrics
COMPETING INMOBILE
Mobile Intelligence on Australia | KPI Examples Casino Genre | FY2016 / April 2016
Source: Newzoo Mobile Monetization Metrics / deltaDNA
Average is not good enoughAll game monetization and retention metrics on this page are 75th percentile figures (for a full month). The reason is that, in general, average performance is not enough to secure a profitable game. Using average metrics in a business plan provides the wrong benchmark for companies that are seeking success in this competitive space.
Mobile intelligence can help developers to outsmart competition by setting priorities in terms of countries, stores, devices, marketing effort and game optimization targets. This total picture also ensures realistic business plans that have a non-traditional approach with a higher chance of success. Many developers focus solely on app store data, which only provides one single angle to the mobile challenge.
Top Countries by Conversion Rate on iOS | April 2016
1. Switzerland2. Australia 3. US 4. Austria5. UK
4.5%4.2% 4.1% 3.9%3.8%
4.9%4.9% 3.0% 2.5%2.9%
PRIORITIZECOUNTRIES
APP STORE & GENRE FOCUS TARGET GROUP PROFILING OPTIMIZATION METRICSu u u
iOS MARKET SHARE
67%
SHARE CASINO GENREREVENUES ON iOS
24.5%
TOP GROSSING CASINOGAME ON iOS
HEART OF VEGAS
2016 MOBILE GAME REVENUES
$510
2015-2019 CAGR
+4.2%
2019 MARKET SIZE
$580M
SPENDERS ON iOS
1.3 M
SHARE OF iOS SPENDERS PLAYING CASINO
8.0%
M/F RATIO OF CASINO PLAYERS ON iOS
55% MALE
ARPDAU iOS GAMES
$0.12
D7 RETENTIONRATE FOR iOS
23.7%
SHARE OF iOS SPENDERS THAT CONVERTED
21.8%
1. iPhone 6
2. iPhone 5S
3. iPhone 5
4. iPhone 6 Plus
5. iPad Air
6. iPad Mini
7. iPhone 4S
8. iPad 2
9. iPhone 6S
10. iPad 4
11. iPhone 5C
12. iPad Air 2
1. iPhone 6
2. iPhone 5S
3. iPhone 5
4. iPhone 6 Plus
5. iPad Air
6. iPad Mini
7. iPhone 4S
8. iPad 2
9. iPhone 6S
10. iPad 4
11. iPhone 5C
12. iPad Air 2
1. iPhone 6
2. iPhone 5S
3. iPhone 5
4. iPhone 6 Plus
5. iPad Air
6. iPad Mini
7. iPhone 4S
8. iPad 2
9. iPhone 6S
10. iPad 4
11. iPhone 5C
12. iPad Air 2
15.8%
11.3%
9.5%
6.4%
6.2%
6.0%
5.5%
5.2%
4.9%
4.0%
3.7%
3.6%
15.8%
11.3%
9.5%
6.4%
6.2%
6.0%
5.5%
5.2%
4.9%
4.0%
3.7%
3.6%
15.8%
11.3%
9.5%
6.4%
6.2%
6.0%
5.5%
5.2%
4.9%
4.0%
3.7%
3.6%
Appstore data is only part of the equation
APPLE DEVICE COVERAGE | 2.1M APPLE DEVICES IN AUSTRALIA | MARCH 2016DEVELOP FOR TOP DEVICES

ABOUT THE CASUAL GAMES ASSOCIATION
When it comes to the health of your business, the more things that work
together, the better. Which is why the Casual Games Association is a
critical portion of the success of your company and the industry as a
whole. It means that you and your team have access to cutting-edge
educational resources and are connected to thousands of other game
industry professionals, members of the press and service providers
around the globe.
Learn more at http://www.cga.global
For press inquiries, please email [email protected]
Learn more about the games industry with the best speakers, networking, lectures and data to help you succeed in a crowded market at:
Casual Connect Tel-Aviv 1 - 3 November 2016Casual Connect Europe in Berlin 7 - 9 February 2017
See you in Tel Aviv
Casual Connect Tel Aviv 1 - 3 November 2016
About NewzooNewzoo is the global leader in mobile, games, and eSports market intelligence with offices in Amsterdam, Shanghai, and San Francisco. We provide our clients with a mix of market trends, platform data, in-game metrics, revenue projections, and consumer insights across all continents, screens and business models. We are proud to work for the majority of top game and eSports companies worldwide along with many independent game developers and leading global technology, internet and media companies.
Casual Connect returns to Tel Aviv in 2016.
Great speakers, interesting and professional industry insiders, and of course, signature evening events.http://telaviv.casualconnect.org
CGA.