Embed Size (px)
Citation preview
The Mississippi Delta, the MAV and the World: A Groundwater Crisis—
Is there any hope?
David R. Johnson USACE Vicksburg
On average we drink 4 liters of water a day, but the food we eat each day
requires 2000 liters of water to produce.
We are currently mining both ancient and alluvial water to produce the food needed to feed the world, where will the water come from in the future?
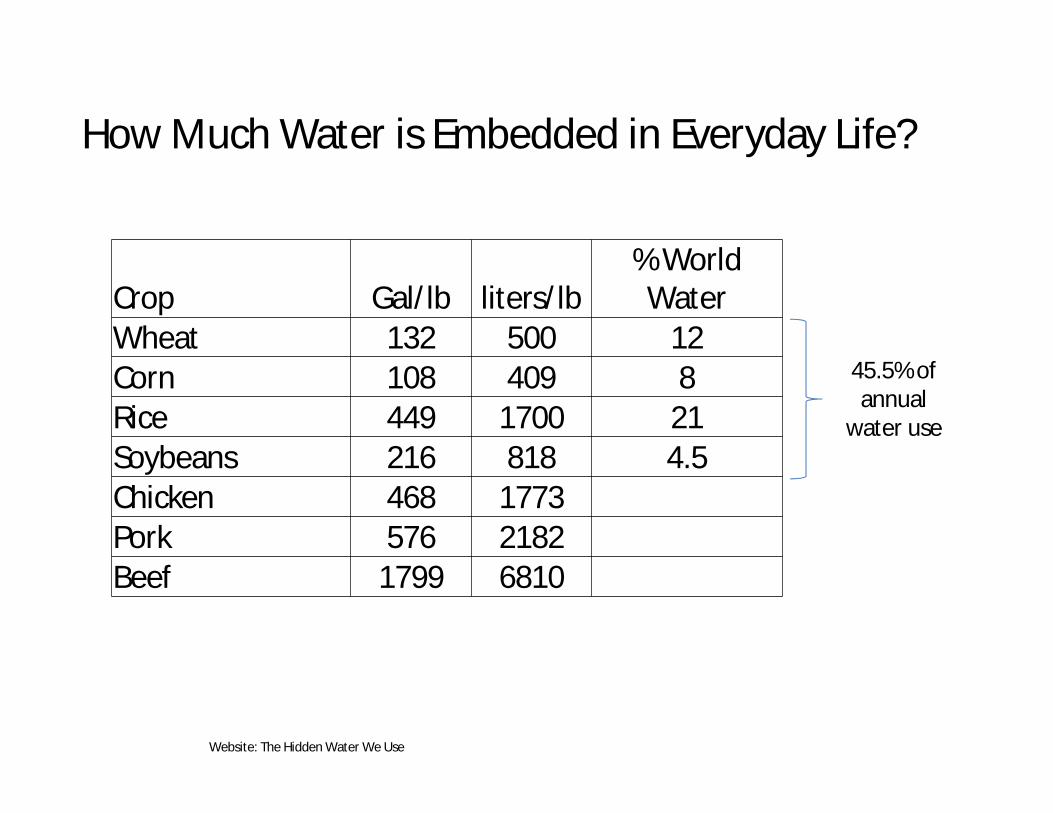
Website: The Hidden Water We Use
How Much Water is Embedded in Everyday Life?
Crop Gal/lb liters/lb% World
WaterWheat 132 500 12Corn 108 409 8Rice 449 1700 21Soybeans 216 818 4.5Chicken 468 1773Pork 576 2182Beef 1799 6810
45.5% of annual
water use
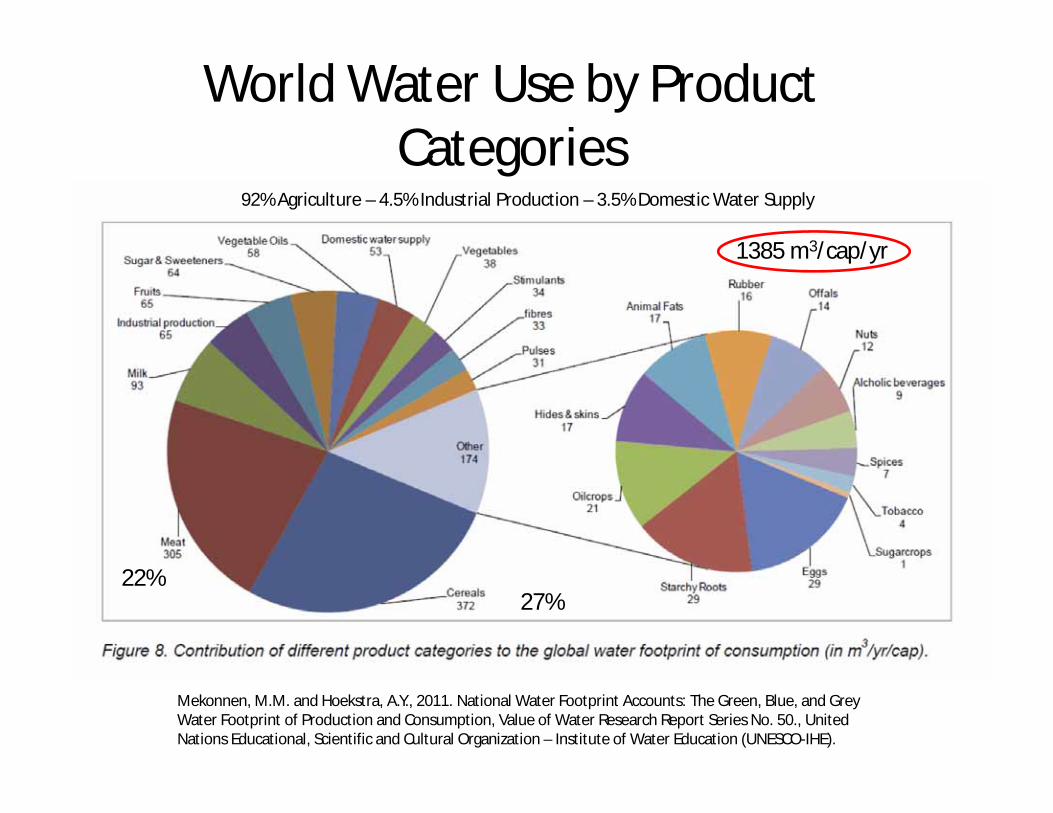
World Water Use by Product Categories
Mekonnen, M.M. and Hoekstra, A.Y., 2011. National Water Footprint Accounts: The Green, Blue, and Grey Water Footprint of Production and Consumption, Value of Water Research Report Series No. 50., United Nations Educational, Scientific and Cultural Organization – Institute of Water Education (UNESCO-IHE).
1385 m3/cap/yr
92% Agriculture – 4.5% Industrial Production – 3.5% Domestic Water Supply
27%22%
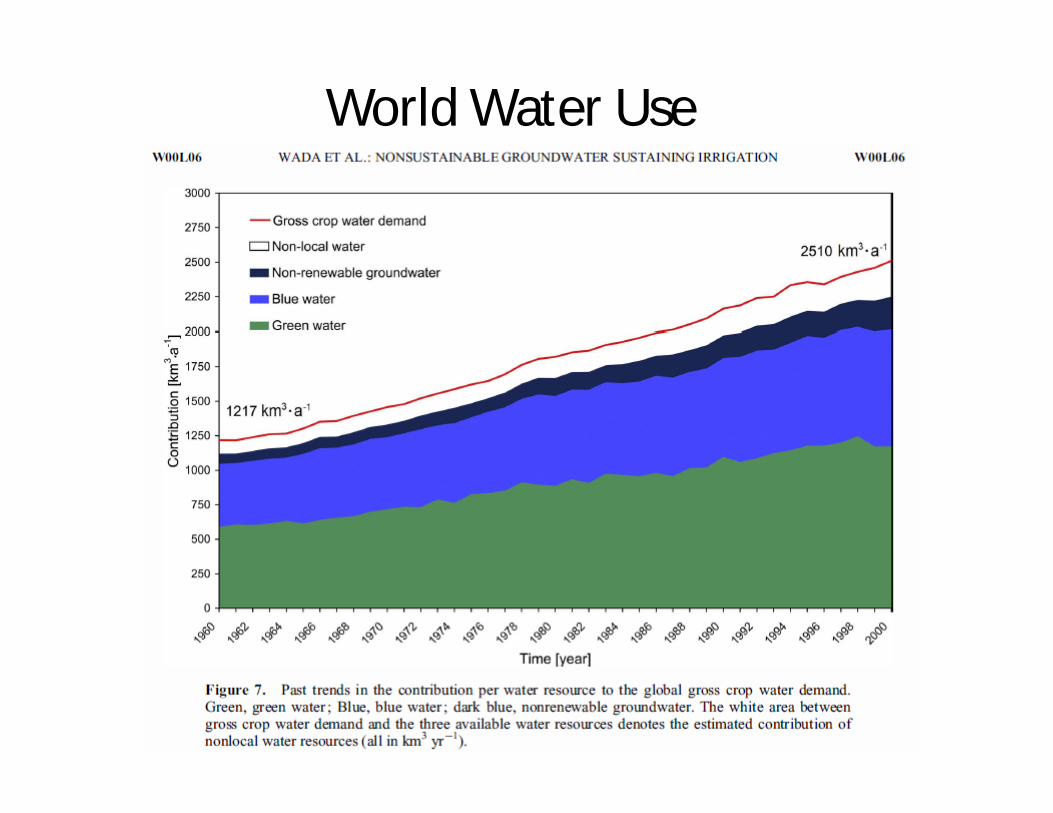
World Water Use
0
500
1000
1500
2000
2500
3000
3500
4000
4500
5000
1960
1964
1968
1972
1976
1980
1984
1988
1992
1996
2000
2004
2008
2012
2016
2020
2024
2028
2032
2036
2040
2044
2048
2052
2056
2060
2064
2068
2072
2076
2080
Non-renew
Ground
Precipitation
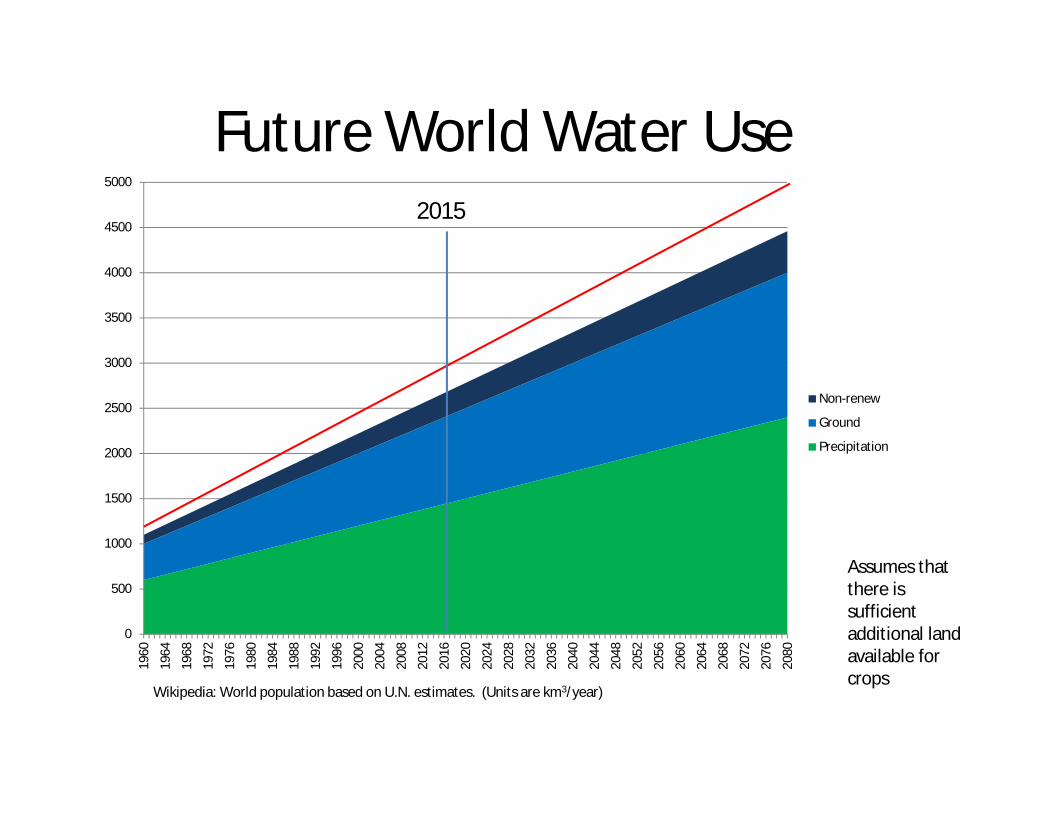
Future World Water Use
Wikipedia: World population based on U.N. estimates. (Units are km3/year)
Assumes that there is sufficient additional land available for crops
2015
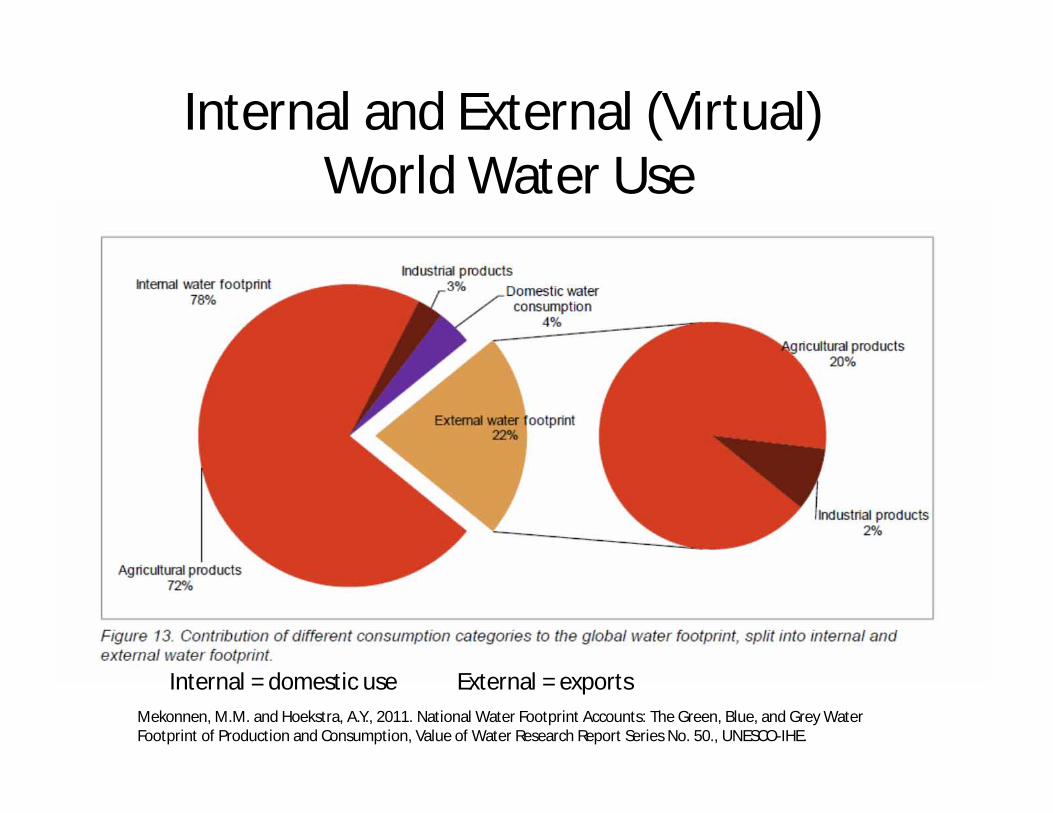
Internal and External (Virtual)World Water Use
Mekonnen, M.M. and Hoekstra, A.Y., 2011. National Water Footprint Accounts: The Green, Blue, and Grey Water Footprint of Production and Consumption, Value of Water Research Report Series No. 50., UNESCO-IHE.
Internal = domestic use External = exports
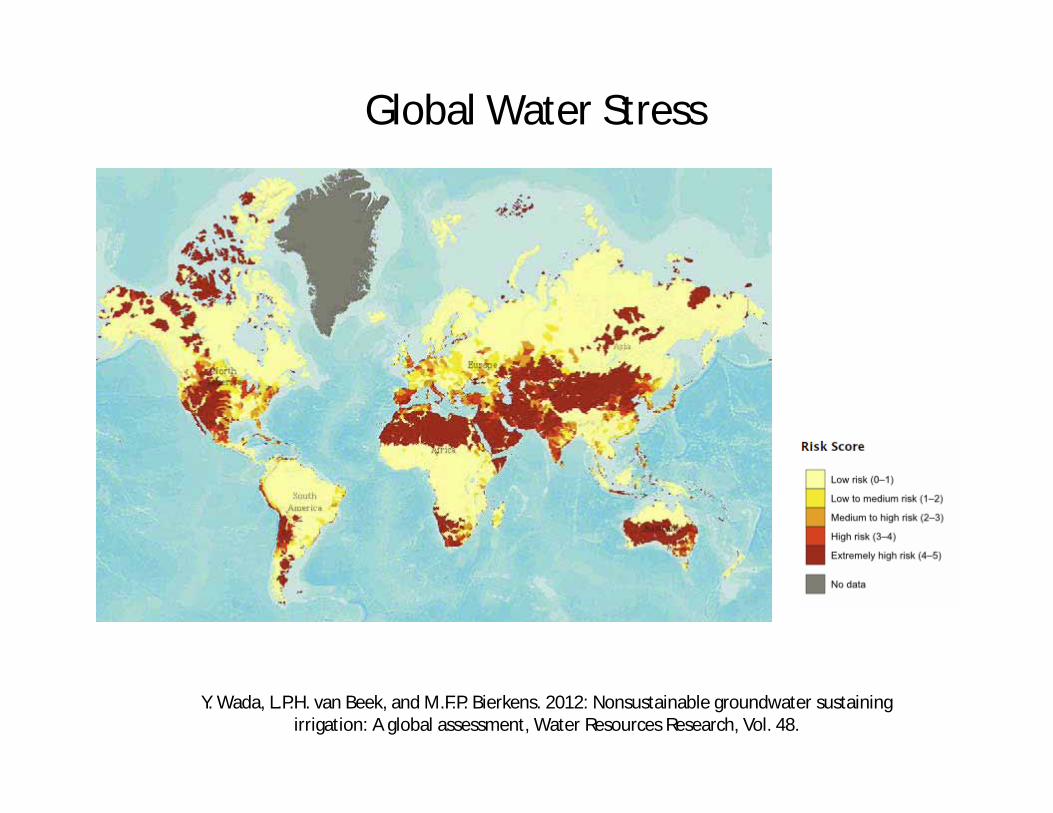
Global Water Stress
Y. Wada, L.P.H. van Beek, and M.F.P. Bierkens. 2012: Nonsustainable groundwater sustaining irrigation: A global assessment, Water Resources Research, Vol. 48.
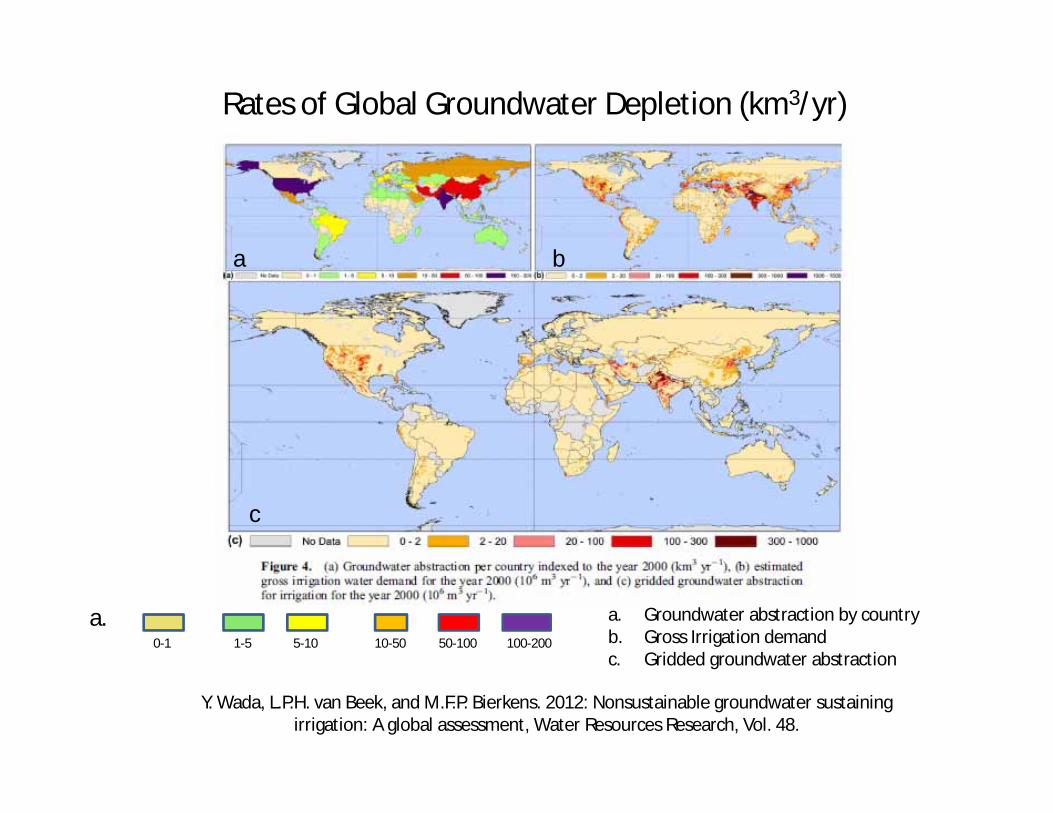
Rates of Global Groundwater Depletion (km3/yr)
Y. Wada, L.P.H. van Beek, and M.F.P. Bierkens. 2012: Nonsustainable groundwater sustaining irrigation: A global assessment, Water Resources Research, Vol. 48.
0-1 1-5 5-10 10-50 50-100 100-200
a. Groundwater abstraction by countryb. Gross Irrigation demandc. Gridded groundwater abstraction
a b
c
a.
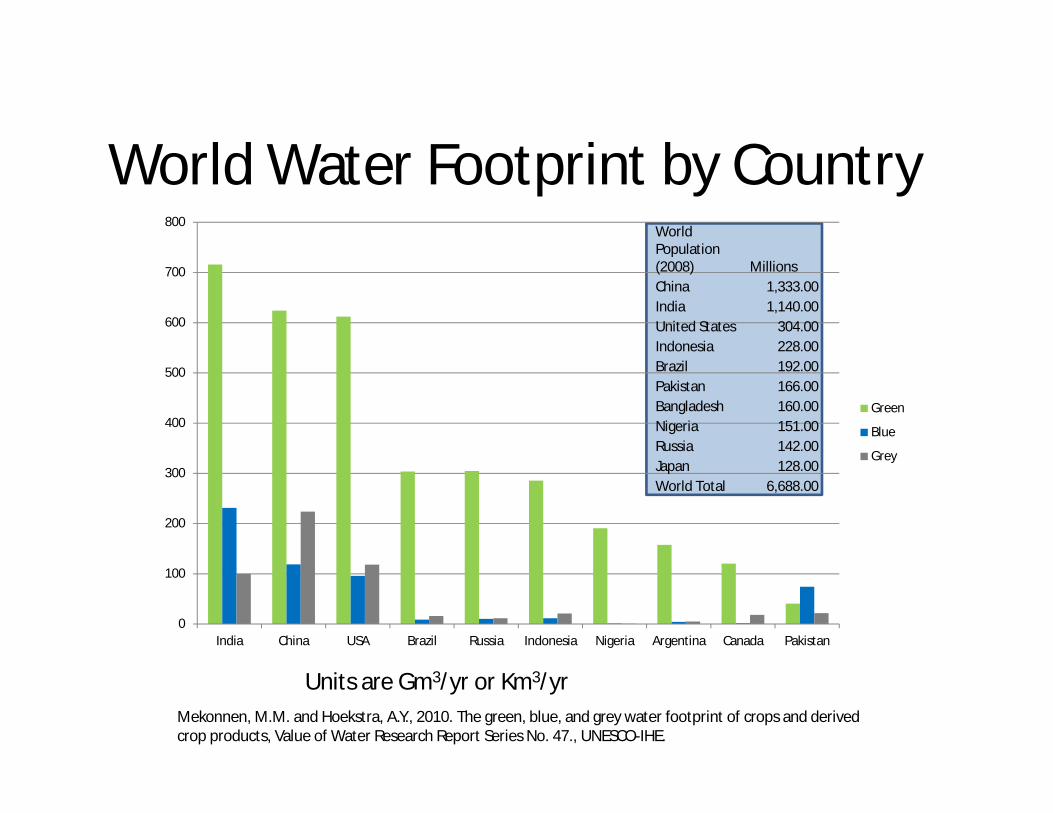
World Water Footprint by Country
Mekonnen, M.M. and Hoekstra, A.Y., 2010. The green, blue, and grey water footprint of crops and derived crop products, Value of Water Research Report Series No. 47., UNESCO-IHE.
0
100
200
300
400
500
600
700
800
India China USA Brazil Russia Indonesia Nigeria Argentina Canada Pakistan
Green
Blue
Grey
World Population (2008) MillionsChina 1,333.00India 1,140.00United States 304.00Indonesia 228.00Brazil 192.00Pakistan 166.00Bangladesh 160.00Nigeria 151.00Russia 142.00Japan 128.00World Total 6,688.00
Units are Gm3/yr or Km3/yr
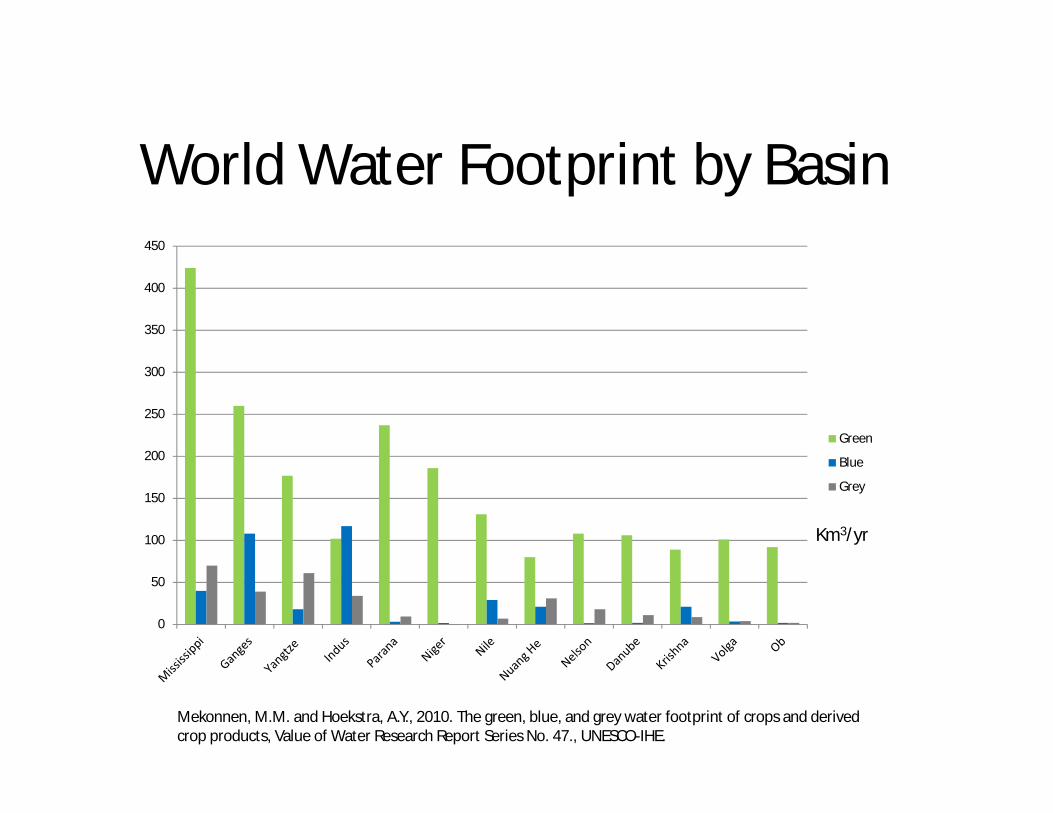
World Water Footprint by Basin
Mekonnen, M.M. and Hoekstra, A.Y., 2010. The green, blue, and grey water footprint of crops and derived crop products, Value of Water Research Report Series No. 47., UNESCO-IHE.
0
50
100
150
200
250
300
350
400
450
Green
Blue
Grey
Km3/yr
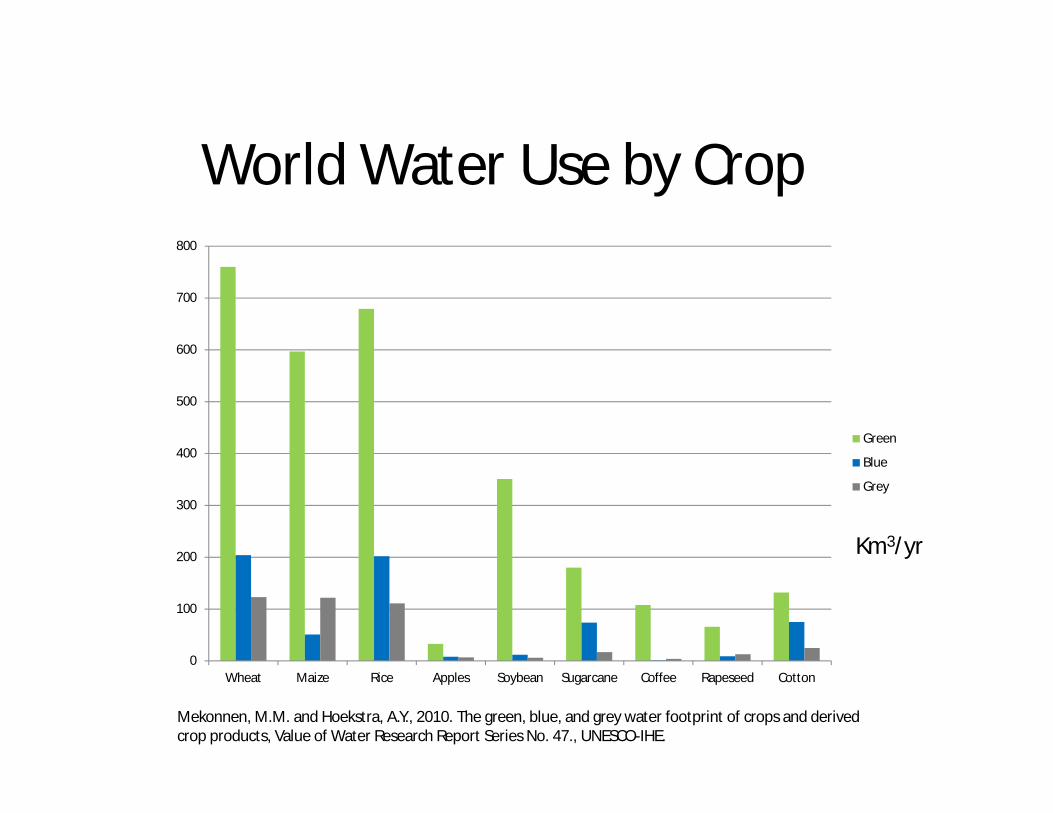
World Water Use by Crop
Mekonnen, M.M. and Hoekstra, A.Y., 2010. The green, blue, and grey water footprint of crops and derived crop products, Value of Water Research Report Series No. 47., UNESCO-IHE.
0
100
200
300
400
500
600
700
800
Wheat Maize Rice Apples Soybean Sugarcane Coffee Rapeseed Cotton
Green
Blue
Grey
Km3/yr
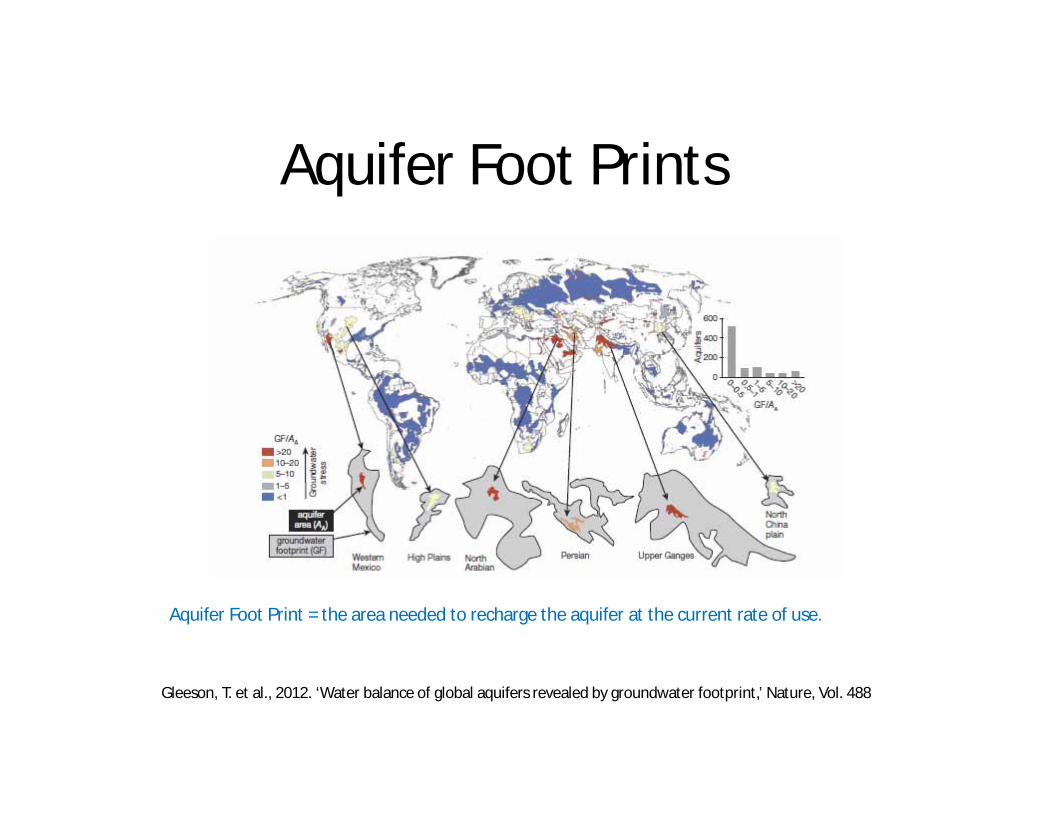
Aquifer Foot Prints
Gleeson, T. et al., 2012. ‘Water balance of global aquifers revealed by groundwater footprint,’ Nature, Vol. 488
Aquifer Foot Print = the area needed to recharge the aquifer at the current rate of use.
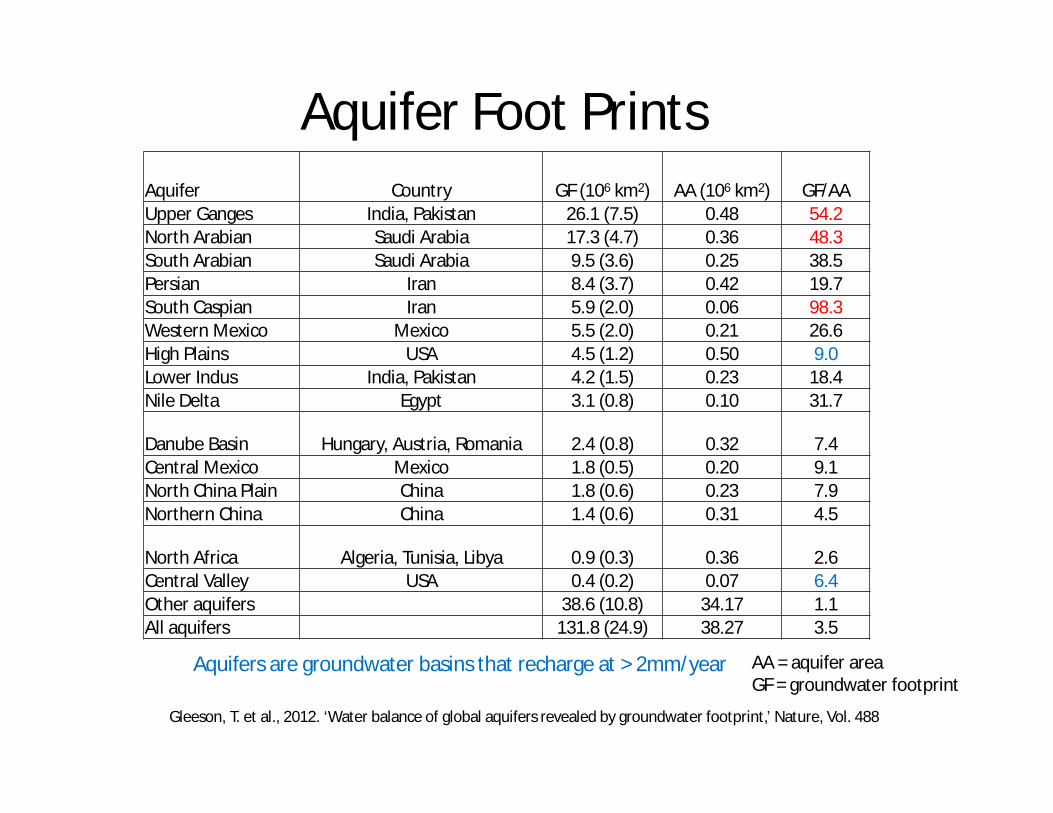
Aquifer Foot Prints
Gleeson, T. et al., 2012. ‘Water balance of global aquifers revealed by groundwater footprint,’ Nature, Vol. 488
Aquifer Country GF (106 km2) AA (106 km2) GF/AAUpper Ganges India, Pakistan 26.1 (7.5) 0.48 54.2North Arabian Saudi Arabia 17.3 (4.7) 0.36 48.3South Arabian Saudi Arabia 9.5 (3.6) 0.25 38.5Persian Iran 8.4 (3.7) 0.42 19.7South Caspian Iran 5.9 (2.0) 0.06 98.3Western Mexico Mexico 5.5 (2.0) 0.21 26.6High Plains USA 4.5 (1.2) 0.50 9.0Lower Indus India, Pakistan 4.2 (1.5) 0.23 18.4Nile Delta Egypt 3.1 (0.8) 0.10 31.7
Danube Basin Hungary, Austria, Romania 2.4 (0.8) 0.32 7.4Central Mexico Mexico 1.8 (0.5) 0.20 9.1North China Plain China 1.8 (0.6) 0.23 7.9Northern China China 1.4 (0.6) 0.31 4.5
North Africa Algeria, Tunisia, Libya 0.9 (0.3) 0.36 2.6Central Valley USA 0.4 (0.2) 0.07 6.4Other aquifers 38.6 (10.8) 34.17 1.1All aquifers 131.8 (24.9) 38.27 3.5
Aquifers are groundwater basins that recharge at > 2mm/year AA = aquifer areaGF = groundwater footprint
Water use and aquifers in the U.S.
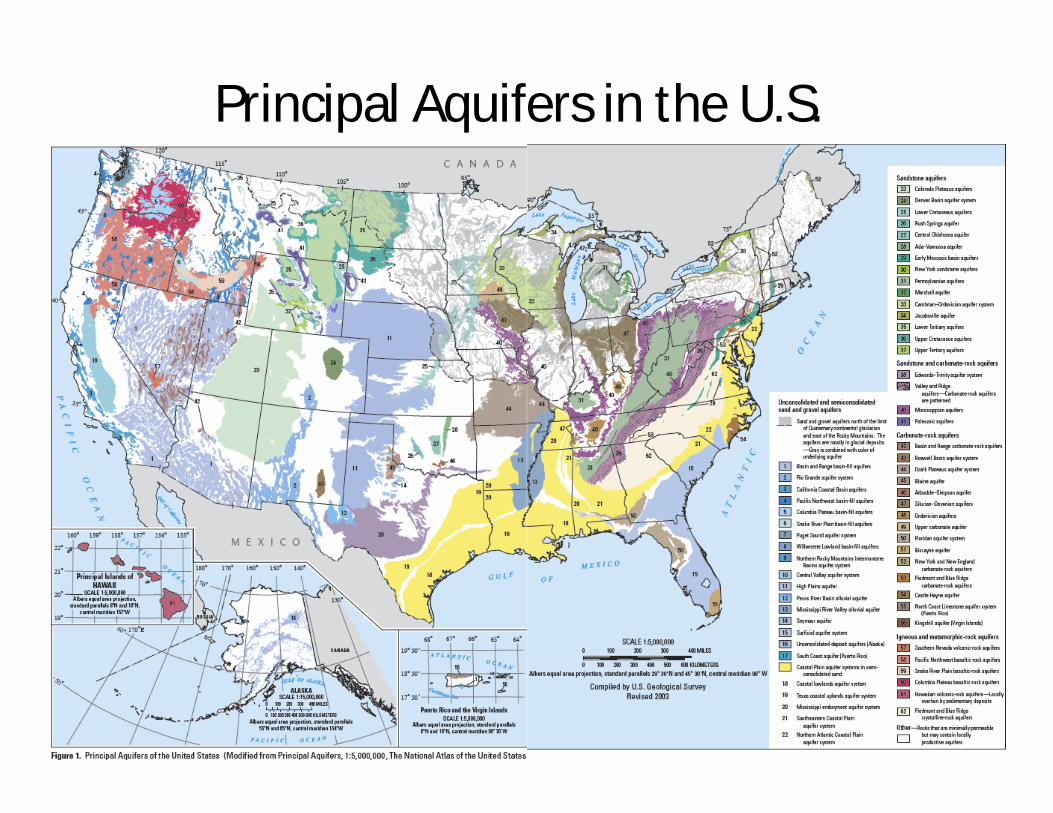
Principal Aquifers in the U.S.
USGS Circular 1279, Estimated Withdrawals from Principal Aquifers in the United States, 2000.
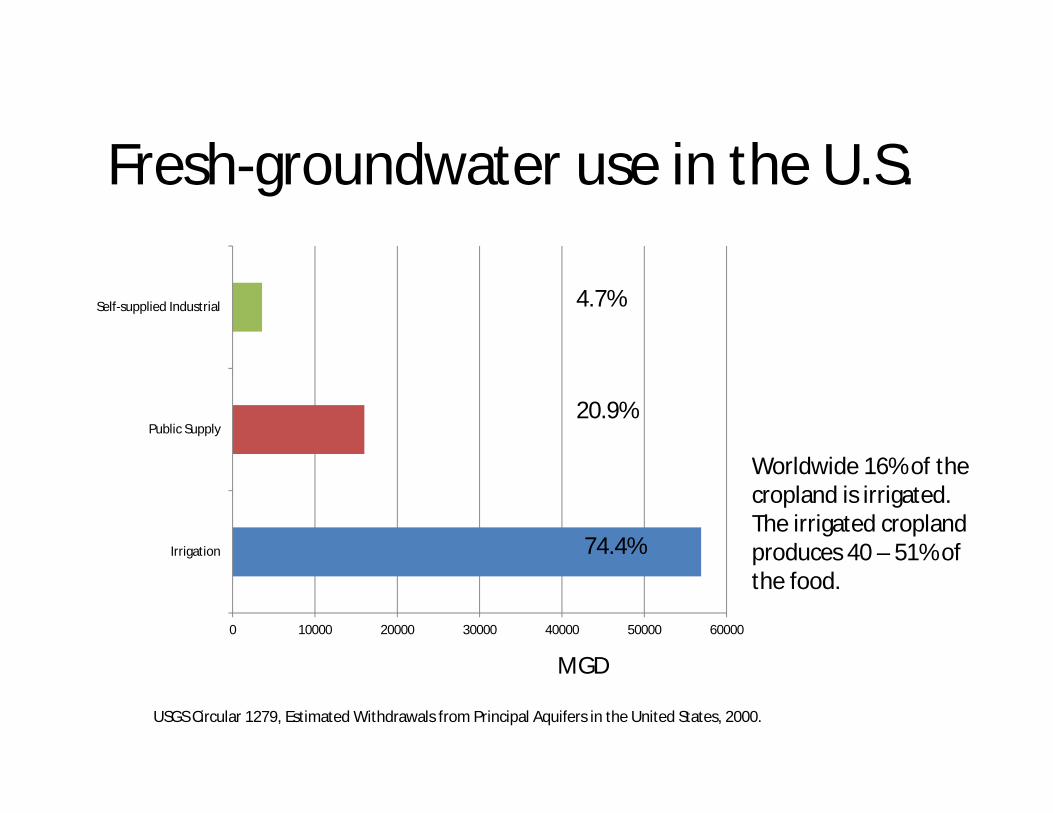
Fresh-groundwater use in the U.S.
USGS Circular 1279, Estimated Withdrawals from Principal Aquifers in the United States, 2000.
0 10000 20000 30000 40000 50000 60000
Irrigation
Public Supply
Self-supplied Industrial 4.7%
20.9%
74.4%
MGD
Worldwide 16% of the cropland is irrigated. The irrigated cropland produces 40 – 51% of the food.
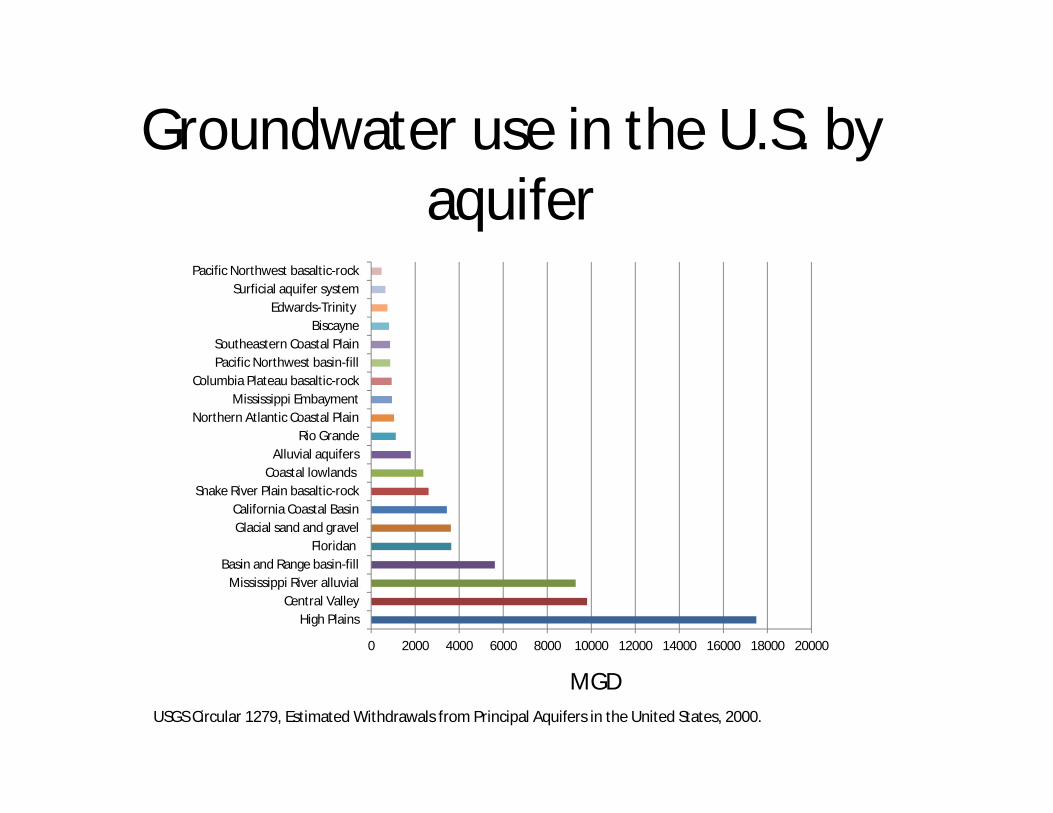
Groundwater use in the U.S. by aquifer
USGS Circular 1279, Estimated Withdrawals from Principal Aquifers in the United States, 2000.
0 2000 4000 6000 8000 10000 12000 14000 16000 18000 20000
High PlainsCentral Valley
Mississippi River alluvialBasin and Range basin-fill
FloridanGlacial sand and gravelCalifornia Coastal Basin
Snake River Plain basaltic-rockCoastal lowlands
Alluvial aquifersRio Grande
Northern Atlantic Coastal PlainMississippi Embayment
Columbia Plateau basaltic-rockPacific Northwest basin-fillSoutheastern Coastal Plain
BiscayneEdwards-Trinity
Surficial aquifer systemPacific Northwest basaltic-rock
MGD
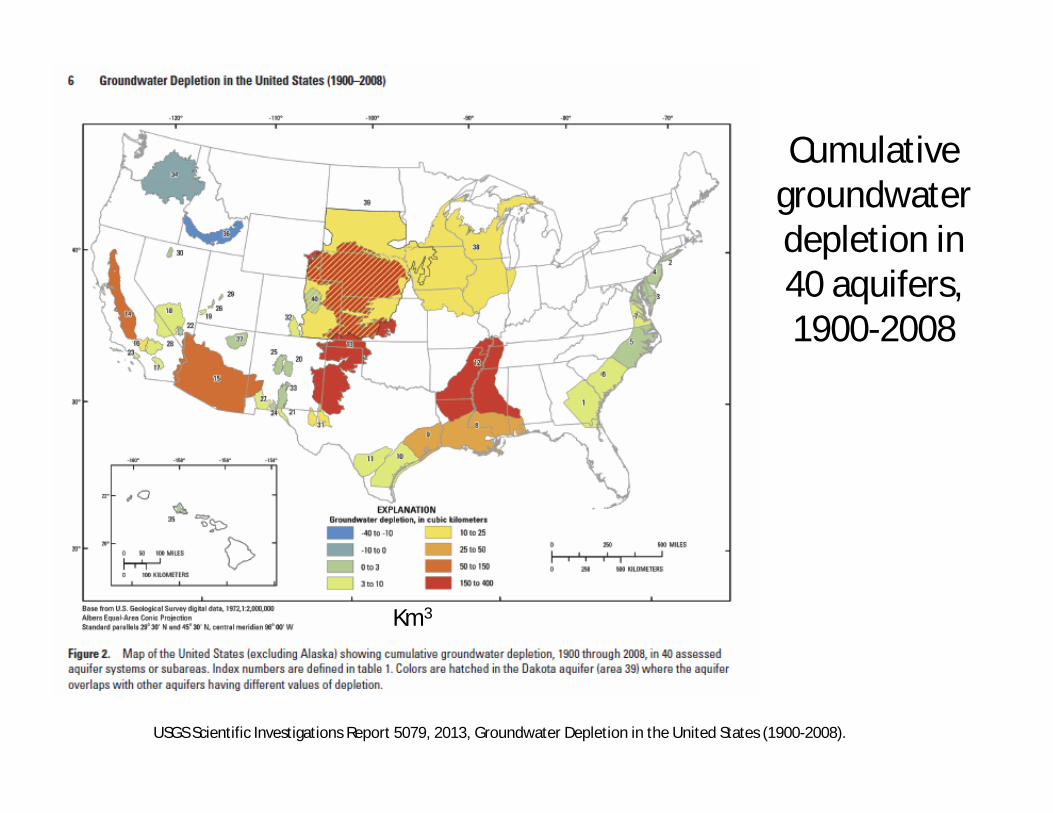
Cumulative groundwater depletion in 40 aquifers, 1900-2008
USGS Scientific Investigations Report 5079, 2013, Groundwater Depletion in the United States (1900-2008).
Km3
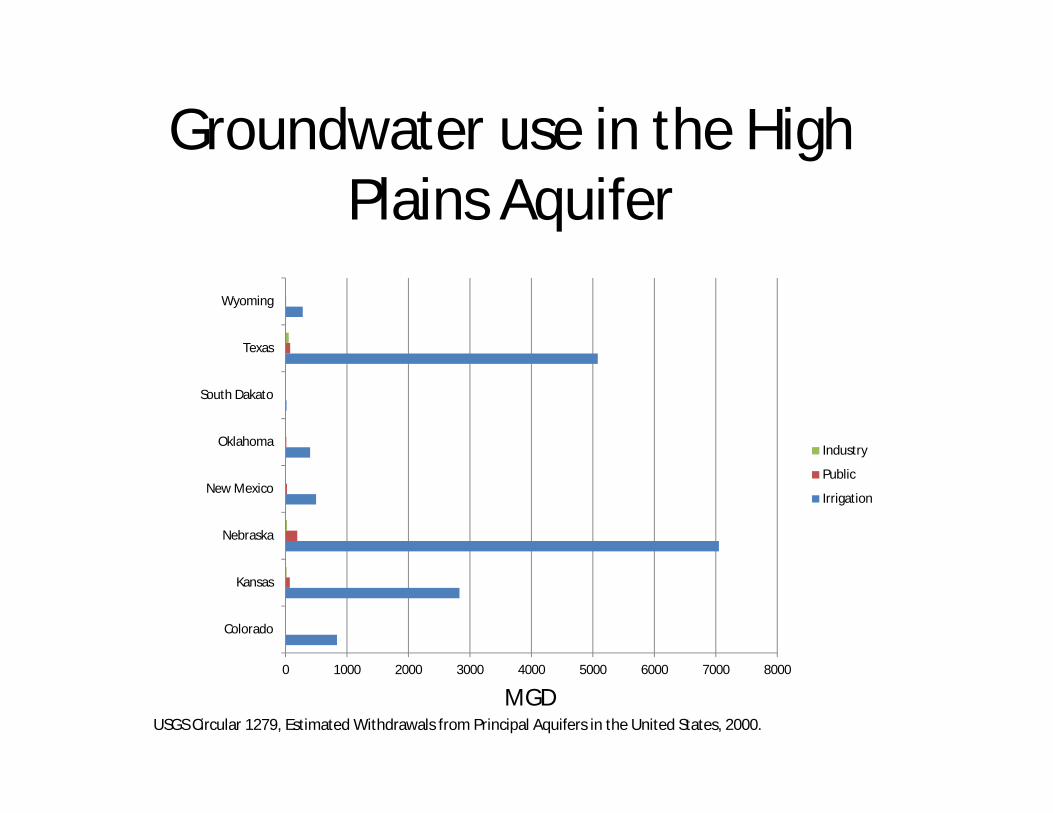
Groundwater use in the High Plains Aquifer
USGS Circular 1279, Estimated Withdrawals from Principal Aquifers in the United States, 2000.
0 1000 2000 3000 4000 5000 6000 7000 8000
Colorado
Kansas
Nebraska
New Mexico
Oklahoma
South Dakato
Texas
Wyoming
Industry
Public
Irrigation
MGD
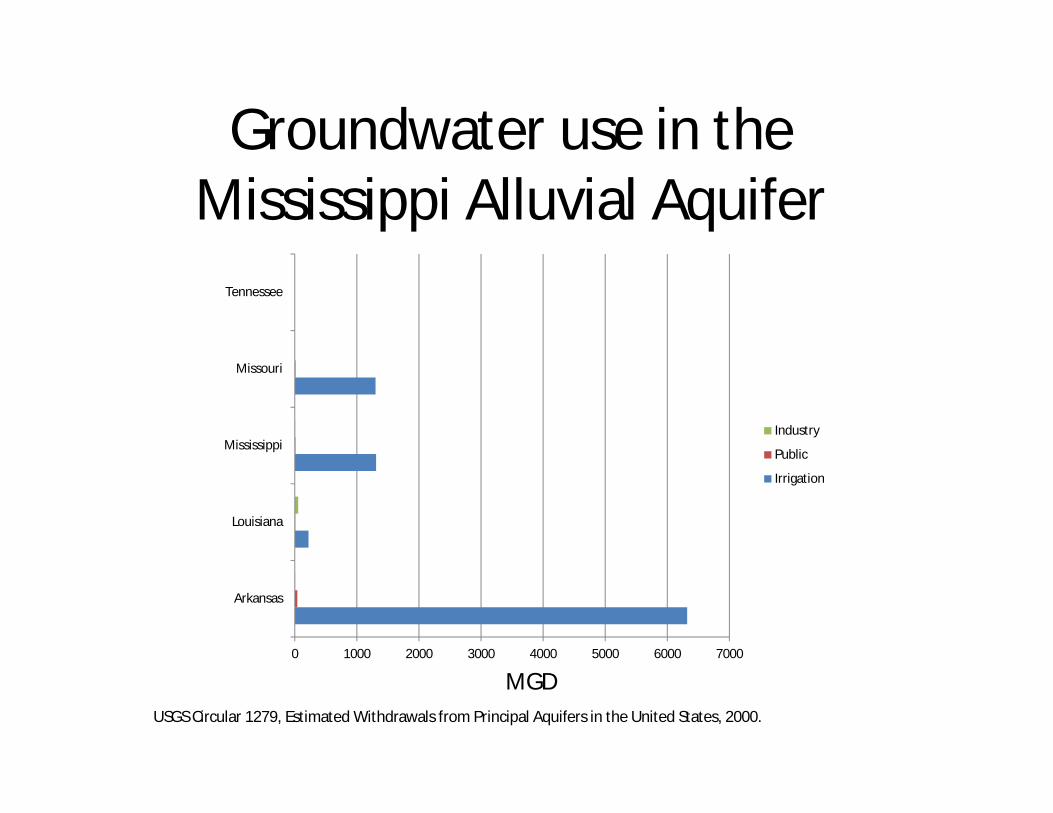
Groundwater use in the Mississippi Alluvial Aquifer
USGS Circular 1279, Estimated Withdrawals from Principal Aquifers in the United States, 2000.
0 1000 2000 3000 4000 5000 6000 7000
Arkansas
Louisiana
Mississippi
Missouri
Tennessee
Industry
Public
Irrigation
MGD

Mississippi Alluvial Aquifer
Conjunctive Water Use Issues in the Mississippi Alluvial Valley
• How much can we save through conservation?• Regardless of the above answer- the current rate
of aquifer utilization is not sustainable.• New water supplies must be developed to meet
the future demand for water.• No single state/agency is in charge of the aquifer.• The water use laws vary significantly by state.• The states are reluctant to pass laws which might
be interpreted as restricting landowner water rights.
Groundwater depletion occurs when groundwater abstraction exceeds the groundwater recharge over extensive
areas for prolonged periods. When persistent groundwater depletion
occurs, this leads to falling groundwater levels.
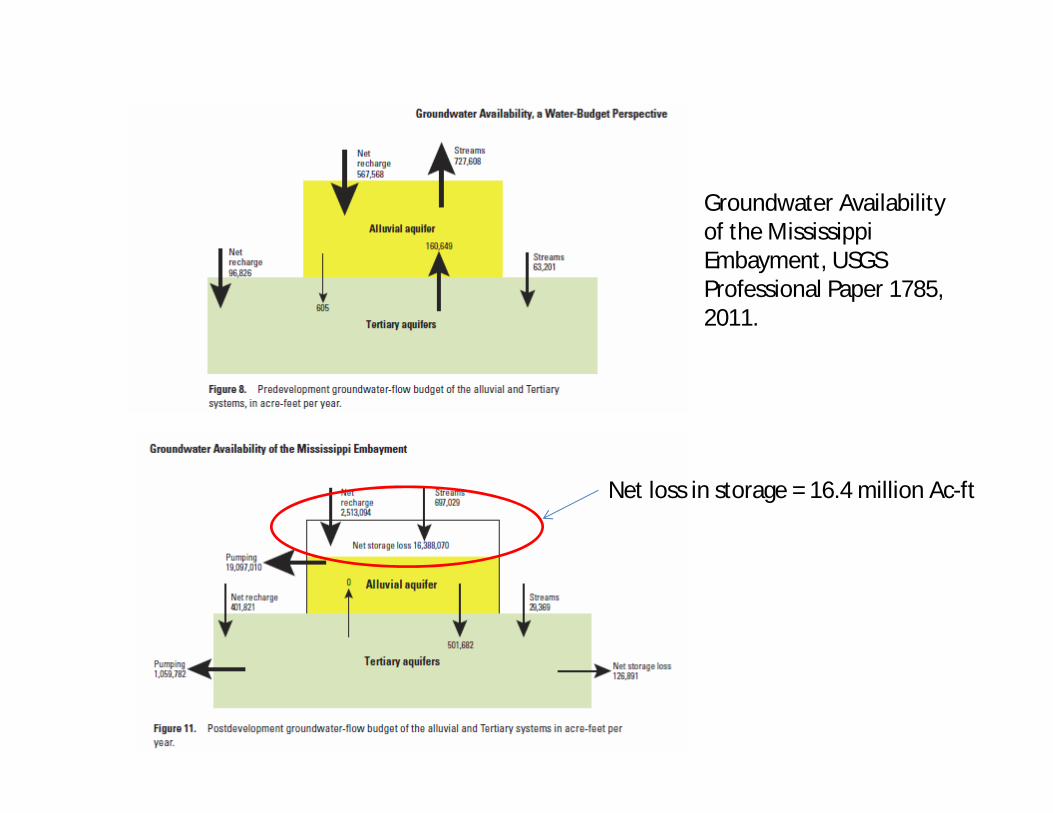
Groundwater Availability of the Mississippi Embayment, USGS Professional Paper 1785, 2011.
Net loss in storage = 16.4 million Ac-ft
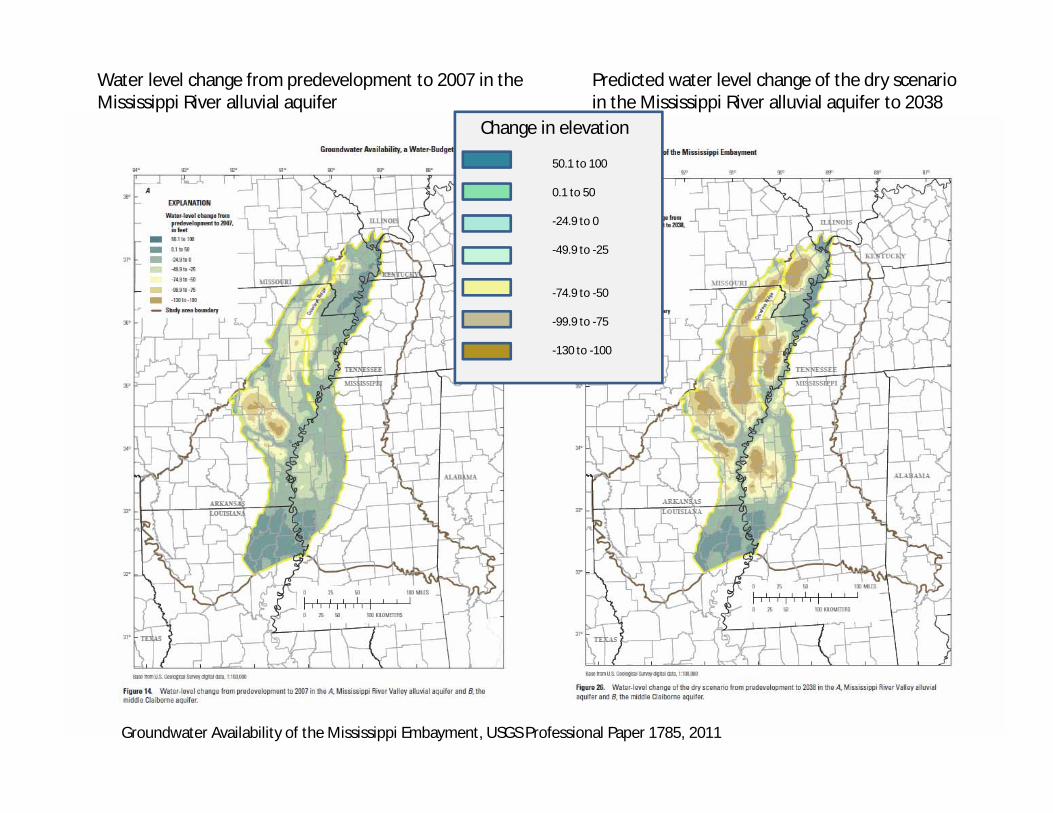
Water level change from predevelopment to 2007 in the Mississippi River alluvial aquifer
Predicted water level change of the dry scenario in the Mississippi River alluvial aquifer to 2038
Groundwater Availability of the Mississippi Embayment, USGS Professional Paper 1785, 2011
50.1 to 100
0.1 to 50
-24.9 to 0
-49.9 to -25
-74.9 to -50
-99.9 to -75
-130 to -100
Change in elevation
Consequences of declining aquifer levels
• Additional pumping costs for crop irrigation• Surface streams lose base flow• Aquatic life adversely impacted• Waste load assimilation reduced• Reduced water for navigation• Reduced water quality
How does today’s weather and the predicted changes in weather
patterns affect water demands?
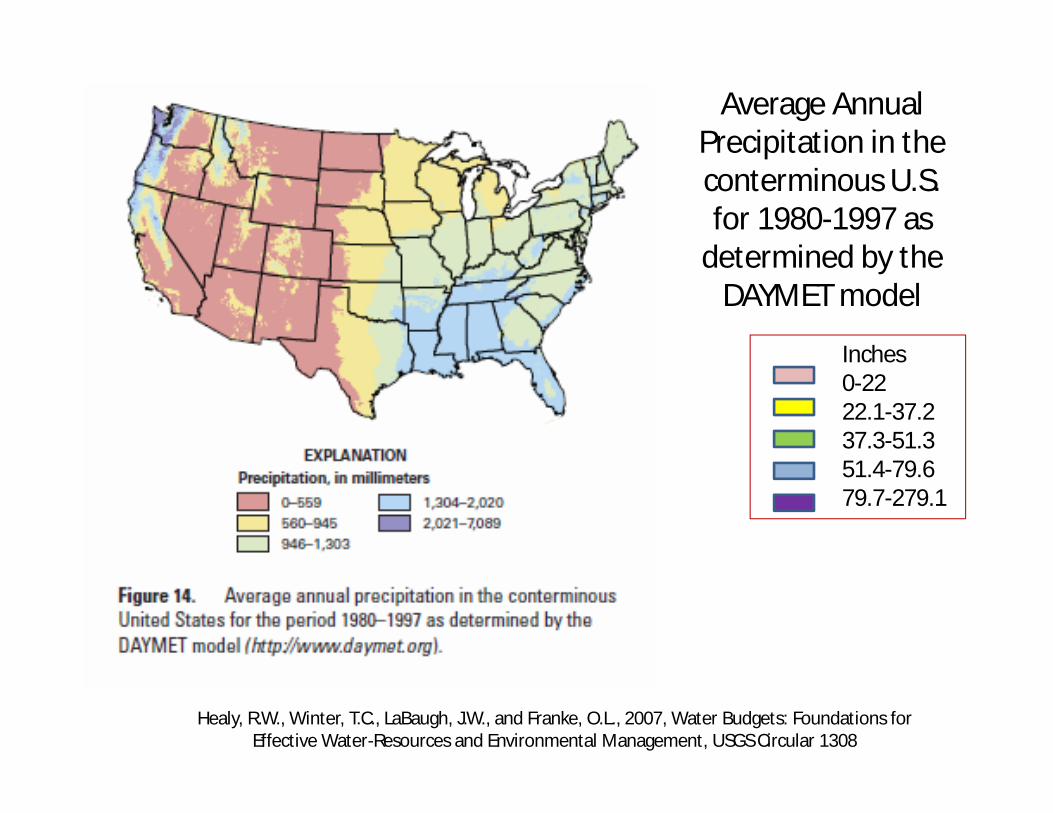
Average Annual Precipitation in the conterminous U.S. for 1980-1997 as
determined by the DAYMET model
Healy, R.W., Winter, T.C., LaBaugh, J.W., and Franke, O.L., 2007, Water Budgets: Foundations for Effective Water-Resources and Environmental Management, USGS Circular 1308
Inches0-2222.1-37.237.3-51.351.4-79.679.7-279.1
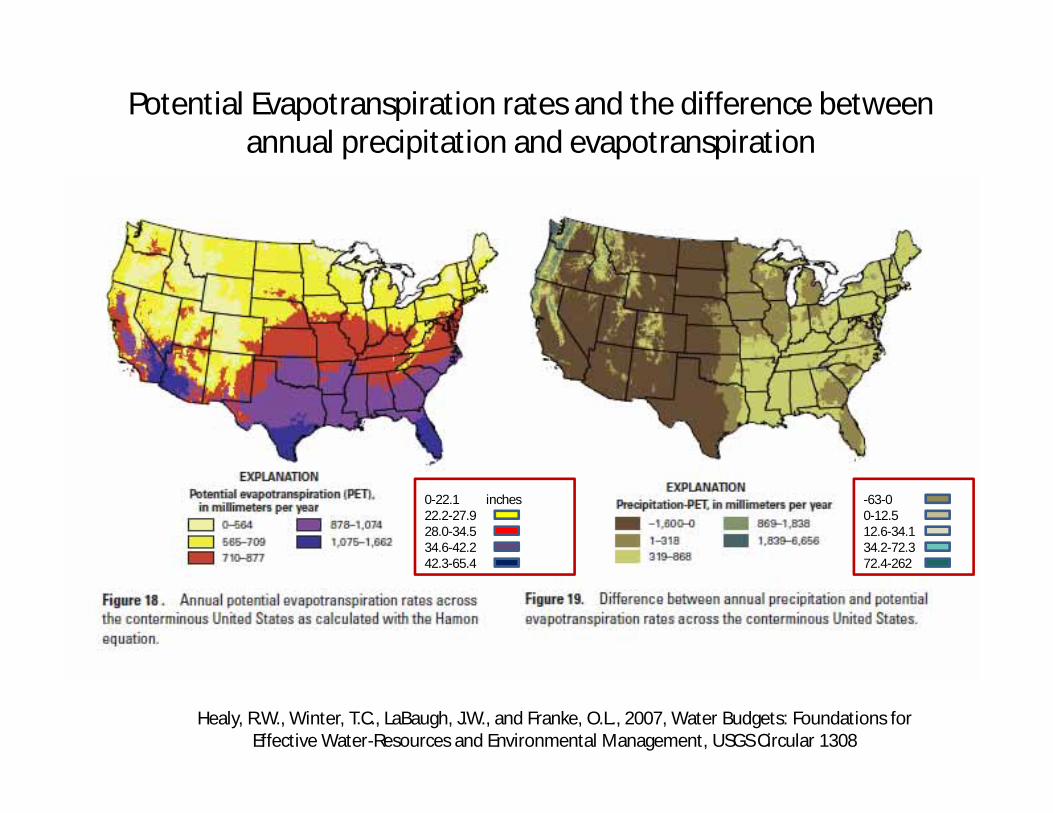
Potential Evapotranspiration rates and the difference between annual precipitation and evapotranspiration
Healy, R.W., Winter, T.C., LaBaugh, J.W., and Franke, O.L., 2007, Water Budgets: Foundations for Effective Water-Resources and Environmental Management, USGS Circular 1308
0-22.1 inches22.2-27.928.0-34.534.6-42.242.3-65.4
-63-0 0-12.512.6-34.134.2-72.372.4-262
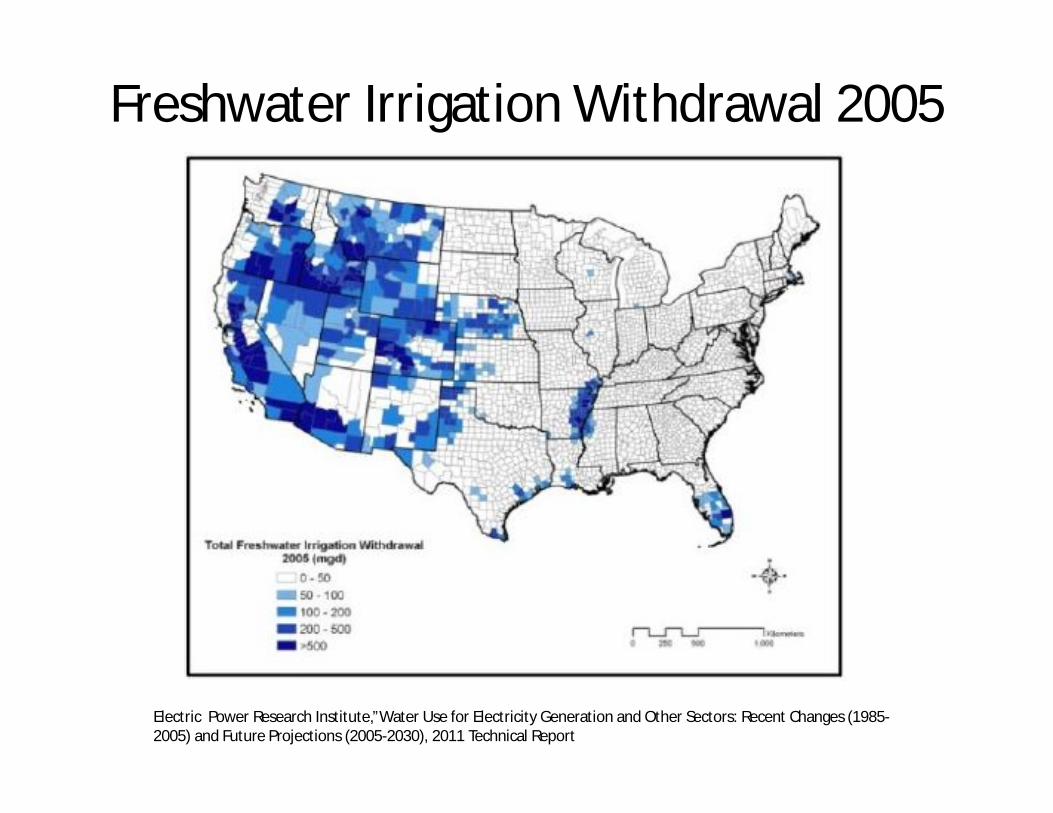
Freshwater Irrigation Withdrawal 2005
Electric Power Research Institute,”Water Use for Electricity Generation and Other Sectors: Recent Changes (1985-2005) and Future Projections (2005-2030), 2011 Technical Report
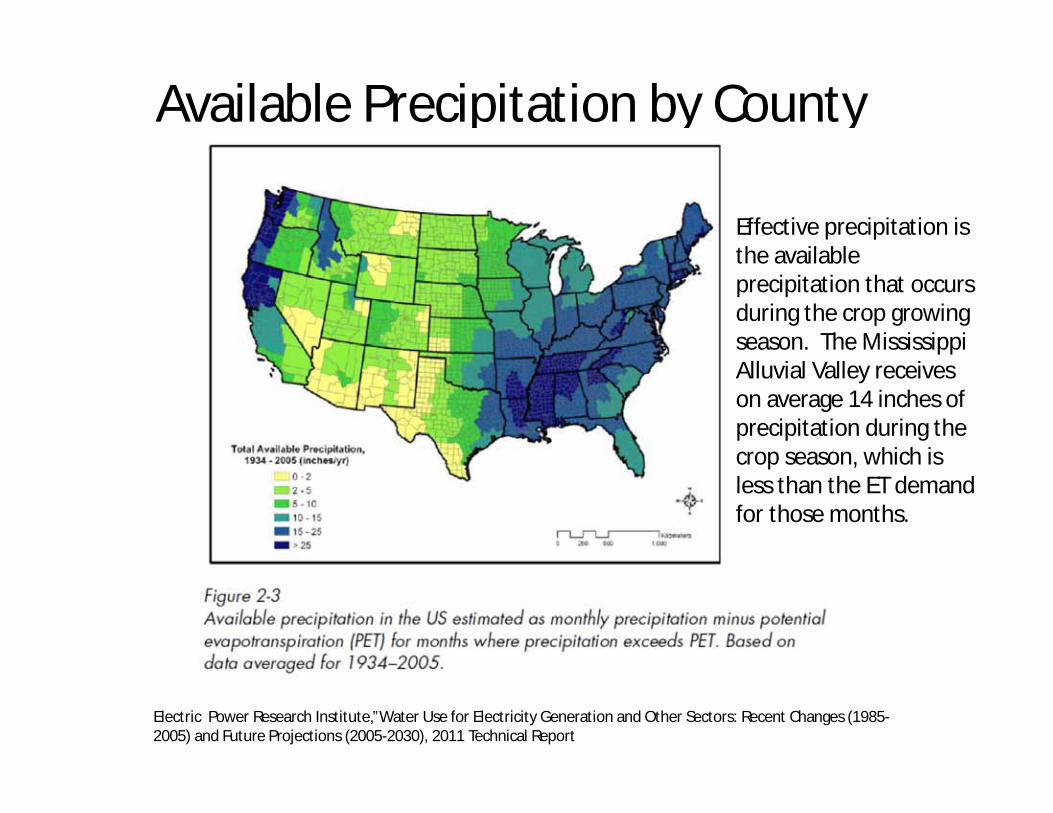
Available Precipitation by County
Electric Power Research Institute,”Water Use for Electricity Generation and Other Sectors: Recent Changes (1985-2005) and Future Projections (2005-2030), 2011 Technical Report
Effective precipitation is the available precipitation that occurs during the crop growing season. The Mississippi Alluvial Valley receives on average 14 inches of precipitation during the crop season, which is less than the ET demand for those months.
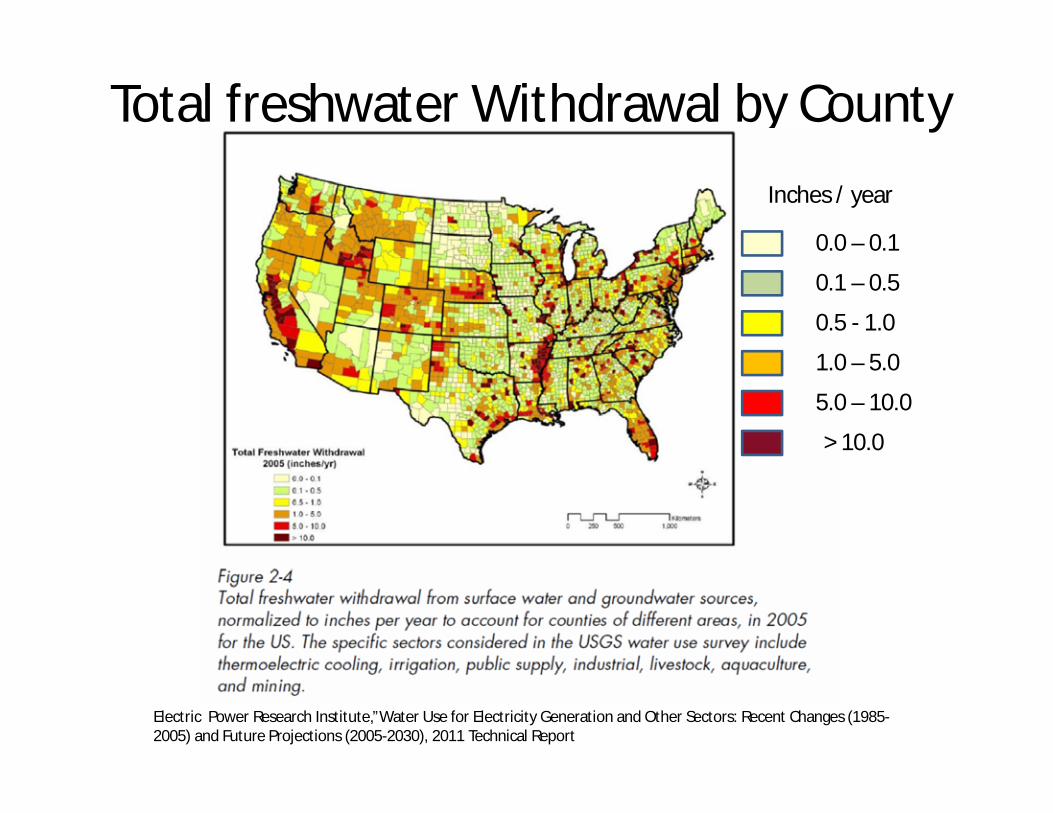
Total freshwater Withdrawal by County
Electric Power Research Institute,”Water Use for Electricity Generation and Other Sectors: Recent Changes (1985-2005) and Future Projections (2005-2030), 2011 Technical Report
0.0 – 0.1
0.1 – 0.5
0.5 - 1.0
1.0 – 5.0
5.0 – 10.0
> 10.0
Inches / year
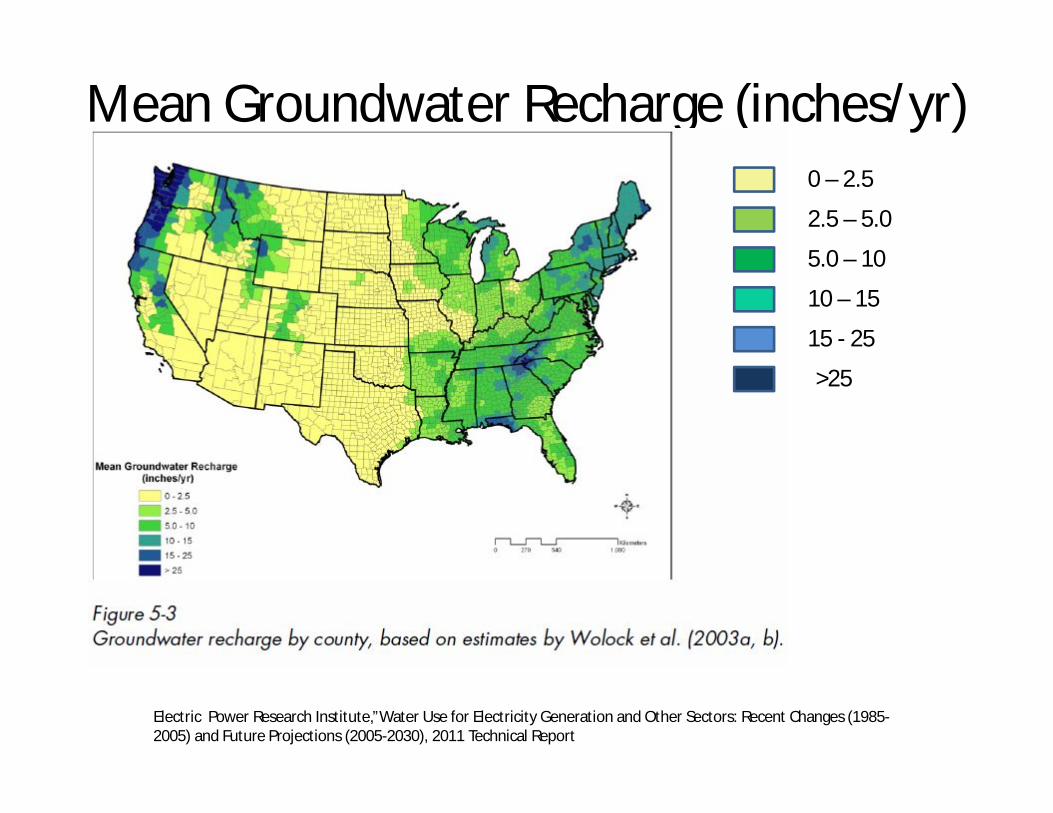
Mean Groundwater Recharge (inches/yr)
Electric Power Research Institute,”Water Use for Electricity Generation and Other Sectors: Recent Changes (1985-2005) and Future Projections (2005-2030), 2011 Technical Report
0 – 2.5
2.5 – 5.0
5.0 – 10
10 – 15
15 - 25
>25
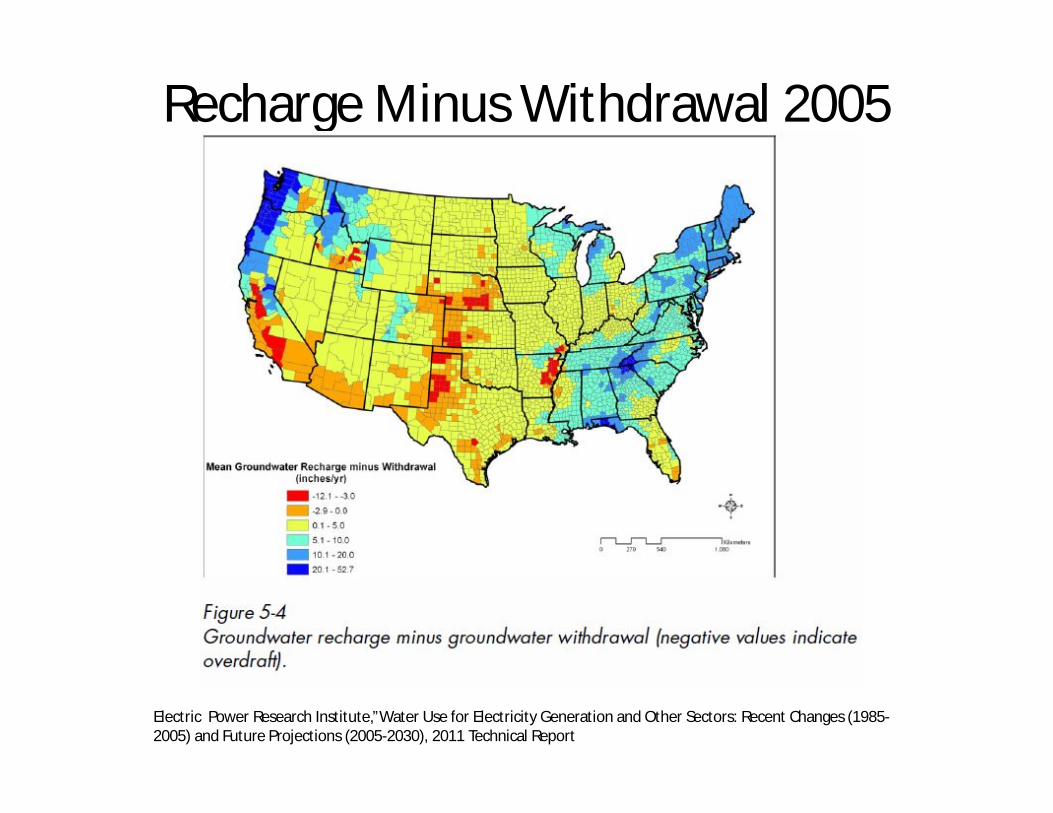
Recharge Minus Withdrawal 2005
Electric Power Research Institute,”Water Use for Electricity Generation and Other Sectors: Recent Changes (1985-2005) and Future Projections (2005-2030), 2011 Technical Report
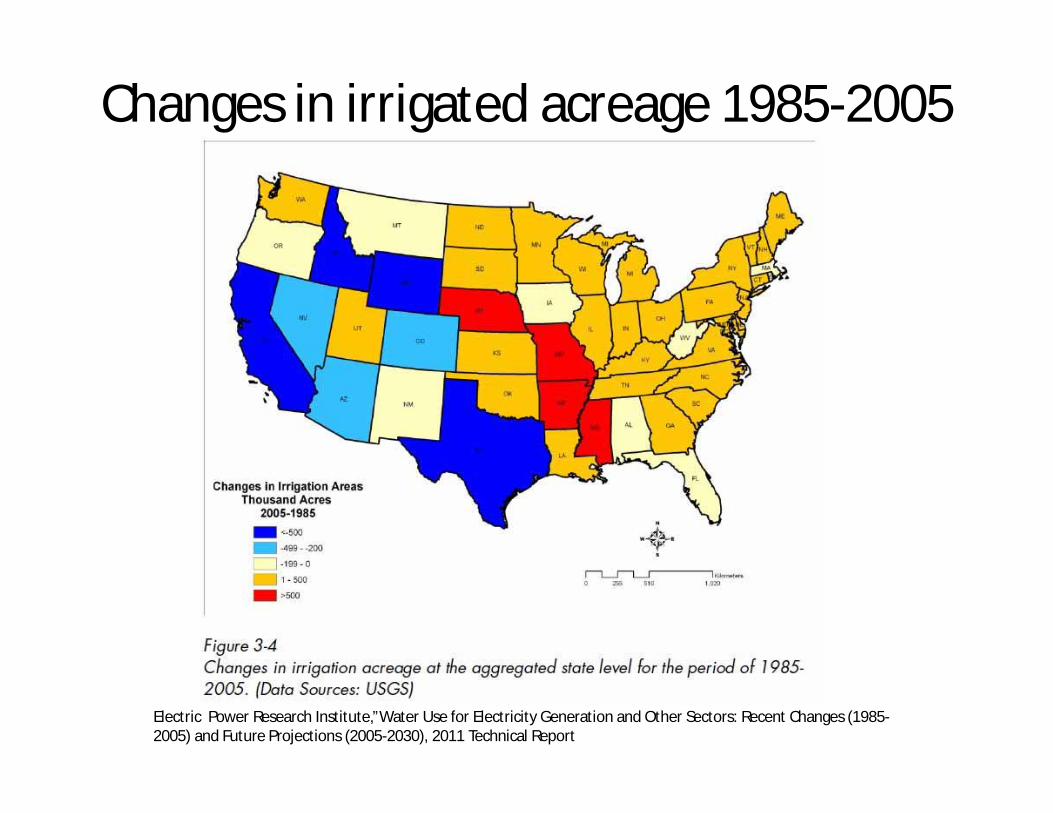
Changes in irrigated acreage 1985-2005
Electric Power Research Institute,”Water Use for Electricity Generation and Other Sectors: Recent Changes (1985-2005) and Future Projections (2005-2030), 2011 Technical Report
Third National Climate Assessment
Predictions on future precipitation patterns in the U.S.
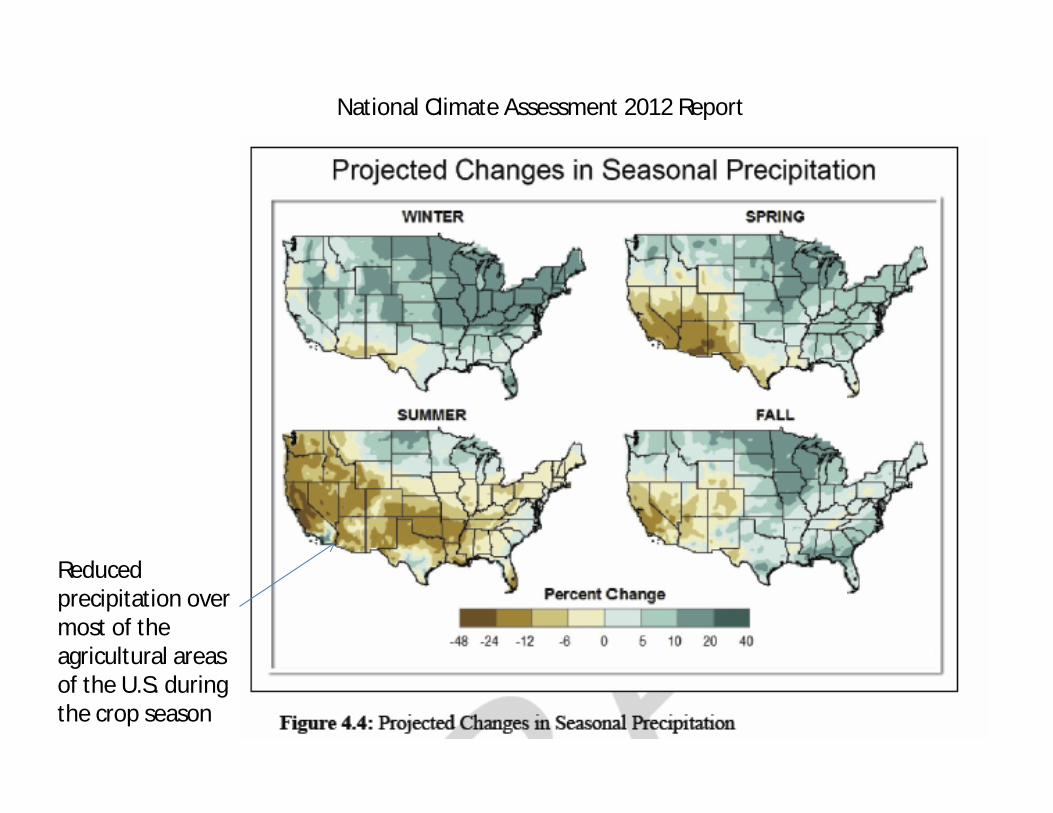
National Climate Assessment 2012 Report
Reduced precipitation over most of the agricultural areas of the U.S. during the crop season
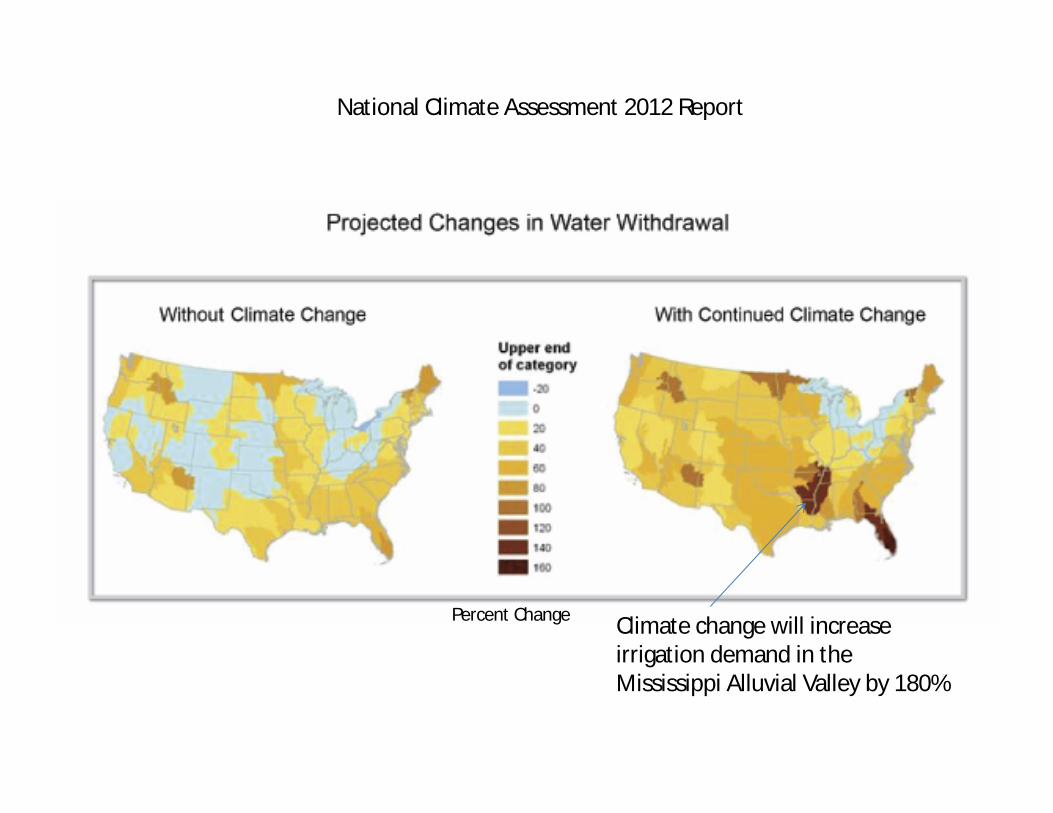
National Climate Assessment 2012 Report
Percent Change Climate change will increase irrigation demand in the Mississippi Alluvial Valley by 180%
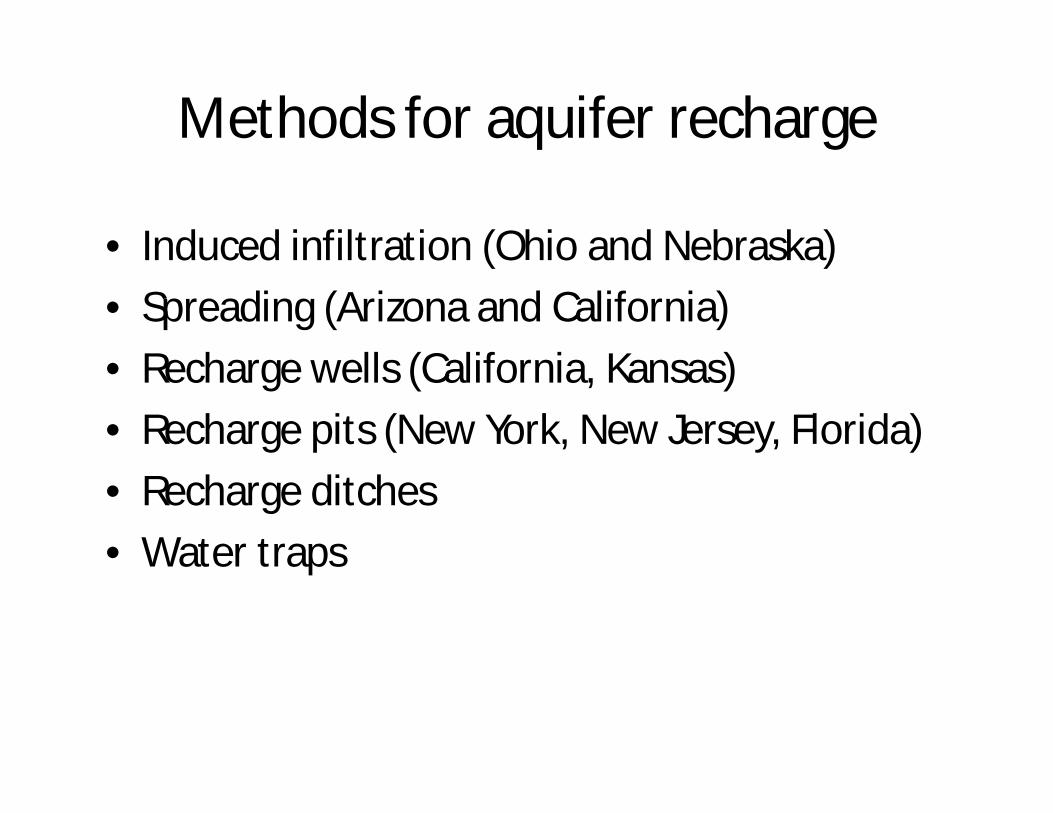
Methods for aquifer recharge
• Induced infiltration (Ohio and Nebraska)• Spreading (Arizona and California)• Recharge wells (California, Kansas)• Recharge pits (New York, New Jersey, Florida)• Recharge ditches• Water traps
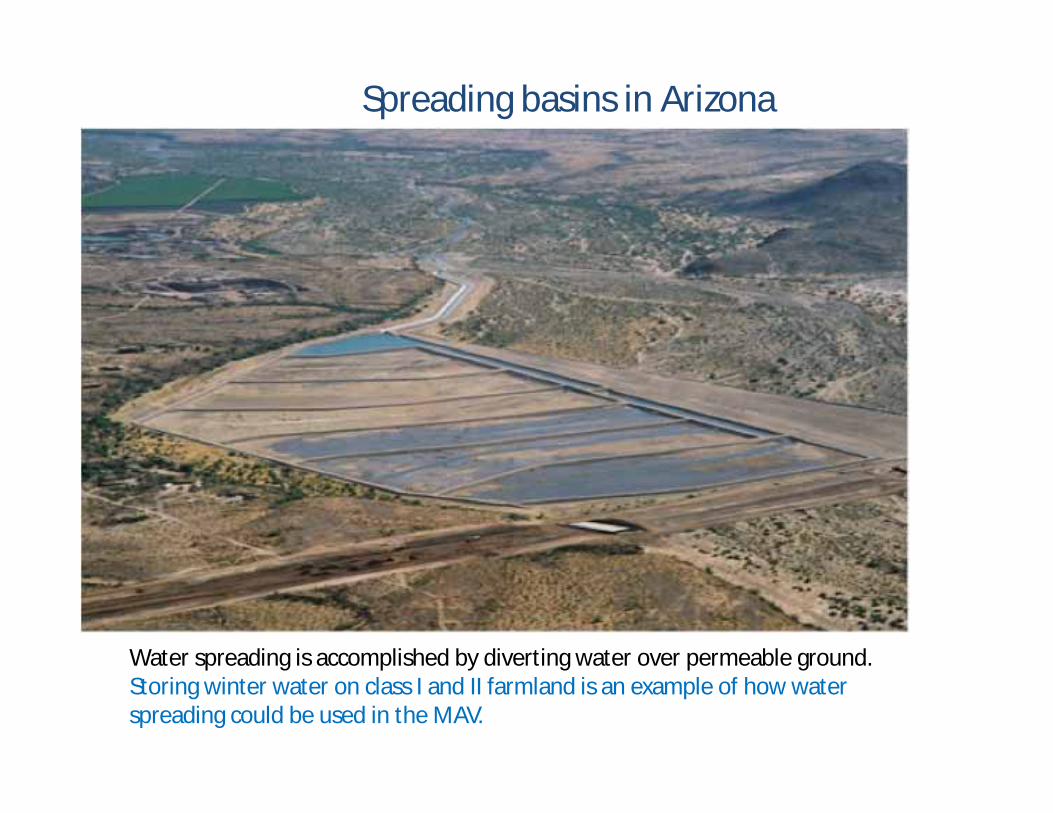
Spreading basins in Arizona
Water spreading is accomplished by diverting water over permeable ground. Storing winter water on class I and II farmland is an example of how water spreading could be used in the MAV.
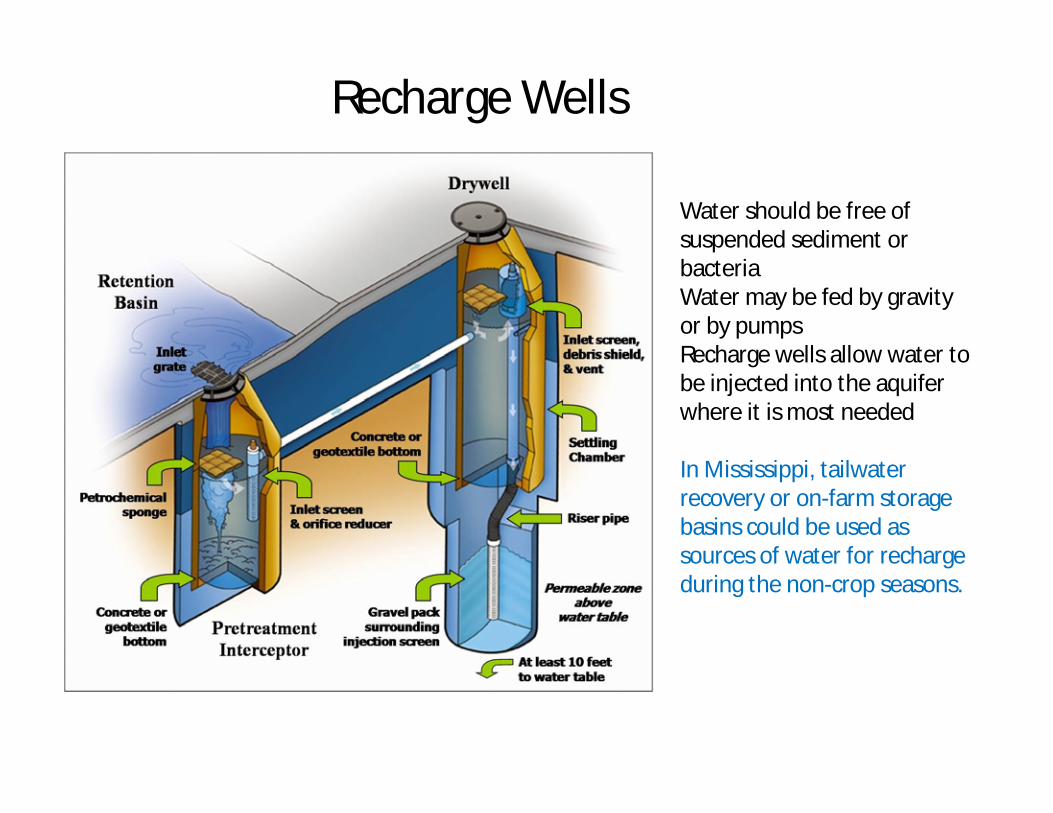
Recharge Wells
Water should be free of suspended sediment or bacteriaWater may be fed by gravity or by pumpsRecharge wells allow water to be injected into the aquifer where it is most needed
In Mississippi, tailwaterrecovery or on-farm storage basins could be used as sources of water for recharge during the non-crop seasons.
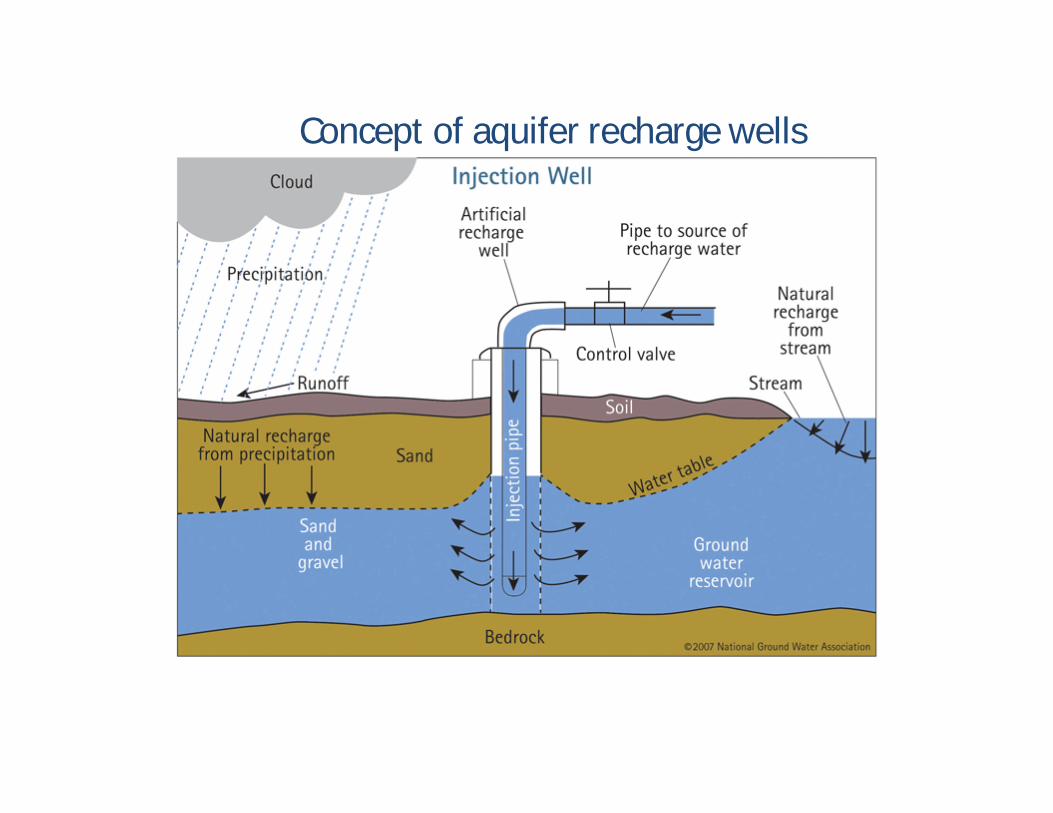
Concept of aquifer recharge wells
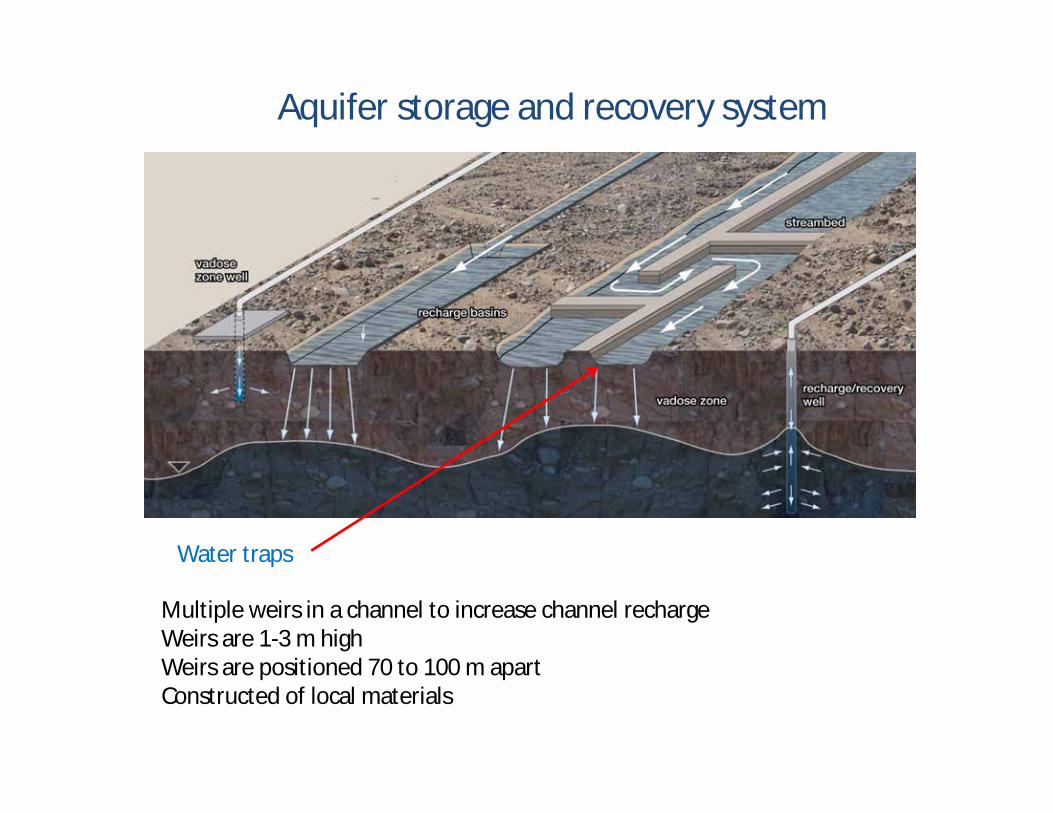
Aquifer storage and recovery system
Water traps
Multiple weirs in a channel to increase channel rechargeWeirs are 1-3 m highWeirs are positioned 70 to 100 m apartConstructed of local materials
Conclusion
The MAV is in a unique position. It receives adequate annual rainfall, but the timing is wrong
for maximum crop production. Producers will have to change the water management
practices, so that groundwater management becomes a priority throughout the year.
Groundwater recharge during the non-crop season can provide the means to sustain row
crop agriculture throughout this century.


![2012 -2014 Mississippi Delta Cardiovascular Health ...[5] Short VL, Ivory-Walls T, Smith L, Loustalot F. The Mississippi Delta Cardiovascular Health Examination Survey: Study Design](https://img.pdfslide.us/doc/110x75/5ed5e9584671760b576a7eac/2012-2014-mississippi-delta-cardiovascular-health-5-short-vl-ivory-walls.jpg)