Embed Size (px)
Citation preview

Health Research Whitepaper
The cost of care:The missing link in the strategic financial advice equation

Foreword
Contents
Australia – as the saying goes – is a ‘lucky country’. Our standard of living, our climate, and our health care and social security systems all stand up well to international comparisons. But there is a downside, in the false sense of security that Australians live with in terms of their health, and their capacity to cope financially, in the event of ill health.
Underscoring this point was recent Zurich research, conducted in conjunction with Oxford University, revealing the extent to which Australians see themselves as ‘bulletproof'. The same study found that - compared to their peers in other developed economies - Australians also have the most faith in the adequacy of social security to protect them in times of need, and unsurprisingly, the lowest interest in purchasing life insurance.
Of course such faith that ‘she’ll be right’ belies that fact that illness and injury strikes thousands of Australians everyday.
In 2016/17 there were over 777,000 hospitalisations due to injury or poisoning. This year alone there will be over 130,000 new diagnoses of cancer. Over 600,000 Australians are living with coronary artery disease, 2 million with kidney disease, and nearly half the population will experience mental health challenges during their life time.
Whilst advances in medicine and treatment techniques are improving the survival rates across most conditions, there is a cost burden.
This cost burden – estimated at $30 billion and upwards each year - falls on all of us, as tax payers and as individuals. And as good as our safety nets are, the out of pocket (OOP) cost impact to those affected by ill health can be crippling. Depending on the condition, direct costs can range from hundreds to many thousands of dollars each year. Often these are compound by the indirect costs – such as foregone income – impacting the sufferers and their carers.
Life insurance is a vital part of the ecosystem that helps protect the financial, emotional and physical wellbeing of Australians. But without a better understanding of how each of these systems interact, and a realistic appreciation of the true costs of poor health, we are ill equipped to judge the appropriate types and levels of support to best suit our circumstances, and to navigate a complex network of services and providers.
The cost of care whitepaper is an industry first, bringing together detailed research across the broad spectrum of injury and disease, painstakingly compiled in conjunction with our research partner Zest Healthcare. Readers can see for themselves the incidence of disease, along with comprehensive data on treatments and out of pocket costs across one’s lifetime. It certainly makes for sobering reading!
We are proud to bring this groundbreaking piece of analysis to market, and are excited about the opportunity to help advisers and customers alike make more informed decisions about financial protection.
Tim Bailey
CEO Zurich Life & Investments
Foreword 01
Contributors 03
Executive summary 04
Cancer 12
Heart and artery 32
Heart attack 38
Respiratory 44
Gastrointestinal 50
Brain and nervous system 54
Injury 64
Kidney and diabetes 70
Musculoskeletal 80
Vision disorders and blindness 88
Mental health 92
01 The cost of care 02

Contributors
Danielle Visser Zurich Risk Strategy Specialist
With over 10 years of Financial Services experience encompassing underwriting, insurance, financial planning and wealth management, Danielle Visser joined Zurich in 2016 as a Strategy Specialist. Danielle is a skilful presenter who regularly contributes thought leadership to trade publications to proliferate best practice. In her current role as Risk Strategy Specialist with Zurich, Life and Investments, she curates business strategy and educational training to ensure Zurich’s advice partners remain leaders in best practice and engagement strategy.
Dr John Cummins MBBS,MPH(USA),FRACP
Having graduated from Medicine at the University of Sydney in 1984, was admitted to the Royal Australian College of Physicians as a Specialist Physician in General Medicine in 1992. He completed a Master Degree in Public Health at the University of Minnesota in 1995.
He has worked within the insurance industry since 2005 for a number of direct companies and joined Gen Re as CMO Research and Development in 2009, completing his appointment in 2016. He currently holds the Chief Medical Officer position at ClearView and Scor as well as being Practice Principle of Executive Medicine - with his passion being evidence based preventative medicine with a focus on screening for and managing cardiovascular disease and cancer, and wellness at work .
Adam Crabbe Zurich Risk Strategy Specialist
Adam Crabbe has over 25 years of financial services experience encompassing retail banking and financial planning. Adam joined Zurich in March 2018 following 5 years as a senior analyst for insurance product research, a role in which he was instrumental in developing a framework for Approved Product List construction, performed comprehensive due diligence on insurance products, and helped in the selection of products and strategies that have assisted financial advisers achieve a best interest outcome for their clients.
Adam is a frequent presenter at conferences and Professional Development days and has lectured for the Securities Institute and Kaplan Professional. Adam is a Fellow of FINSIA, is a regular contributor to the drafting of Continuing Professional Development content for life insurance, and holds both the CFP and Life Risk Specialist designations.
Dr Doron Samuell MBBS, M.Sc (LSE), FRANZCP
Dr Doron Samuell is a Fellow of the Royal Australian and New Zealand College of Psychiatrists, graduate of both Harvard Business School and London School of Economics and is currently undertaking a doctorate in business analytics at Sydney University. He manages a panel of 400 doctors in his business, Professional Opinions and a panel of 14 behavioural economists in Behaviour. He is passionate about finding solutions to complex problems in the financial services and health sectors.
Executive summary
03 The cost of care 04

Purpose of research
This study examines the incidence – and cost burden – of ill health in Australia. By drawing on aggregate health data, and individual case studies, the cost of care whitepaper serves to give financial advisers and their clients a clearer picture of the direct and indirect cost impacts to them and their families in the event of serious injury or illness. In doing so, the study aims to give a greater understanding of the healthcare, social security and insurance ecosystem, in turn allowing more informed decision making about the most appropriate mechanisms to protect one’s financial wellbeing.
MethodologyInformation was obtained through a rapid review of current information and evidence-based publications and by keyword searches performed in databases. Australian literature was preferred to international literatures, however, where Australian data was not available, data from counties with a similar economic structure were used, e.g. United States and United Kingdom. Case studies were developed through interviews with patients and in collaboration with healthcare experts.
To account for inflation, rates sourced from the Reserve Bank of Australia have been applied to any monetary value reported prior to 2018 and indexed accordingly.
The growing cost of healthcare• Ongoing advancements in the diagnosis and
treatment of disease have seen life expectancy continue to increase
• As we see more people live with – rather than die from – serious health conditions, the cost burden on our healthcare system grows
• In 2015/16 total health expenditure in Australia was $170.4 billion1
• Whilst State and Federal Government pick up the lion’s share of this burden, individual Australians – and their families and carers – still accounted for around $30 billion of this annual cost2
• This is nearly twice the amount funded by private health insurers
• This amount relates to direct expenditure only, and doesn’t account for any indirect costs in the form of income foregone by the individual and/or their caregivers
• Approximately two thirds of health expenditure by individuals relates to primary health care (ie unrelated to visits to hospitals or specialists)1
• Approximately one third relates to medications.
Who spent what?
The Australian Government spent the most on healthcare, followed by State and Local Government.
Current price expenditure ($ Billion)2
The out of pocket burden• Whilst Medicare is universal, and can cover
hospital, medical and pharmaceutical benefits, more than 11 million Australians choose to ‘supplement’ their healthcare funding with private hospital cover and around 13 million had private ancillary cover2
• Notwithstanding the interaction between Medicare and private cover, the individual is often left with a ‘gap’ between the amount covered and the total cost of the medical services
• This gap can arise for several reasons, including where service providers choose to charge more than the ‘notional fee’ for a service, as calculated by health authorities (the free market in operation)
• This gap translates to an ‘out of pocket’ cost, borne by the individual
• The quantum of these out of pocket costs can create a barrier to individuals seeking suitable treatment for their conditions
• An Australian study investigating the effects of healthcare costs on individuals found that 14% of adults didn’t receive the recommended care due to costs; for those living with chronic health conditions, the proportion was higher, at 24%3
• Further research suggests that over 40% of individuals with depression, anxiety and other mental health conditions skip treatment and other care needs because of the cost4.
14% of adults didn’t receive the recommended care due to costs; for those living with chronic health conditions, the proportion was higher, at 24%3.
References
1. Australian Institute of Health and Welfare 2013. Health expenditure Australia 2011–12. Health and welfare expenditure series no. 50. Cat. no. HWE 59. Canberra: AIHW, p. 117.
2. Australian Institute of Health and Welfare 2017. Health expenditure Australia 2015–16. Available from: www.aihw.gov.au/reports/ health-welfare-expenditure/ health-expenditureaustralia-2015-16/contents/ data-visualisations [Accessed June 2018].
3. Essue B et al. Out-of-pocket costs of health care in Australia. Submission to the Senate Standing Committee on Community Affairs. Submission 28.
4. Callander EJ, et al. Out-of-pocket healthcare expenditure and chronic disease — do Australians forgo care because of the cost? Aust J Prim Health. 2016;23(1):p.15–22.
5. 15. Australian Institute of Health and Welfare (2013). Stroke and its management in Australia: an update. Cardiovascular disease series no. 37. Cat. no. CVD 61. Canberra: AIHW.
6. 6. Australian Institute of Health and Welfare (2017). Back problems. Available from: www.aihw.gov.au/ reports/arthritis-othermusculoskeletal-conditions/ back-problems/what-are-backproblems [Accessed May 2018].
$60
Australian Government
State & Local Government
Individuals Health insurance Funds
Other non-government
$40
$20
$0
Executive summary
Indirect costs• Indirect costs to the individual, such as time
spent off work and time spent travelling to and from medical appointments, as well as indirect costs to families and carers also pose a significant burden
• As an example, average people with back pain or problems are absent from work almost 21 days per year as a result of their illness6
• A report investigating the impact on carers of people who have experienced stroke found that:
• 58% of primary carers of people with stroke and disability spend 40 hours or more per week in their caring role5
• 21% report a decrease in income due to their caring role
• 24% incur extra expenses due to their caring role
• 31% have difficulty meeting everyday living costs.
In 2015/16 the total health expenditure in Australia was
$170.4 billion
05 The cost of care 06
Exe
cutiv
e su
mm
ary

Classifying health conditionsFor the purposes of this research, health issues examined have been classified into the following categories:
• Cancer
• Diseases of the heart and arteries
• Respiratory conditions
• Gastrointestinal diseases
• Brain and nervous system conditions
• Kidney and diabetes conditions
• Musculoskeletal conditions
• Vision impairment
• Mental health
Each section in this whitepaper details the prevalence and/or incidence of the illness, as well as the risk that an individual has of developing that illness. The costs, both direct and indirect, of each illness have also been described.
Cancer• Cancer represents 19% of the disease burden
in Australia, and is one of the most financially impactful.
• One in three Australian men and one in four Australian women will be diagnosed with some type of cancer before they turn 75
• There are 380 new diagnoses of cancer every day in Australia
• Prostate cancer is the most prevalent, followed by breast cancer
• Australia has the second highest prevalence of melanoma in the world
• 5 year survival rates range from 16% for lung cancer, to 95% for prostate cancer
• The average lifetime cost for cancer sufferers aged 15 years and older, can range from $20,360 for melanoma to $95,460 for head, neck and thyroid cancers
• The average cost paid by the Pharmaceutical Benefits Scheme (PBS) per anticancer prescription has increased far in excess of inflation, and is currently $786
• Pharmaceutical companies can spend up to $2 billion developing new cancer treatments
• Patients using drugs not supported by the PBS can face bills of up to $5,000 per month or more
• Individuals facing an uncertain future will seek any source of hope, even if the efficacy of the treatments is unclear.
• People who live outside major cities have 17 times the odds of reporting locational or financial barriers to care compared to those living in metropolitan areas
• Around 72% of cancer carers report a negative financial impact of caring and more than half of carers who work full time need to take leave or reduce working hours.
Incidence and cost – some highlights
Over 128,000 cardiac angiograms are performed in Australia every year. The cost of an angiogram is approx
$13,247
Patients using drugs not supported by the PBS can face bills of up to
$5,000 per month or more
Diseases of the heart and arteries• Cardiovascular disease (CVD), which covers
a range of conditions affecting the heart and arteries, such as heart attack, stroke and high blood pressure, is responsible for one death every 12 minutes in Australia
• Over 128,000 cardiac angiograms are performed in Australia every year. The cost of an angiogram is approx $13,247
• Australian expenditure on CVD is higher than any other disease group
• Each year, CVD is responsible for 84 million prescriptions at a cost of $3.3 billion
• There is one heart attack every 10 minutes and one heart attack related death every 66 minutes
• There are 96 stroke events every day in Australia, of which 29 are fatal
• A third result in some degree of disability
• Whilst the out of pocket costs for heart attack and stroke can be smaller than other conditions (as a higher proportion is covered by Medicare), the indirect costs can be more significant
• For example
• 58% of primary carers of people with stroke related disability spend 40 hours or more per week in their caring role
• 21% report a decrease in income due to their caring role
• 24% incur extra expenses due to their caring role
• 31% have difficulty meeting everyday living costs.
Explanation of terminology used in this report
• Prevalence: the number of people in a specified time period with the illness or disease
• Incidence: the number of new cases of an illness or disease in a specified time period
• Risk: the likelihood that an individual will have a certain illness or disease
In some cases, this is reported as ‘lifetime risk’ or the risk that an individual will have a certain illness or disease over the course of their lifetime
It can also be reported as the likelihood by, at or within a specific age range, for example, by 85 years, from 45 years or between 26 and 49 years
In most cases, risk has been reported as likelihood in the general population. However, for some illnesses and conditions, risk varies significantly due to factors such as family history, co-existing conditions and other lifestyle risk factors such as smoking. Risk in specific populations has been included where relevant.
• Lifetime cost: the expected costs over the person’s lifetime from diagnosis to death; financial costs take into account out-of-pocket expenses (healthcare and financial costs) and a reduction in income (e.g. productivity and carer costs)
07 The cost of care 08
Exe
cutiv
e su
mm
ary

Diabetes and kidney disease• Diabetes is the fastest growing chronic
condition in Australia
• There are estimated to be 1.7 million sufferers
• Type 1 diabetes (T1D) and type 2 diabetes (T2D) are the most common, accounting for 10% and 85% of cases, respectively
• Kidney disease affects around 1.77 million Australians, is responsible for 9 deaths each day and kills more people each year than breast cancer, prostate cancer or road traffic accidents
• Chronic kidney disease – where kidney function is impaired for 3 months or more – can affect up to 40% of Australians after age 50
• Average time off work for CKD sufferers is 18 days per annum
• The average out of pocket cost of CKD is around $4,000 per annum
• Diabetes is the leading cause of preventable blindness and kidney failure in Australia
• There are more than 4,400 amputations per year as a result of diabetes
• The risk of cardiovascular events and other complications is higher in people with diabetes
• Heart attack: three times as likely
• Stroke: four times as likely
• Kidney failure: three times as likely
• The number of Australians out of the workforce due to diabetes is expected to increase 18% by 2030.
Musculoskeletal• Musculoskeletal conditions, such as back
problems and pain, arthritis, and osteoporosis affect over 7 million Australians
• The most common reasons for Australians of working age to drop out of the workforce are back problems and arthritis (the two conditions alone account for 40% of forced retirements)
• In 2014–15, there were 534,187 hospitalisations due to musculoskeletal conditions – most were for back problems
• More than 2 million Australians suffer osteoarthritis, making it the most common form of arthritis in Australia
• Two thirds of osteoarthritis sufferers take time off work for their condition, with the average being 72 days per annum
• Rheumatoid arthritis is less common - with half a million sufferers in Australia – but can be more expensive, with some people spending up to $30,000 per annum managing their condition
• The burden of musculoskeletal conditions exceeds that of all other chronic conditions in Australia
• 52,000 people of working age cannot work due to their arthritis, forgoing an average of $955 per week in income
• There are estimated to be 395 fractures every week due to osteoporosis
Respiratory• Chronic respiratory conditions affect more
than a quarter of the population
• It is estimated that there are 2.5 million Australians living with asthma
• Another serious and costly respiratory illness is COPD, or chronic obstructive pulmonary disease. COPD is a condition that limits airflow to the lungs and is not fully reversible with the use of medication
• In 2015, there were an estimated 1.45 million Australians with COPD
• There are 19 deaths per day from COPD
• Three quarters of all COPD cases can be attributed to tobacco
• Its 5 year survival rate can be as low as 40%
• Of Australians with lung disease, COPD contributes to almost one-third of all deaths and costs patients an average of $9,020 in out-of-pocket (OOP) costs per year.
• 78% of people living with advanced COPD experienced economic hardship from managing their illness and 27% were unable to pay their medical expenses.
Brain and nervous system• Conditions of the brain and nervous system
include dementia, epilepsy, Parkinson’s disease, multiple sclerosis (MS) and spinal cord injury (SCI)
• There are approximately 802,416 Australians living with these conditions – more than half (425,416) are living with dementia and one-third (250,000) with epilepsy
• 1.2 million Australians care for dementia sufferers
• The risk of developing dementia over ones lifetime can be as high as 17%
• An individual with dementia can expect to pay $47,811 in the first year and $14,842 each year thereafter to manage their condition
• A person with Parkinson’s disease may end up paying $169,060 over a period of 12 years.
Injury*• In 2014–15 there were a total of 483,673 injuries
in Australia, equivalent to 1,325 every day
• 55% were experienced by men
• 52% of traumatic brain injuries are attributable to car accidents
• The main cause of traumatic spinal cord injury is falls (33%)
• Each month there are 11 new quadriplegic events and 11 new paraplegic events
• The lifetime direct cost of quadriplegia can exceed $11 million
• Around 20,000 Australians live with spinal cord injuries (SCI)
• Approximately half those who were working prior to suffering an SCI will never return to the workforce.
In 2014–15 there were a total of 483,673 injuries in Australia, equivalent to...
1,325every day
*Injury is defined as the occurrence of injuries requiring hospitalisation in Australia
The most common reasons for Australians of working age to drop out of the workforce are back problems and arthritis (the two conditions alone account for 40% of forced retirements)
Two thirds of osteoarthritis sufferers take time of work for their condition, with the average being 72 days per annum
09 The cost of care 10
Exe
cutiv
e su
mm
ary

Cancer
Vision disorders and blindness• In 2016, there were an estimated 384,000 cases
of vision disorders and blindness in Australia
• The average cost of a vision disorder or blindness is $5,760 per year
• By the age of 85,
• 1 in 3 people will experience vision impairment
• 1 in 6 will experience permanent sight loss or blindness
• The most common causes of vision impairment and blindness are degenerative
• eye diseases such as:
• Age-related macular degeneration (AMD):
• Glaucoma
• Diabetic retinopathy
• Cataract
• The risk of depression in people with vision impairment is three times higher than in those without vision impairment.
Mental Health• Almost half of the total population (45.5%)
experience a mental health condition at some point in their lifetime.
• Mental health conditions can include affective disorders (including depression, bipolar, schizophrenia), anxiety disorders (including panic attacks and stress disorders) and substance abuse disorders (eg. alcohol and drug dependencies)
• 1 in 6 women and 1 in 8 men will experience depression during their lifetime
• 1 in 3 women and 1 in 5 men will experience anxiety
• The cost of depression averages $17,190 per individual
• Individuals spend an estimated $1,350 per year in out-of-pocket (OOP) costs for mental health conditions, with medications accounting for one-third of this cost
• Fewer than two in five individuals (35%) with anxiety or depression seek treatment
• Individuals with mental health conditions lost an average of 38 working days annually
• Suicide is the leading cause of death for Australians aged 15 to 44, and the second leading cause of death for Australians aged 45 to 54 years.
Cancer contributes to 19% of the total disease burden in Australia and has a significant social and economic impact on individuals, families and the community.
In 2018, it is expected that 138,321 Australians will be diagnosed with cancer, with the most commonly diagnosed cancers being prostate, breast, bowel and melanoma.
One in every three Australian men and one in every four Australian women will be diagnosed with cancer by the age of 75 years:
• The chance of developing prostate cancer is 1 in 5, with up to 40% of those diagnosed experiencing a recurrence;
• For breast cancer, there is a 1 in 8 chance and recurrence rates range from 3–23%;
• The likelihood an individual will get bowel cancer in their lifetime is 1 in 13; up to 50% of those will experience recurrence within 2–3 years following their initial diagnosis;
• With the second highest incidence rates in the world, it is estimated that Australians have a 1 in 16 chance of developing melanoma cancer; around 11% of people will experience recurrence of the disease 25 years after initial treatment.
Although healthcare in Australia is largely publicly funded, out-of-pocket (OOP) costs associated with cancer diagnosis, treatment and survival can place a huge burden on sufferers and their families. For example, the average lifetime cost for a man with prostate cancer is $36,800, and for an individual with lung cancer, $74,600.
Cancer typeAverage lifetime cost
Prostate cancer $36,800
Breast cancer $36,040
Bowel cancer $51,460
Melanoma skin cancer $20,360
Lung cancer $74,600
Non-Hodgkin lymphoma $87,500
Head, neck and thyroid cancers $95,460
Kidney cancer $63,220
Uterine cancer $46,030
Average lifetime costs by cancer type for individuals aged 15 years and older.
1 in 6 women and 1 in 8 men will experience depression during their lifetime
11 The cost of care 12

Most prevalent cancers in Australia
Prostate cancer
Breast cancer (females)
Bowel cancer
Melanoma skin cancer
Non-Hodgkin’s lymphoma
Lung cancer
Head and neck cancers
Thyroid cancer
Kidney cancer
Uterine cancer
0 20,000 40,000 60,000 80,000
Five-year prevalence (end of 2013)
A cancer develops because an abnormality of DNA within normal cells leads to uncontrolled cellular growth locally, as well as spreading to distant sites. This causes damage of noncancerous healthy tissue generally by compression and invasion. Ultimately death frequently occurs as a result of multiple organ failure due to invasion from cancer.
Deaths from cancer account for approximately 1 in 3 adult deaths. As a clinician, common cancers such as melanoma, breast and colon cancer are all too frequent diagnoses. Many cancer deaths and even diagnoses are preventable with healthy lifestyle choices and cost-effective screening.
With technological advances and large trials, we are increasingly understanding cancer biology. We know now that not all prostate cancers need active treatment – if they are not aggressive and small in volume often there is no proven benefit to active treatment, e.g. surgery. Thyroid cancers and small kidney cancers may also be in the same realm, although there are limited long-term data yet to prove this. One day, only selected cancers will be aggressively treated.
We increasingly understand how cancers behave at a molecular level – some cancers can ‘hide’ from one’s immune system, which normally keeps cancer cells in check. Subsequently, medications have been devised to act on the patient’s immune system so that they can recognise and attack the cancer cells. By investigating the molecular pathways within cancer cells, we can also use molecules to block intracellular growth pathways, thus causing cancer cell death. Furthermore, genetic analysis of tumour tissue can help identify medications that can be used to block abnormal genetic expression.
So, with the combination of cell biology, synthetic biology and gene therapy, we find that many different cancers originating in differing tissue types share the same common molecular pathways. For example, certain lung cancers may receive the same therapy as some breast cancers or prostate cancers.
No longer is the uniform approach to all cancers to give widespread chemotherapy. Increasingly we are seeing apparent cure with widespread cancer, with therapy that can have minimal side effects, enabling people to continue with their work and life roles uninterrupted.
Radiotherapy as a treatment option has also come of age in leaps and bounds. With increased progress in computing technology, one can now treat up to 5 metastatic lesions (lesions which have spread distally from the original cancer site) with a prospect of cure using radiotherapy alone. Radioactive beads can be ‘shot’ into a cancer via a tiny tube cannulated into the artery feeding the cancers or be surgically inserted into the cancer tissue itself – these can be ‘overnight or day only’ procedures with the patient discharged within 24 hours.
Survival is increasing and the medical profession is further understanding who to treat and how to personalise the treatment to cause minimal damage to healthy tissue and maximise chances of survival. So, whereas in the 1970s the average survival post cancer diagnosis was approximately 12 months, current survival rates are around 6 to 10 years and increasing.
However, such interventions come at a cost.
Out of pocket costs for surgery can run into the tens of thousands of dollars and radiotherapy can also be expensive.
"Annual PBS expenditure on anticancer drugs rose from $65 million in 1999–2000 to $466 million in 2011–2012. The average price paid by the PBS per anticancer drug prescription, adjusted for inflation, increased 133% from $337 to $786. Some have argued that the price of new anticancer drugs is increasing rapidly because of the increasing cost of drug development, with estimates ranging from $500 million to $2 billion per new drug approved.
Patients wanting to use new anticancer drugs that are not reimbursed currently face bills of about $5000 per month. Physicians will increasingly find themselves in the difficult position of having to discuss with patients whether the financial toxicity of these new drugs is warranted by their benefits.”
Cancer contributes to 19% of the total disease burden in Australia and has a significant social and economic impact on individuals, families and the community.1
In 2018, it is expected that 138,321 Australians will be diagnosed with cancer, representing 379 new diagnoses every day.2 An estimated 40% will be between the ages of 25 and 64 years.1
Prevalence of cancer in AustraliaAs of 2013, the ten most prevalent cancers in non-Indigenous Australians were:4
Expert's viewDr John CumminsMBBS,MPH(USA),FRACP
1 in 3 Australian men and 1 in 4 Australian women will be diagnosed with cancer before the age of 753
Cancer is a term used for diseases in which abnormal cells divide without control and can invade nearby tissues.”1
13 The cost of care 14
Can
cer

Cost of cancer in Australia
The facts • The average lifetime cost of cancer for
individuals aged 15-64 is $126,280
• People who live outside major cities have 17 times the odds of reporting locational or financial barriers to care compared to those living in metropolitan areas5
Looking to the futureCancer immunotherapy is changing the face of cancer treatment. Immunotherapy uses the body’s own immune system to attack cancer cells. There are an estimated 200 clinical trials underway for various immunotherapies, while others have already taken the market by storm. In 2018, a number of treatments became available in Australia, including immunotherapy for melanoma, breast cancer, advanced lung cancer, kidney cancer and Hodgkin lymphoma.7,8
Approximately one in three Australians with cancer perceive the financial burden of prescribed medicines for cancer treatment or recovery to be moderate, heavy or extreme5
Although healthcare in Australia is largely publicly funded, there are still significant out-of-pocket (OOP) costs associated with cancer diagnosis, treatment and survival. These can include:5
• GP and specialist gap payments
• Scans or tests outside of the public system
• Over the counter (OTC) medications for pain relief and other purposes
• Complementary medicines or therapies
• Medical devices
• Travel
• Accommodation
• Personal care (e.g. managing ulcers during radiotherapy)
What about carers and families?The financial burden of cancer extends beyond the patient, with the average overall cost to the household estimated at $48,000. Around 72% of cancer carers report a negative financial impact of caring and more than half of carers who work full time need to take leave or reduce working hours.5
References
1. AIHW 2016. Australian Burden of Disease Study: impact and causes of illness and death in Australia 2011. Australian Burden of Disease Study series no. 3. BOD 4. Canberra: AIHW
2. Cancer Australia. All cancers in Australia. Available from: https://canceraustralia.gov.au/affected-cancer/what-cancer/cancer-australia-statistics [Accessed April 2018]
3. Australian Cancer Research Foundation. Cancer statistics. Available from: https://www.acrf.com.au/support-cancer-research/cancer-statistics-australia/ [Accessed May 2018]
4. AIHW. Cancer in Aboriginal & Torres Strait Islander people of Australia. Available from: https://www.aihw.gov.au/reports/cancer-screening/cancer-in-indigenous-australians/contents/prevalence [Accessed May 2018]
5. Paul CL, et al. The impact of loss of income and medicine costs on the financial burden for cancer patients in Australia. The Journal of Community and Supportive Oncology. 2016;14(7):p.307–313
6. Access Economics. Cost of Cancer in NSW: A report by Access Economics Pty Limited for The Cancer Council NSW. April 2007.
7. SBS News. Hope for new stomach cancer treatments. Available from: https://www.sbs.com.au/news/hope-for-new-stomach-cancer-treatments [Accessed May 2018]
8. Healthline. My two-decade journey with cancer immunotherapy. Available from: https://www.healthline.com/health-news/my-two-decade-journey-with-cancer-immunotherapy#6 [Accessed May 2018]
Around 1.3 million hours of informal care are provided to individuals with cancer each year5
15 The cost of care 16
Can
cer
The cost of prostate cancerResults from an Australian study, in which 289 men with prostate cancer reported the cost of their treatment revealed:5
• The average out-of-pocket (OOP) cost for prostate cancer treatment in newly diagnosed patients was $11,077 in the first year and ranged from $250 to $30,000
• Spending was largely on specialist fees, hospital services, medical equipment and supplies and medicines
• One in four men stopped working as a result of their diagnosis and out of those who retired, most had done so 4–5 years earlier than planned.
Reported OOP costs by treatment type5
Watchful waiting $3,450–$7,534
Active surveillance $5,892–$14,711
Radical prostatectomy $8,493–$13,500
Androgen deprivation therapy $5,765–$17,177
Snapshot
Estimated number of new cases (2018)1 17,729 (48 new cases every day)
5-year survival rate1 95%
Estimated number of deaths (2018)1 3,500 (9 deaths each day)
Likelihood1 1 in 5 chance by age 85 years
Recurrence2 Up to 40% of men will experience recurrence
Average lifetime cost (individual aged 15 years and over)3 $36,800
• Prostate cancer is the most common cancer among Australian men1
• The occurrence of prostate cancer is highest among men between the ages of 35 and 691
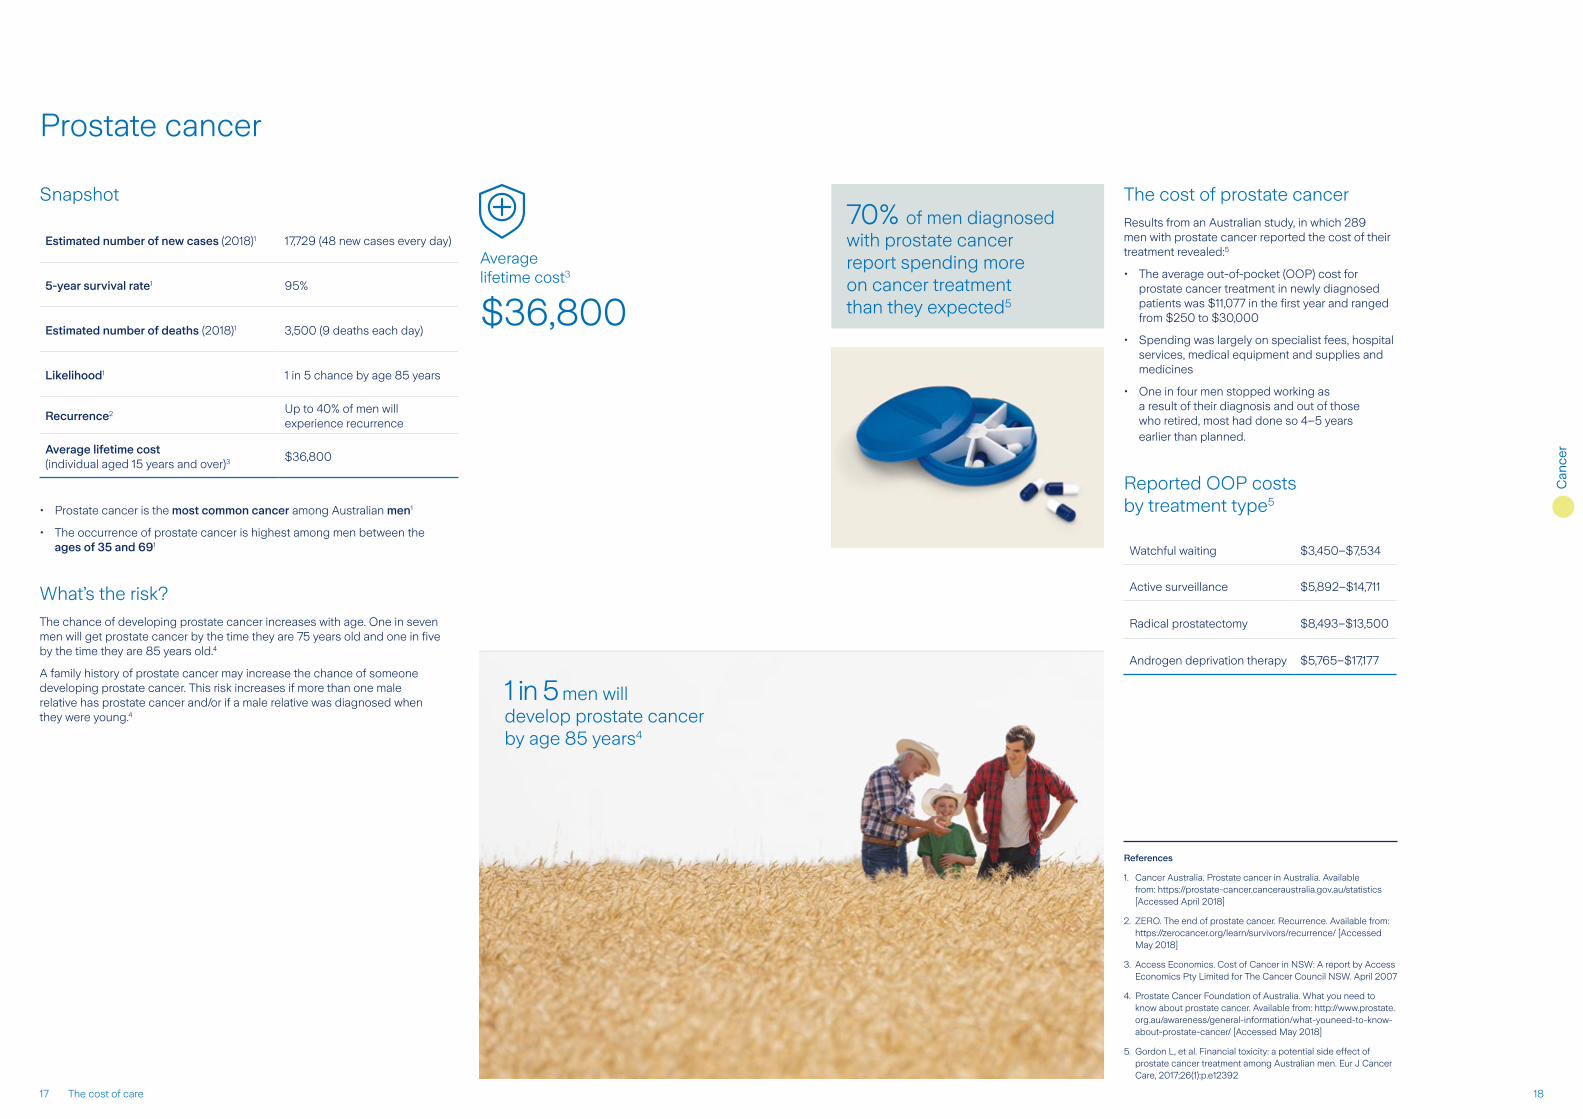
What’s the risk?The chance of developing prostate cancer increases with age. One in seven men will get prostate cancer by the time they are 75 years old and one in five by the time they are 85 years old.4
A family history of prostate cancer may increase the chance of someone developing prostate cancer. This risk increases if more than one male relative has prostate cancer and/or if a male relative was diagnosed when they were young.4
Prostate cancer
$36,800
Average lifetime cost3
70% of men diagnosed with prostate cancer report spending more on cancer treatment than they expected5
References
1. Cancer Australia. Prostate cancer in Australia. Available from: https://prostate-cancer.canceraustralia.gov.au/statistics [Accessed April 2018]
2. ZERO. The end of prostate cancer. Recurrence. Available from: https://zerocancer.org/learn/survivors/recurrence/ [Accessed May 2018]
3. Access Economics. Cost of Cancer in NSW: A report by Access Economics Pty Limited for The Cancer Council NSW. April 2007
4. Prostate Cancer Foundation of Australia. What you need to know about prostate cancer. Available from: http://www.prostate.org.au/awareness/general-information/what-youneed-to-know-about-prostate-cancer/ [Accessed May 2018]
5. Gordon L, et al. Financial toxicity: a potential side effect of prostate cancer treatment among Australian men. Eur J Cancer Care, 2017;26(1):p.e12392
1 in 5 men will develop prostate cancer by age 85 years4
17 The cost of care 18
Can
cer

Breast cancer
Snapshot
Estimated number of new cases (2018)1 18,087 (49 new cases every day)
5-year survival rate1 91%
Estimated number of deaths (2018)1 3,128 (8 deaths each day)
Likelihood1 1 in 8 chance by age 85 years
Recurrence2
Women who have lumpectomy plus radiation therapy - 3-15% within 10 years
Women who have a mastectomy without radiation therapy - approx 23% within 5 years2
Average lifetime cost (individual aged 15 years and over)3 $36,040
• Breast cancer* is the most common cancer among Australian women
• ~70% of breast cancers are diagnosed in women aged 40–69 years4
• The 5-year survival rate has improved dramatically from 1984, when it was only 72%1
*Both men and women can develop breast cancer but the proportion of women who develop breast cancer is much greater than the proportion of men. Breast cancer data presented here refer to invasive breast cancer in women, unless otherwise stated
What’s the risk?Aside from age, most people diagnosed with breast cancer don’t have any known risk factors.5 In general, the likelihood of a woman developing breast cancer by age 85 years is about 1 in 8. However, certain risk factors such as personal factors, family history and lifestyle can increase the chances of getting cancer.5
For example, the likelihood of a woman with a BRCA1 or BRCA2 gene mutation being diagnosed with breast cancer by age 80 years is 69% to 72%.6
The cost of breast cancer• Typical out-of-pocket (OOP) cost incurred in the first five years following
a diagnosis of breast cancer is $4,809, with most of these costs incurred during the first 12 to 24 months after diagnosis2
• OOP costs are highly variable, ranging anywhere from $1,510 to $17,200; these costs rise with increased disease severity and age2
• The median hours worked per week in paid employment across the household decreases by about 50% during breast cancer treatment2
Major contributors to OOP costs for breast cancer2
Breast reconstructive surgery (optional)
$2,957–$9,472
Radiotherapy $1,751–$2,101
Pathology tests$3,500–$4,250
Genetic tests $774–$1,251
MRIs $451–$1,554
Looking to the future
The answer to treating triple-negative breast cancer – an aggressive and deadly form of the disease – may lie in a computer program. Using genetic and treatment data from triple-negative cancer cells, researchers at Monash University have developed a program to predict a combination of drugs that may be the key to successful treatment.7
References
1. Cancer Australia. Breast cancer in Australia. Available from: https://breast-cancer.canceraustralia.gov.au/statistics [Accessed April 2018]
2. Susan G Komen. Survival and risk of recurrence. Available from: https://www5.komen.org/Breast Cancer/SurvivalandRiskofHavingCancerReturnAfter Treatment.htm [Accessed May 2018]
3. Deloitte. Access Economics. Financial impacts of breast cancer in Australia: Breast Cancer Network Australia. November 2016
4. Cancer Council Australia. Understanding breast cancer: A guide for people with cancer, their families and friends. July 2016
5. Cancer Australia. Your risk and breast cancer: Understanding risk. Available from: https://breastcancerrisk.canceraustralia.gov.au/understanding-risk [Accessed April 2018]
6. Breast Cancer Network Australia. Latest news: New study on BRCA risks. Available from: https://www.bcna.org.au/news/2017/06/new-study-on-brca-risks/ [Accessed April 2018]
7. Science Daily. The answer to triple-negative breast cancer? Available from: https://www.sciencedaily.com/releases/2018/06/180619141342.htm [Accessed May 2018]
1 in 8 women in Australia have a chance of developing breast cancer by age 85 years5
$36,040
Average lifetime cost3
19 The cost of care 20
Can
cer

Bowel cancer
Snapshot
Estimated number of new cases (2018)1
17,003 (46 new cases every day)
• 9,294 (men)• 7,709 (women)
5-year survival rate1 69%
Estimated number of deaths (2018)1 4,129 (11 deaths each day)
Likelihood1
1 in 13 chance by age 85 years
• 1 in 11 (men)• 1 in 15 (women)
Recurrence2
30–50% of people will experience recurrence within 2 to 3 years following initial diagnosis
Average lifetime cost (individual aged 15 years and over)3 $51,460
Standard treatment types for bowel cancer6
Colon cancer Rectal cancer
Surgery Surgery
Radiofrequency ablation Chemotherapy
Cryosurgery Radiation therapy
Chemotherapy Targeted therapies
Radiation therapy
Targeted therapies
The cost of bowel cancerCosts from bowel cancer include those related to medical appointments, tests and treatments. People with suspected bowel cancer may have initial investigations with a GP, followed by more in-depth investigations with a specialist doctor.6 Treatment for bowel cancer is dependent on a number of factors, including where the cancer is located in the bowel and the stage of the cancer. Standard treatments for both colon cancer and rectal cancer are outlined below. Some people may undergo a combination of treatments.
• The number of new cases of bowel cancer has increased significantly over the past four decades – from 6,986 in 1982 to 17,003 (estimated) in 2018 1
• Bowel cancer is more common in people over the age of 50 years4
• Bowel cancer is the second most common cause of death from cancer in Australia1
• Overall survival rates for bowel cancer are much lower than other common cancers such as prostate and breast1,5
What’s the risk?Bowel cancer (collectively, cancers of the colon, rectum or rectosigmoid junction), also referred to as colorectal cancer, is the third most common type of cancer diagnosed in Australia each year and the number of new cases are expected to increase.5 The risk of being diagnosed with bowel cancer is higher for men than for women. Men have a 1 in 11 chance vs 1 in 15 for women.1
Age also plays a role in the likelihood of getting bowel cancer, with the risk rising from age 50 years.4 However, bowel cancer can occur at any age; around 2% of people diagnosed with bowel cancer each year are under the age of 55 years.4,5
References
1. Cancer Australia. Bowel cancer (Colorectal cancer) in Australia. Available from: https://bowel-cancer.canceraustralia.gov.au/statistics [Accessed May 2018]
2. Bowel Cancer Australia. Available from: https://www.bowelcanceraustralia.org
3. Access Economics. Cost of Cancer in NSW: A report by Access Economics Pty Limited for The Cancer Council NSW. April 2007.
4. Cancer Council Australia. Understanding bowel cancer: A guide for people with cancer, their families and friends. 2017
5. Bowel Cancer Australia. Bowel cancer – The facts. Available from: https://www.bowelcanceraustralia.org/ [Accessed May 2018]
6. Bowel Cancer Australia. Treatment options for colon and rectal cancer. Available from: https://www.bowelcanceraustralia.org/ [Accessed May 2018]
7. Bowel Cancer Australia. Latest News. Available from: https://www.bowelcanceraustralia.org/ [Accessed May 2018]
Beyond treatment, people with bowel cancer may continue to have tests (e.g. blood tests) and follow-up appointments with their healthcare professional to assess how the cancer has responded.6
Looking to the futureThe 2018–19 Federal Budget will provide $35 million over four years to fund the follow-up of people who have received a positive at-home bowel cancer screening test result and have not attended a follow-up appointment with a doctor.7
$51,460
Average lifetime cost
The chance of developing bowel cancer by age 85 years is 1 in 131
21 The cost of care 22
Can
cer
21

Melanoma skin cancer
Snapshot
Estimated number of new cases (2018)1
14,320 (39 new cases every day)
• 8,653 (men)
• 5,667 (women)
5-year survival rate1 90%
Estimated number of deaths (2018)1 1,905 (5 deaths every day)
Likelihood1
1 in 16 chance by age 85 years
• 1 in 13 (men)• 1 in 23 (women)
Recurrence2 after initial treatment 6.8% chance within 15 years
11.3% chance within 25 years
Average lifetime cost (individual aged 15 years and over)3 $20,360
What’s the risk?The risk of melanoma is increased just by living in Australia, which has the world’s second highest incidence of melanoma behind New Zealand.1,4 Australians have a 1 in 16 chance of developing melanoma by the time they are 85 years. This risk is slightly higher in men than in women (1 in 13 chance vs 1 in 23 chance, respectively).1 Although people over the age of 60 have a higher risk of melanoma, it is the most common cancer type (of all cancers) in young Australians aged 15–39 years old.5,7
The cost of melanomaAlthough the lifetime cost of melanoma is among the lowest across all cancer types, it is incredibly common, especially in young Australians.
Costs to the individual may arise as a result of standard treatments, including surgery, radiation therapy, targeted therapies, immunotherapy and chemotherapy.8
Other costs associated with melanoma treatment may include reconstructive surgeries, such as skin grafts and flap repairs, to lessen the side effects of scarring from melanoma removal.8
References
1. Cancer Australia. Melanoma skin cancer in Australia. Available from: https://melanoma.canceraustralia.gov.au/statistics [Accessed May 2018]
2. American College of Surgeons. Melanoma recurs after 10 years in more than 6 percent of patients. Available from: https://www.facs.org/media/press-releases/jacs/melanoma0613 [Accessed May 2018]
3. Access Economics. Cost of Cancer in NSW: A report by Access Economics Pty Limited for The Cancer Council NSW. April 2007.
4. Melanoma Institute Australia. Melanoma facts and statistics. Available from: https://www.melanoma.org.au/understanding-melanoma/melanoma-facts-and-statistics/ [Accessed May 2018]
5. Cancer Council Australia. Skin cancer. Available from: https://www.cancer.org.au/about-cancer/types-of-cancer/skin-cancer.html [Accessed May 2018])
6. Cancer Council Australia. Understanding Melanoma: A guide for people with cancer, their families and friends
7. Melanoma Institute Australia. Understanding melanoma – treatment options. Available from: https://www.melanoma.org.au/understanding-melanoma/treatment-options/ [Accessed May 2018]
Looking to the futureAn online test, created by QIMR Berghofer Medical Research Institute in Queensland, can predict a person’s risk of developing melanoma – and with good accuracy. The test involves answering a series of simple questions and can be used to estimate the probability of developing melanoma in the next 3.5 years.
• Australia has the world’s second highest incidence of melanoma (behind New Zealand)4
• Melanoma only represents 2% of all skin cancers but causes 75% of skin cancer deaths5
• Melanoma is the most common cancer in young Australians aged 15–39 years old5
The likelihood of developing melanoma by age 85 years is
1 in 161
There are three main types of skin cancer – basal cell carcinoma, squamous cell carcinoma and melanoma. Melanoma is the most dangerous form of skin cancer6
$20,360
Average lifetime cost
23 The cost of care 24
Can
cer
Lung cancer
Snapshot
Estimated number of new cases (2018)1
12,741 (34 new cases every day)
• 7,212 (men)• 5,529 (women)
5-year survival rate1 16%
Estimated number of deaths (2018)1 9,198 (25 deaths each day)
Likelihood1
1 in 16 chance by age 85 years
• 1 in 14 (men)• 1 in 20 (women)
Recurrence2 30–55% of people will experience recurrence
Average lifetime cost (individual aged 15 years and over)3 $74,600
• Lung cancer causes more deaths than any other cancer in Australia4
• People who smoke are 25 times more likely to develop lung cancer than those who don’t smoke5
• It can take decades for lung cancer to develop, with those most commonly diagnosed aged 60 years or older6
What’s the risk?Australians have a 1 in 16 chance of developing lung cancer by the time they are 85 years. This risk is slightly higher in men than in women (1 in 14 chance vs 1 in 20 chance, respectively).1
Although lung cancer occurs most commonly in smokers (smokers are 25 times more likely to develop lung cancer than non-smokers), it can affect people who have never smoked.5
The cost of lung cancerLifetime costs from lung cancer are some of the highest among all cancer types.3 Considering the 5-year survival rate for lung cancer is among the lowest for all cancer types1, it becomes clear that the cost burden of lung cancer can be significant, with patients possibly spending more over a shorter period of time. In addition, those who die from lung cancer lose, on average, a potential 10 years of life.6 This, combined with the high costs of treatment, can place significant burden on people with lung cancer and their loved ones, especially if the person with cancer is the primary earner for their family.
Whilst smokers are 25 times more likely to develop lung cancer than non-smokers, lung cancer is still a major cause of death among non-smokers. It is estimated that 10% of males and 35% of females diagnosed are non-smokers4.
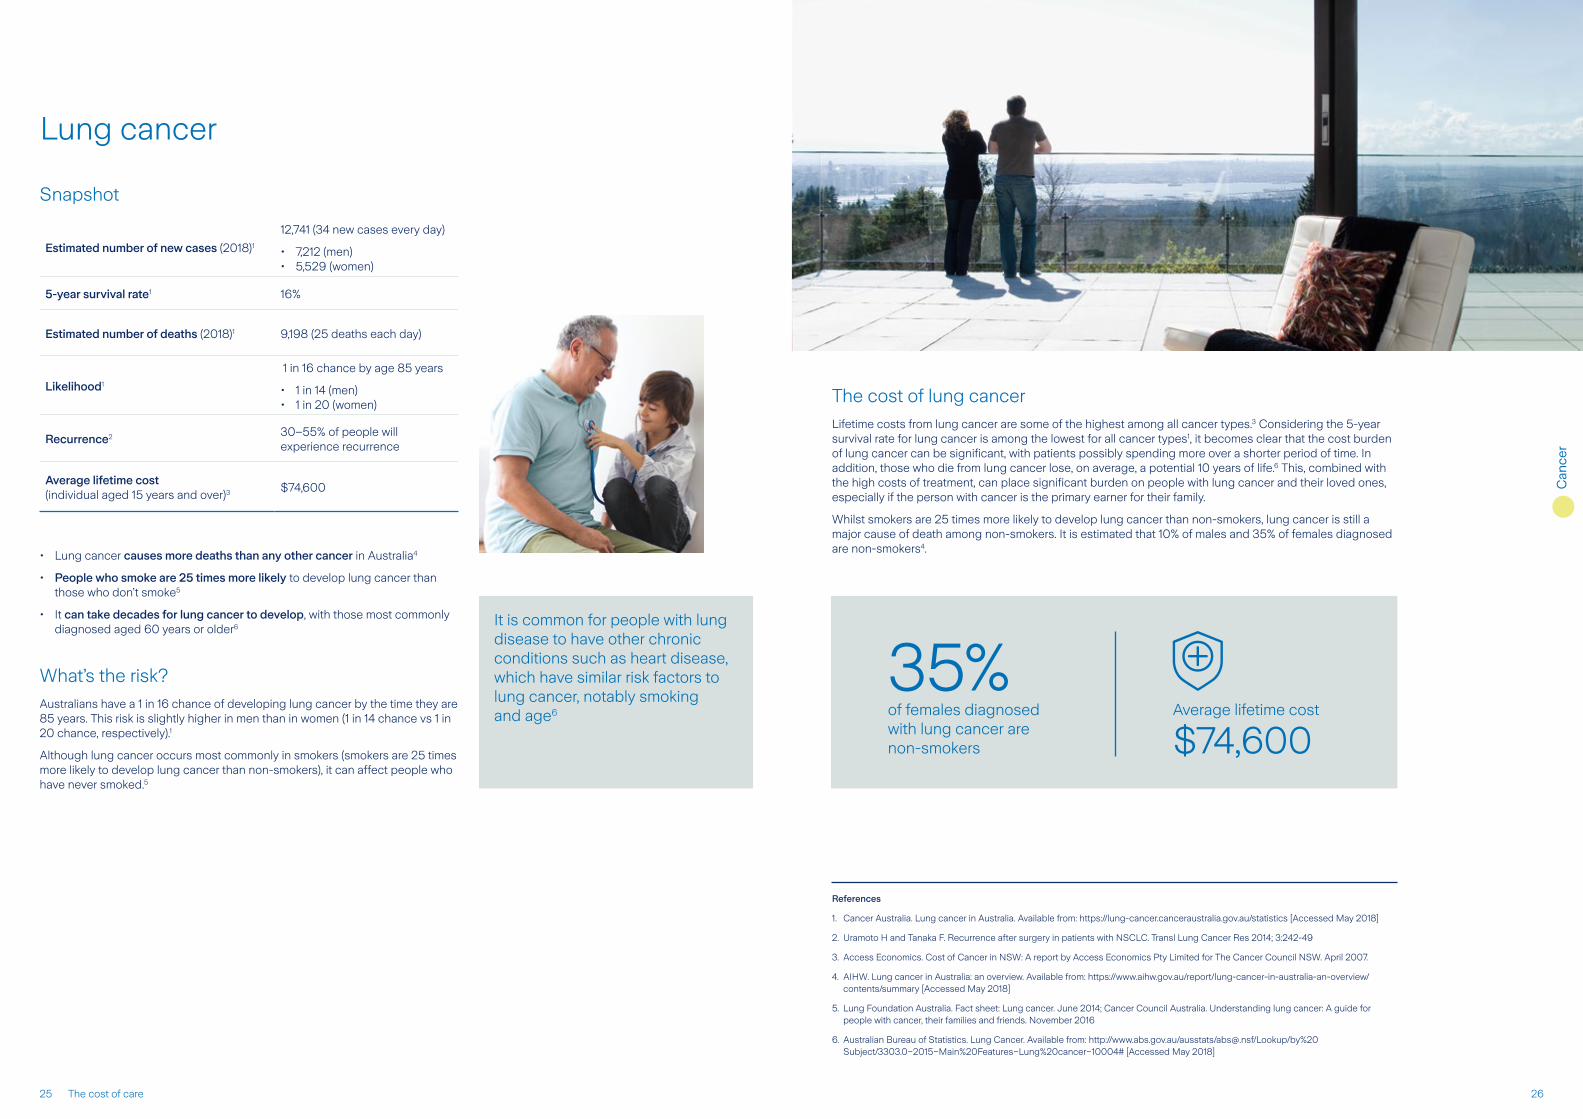
It is common for people with lung disease to have other chronic conditions such as heart disease, which have similar risk factors to lung cancer, notably smoking and age6
References
1. Cancer Australia. Lung cancer in Australia. Available from: https://lung-cancer.canceraustralia.gov.au/statistics [Accessed May 2018]
2. Uramoto H and Tanaka F. Recurrence after surgery in patients with NSCLC. Transl Lung Cancer Res 2014; 3:242-49
3. Access Economics. Cost of Cancer in NSW: A report by Access Economics Pty Limited for The Cancer Council NSW. April 2007.
4. AIHW. Lung cancer in Australia: an overview. Available from: https://www.aihw.gov.au/report/lung-cancer-in-australia-an-overview/contents/summary [Accessed May 2018]
5. Lung Foundation Australia. Fact sheet: Lung cancer. June 2014; Cancer Council Australia. Understanding lung cancer: A guide for people with cancer, their families and friends. November 2016
6. Australian Bureau of Statistics. Lung Cancer. Available from: http://www.abs.gov.au/ausstats/[email protected]/Lookup/by%20Subject/3303.0~2015~Main%20Features~Lung%20cancer~10004# [Accessed May 2018]
35%of females diagnosed with lung cancer are non-smokers $74,600
Average lifetime cost
25 The cost of care 26
Can
cer

Non-Hodgkin lymphoma
Snapshot
Estimated number of new cases (2016)1
5,200 (14 new cases every day)
• 2,930 (men)• 2,270 (women)
5-year survival rate1 72.1%
Estimated number of deaths (2016)1 1,445 (4 deaths each day)
Likelihood1 1 in 38 chance by the age of 85 years
Average lifetime cost (individual aged 15 years and over)3 $87,500
References
1. Cancer Australia. Non-Hodgkin lymphoma (C82-C85). Available from: https://canceraustralia.gov.au/affected-cancer/cancer-types/lymphoma/non-hodgkin-lymphoma-statistics [Accessed May 2018]
2. Cancer Institute NSW. Non-Hodgkins lymphoma (NHL) statistics. Available from: https://www.cancerinstitute.org.au/understanding-cancer/cancer-in-nsw/non-hodgkins-lymphoma [Accessed May 2018]
3. Access Economics. Cost of Cancer in NSW: A report by Access Economics Pty Limited for The Cancer Council NSW. April 2007.
Head, neck and thyroid cancers
Snapshot
References
1. Cancer Australia. Head and neck cancer in Australia. Available from: https://head-neck-cancer.canceraustralia.gov.au/statistics [Accessed May 2018]
2. Access Economics. Cost of Cancer in NSW: A report by Access Economics Pty Limited for The Cancer Council NSW. April 2007.
3. Head & Neck cancer guide. Recurrence. Available from: https://headandneckcancerguide.org/adults/the-cancer-journey-2/recurrence/ [Accessed May 2018]
4. Cancer Treatment Centers of America. Recurrent thyroid cancer. Available from: https://www.cancercenter.com/thyroid-cancer/stages/tab/recurrent/ [Accessed June 2018]
Head and neck cancers are cancers that occur inside the nose, sinuses, mouth, salivary glands and throat3..
Thyroid cancer develops when cells in the thyroid gland grow abnormally4.
Non-Hodgkin lymphoma is a type of blood cancer that arises as result of abnormalities in different types of white blood cells2
Head and neck cancers1–3 Thyroid cancer2,4
Estimated number of new cases (2017 – Head and neck) (2018 –Thyroid)
4,955 (13 new cases every day)
• 3,625 (men)• 1,330 (women)
3,330 (9 new cases every day)
• 894 (men)• 2,436 (women)
5-year survival rate 69% 96.1%
Estimated number of deaths (2017 – Head and neck) (2018 – Thyroid)
1,026 (2 deaths each day) 144 (2 deaths each week)
Likelihood
1 in 47 chance by age 85 years
• 1 in 32 (men) • 1 in 90 (women)
1 in 100 chance by age 85 years
• 1 in 166 (men) • 1 in 71 (women)
Recurrence20–40% of people experience recurrence
Up to 30% of people experience recurrence
Average lifetime cost (individual aged 15 years and over)2 $95,460 $95,460$87,500
Average lifetime cost
$95,460
Average lifetime cost
27 The cost of care 28
Can
cer

Kidney cancer
Snapshot
Estimated number of new cases (2018)1
3,617 (9 new cases every day)
• 2,321 (men)• 1,296 (women)
5-year survival rate1 75%
Estimated number of deaths (2018)1 1,069 (2 deaths each day)
Likelihood1
1 in 66 chance by age 85 years
• 1 in 50 (men)• 1 in 100 (women)
Recurrence2 20–40% of people will experience recurrence
Average lifetime cost (individual aged 15 years and over)3 $63,220
References
1. Cancer Australia. Kidney cancer in Australia. Available from: http://kidney-cancer.canceraustralia.gov.au/statistics [Accessed May 2018]
2. Chin A et al. Surveillance strategies for renal cell carcinoma patients following nephrectomy. Rev Urol 2006; 8:1-7
3. Access Economics. Cost of Cancer in NSW: A report by Access Economics Pty Limited for The Cancer Council NSW. April 2007.
Uterine cancer
Snapshot
Estimated number of new cases (2018)1 2,963 (8 new cases every day)
5-year survival rate1 83%
Estimated number of deaths (2018)1 466 (9 deaths each week)
Likelihood1 1 in 41 chance by age 85 years
Average lifetime cost (individual aged 15 years and over)2 $46,030
• There are two types of uterine cancer: endometrial cancer, which affects the lining of the uterus (the endometrium) and uterine sarcomas, which develop in the muscle tissue3
• Uterine cancer is the most diagnosed gynaecological cancer in Australia3
• Endometrial cancer is more common than uterine sarcomas and accounts for approximately 75% of uterine cancer cases3
References
1. Cancer Australia. Uterine cancer in Australia. Available from: https://uterine-cancer.canceraustralia.gov.au/statistics [Accessed May 2018]
2. Access Economics. Cost of Cancer in NSW: A report by Access Economics Pty Limited for The Cancer Council NSW. April 2007.
3. Cancer Council Australia. Uterine cancer. Available from: https://www.cancer.org.au/aboutcancer/types- of-cancer/uterine-cancer.html [Accessed May 2018]
$63,220
Average lifetime cost
$46,030
Average lifetime cost
29 The cost of care 30
Can
cer

Case study
When Tracy, a working mum of three, was diagnosed with breast cancer, it turned her life and the lives of her husband and children, upside down. Not only did the family have to contend with the thought of losing a loved one, they also faced financial struggles.
Tracy had countless tests and visits to her specialist and endured an intense and time-consuming course of chemotherapy and radiation treatment. Initial tests, such as a mammogram and MRI scans set her back around $650 and with each visit to her surgeon Tracy had to pay $200. Then came the bill for her radiation treatment – $2,000. The side effects of chemotherapy meant even more out-of-pocket costs; approximately $400 for headwear as a result of hair loss.
In the first year following her diagnosis, Tracy faced out-of-pocket medical costs close to $7,000.
To manage her gruelling treatment schedule, Tracy had to stop working for nearly 6 months – equating to a loss of income of almost $35,000. This had a significant impact on the family, as Tracy is the primary earner of the household.
Given that Tracy will face a number of tests and possible treatments in the future, she and her husband worry every day about how they will continue to look after Tracy’s health and support their family.
Heart and artery
Tracy* 47,
Breast Cancer
Case study
close to
$7,000
Counting the costs
-$35,000 $?
out-of-pocket medical costs
loss of income
future tests and treatments
*This case study is provided for illustrative purposes based on the data in this document
Cardiovascular disease (CVD), which covers a range of conditions affecting the heart and arteries, such as heart attack, stroke and high blood pressure, is responsible for a high number of deaths in Australia – one every 12 minutes.
Common risk factors like high cholesterol, smoking, obesity and diabetes play an important role in CVD. A 45-year-old man with two or more of these risk factors has a 1 in 2 chance of experiencing a major cardiovascular event by 80 years. For women, the risk is marginally lower at 1 in 3, but the overall trend is the same – more risk factors equal more risk.
Australian expenditure on CVD is enormous, with more spent on CVD than any other disease group. Each year, CVD is responsible for 84 million prescriptions at a cost of $3.3 billion.
Costs to the individual also stack up with an average individual out-of-pocket (OOP) spend of $2,520 in the first year following a stroke. Other CVD events, such as heart attack are associated with extensive surgical procedures and lengthy recovery periods (meaning time in hospital and time away from work). Getting to the hospital in the first place is an expense, with the ambulance fee averaging $874.
31 The cost of care 32

Cardiovascular diseases are diseases of arteries incorporating a blockage or alternatively a bursting of an artery leading to a haemorrhage. The tissue supplied by said artery hence is deprived of oxygen and dies off – in the heart, i.e. coronary arteries, this is a ‘heart attack’; in the brain, a ‘stroke’; in the lower limbs this leads to gangrene and likely amputation. Cardiovascular disease is responsible for approximately 40% of all deaths and can strike at any age although, like most diseases, the prevalence is higher with advancing age.
What I see, as a clinician, is therefore a disease that is extremely common and often comes ‘out of the blue’ for the individual. In fact, approximately 46% of women and 62% of men affected will have no warning. A stroke will often cause residual and permanent disability which can significantly impair one’s ability to earn income (as executive functioning in the brain in terms of decision making, regulating emotions and memory may be affected as well as use of limbs and thus mobility).
As we achieve significant technological advances within medicine, we are using increasingly sophisticated and expensive technology to assess arterial disease before symptoms occur such that we can intervene for example with (lifelong) medications or address physical concerns such as blockages (by stenting or bypass ) to avoid a heart attack, stroke, etc. All of this has a cost and, given that much of medicine occurs outside of a hospital setting, there are often significant costs to the patient that are not reimbursed by private health insurers (which generally only fund hospital-based interventions). This is one of the greatest misconceptions that I see – consumers do not understand that their health fund will only fund (an often small) part of a hospital-only procedure for medical interventions.
We are also becoming increasingly sophisticated in terms of treating problems after they occur – witness the use of cardiac stents or the potential for reversal of stroke with ‘clot busting’ medications delivered to the site of stroke in a specialised stroke centre. We also have research into stem cell infusions for the heart and brain that will repair damaged tissue such as heart muscle and arteries. In addition, 3D printing will be able to print and replace damaged heart structures such as valves and arteries as well as create prosthetic limbs.
The trend is that doctors will continue to take advantage of more sophisticated of technology – including better imaging, better tools and using molecular investigations, e.g. personal genome interrogation to not only investigate risk of disease but also risk of adverse reaction to medications.
Ultimately, we will continue to wear or have implanted sensors that will continuously monitor the ‘soup’ of our blood in terms of our enzymes and other constituents in a continuous fashion, thus alerting us with an early warning signaling that a heart attack or stroke is impending.
As technology increases (in an exponential fashion it seems) and radically transforms our health outcomes, the consumer increasingly will be funding his or her own healthcare. Whilst some costs will be funded by the public healthcare purse, much of it, at least initially, will need to be paid for privately by ‘early adopters’.
Diseases of the heart and arteries – commonly referred to as cardiovascular diseases or CVD – include a range of conditions such as coronary heart disease (CHD), stroke and heart failure, and affect one in six Australians.2,3
In 2014–15, CVD was the main cause of hospitalisation3 (490,000 hospitalisations in total) and there were an estimated 4.2 million Australians over the age of 18 years living with one or more cardiovascular diseases.2 In 2016, there were 43,963 deaths from CVD – an average of 120 deaths every day.3
Although hospitalisation rates and deaths are on the decline, CVD is still a major health issue.2 The burden of CVD is high, second only to cancer, and accounts for 15% of the total burden of disease in Australia.3
Most common conditions of the heart and arteries
Condition/event Prevalence
Coronary heart disease5
• Heart attack• Angina
645,000
• 472,000*†• 282,000†
Stroke5 377,000*
Hypertension (high blood pressure)6 6 million
*Number who have had this event at some time in their lives; †A person may report more than one disease
RiskThe likelihood of experiencing a cardiovascular event and the likelihood of death from CVD are very closely linked to specific risk factors such as:3
• Hypertension (high blood pressure)
• Smoking
• High cholesterol
• Diabetes
• Obesity
• Physical inactivity
For example, a 45-year-old male with two or more of these risk factors has a 1 in 2 chance of experiencing a major cardiovascular event by age 80 years. In contrast, a 45-year-old male with no risk factors only has a 1 in 71 chance of experiencing a major cardiovascular event by age 80 years.3
For women, the risk is slightly different (1 in 3 chance with two or more risk factors vs 1 in 24 chance with no risk factors) but the overall trend is the same – more risk factors equal more risk.3
of all Australians aged 55–64 years report living with heart, stroke or vascular disease1
8.8%
Expert's viewDr John CumminsMBBS,MPH(USA),FRACP
Cardiovascular diseases kills one Australian every 12 minutes4
1 in 6 Australians is affected by cardiovascular disease2
33 The cost of care 34
Hea
rt a
nd
art
ery

12%Australia spends more on CVD
than any other disease group,
amounting to over
References
1. Nichols M et al. Australian heart disease statistics 2015. Melbourne: National Heart Foundation of Australia, 2016.
2. Australian Institute of Health and Welfare. Heart, stroke & vascular diseases. Available from: www.aihw.gov.au/reports-statistics/health-conditions-disability-deaths/heart-strokevascular-diseases/overview [Accessed May 2018].
3. Heart Foundation. Cardiovascular disease fact sheet. Available from: https://www.heartfoundation.org.au/about-us/what-we-do/heart-disease-in-australia/cardiovascular-disease-fact-sheet [Accessed May 2018].
4. Heart Foundation. Heart disease in Australia. Available from: https://www.heartfoundation.org.au/about-us/what-we-do/heart-disease-in-australia [Accessed July 2018].
5. Australian Institute of Health and Welfare. Cardiovascular health compendium. Available from: www.aihw.gov.au/reports/heart-stroke-vascular-disease/cardiovascular-health-compendium/contents/how-many-australians-have-cardiovascular-disease [Accessed May 2018].
6. Heart Foundation. High blood pressure statistics. Available from: www.heartfoundation.org.au/about-us/what-we-do/heart-disease-in-australia/high-blood-pressure-statistics [Accessed May 2018].
7. Guidelines for preventive activities in general practice. Australian cardiovascular disease risk charts. Available from: https://www.racgp.org.au/your-practice/guidelines/redbook/ [Accessed May 2018].
8. Heart Foundation. Australian Heart and Stroke Charter. Available from: https://www.heartfoundation.org.au/images/uploads/main/Get_Involved/Australian_Heart_Stroke_Charter.pdf [Accessed May 2018]
9. PDHPE.net. Costs to the individual and community. Available from: www.pdhpe.net/health-priorities-in-australia/how-are-priority-issues-for-australias-health-identified/identifying-priority-health-issues/costs-to-the-individual-and-community/ [Accessed May 2018].
10. Australian Institute of Health and Welfare. Rising health costs - The current environment - Review of Cardiovascular Disease Programs. Available from: www.health.gov.au/internet/publications/publishing.nsf/Content/cardio-pubs-review~cardio-pubs-review-05-currentenv~cardio-pubs-review-05-currentenv-3-rhc [Accessed May 2018].
Cost of CVD in AustraliaCVD has the largest health system expenditure of any disease group, with $5 billion spent on healthcare for people with CVD in 2012–13.3 Australia spends more on CVD than any other disease group, amounting to over 12% of all healthcare expenditure.3 CVD is responsible for 84 million prescriptions per year at a cost of $3.3 billion.8
The indirect costs of CVD are also hefty. Treating CVD often involves large surgical procedures, lengthy recovery periods, loss of independence and loss of income. In addition, many people who experience a cardiovascular event, such as heart attack or stroke, will take time off work, resulting in losses to their employer as well.9
CVD expenditure in Australia8
Hospital patients
Prescription medicines
Out of hospital services
Coronary heart disease (CHD)
Snapshot
Estimated number of people with CHD (2014–15)1
• Heart attack• Angina
645,000
• 472,000*† • 282,000†
Estimated number of deaths from CHD (2013)2
• 19,765 (52 deaths each day)
Likelihood3• 1 in 2 chance from age 40 years (men)
• 1 in 3 chance from age 40 years (women)
Average cost of an angiogram3
$13,247 per year
*Number who have had this event at some time in their lives; †A person may report more than one disease
• Coronary heart disease (CHD) is a result of narrowing arteries and reduced blood flow to the heart; this usually starts as angina (pain and discomfort in the heart) and can lead to a heart attack over time5
• Heart disease is the leading cause of death in Australia; in 2016, heart disease was responsible for one death every 30 minutes6
What’s the risk?
The facts7 • The risk of heart disease increases with age
• Men are at higher risk of heart disease than women
• Smokers are almost twice as likely to have a heart attack compared with those who have never smoked
• Being inactive increases the chance of heart disease
• Carrying excess body fat is a risk factor for heart disease
• People with diabetes have a higher likelihood of having heart disease
• Having high blood pressure increases the risk of having a heart attack
• Lower LDL cholesterol levels can decrease the risk of having a heart attack
19%
28%
53%
of all healthcare expenditure.3
In 2016, there were 52 deaths every day from heart disease6
Looking to the futureEven though rates of CVD are decreasing, expenditure is likely to increase in the future due to the ageing population and population growth.10 Spending on CVD is estimated to increase by $8.3 billion by the year 2033.10
$13,247
Average lifetime cost
35 The cost of care 36
Hea
rt a
nd
art
ery

Common procedures following a heart attack
The cost of CHDThe majority of specialists charge in excess of the Medicare Schedule Benefit Fee, increasing the out-of-pocket burden for individuals.
Medicare Scheduled Fee 9
Medicare Benefit (75%)
Electrocardiogram (ECG) $167.45 $125.59
Computed tomography (CT) $295.00 $221.25
Echocardiogram (heart ultrasound) $230.65 $172.99
Coronary artery bypass $2,047.60 $1,535.70
Coronary angioplasty with or without stent $609.90 $457.43
Valve replacement $2,003.35 $1,502.51
Open heart surgery $1,909.60 $1,432.20
Cardiologist fees12 $73 (per visit)
References
1. Australian Institute of Health and Welfare. Cardiovascular health compendium. Available from: https://www.aihw.gov.au/reports/heart-stroke-vascular-disease/cardiovascular-health-compendium/contents/how-many-australians-have-cardiovascular-disease [Accessed May 2018]
2. Nichols M et al. Australian heart disease statistics 2015. Melbourne: National Heart Foundation of Australia, 2016.
3. Heart Foundation. Heart disease fact sheet lifetime risk. Available from: www.heartfoundation.org.au/about-us/what-we-do/heart-disease-in-australia/heart-disease-fact-sheet [Accessed May 2018].
4. Callander EJ, et al. Out-of-pocket healthcare expenditure and chronic disease -- do Australians forgo care because of the cost? Australian Journal of Primary Health. 2016;23(1):15 -22.
5. Heart Foundation. What is coronary heart disease? Available from: www.heartfoundation.org.au/your-heart/heart-conditions/what-is-coronary-heart-disease [Accessed May 2018].
6. Heart Foundation. Heart disease in Australia. Available from: https://www.heartfoundation.org.au/about-us/what-we-do/heart-disease-in-australia [Accessed July 2018]
7. Heart Research Australia. Risk factors. Available from: www.heartresearch.com.au/heart-disease/risk-factors/ [Accessed May 2018].
8. NIB. How much does it cost for an emergency ambulance ride? Available from: www.nib.com.au/the-checkup/health-cover/how-much-does-it-cost-for-an-emergency-ambulance-ride [Accessed May 2018].
9. Medicare Benefits Schedule. Schedule of fees. Available from: http://www.mbsonline.gov.au/internet/mbsonline/publishing.nsf/Content/Downloads-201807 [Accessed May 2018].
10. Medscans.com.au. CT scans - FAQ. Available from: www.medscans.com.au/info/ct-info.html [Accessed May 2018].
11. University of Tasmania. Exercise physiology clinic cardiac rehabilitation. Available from: www.utas.edu.au/exercise-physiology-clinic/cardiac-rehabilitation [Accessed May 2018].
12. Sydney Morning Herald. Seeing a specialist. How variations in fees are hidden from patients. Available from: www.smh.com.au/healthcare/seeing-a-specialist-how-variations-in-fees-are-hidden-from-patients-20170305-gur2kh.html [Accessed May 2018].
Heart attack90% of Australians have at least one risk factor for heart disease7
37 The cost of care 38

Each year, approximately 54,000 Australians suffer a heart attack – around 148 people each day or one heart attack every 10 minutes.1
In 2016, an average of 22 Australians died from a heart attack each day – this is the equivalent of one death from a heart attack every 66 minutes.1
How much does a heart attack cost?• The average cost of coronary angiography with stent insertion, including
hospital stay, is $21,790, of which Medicare pays approximately $1,960*3
• In 2017, there were 61 operations each day (22,383 operations for the year) for insertion of a stent or stents in Australia, for which Medicare paid an estimated $8.22 million3
• Over 128,000 cardiac angiograms are performed in Australia every year. The cost of an angiogram is approx $13,2474
*These costs are not necessarily indicative of patient out-of-pocket costs
An estimated 400,000 Australians have had a heart attack at some point in their lives1
References
1. Heart Foundation. Heart disease in Australia. Available from: https://www.heartfoundation.org.au/about-us/what-we-do/heart-disease-in-australia [Accessed July 2018].
2. Heart Foundation. Australian Heart and Stroke Charter. Available from: www.heartfoundation.org.au/images/uploads/main/Get_Involved/Australian_Heart_Stroke_Charter.pdf [Accessed May 2018].
3. MJA Insight. Unnecessary stents costing millions. Issue 24 / 13 December 2010. Available from: https://www.doctorportal.com.au/mjainsight/2010/24/unnecessary-stents-costing-millions/ [Accessed July 2018].
4. HCF. Coronary angioplasty and stents. Available from: https://www.hcf.com.au/preparing-for-hospital/coronary-angioplasty-stents [Accessed July 2018].
5. UCSF Cardiac Surgery Department of Surgery. Coronary Artery Bypass Grafting (CABG). Available from: https://cardiacsurgery.ucsf.edu/conditions--procedures/coronary-artery-bypass-grafting-(cabg).aspx [Accessed July 2018].
6. Medicare Benefits Schedule. Schedule of fees. Available from mbsonline.gov.au [Accessed July 2018].
7. NIB. How much does it cost for an emergency ambulance ride? Available from: www.nib.com.au/the-checkup/health-cover/how-much-does-it-cost-for-an-emergency-ambulance-ride [Accessed May 2018].
On average, an individual can pay $874 out of their own pocket for the use of an ambulance7
On average, each heart attack costs
$25,000 in total costs*2 A word on ambulance costs
Many Australians are either surprised by ambulance service costs or avoid taking an ambulance to hospital due to high costs.
In a survey of over 11,000 Australians, 43% of respondents said it would be too expensive to call an ambulance, even if they thought they were having a heart attack. Furthermore, around 20% of patients who had warning signs of a heart attack and went to hospital decided not to use an ambulance, citing cost as the determining factor in seeking another mode of transportation.2
Heart attack
39 The cost of care 40
Hea
rt a
ttac
k

In 2014, there were an estimated
96
Stroke-related disabilityThe cost of stroke can also arise in the years following the event, usually in the form of disability and restriction of daily living. In 2009, it was estimated that over a third of people with stroke had a resulting disability.8
People with stroke-related disability were more likely to need assistance in their household than other people with disability, specifically for:
• Mobility
• Self-care
• Healthcare
• Property maintenance
• Private transportation
Furthermore, a national survey found that 81% of stroke survivors reported significant levels of unmet need in the community after discharge from hospital.6
Stroke
Snapshot
Estimated number of stroke events (2014)1 35,200 (96 events every day)
Estimated number of deaths from stroke (2015)2
10,869 (29 deaths each day)
Likelihood3
• 1 in 6 chance from age 55 to 75 years (men)
• 1 in 5 chance from age 55 to 75 years (women)
Lifetime cost4 Up to $32,411 (lifetime cost)
• A stroke happens when the blood supply to the brain is disrupted; this can happen because of blockages or bursts in the arteries5
What’s the risk?The likelihood that a person will have a stroke is influenced by a number of risk factors. The more risk factors a person has, the higher the risk:2,5
• High blood pressure – this is the most important risk factor for stroke5
• High cholesterol – 6.1 million Australians have high cholesterol5
• Irregular pulse – there are approximately 434,000 Australians with an irregular heartbeat5
• Smoking and alcohol
• Diabetes
• Obesity
strokes per day1
Generally treatment for Stroke is divided into three distinct stages:9
Time required
Stage 1Hospitalisation - in an Actue Hospital or Stroke Unit
10 -14 Days
Stage 2Rehabilitation - is ongoing treatment in a ward or hospital
14 days - 6 months
Stage 3Discharge - stay in a Rehabilitaion Centre may be required
Dependant on severity and personal progress
Once cleared to return home, often the person affected by Stroke will require a carer on 24 hour duty until the reality of coping has sunk in. Care can often be shared amongst multiple family members.
$32,411
Lifetime cost up to
The more risk factors a person has, the more likely they are to have a stroke5
41 The cost of care 42
Hea
rt a
ttac
k

Respiratory
It is estimated that there are 2.5 million Australians living with asthma and over the course of their life, an individual with asthma will spend an average of $14,230 on treatment. Perhaps it’s unsurprising asthma therapeutics market is expected to reach $6 billion by 2023.
Another serious and costly respiratory illness is COPD, or chronic obstructive pulmonary disease. COPD is a condition that limits airflow to the lungs and is not fully reversible with the use of medication. In 2015, there were an estimated 1.45 million Australians with COPD. Of Australians with lung disease, COPD contributes to almost one-third of all deaths and costs patient an average of $9,020 in out-of-pocket (OOP) costs per year.
References
1. Australian Institute of Health and Welfare. Cardiovascular health compendium. Available from: www.aihw.gov.au/reports/heart-stroke-vascular-disease/cardiovascular-health-compendium/contents/how-many-australians-have-cardiovascular-disease [Accessed May 2018].
2. Australian Bureau of Statistics 2016. 3303.0 Causes of death - Australia, 2016. September 2017.
3. Seshadri S et al. The lifetime risk of stroke: Estimates from the Framingham Study. Stroke 2006;37:345 -50.
4. Callander EJ, et al. Out-of-pocket healthcare expenditure and chronic disease - do Australians forgo care because of the cost? Australian Journal of Primary Health. 2016;23(1):15 -22.
5. Stroke Foundation. What is a stroke. Available from: https://strokefoundation.org.au/ [Accessed May 2018].
6. Heart Foundation. Australian Heart and Stroke Charter. Available from: www.heartfoundation.org.au/images/uploads/main/Get_Involved/Australian_Heart_Stroke_Charter.pdf [Accessed May 2018].
7. Dewey HM et al. `Out of pocket’ cost to stroke patients during the first year after stroke - results from the North East Melbourne Stroke Incidence Study. Journal Clinical Neuroscience. 2004;11(2):134 -7.
8. Australian Institute of Health and Welfare (2013). Stroke and its management in Australia: an update. Cardiovascular disease series no. 37. Cat. no. CVD 61. Canberra: AIHW.
9. It's a stroke. What happens Now? http://www.strokensw.org.au/wp-content/uploads/2015/04/What-to-Expect.pdf [Accessed May 2018].
The facts: Impact on carers8 • 58% of primary carers of people with stroke
and disability spend 40 hours or more per week in their caring role
• 21% report a decrease in income due to their caring role
• 24% incur extra expenses due to their caring role
• 31% have difficulty meeting everyday living costs
43 The cost of care 44

Lung disease contributes more than 10% to the overall health burden of Australia.1 People with asthma, emphysema or COPD spend an average of $1,642 each year on their out-of-pocket (OOP) healthcare.2
Expenditure for respiratory diseases is projected to increase by 264% between 2003 and 2033 ($14.8 billion).3
Prevalence of respiratory conditions in AustraliaIn 2014–15, chronic respiratory conditions were thought to affect 7.1 million Australians. Based on self-reported data, the most common respiratory conditions were:5,6
Cost of respiratory conditions in AustraliaAlthough healthcare in Australia is largely publicly funded, there are still significant OOP costs associated with diagnosis and treatment including:7,8
• GP and specialist gap payments
• Medicines, pharmaceuticals and therapeutic products
• Diagnostic tests outside of public system
• Medical devices and equipment purchase/hire
• Procedures and surgery
• Management of complications and comorbidities
• Travel and accommodation
The facts• On average, a person with any respiratory
disease will carry 18% of their treatment cost7
• Adults with asthma, emphysema and COPD have 109% higher OOP healthcare costs than those without a health condition2
• In 2015, on average the initial consultation fee for a respiratory physician cost $211, placing patients an average of $82.70 OOP9
References
1. Woolcock Institute of Medical Research. Lung disease in Australia. October 2014.
2. Callander EJ, et al. Out-of-pocket healthcare expenditure and chronic disease — do Australians forgo care because of the cost? Australian Journal of Primary Health. 2016;23(1):p.15–22.
3. Australian Institute of Health and Welfare (2008). Projection of Australian health care expenditure by disease, 2003 to 2033. Cat. No. HWE 43. Canberra: AIHW.
4. Australian Institute of Health and Welfare (2017). The burden of chronic respiratory conditions in Australia: a detailed analysis of the Australian Burden of Disease Study 2011. Australian Burden of Disease Study series no. 14. BOD 15. Canberra: AIHW
5. Australian Government, Department of Health. Chronic respiratory conditions – including asthma and chronic obstructive pulmonary disease (COPD). Available from: www.health.gov.au/internet/main/publishing.nsf/content/chronic-respiratory [Accessed May 2018].
6. Australian Bureau of Statistics 2015. 4364.0.55.001 – National Health Survey: First Results, 2014–15. December 2015.
7. Deloitte. Access Economics. The hidden cost of asthma: Asthma Australia and National Asthma Council Australia. November 2015.
8. Yusuf F and Leeder SR. Can’t escape it: the out-of-pocket cost of health care in Australia. The Medical Journal of Australia. 2013;199(7):475–8.
9. Freed GL and Allen AR. Variation in outpatient consultant physician fees in Australia by specialty and state and territory. The Medical Journal of Australia. 2017;206(4):176–80.
Respiratory
Chronic respiratory conditions… affect more than a quarter of the general population of Australia”5
Estimated prevalence
Most prevalent respiratory conditions in Australia
Allergic rhinitis (hay fever)
Asthma
Chronic sinusitis
Chronic obstructive pulmonary disease
0 1,000,000 2,000,000 3,000,000 4,000,000 5,000,000
Respiratory conditions affect the lungs, the airways and other associated tissues. These conditions cause ill health, disability and death4
Adults with asthma, emphysema and COPD are six times more likely to skip healthcare than people without a health condition2
45 The cost of care 46
Res
pira
tory

Chronic obstructive pulmonary disease
Snapshot
Estimated number of people with COPD (2015)1 1.45 million
5-year survival rate2 40–70%, depending on severity
Estimated number of deaths (2015)1
7,100 (19 deaths each day)
• 3,800 (men) • 3,300 (women)
Likelihood3 1 in 13 aged 40 years and over
Average cost per year4 $9,020
Average number of days off work4 14.4 days per year
• Chronic obstructive pulmonary disease, or COPD, is a condition that limits airflow to the lungs and is not fully reversible with the use of medication1
• Among Australians with lung disease, COPD contributes to one-third of the overall health burden and to almost one-third of all deaths5
What’s the risk?• Tobacco use and exposure is the single main cause of COPD (74.6%),
followed by occupational exposures (2.9%) and air pollution (0.3%)1,6
• Mainly middle aged and older people are affected by COPD
• The number of people with COPD increases with age, increasing from 1 in 13 in those 40 years to almost 1 in 3 in those aged 75 years and over1,5
• Women may be at greater risk than men of COPD from exposures at work and are more susceptible to COPD due to smaller lungs and airways and more sensitive airways7
The cost of COPD• A person with COPD will carry 45.6% of the financial costs, and an additional
1.6% is carried by their families and friends4
• 78% of people living with advanced COPD experienced economic hardship from managing their illness and 27% were unable to pay their medical expenses8
Asthma
Snapshot
Estimated number of people with asthma (2015)10 2.5 million
5-year survival rate Not reported
Number of deaths (2016)11 417 (8 deaths each week)
Likelihood12 1 in 9
Average lifetime cost13 $14,230
Average number of days off work13 10.4 days per year
• Asthma represents the leading cause of disability14
• Between 2011 and 2015, the rate of asthma mortality remained constant at 1.5 deaths per 100,000 people15
What’s the risk?Asthma affects people of all ages, but the occurence:12
• is more common in women aged over 15 years of age
• increases with decreasing socioeconomic status
• increases with the outer regional and remote areas of Australia (compared with major cities).
Looking to the futureAs the Australian population ages, the prevalence of COPD (Stage II to IV) is projected to double by 2050 (1.2 million in 2008 to 2.6 million in 2050).4 In the next 20 years, mortality will:9
• Decline at a rate ranging between 37.1% (50–54 years) and 47.8% (75–79 years) in men
• Decline slower in women
$9,020
Average cost per year
Tobacco use attributes to three-quarters of the COPD burden6
COPD deaths will continue to decline but this decline will be later for women than for men9
$14,230
Average lifetime cost
47 The cost of care 48
Res
pira
tory

The cost of asthma• Adults with asthma spend more than double
on household out-of-pocket (OOP) healthcare than those with no health condition16
• A person with asthma and their families carry 18% of the financial costs associated with the disease13
• Medication is the largest component of individual costs17
• 32% of people with asthma skip their treatment with OOP cost being a major contributing factor18,19
References
1. Australian Institute of Health and Welfare. COPD (chronic obstructive pulmonary disease). Available from: https://www.aihw.gov.au/reports/asthma-other-chronic-respiratoryconditions/copd-chronic-obstructive-pulmonary-disease/contents/what-is-copd [Accessed May 2018].
2. Nishimura K and Tsukino M. Clinical course and prognosis of patients with chronic obstructive pulmonary disease. Current opinion in pulmonary medicine. 2000;6(2):127–32.
3. Toelle BG et al. Respiratory symptoms and illness in older Australians: the Burden of Obstructive Lung Disease (BOLD) study. Medical Journal of Australia. 2013;198:144–8.
4. Lung Foundation Australia (2008). Economic Impact of COPD and cost effective solutions.
5. Woolcock Institute of Medical Research. Lung disease in Australia. October 2014.
6. Australian Institute of Health and Welfare 2017. The burden of chronic respiratory conditions in Australia: a detailed analysis of the Australian Burden of Disease Study 2011. Australian Burden of Disease Study series no. 14. BOD 15. Canberra: AIHW.
7. Petty T. The Rising Epidemic of COPD in Women: Why women are more susceptible; how treatment should differ. Women’s Health in Primary Care. 1999;2(12).
8. Essue B et al. We can’t afford my chronic illness! The out-of-pocket burden associated with managing chronic obstructive pulmonary disease in western Sydney, Australia. Journal of Health Services Research and Policy. 2011;16(4):226–31.
9. Erbas B et al. Forecasts of COPD mortality in Australia: 2006–2025. BMC Medical Research Methodoogy. 2012;12:17. Australian Bureau of Statistics 2015. 4364.0.55.001 – National Health Survey: First Results, 2014–15. December 2015.
10. Australian Bureau of Statistics 2016. 3303.0 Causes of death – Australia, 2016. September 2017.
11. Australian Institute of Health and Welfare. Asthma. Available from: www.aihw.gov.au/reports/chronic-respiratory-conditions/asthma/contents/asthma[Accessed May 2018].
12. Deloitte. Access Economics. The hidden cost of asthma: Asthma Australia and National Asthma Council Australia. November 2015.
13. Woolcock Institute of Medical Research. Lung disease in Australia. October 2014.
14. Australian Institute of Health and Welfare. Asthma deaths. Available from: www.aihw.gov.au/reports/chronic-respiratory-conditions/asthma/contents/deaths [Accessed May 2018].
15. Callander EJ, et al. Out-of-pocket healthcare expenditure and chronic disease — do Australians forgo care because of the cost? Australian Journal of Primary Health. 2016;23(1):15–22.
16. Kenny P, et al. The individual and health sector costs of asthma: the first year of a longitudinal study in New South Wales. Australian and New Zealand Journal of Public Health. 2005;29(5):429–35.
17. Spooner R. Medical costs forcing Australians to skip healthcare. Available from: www.smh.com.au/healthcare/medical-costs-forcing-australians-to-skip-healthcare-20160804-gql7pd.html [Accessed May 2018].
18. Ampon RD, et al. Cost is a major barrier to the use of inhaled corticosteroids for obstructive lung disease. Medical Journal of Australia. 2009;191:319–23.
19. GBI Research. Asia-Pacific asthma market will hit $6 billion by 2023 as manufacturers look to address unmet needs says GBI Research. Available from: www.pharmpro.com/news/2017/06/2023-forecast-asia-pacific-asthma-market-hit-6b-manufacturers-address-unmet-needs [Accessed May 2018].
Gastrointestinal
Australia has one of the highest rates of inflammatory bowel disease (IBD) in the world, with an estimated 80,000 individuals living with the condition.
The most common inflammatory bowel diseases are Crohn’s Disease (CD) and Ulcerative Colitis (UC) – both are chronic gastrointestinal disorders that cause the intestines to become inflamed.
In most cases, IBD starts before the age of 35 years. People with a family history have a much higher risk than those in the general population; around 25% of people with IBD have a first-degree relative with the disease.
On average, individuals with IBD spend $750 per year in out-of-pocket (OOP) costs to treat their condition.
There are also significant indirect costs associated with IBD, with many sufferers reporting long-term absence from work (43% report taking time off work due to their condition), a reduction in hours and premature retirement.
Looking to the futureWith new therapies for asthma in the pipeline, the asthma therapeutics market is expected to grow from $4.1 billion (2016) to $6 billion by 2023.11
77% of asthma-related deaths occurred in people aged over 75 years13
49 The cost of care 50

Snapshot
Estimated number of cases (2017–18)1 80,000
Likelihood2,3
Crohn’s disease 1 in 10,000 chance from age 20–79 years
Ulcerative colitis 1 in 1,429 chance from age 20–79 years
Individuals with a family history of IBD 5–10% chance during their lifetime
Average cost4 Approximately $750 per year
% of people who take time off work4 43%
Average number of days off work4 7.2 days per year
Average recovery time from bowel resection surgery*5
6–8 weeks
Risk of recurrence following bowel resection surgery5
Approximately 50% of patients will experience recurrence within 5 years
Bowel resection surgery is one of the most common types of surgeries for people with Crohn’s disease and involves the removal of a section of the patient’s small or large intestine
Most common inflammatory bowel diseases1
Crohn’s disease Ulcerative colitis
Can occur in any part of the intestines Affects the large intestine only
• Collectively known as inflammatory bowel disease (IBD), Crohn’s disease (CD) and ulcerative colitis (UC) are chronic gastrointestinal disorders that cause the intestines to become inflamed1
• Australia has one of the highest rates of IBD in the world6
• While the exact cause of IBD is unknown, individuals with a family history of the disease are more likely to develop it7
What’s the risk?Despite the incredibly low risk of an individual in the general population being diagnosed with IBD in their lifetime, the risk is still significant for those with a family history of the disease.3
Positive family history is the single greatest risk factor for IBD – around 25% of people with IBD have a first-degree relative with the disease.3
For the 80,000 people living with IBD, the likelihood that they will develop a secondary condition, such as bowel cancer, is higher than for those without IBD. In fact, as many as 1 in 6 people with IBD may develop bowel cancer by the time they have had IBD for 30 years.8
The cost of IBDPeople with IBD spend an average of $750 per year to manage their condition. Expenses mainly consist of:4
• Aids and modifications: incontinence pads, over the counter medications, dietary supplements
• Formal care: housekeeping, childcare and gardening services
• Travel and accommodation: to medical appointments mostly
The indirect cost associated with IBD is high, with many sufferers reporting long-term absence from work, a reduction in hours and premature retirement. In an analysis of employed people with IBD, 43% had taken time off work due to illness and on average took 7.2 days off per year because of their symptoms.4
IBD is largely unpredictable with a large variation in the degree and pattern of symptoms. This combined with the relapsing and chronic nature of IBD means the disease also has a significant impact on a person’s physical, emotional and social wellbeing.1
The facts• As of 2018, more than 80,000 Australians are living with IBD. By 2022,
this number is expected to increase to more than 100,000 people1
• An increasing number of young people are being diagnosed with Crohn’s Disease and Ulcerative Colitis, and the severity and complexity of these diseases is also increasing1
• In most cases, IBD starts before the age of 35 years7
Inflammatory bowel disease
References
1. Crohn’s & Colitis Australia. About Crohn’s & Colitis. Available from: www.crohnsandcolitis.com.au/about-crohns-colitis/ [Accessed May 2018].
2. Chuang CH, et al. Increasing incidence and lifetime risk of inflammatory bowel disease in Taiwan: a nationwide study in a low-endemic area 1998–2010. Inflammatory Bowel Diseases 2013;19:2815–9.
3. Cleveland Clinic. Inflammatory Bowel Disease (IBD): Q & A. Available from: https://my.clevelandclinic.org/departments/digestive/depts/inflammatory-bowel -disorders [Accessed May 2018].
4. Deloitte. Access Economics. The economic costs of Crohn’s disease and ulcerative colitis. June 2007.
5. InflammatoryBowelDisease.net. Bowel Resection Surgery. Available from: https://inflammatoryboweldisease.net/treatment/surgery-overview/bowel-resection-surgery/ [Accessed May 2018].
6. Crohn’s & Colitis Australia. Fast facts about Crohn’s disease and colitis. June 2014.
7. Healthline. Inflammatory Bowel Disease (IBD). Available from: www.healthline.com/health/inflammatory-bowel-disease [Accessed May 2018].
8. Crohn’s & Colitis Foundation of America. The facts about inflammatory bowel diseases. Available from: http://www.crohnscolitisfoundation.org/assets/pdfs/updatedibdfactbook.pdf [Accessed May 2018].
9. Everyday Health. A new study finds inflammatory bowel disease increases the likelihood of heart attack. Available from: www.everydayhealth.com/crohns-disease/symptoms/new-study-finds- inflammatory-bowel-disease-increases-likelihood-heart-attack/ [Accessed May 2018].
Siblings and children of people with IBD have a
5 to 10% risk of developing IBD in their lifetime3
People with IBD report taking an average of 7.2 days off per year due to IBD-related illness3
Looking to the futureRecent research suggests that having IBD may raise the risk of heart attack, even in the absence of traditional cardiovascular risk factors such as high blood pressure or high cholesterol. Surprisingly, younger patients (less than 40 years of age) are at higher risk compared to older patients.9
During a ‘flare’, inflammation can become so severe that sufferers may require hospitalisation and even surgery1
51 The cost of care 52
Gas
tro
inte
stin
al

Case study
"I had my gallbladder out last August and I was unaware that it could take time to recover, and that I would need to take more time off than 10 days post surgery. I had to take numerous days off work after returning to work due to pain and my gastrointestinal tract getting back to normal. I did not expect this extra time off work and by this stage I had exhausted my sick leave which made finances tight during this time.
I then had to have the Fundoplication during the Christmas/ New Year break as I didn’t have any sick leave left. I had a slow recovery after this procedure and needed more time off when I returned to work. Apparently some people have ongoing issues for 6 months after this procedure, and because I had both procedures close to each other, it affected
the vagus nerve which causes the problems. I was in touch with my doctor each week until things improved. I had to have extra doctor and surgeon visits with the extra costs involved with the visits.
I had to take all different medication which I had not planned on taking and this all added up. Finances were also tight after the Fundoplication. I was unaware these complications could happen and that I would need extra time off work. If I had been told up front that there could be a slower recovery, I would have been able to plan much better for the extra expenses."
*Illustrative name and image, based on a real case.
Brain and nervous system
Conditions of the brain and nervous system include dementia, epilepsy, Parkinson’s disease, multiple sclerosis (MS) and spinal cord injury (SCI). There are approximately 802,416 Australians living with these conditions – more than half (425,416) are living with dementia and one-third (250,000) with epilepsy.
The likelihood of acquiring a condition of the brain or nervous system varies. The chance that an individual will develop MS during their lifetime is 0.3%, while the risk of developing dementia can be as high as 17% over the same period.
Due to the nature of brain and nervous system disorders, expenses commonly go towards formal care, mobility aids and assistance devices, pharmaceuticals and accommodation and travel. Indirect costs are also incurred, resulting from the inability to work full time or at all in some cases.
Condition Cost
Dementia$47,811 in the first year
$14,842 each year thereafter
Epilepsy $3,510 per treatment cost
Parkinson’s disease
$169,060 over 12 years
Multiple sclerosis $1,450 per month
Spinal cord injury
Up to $106,850 per year (healthcare)
Up to $14,760 per year (equipment and modifications
Up to $6,130 per year (long-term care)
Richard*,
Gallbladder Surgery
Case study
53 The cost of care 54

The central nervous system (CNS) comprises the brain and spinal cord and is responsible for coordinating the body’s activities.1
Conditions of the brain and nervous system include degenerative diseases, such as Alzheimer’s and Parkinson’s disease and multiple sclerosis (MS) as well as spinal cord injuries (SCI) and seizure disorders (epilepsy).2
Most common conditions of the brain and nervous system
Condition Prevalence
Dementia3 425,416
Epilepsy4 250,000
Parkinson’s disease5 82,000
MS6 25,000
Spinal cord injury7 20,000
Stroke is also considered a condition of the brain and nervous system. Information about stroke is included in the Heart and artery section of this document
Risk• The likelihood of acquiring a condition of the brain or nervous system varies,
with the risk for some conditions being relatively low and others much higher.
• The chance that an individual will develop MS during their lifetime is 0.3%8
• The risk of developing dementia can be as high as 17% over ones lifetime9
An individual with dementia can expect to pay $47,811 in the first year and $14,842 each year thereafter over their lifetime, while a person with Parkinson’s disease may end up paying $169,060 over a period of 12 years10,11
The burden on carers and family members is high – for example, 46% of people with dementia receive informal (unpaid) assistance from a family member or close friend10
Cost of brain and nervous system conditions in AustraliaAs with risk, the cost of brain and nervous system conditions are dependent on the specific condition. In general, however, the costs incurred by people with conditions of the brain and nervous system are high and comparable to the costs of cancer.
Due to the nature of brain and nervous system disorders, expenses commonly go towards formal care, mobility aids and assistance devices, pharmaceuticals and accommodation and travel. Indirect costs are also incurred, resulting from the inability to work full time or at all in some cases.
What about carers and families?
Carers and families bear much of the burden of brain and nervous system conditions, due to the provision of informal care, modifications to housing and vehicles and funeral costs.11
References
1. NeuRA. Neurological and central nervous system. Available from: //www.neura.edu.au/health-area/neurological-central-nervous-system/ [Accessed May 2018].
2. Health Direct. Nervous system. Available from: www.healthdirect.gov.au/nervous-system [Accessed May 2018].
3. Dementia Australia. Dementia statistics. Available from: https://www.dementia.org.au/statistics [Accessed May 2018].
4. Epilepsy Action Australia. Facts and statistics. Available from: https://www.epilepsy.org.au/about-epilepsy/facts-and-statistics [Accessed May 2018].
5. Parkinson’s Australia. Statistics about Parkinson’s. Available from: www.parkinsons.org.au/statistics [Accessed May 2018].
6. MS Australia. What is MS? Available from: www.msaustralia.org.au/what-ms [Accessed May 2018].
7. Spinal Cord Injuries Australia (scia). Living with SCI. Available from: https://scia.org.au/living-with-a-disability/ [Accessed May 2018].
8. Multiple Sclerosis Trust. Risk of developing MS. Available from: https://www.mstrust.org.uk/a-z/risk-developing-ms [Accessed May 2018].
9. Alzheimer’s Association. 2016 Alzheimer’s Disease Facts and Figures. Alzheimer’s & Dementia. 2016;12(4).
10. NATSEM at the Institute for Governance and Policy Analysis, University of Canberra. Economic cost of dementia in Australia 2016–2056. February 2017.
11. People pledge Australia blog. Costs for Australians with MS and how to overcome it. Available from: http://peoplepledge.com.au/blog/what-are-the-out-of-pocket-costs-for-australians-living-with-multiple-sclerosis-ms/ [Accessed May 2018].
55 The cost of care 56
Bra
in a
nd
ner
vou
s sy
stem

Snapshot
Estimated number of people with dementia (2018)1 425,416
Number of deaths from dementia (2016)2
13,126 (36 deaths each day)
• 4,679 (men)• 8,447 (women)
Likelihood3
• 1 in 11 chance at age 65 years (men) 1 in 6 chance at age 65 years (women)
Average cost4 $47,811 in the first year
$14,842 each year thereafter
• Dementia is a term used to describe symptoms of a larger group of illnesses that cause a decline in a person’s functioning. These symptoms can include loss of memory, rationality, social skills and physical functioning2
• One of the most commonly known types of dementia is Alzheimer’s disease2
• Dementia is more common in women than men and is the greatest cause of disability in people over the age of 65 years2
• Approximately 25,938 people are living with younger onset dementia. By 2056, this number is expected to increase to 42,252 people4
• It is the second leading cause of death in Australia2
What’s the risk?Men have a 1 in 11 chance of developing dementia during their lifetime. As dementia is more common in women, the risk is higher – a 1 in 6 chance over their lifetime.3
Factors that can increase a person’s risk of dementia, include:2
• Cardiovascular disease (CVD)
• Diabetes
• High cholesterol
• Family history
• Head injury
Dementia
The cost of dementia Cost components for dementia4
Component Average annual cost of new incidences
Hospitalisation $31,459
GP and Specialist visits $4,366
Pharmaceuticals $1,877
Transportation $907
Care costs $9,202
Impact on carers
The cost of dementia also affects carers – there are approximately 1.2 million people in Australia caring for someone with dementia.2 Most people with dementia live in the community (as opposed to aged care or assisted living facilities) and 46% receive informal assistance, for example from a family member or close friend.4
References
1. Dementia Australia. Dementia statistics. Available from: https://www.dementia.org.au/statistics [Accessed May 2018].
2. Health Direct. Dementia statistics. Available from: https://www.healthdirect.gov.au/dementia-statistics [Accessed May 2018].
3. Alzheimer’s Association. 2016 Alzheimer’s Disease Facts and Figures. Alzheimer’s & Dementia. 2016;12(4).
4. NATSEM at the Institute for Governance and Policy Analysis, University of Canberra. Economic cost of dementia in Australia 2016– 2056. February 2017.
Around 244 people are diagnosed with dementia every day4
Looking to the futureIt’s estimated that there will be more than 500,000 people living with dementia by 2025 and over 1 million by 2056.2
57 The cost of care 58
Bra
in a
nd
ner
vou
s sy
stem

Individuals spend an average of
$126 per month on epilepsy medication6
Epilepsy
Snapshot
Estimated number of people with epilepsy (2017)1
250,000
Number of deaths from epilepsy (2016)2 271 (5 deaths each week)
Likelihood3 1 in 26 chance by age 80 years
Average cost per treatment 4 $3,510
• Epilepsy is a disorder of the brain that is characterised by the tendency to have recurring seizures5
• Approximately 50% of people who have one seizure go on to have more seizures5
• Epilepsy affects people of all ages, but it is most commonly diagnosed in early childhood, adolescence and in people over the age of 65 years1
What’s the risk?• Epilepsy is linked with an increased risk of death – the risk is 2–3 times
greater than for those who don’t have epilepsy1
The cost of epilepsyMedication is reported as highest contributor to epilepsy costs, with an average of $126 spent each month in out-of-pocket expenses. Other cost burdens include health insurance, cost of transportation and specialist fees.6
Direct costs associated with treating epilepsy are generally highest immediately following diagnosis, due to diagnostic evaluation and initial treatment. While anti-epileptic drugs (AEDs) are the mainstay of treatment, many individuals go through a ‘trial and error’ period before finding a successful treatment. Anywhere from 20–40% of patients fail to have their seizures controlled by the first prescribed AED and some 40% will experience side effects. This leaves patients with epilepsy trialling a series of different medications, and sometimes combinations of medications, which can significantly increase the costs associated with managing epilepsy.7
Indirect costs associated with absenteeism from work and daily activities also accounts for the high cost of epilepsy. People with epilepsy are 2 to 3 times more likely to have 14 or more unhealthy days (both physical and mental) in a year.8 Some people have to give up working in their career field altogether following a diagnosis of epilepsy.5
People with epilepsy are 2 to 3 times more likely to have 14 or more unhealthy days per year than those without epilepsy7
References
1. Epilepsy Action Australia. Facts and statistics. Available from: https://www.epilepsy.org.au/about-epilepsy/facts-and-statistics/ [Accessed May 2018].
2. Australian Bureau of Statistics 2016. 3303.0 Causes of death – Australia, 2016. September 2017.
3. Hesdorffer et al. Estimating risk for developing epilepsy: a population-based study in Rochester, Minnesota. Neurology. 2011;76(1);23–7.
4. NSW Government, Department of Health. cost of care in NSW hospitals. Available from: www.health.nsw.gov.au/Hospitals/Going_To_hospital/cost-of-care/Pages/default.aspx [Accessed May 2018].
5. Epilepsy Australia. Epilepsy explained. Available from: http://www.epilepsyaustralia.net/epilepsy-explained/ [Accessed May 2018].
6. Walker C. Researching the personal impact of epilepsy 2007. Available from: http://www.epilepsyaustralia.net/uploads/74689/ufiles/PDF/buckland-report-36p1.pdf [Accessed May 2018].
7. Zoghi M. Epilepsy and how it can be controlled. Available from: http://brainfoundation.org.au/wp-content/uploads/2015/05/Zoghi-Maryam_Epilepsy.pdf [Accessed May 2018].
8. Cardarelli WJ and Smith BJ. The burden of epilepsy to patients and payers. Available from: https://www.ncbi.nlm.nih.gov/pubmed/21517648 [Accessed May 2018].
Looking to the futureThe idea that epilepsy is a young person’s disorder is rapidly fading, with those over the age of 55 years now being recognised as a highly vulnerable demographic. This in part is due to the fact that individuals over 55 years old are more likely to experience cerebrovascular, respiratory and cardiac events that can lead to epileptic seizures.5
1 in 26 people will develop epilepsy during their lifetime3
$3,510
Average per treatment cost
59 The cost of care 60
Bra
in a
nd
ner
vou
s sy
stem

Parkinson’s disease
Snapshot
Estimated number of people with Parkinson’s disease (2018)1
82,000
Estimated new cases each day (2018)1 39
Number of deaths from Parkinson’s disease (2016)2 1,762 (4 deaths each day)
Likelihood3
• 1 in 50 chance (men) by age 85 yrs
• 1 in 77 chance (women) by age 85 yrs
Average cost1 $169,060 (over 12 years)
• Parkinson’s is a progressive neurological condition where a neurotransmitter called dopamine is not produced at adequate levels in the brain. The lack of dopamine can cause difficulty controlling movements and affect other body systems such as sense of smell, the bowel, thinking and mood1
• 20% of sufferers are aged 50 years and under and 10% will be diagnosed before the age of 40 years 4
• The average time from onset to death is 12.4 years, though many people with Parkinson’s disease will live much longer1
What’s the risk?• The likelihood of developing Parkinson’s disease is approximately 1–2% for
individuals in the general population.4 It is not known exactly what causes Parkinson’s disease, however certain factors may play a role, including:5
• Age – Parkinson’s usually begins in middle or later life and the risk continues to increase with age
• Heredity – having a close relative with Parkinson’s can increase a person’s chance of developing the disease
• Exposure to toxins, such as herbicides and pesticides may slightly increase a person’s risk
The cost of Parkinson’s disease Since 2005, the direct financial cost of Parkinson’s has increased by 103%1 and from 2012–18, costs to the community have increased by 48%.5
Individuals with Parkinson’s disease can expect to pay nearly $170,000 in out-of-pocket expenses over their lifetime.1 Much of this cost is for treatments as well as mobility aids, formal care, accommodation and travel and modifications to homes or vehicles.
Parkinson’s disease can also affect individuals’ capacity to work. Many people with Parkinson’s disease spend more days absent from work and retire early.6 In addition, carers may work less in order to care for their loved one with Parkinson’s.6
References
1. Parkinson’s Australia. Statistics about Parkinson’s. Available from: www.parkinsons.org.au/statistics [Accessed May 2018].
2. Australian Bureau of Statistics 2016. 3303.0 Causes of death – Australia, 2016. September 2017.
3. Elbaz A et al. Risk tables for parkinsonism and Parkinson’s disease. Journal of Clinical Epidemiology. 2002;55:25–31.
4. Shake it up. All about Parkinson’s. Available from: https://shakeitup.org.au/understanding-parkinsons/ [Accessed May 2018].
5. Mayo Clinic. Parkinson’s disease. Available from: https://www.mayoclinic.org/diseasesconditions/parkinsons-disease/symptoms-causes/syc-20376055 [Accessed May 2018].
6. Deloitte. Access Economics. Living with Parkinson’s Disease: An updated economic analysis 2014.
Since 2005, the burden of care borne by carers has increased over 14 times1$169,060
Average cost over 12 years
18% of people living with Parkinson’s disease are of working age1
The facts• The average cost of aids for those in Stage
I of Parkinson’s disease is $66 per year. At Stage V, the annual cost can be as high as $2,4606
• People with Parkinson’s spend around $640 on aids per year and around $200 on formal care, accommodation and travel costs6
• Approximately 50% of people with Parkinson’s disease use a mobility aid6
61 The cost of care 62
Bra
in a
nd
ner
vou
s sy
stem

Multiple sclerosis
Snapshot
Estimated number of people with multiple sclerosis (2017)1 25,000
Number of deaths from multiple sclerosis (2016)2 196 (3 deaths each week)
Likelihood3 1 in 333 chance by age 85 years
Average cost4 $1,450 per month
• Multiple sclerosis (MS) is a condition of the central nervous system that obstructs nerve impulses in the brain, spinal cord and optic nerves1
• MS is more common in women – they are roughly 3 times more likely to have MS than men1
What’s the risk?The lifetime risk of MS is low, with those in the general population having a 1 in 333 chance of being diagnosed with the condition. However, the risk is higher for individuals who have an immediate family member with MS:3
• Identical twin 1 in 5
• Non-identical twin 1 in 22
• Other brothers or sisters 1 in 37
• Parent 1 in 66
• Child Child
The cost of MSCosts incurred by people with MS are not only for medical treatments. Other expenses include residential care, aids and assistive devices, and loss of employment, especially as symptoms worsen.4 While funding is available for some aids and devices, many need to be paid for privately.5
Loss of employment is also a concern for those with MS as many will reduce their hours or retire from work as symptoms worsen, leading to a decrease in annual income.5
As is the case with many chronic neurological conditions, carers of people with MS are also affected due to the provision of informal care, which can often result in the inability to work full time or to work at all.5
References
1. MS Australia. What is MS? Available from: www.msaustralia.org.au/what-ms [Accessed May 2018].
2. Australian Bureau of Statistics 2016. 3303.0 Causes of death – Australia, 2016. September 2017.
3. Multiple Sclerosis Trust. Risk of developing MS. Available from: https://www.mstrust.org.uk/a-z/risk-developing-ms [Accessed May 2018].
4. Menzies Research Institute of Tasmania 2010. [ES.2] Cost of MS. https://msra.org.au/wp-content/uploads/2016/03/Economic-Impact-of-MS-in-2010 -Full-Report-v2-1.pdf
5. People pledge Australia blog. Costs for Australians with MS and how to overcome it. Available from: http://peoplepledge.com.au/blog/what-are-the- out-of-pocket-costs-for-australians-living-with-multiple-sclerosis-ms/ [Accessed May 2018].
Injury
Most people diagnosed with MS are between the ages of 20 and 40 years1
$1,450
Average cost per month
63 The cost of care 64

In Australia, injuries cost over
in direct costs each year1
In 2014–15 there were a total of 483,673 injuries in Australia, equivalent to 1,325 every day. Of these injuries, most (55%) were experienced by men.
Transport accident
52%
29%
Falls
3%
Other
8%
Water-related
8%
Strike or collision
Causes of traumatic brain injury (TBI)2
Falls
33%
25%
Transportation car
9%
Transportation motorcyclist
13%
Transportation other
20%
Other
Causes of traumatic spinal cord injury (SCI)2
The facts1
• 1 in 5 injury cases involves the head and neck
• 38% of injury cases involve fractures
• The average hospital stay for injury is 4 days
• For injuries requiring hospitalisation:
• One in 6 are classified as high threat to life
• One in 50 involve time in intensive care at an average of 82 hours per case
• Each day, there are 4 new moderate TBIs
• Each week, there are 19 new severe TBIs
• Each month, there are 11 new paraplegic events and 11 new quadriplegic events
Cost of injury
Injury
Injury type1 Lifetime cost per incident ($)
Traumatic brain injury (moderate) $3 million
Traumatic brain injury (severe) $5.7 million
Paraplegia $6 million
Quadriplegia $11.3 million
• Traumatic brain injury – a complex brain injury, usually caused by an external force, which results in altered brain function3
• Paraplegia – loss of function below the chest4
• Quadriplegia (also known as tetraplegia) – loss of function below the neck4
While individuals bear 17% of the overall healthcare expenditure cost for injuries, the amount individuals contribute to aids and appliances are far greater.5
Aids and appliances5 Cost
Hoist $2,990
Speech generator $7,080
Bedding system $3,670
Mobile shower chair $1,140
Manual wheelchair $3,490
Powered wheelchair $13,620
References
1. AIHW National Injury Surveillance Unit. Cost of injury in Australia 1999. Available from: https://www.aihw.gov.au/reports/injury/cost-of-injury-in-australia/contents/table-of-contents [Accessed July 2018]
2. The economic cost of spinal cord injury and traumatic brain injury in Australia. June 2009. Report by Access Economics Pty Limited for The Victorian Neurotrauma Initiative
3. Menon DK, Schwab K, Wright DW, Maas AI. Position statement: definition of traumatic brain injury. Arch Phys Med Rehabil 2010;91:1637–40. Search PubMed
4. Spinal Cord Injuries Australia (scia). Living with SCI. Available from: scia.org.au/ [Accessed May 2018]
5. Queensland Competition Authority. Price Disparities for Disability Aids and Equipment. February 2014. Available from: http://www.qca.org.au/getattachment/a98aac78-d791-4718-acbd-756195580892/Final-ReportMedical-and-Disability-Aids-and-Equip.aspx [Accessed July 2018]
Sources of expenditure on aids and appliances5
Government
Health insurance funds
Individuals
Other
The highest cause of injury is transportation accidents, accounting for
52%.
$2.3 bill
ion
65 The cost of care 66
Inju
ry

Spinal cord injury
Snapshot
Estimated number of people with a spinal cord injury (2018)1 20,000
Estimated number of deaths from spinal cord injury2
Not reported
• Mortality rates are higher for people with spinal cord injury (SCI) in the first year following injury vs the general population
• For those who survive the first year, mortality rates are twice as high when compared with those in the general population
LikelihoodNot reported (see risk section for more information)
Cost range3
• $104,350–$106,850 per year (healthcare)
• $12,790–$14,760 per year (equipment and modifications)
• $2,490–$6,130 per year (long-term care)
SCI costs and inclusions3
Costs per person per year
Inclusions
Healthcare $104,350–$106,850
Patient accommodation, ambulance and road rescue, hospital, rehabilitation, general practitioners, specialists, pathology, radiology, allied healthcare
Equipment and modifications
$12,790–$14,760
Transportation (specialised vehicles), mobility aids, home assistance (electrical bed, lifts/hoists, kitchen tools or cutlery with special handles), ventilation
Long-term care $2,490–$6,130
Attendant care, independent living unit, special accommodation, nursing home support
Indirect costsThere are also significant indirect costs associated with SCI, including the impact on a person’s ability to work and the hours of care required for personal care.
In a study of 219 people with SCI, 73% were employed, part or full time, prior to their injury. Following their SCI, 37% were employed, 4% were unemployed and looking for work and 59% were unemployed and not looking for work.3
People with SCI also require assistance with personal care tasks, such as eating, bathing, dressing, bowl and bladder programs, as well as daily activities like cleaning and grocery shopping. The number of hours required per day varies based on the type of SCI.5
• High cervical (neck) injury – may require care 24 hours per day
• Mid-cervical injury – approximately 6–10 hours per day
• Thoracic (middle spine) injury – up to 3 hours per day
References
1. Spinal Cord Injuries Australia (scia). Living with SCI. Available from: https://scia.org.au/living-with-a-disability/[Accessed May 2018].
2. Australian Institute of Health and Welfare: Tovell, A 2018. Spinal cord injury, Australia, 2013–14. Injury research and statistics series no. 107. Cat. no. INJCAT 183. Canberra: AIHW.
3. Deloitte. Access Economics. The economic cost of spinal cord injury and traumatic brain injury in Australia. June 2009.
4. People pledge Australia blog. The cost of spinal cord injuries for Australians. Available from: http://peoplepledge.com.au/blog/the-cost-of-spinal-cord-injuries-for-australians/ [Accessed May 2018].
5. Shepard Centre. Understanding spinal cord injury. Available from: www.spinalinjury101.org/ [Accessed May 2018].
Approximately 60% of people with SCI are wheelchair dependent and many require home modifications and specialised equipment4
SCI imposes a large burden on the individual, their families and carers and the economy as a result of high-level and long-term disability and increased mortality risk.2 Although advances in medical treatments mean people with SCI are living with their injury for longer, it also means costs over a lifetime for people with SCI are enormous.2
• Spinal cord injury (SCI) is considered to be damage to the spinal cord that results in a loss of function; it usually occurs due to trauma, for example, a car accident, or a medical condition, such as spina bifida1
• 46% of spinal cord injuries are a result of land transport accidents2
What’s the risk?• Although SCI can happen to anyone, certain individuals are more prone:3
– Men
– People between the ages of 18–35 years are more likely to sustain spinal injuries (usually from car or motorcycle accidents)
– Athletes, in particular gymnasts, divers and surfers are at increased risk
80% of spinal cord injuries occur in men2
The cost of spinal cord injury
$106,850
Healthcare cost range per year $104,350-
The average age of onset of SCI is 42 years in men and 53 years in women2
67 The cost of care 68
Inju
ry

Case study
At 37 years old, Sean and his wife had just purchased their first home and were ready to start their family. With a mortgage and potentially children on the way, Sean decided to buy a personal insurance policy. He wanted peace of mind to know his family would always be protected.
Sean didn’t expect to use his insurance a year later when he was involved in a serious car accident. The accident left Sean hospitalised for almost five months and a T4–T6 (mid-thoracic) paraplegic. As a result, he could no longer work and required full-time care from his wife.
Sean was in denial about losing his independence. His wife decided that prior to his discharge from hospital, significant modifications were needed in the home. With advice from an occupational therapist, the first phase of modifications included buying essential items such as a wheelchair and an electrical bed, and installing ramps and rails around the home for accessibility, which cost over $30,000.
Since Sean’s return home, he sees a physiotherapist fortnightly for pain ($105 for 30 minutes) and requests home visits from a nurse for any bowel, bladder and pressure area management (as required, covered through the National Disability Insurance Scheme).
In Sean’s journey to regaining independence, he has required additional fixtures in the bathroom and equipment to help with household tasks (~$7,000 per year). Fortunately, their insurance policy has covered most of their costs.
In the last year the couple has achieved major milestones. Sean has learnt to drive again and has had his car modified with portable hand controls. His wife has returned to the workforce with reduced working hours. Given the lifetime effects of spinal cord injury, Sean and his wife worry about the uncertainty of the future, but their insurance policy has given them a peace of mind from a financial perspective.
*This case study is provided for illustrative purposes based on the data in this document
Kidney and diabetes
Kidney diseaseKidney disease affects around 1.77 million Australians, is responsible for 9 deaths each day and kills more people each year than breast cancer, prostate cancer or road traffic accidents.
It is estimated that 4 out of 10 individuals without chronic kidney disease (CKD) at age 50 years will eventually develop CKD
In most cases, kidney function in people with CKD will continue to decline and the disease will progress despite treatment. Thus, almost all people with CKD will incur lifelong expenses to manage their condition. The average cost of kidney disease at $3,897 per year.
Those with more advanced stages of the disease will ultimately incur higher costs due to dialysis, transportation to and from treatments and transplant care. In a survey of people receiving dialysis for CKD, 71% said they experienced ‘financial catastrophe’ as a result.
DiabetesDiabetes is the fastest growing chronic condition in Australia and in 2014-15 there were an estimated 1.7 million Australians with diabetes.
Type 1 diabetes (T1D) and type 2 diabetes (T2D) are the most common, accounting for 10% and 85% of cases, respectively.*
Average out-of-pocket (OOP) costs for diabetes also vary by type, with T1D costing more than T2D – those with T1D spend an average of $2,341 per year vs $1,220 per year spent by those with T2D.
Complications from diabetes have a significant impact on people of working age (45–65 years) due to illness-related absence.
Furthermore, there is no cure for diabetes, and, as a result, the condition requires lifelong management and lifelong treatment costs.
*Gestational diabetes is a third type of diabetes that only affects pregnant women and is not covered in this document
Sean*, 43
Spinal cord injury
Case study
69 The cost of care 70
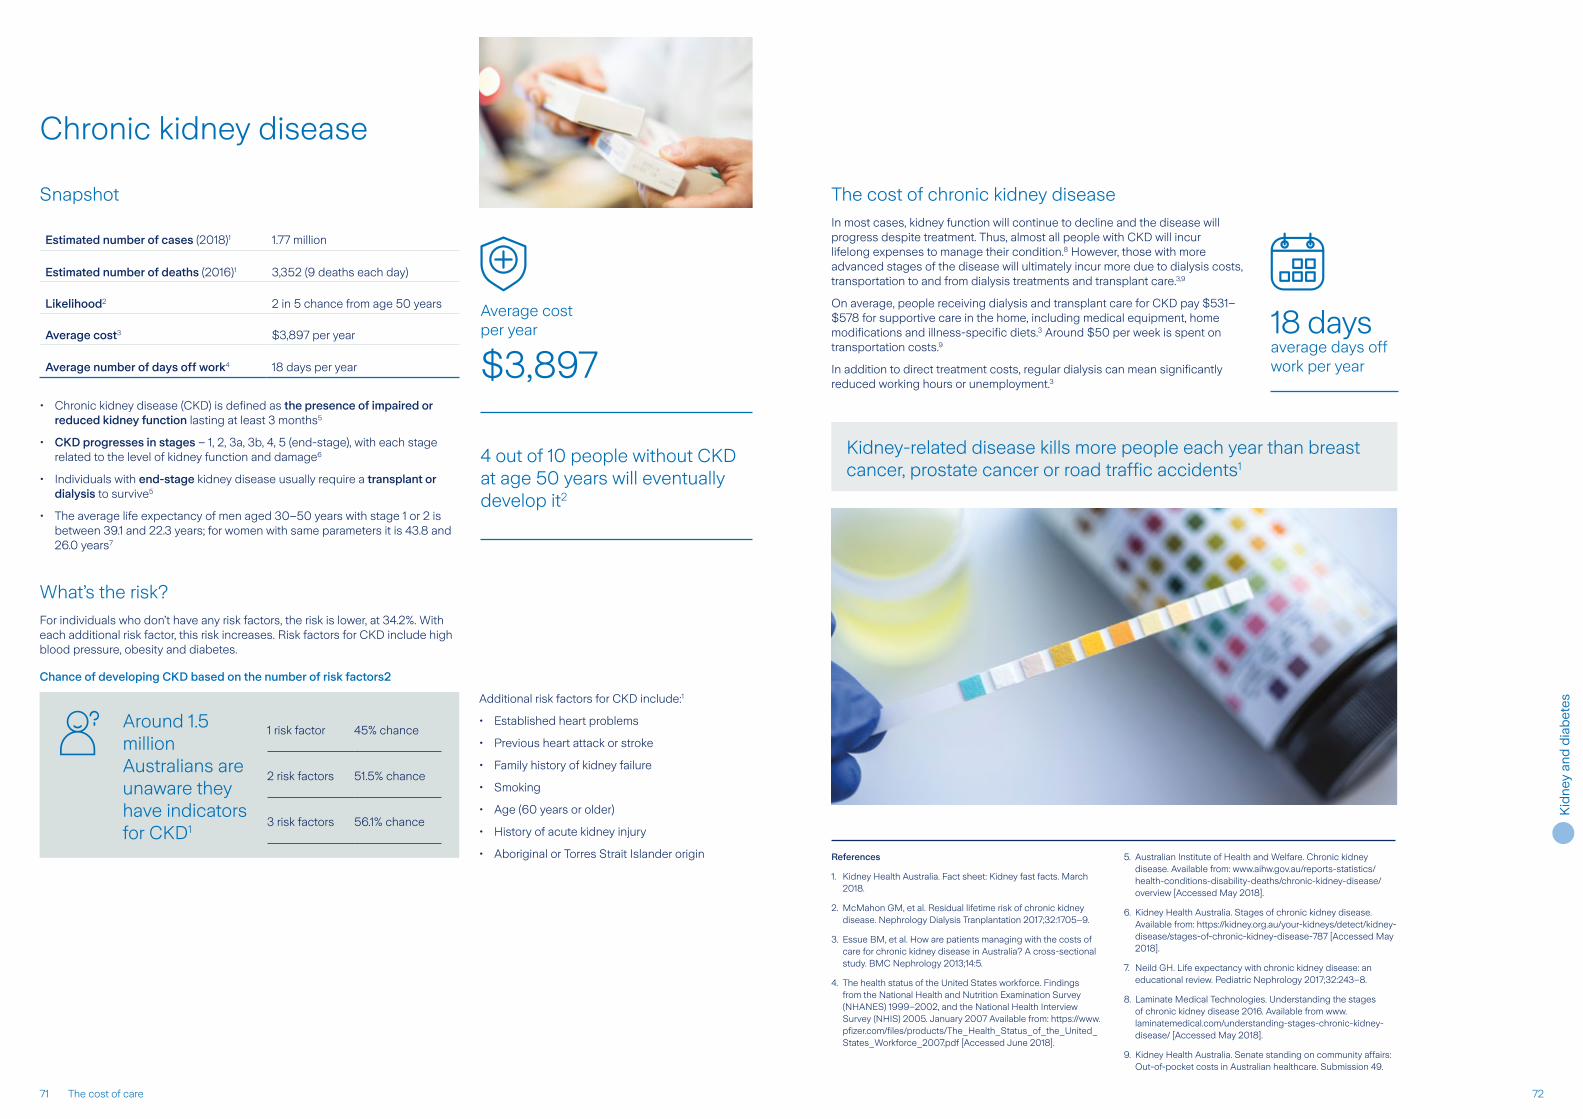
What’s the risk?For individuals who don’t have any risk factors, the risk is lower, at 34.2%. With each additional risk factor, this risk increases. Risk factors for CKD include high blood pressure, obesity and diabetes.
Chance of developing CKD based on the number of risk factors2
Chronic kidney disease
Snapshot
Estimated number of cases (2018)1 1.77 million
Estimated number of deaths (2016)1 3,352 (9 deaths each day)
Likelihood2 2 in 5 chance from age 50 years
Average cost3 $3,897 per year
Average number of days off work4 18 days per year
• Chronic kidney disease (CKD) is defined as the presence of impaired or reduced kidney function lasting at least 3 months5
• CKD progresses in stages – 1, 2, 3a, 3b, 4, 5 (end-stage), with each stage related to the level of kidney function and damage6
• Individuals with end-stage kidney disease usually require a transplant or dialysis to survive5
• The average life expectancy of men aged 30–50 years with stage 1 or 2 is between 39.1 and 22.3 years; for women with same parameters it is 43.8 and 26.0 years7
Kidney-related disease kills more people each year than breast cancer, prostate cancer or road traffic accidents1
The cost of chronic kidney diseaseIn most cases, kidney function will continue to decline and the disease will progress despite treatment. Thus, almost all people with CKD will incur lifelong expenses to manage their condition.8 However, those with more advanced stages of the disease will ultimately incur more due to dialysis costs, transportation to and from dialysis treatments and transplant care.3,9
On average, people receiving dialysis and transplant care for CKD pay $531–$578 for supportive care in the home, including medical equipment, home modifications and illness-specific diets.3 Around $50 per week is spent on transportation costs.9
In addition to direct treatment costs, regular dialysis can mean significantly reduced working hours or unemployment.3
References
1. Kidney Health Australia. Fact sheet: Kidney fast facts. March 2018.
2. McMahon GM, et al. Residual lifetime risk of chronic kidney disease. Nephrology Dialysis Tranplantation 2017;32:1705–9.
3. Essue BM, et al. How are patients managing with the costs of care for chronic kidney disease in Australia? A cross-sectional study. BMC Nephrology 2013;14:5.
4. The health status of the United States workforce. Findings from the National Health and Nutrition Examination Survey (NHANES) 1999–2002, and the National Health Interview Survey (NHIS) 2005. January 2007 Available from: https://www.pfizer.com/files/products/The_Health_Status_of_the_United_States_Workforce_2007.pdf [Accessed June 2018].
5. Australian Institute of Health and Welfare. Chronic kidney disease. Available from: www.aihw.gov.au/reports-statistics/health-conditions-disability-deaths/chronic-kidney-disease/overview [Accessed May 2018].
6. Kidney Health Australia. Stages of chronic kidney disease. Available from: https://kidney.org.au/your-kidneys/detect/kidney-disease/stages-of-chronic-kidney-disease-787 [Accessed May 2018].
7. Neild GH. Life expectancy with chronic kidney disease: an educational review. Pediatric Nephrology 2017;32:243–8.
8. Laminate Medical Technologies. Understanding the stages of chronic kidney disease 2016. Available from www.laminatemedical.com/understanding-stages-chronic-kidney-disease/ [Accessed May 2018].
9. Kidney Health Australia. Senate standing on community affairs: Out-of-pocket costs in Australian healthcare. Submission 49.
18 days average days off work per year
Additional risk factors for CKD include:1
• Established heart problems
• Previous heart attack or stroke
• Family history of kidney failure
• Smoking
• Age (60 years or older)
• History of acute kidney injury
• Aboriginal or Torres Strait Islander origin
4 out of 10 people without CKD at age 50 years will eventually develop it2
Around 1.5 million Australians are unaware they have indicators for CKD1
1 risk factor 45% chance
2 risk factors 51.5% chance
3 risk factors 56.1% chance
$3,897
Average cost per year
71 The cost of care 72
Kid
ney
an
d d
iab
etes

Diabetes
Snapshot
Estimated number of cases (2014–15)1 1.7 million
Likelihood2,3
Type 1
• 1 in 303 chance by age 85 years (general population)
• 1 in 20 chance by age 85 years (individuals with a first-degree relative with T1D)
Type 2
• 40% chance from age 20 years (men)• 39% chance from age 20 years (women)
Average cost4,5
Type 1
• $2,341 per year
Type 2
• $1,220 per year
Average number of days off work6 11.8 days per year
• Diabetes is the fastest growing chronic condition in Australia1
• Diabetes is more common in men than in women7
• There are a number of complications that can arise from diabetes, including blindness, foot complications (sometimes resulting in amputation), kidney disease and cardiovascular disease7
Types of diabetes1
Type 1 (T1D) Type 2 (T2D)
• Occurs when the pancreas doesn’t make enough insulin
• Accounts for 10%* of all diabetes cases
• T1D is one of the most common chronic childhood and adolescent conditions
• Occurs when the pancreas doesn’t make enough insulin and/or insulin doesn’t work properly and/or the body doesn’t respond to the insulin properly
• Accounts for 85%* of all diabetes cases
• Usually develops in people over the age of 45 years but it is becoming more common in younger populations
*Gestational diabetes is a third type of diabetes that only affects pregnant women; for the purposes of this document, only T1D and T2D will be covered
What’s the risk?The chance of an individual in the general population being diagnosed with T1D is very low at 0.33%. However, this risk rises dramatically to 5% for individuals with a first-degree relative with T1D.2
The story is much different when it comes to T2D. The risk that a man, age 20 years, will develop T2D in his lifetime is 40% and for a woman, age 20 years, the risk is 39%.3
Certain risk factors are closely linked with the chance of developing T2D. These include family history, age, overweight and obesity and gestational diabetes.1
Complications from diabetes: The facts
• Diabetes is the leading cause of preventable blindness and kidney failure in Australia1
• There are more than 4,400 amputations per year as a result of diabetes1
• The risk of cardiovascular events and other complications is higher in people with diabetes:7
• Heart attack: three times as likely
• Stroke: four times as likely
• Kidney failure: three times as likely
$2,341
Type 1 Average cost per year
One person develops diabetes every 5 minutes1
$1,220
Type 2 Average cost per year
73 The cost of care 74
Kid
ney
an
d d
iab
etes

The cost of diabetesPeople with diabetes can expect to pay, on average, $1,220–$2,341 per year to manage their condition.4,5 Treatment costs for T1D are generally lower than for T2D because management and lifestyle modification are considered standard treatment for initial T2D management. However, as the disease progresses, many people with T2D will need oral medications and/or insulin, which inevitably increases costs.1
There is no cure for diabetes, and, as a result, the condition requires lifelong management.7
Musculoskeletal
Average costs for musculoskeletal conditions
Musculoskeletal conditions, such as back problems and pain, arthritis, and osteoporosis affected nearly 7 million Australians in 2014–15.
The likelihood of some musculoskeletal conditions can be attributed to specific risk factors, mainly:
• Age
• Injury
• Family history
• Overweight and obesity
• Occupational exposures and hazards
60% of Australians affected by musculoskeletal conditions are of working age (25–64 years). The most common reasons for Australians of working age to drop out of the workforce are back problems and arthritis (the two conditions alone account for 40% of forced retirements).
Looking to the futureThe number of Australians with diabetes who were out of the workforce due to illness in 2015 was 18,100. By 2030, this number is estimated to increase to 21,400 – an increase of 18%.8
Complications from diabetes have a significant impact on people of working age (45–64 years) due to illness-related absence8
References
1. Diabetes Australia. Diabetes in Australia. Available from: www.diabetesaustralia.com.au/diabetes-in-australia [Accessed May 2018].
2. Maahs DM, et al. Chapter 1: Epidemiology of Type 1 Diabetes. Endocrinology Metabolism Clinics North America. 2010;39:481–97.
3. Center for Disease Control. Now, 2 out of every 5 Americans expected to develop type 2 diabetes during their lifetime. Available from: https://www.cdc.gov/diabetes/pdfs/newsroom/now-2-out-of-every-5-americans-expected-to-develop-type-2-diabetes-during-their-lifetime.pdf [Accessed May 2018].
4. Type 1 writes. Cost of having diabetes for a year (2017). Available from: www.type1writes.com/2017/07/26/cost-having-diabetes-year/ [Accessed May 2018].
5. ESSA. Value and affordability of PHI and out-of-pocket medical costs. Submission 14. July 2017.
6. Breton MC, et al. Burden of diabetes on the ability to work: A systematic review. Diabetes Care 2013;36:740–9.
7. Baker IDI Heart & Diabetes Institute. Diabetes: The silent pandemic and its impact on Australia. Available from: https://static.diabetesaustralia.com.au/s/fileassets/diabetes-australia/e7282521-472b-4313-b18e-be84c3d5d907.pdf [Accessed May 2018].
8. Schofield D, et al. The costs of diabetes among Australians aged 45–64 years from 2015 to 2030: projections of lost productive life years (PLYs), lost personal income, lost taxation revenue, extra welfare payments and lost gross domestic product from Health&WealthMOD2030. BMJ Open 2017;7(1):e013158.
Condition Cost
Back pain and problems $6,096 per year
Osteoarthritis $1,220 per year
Rheumatoid arthritis $2,189 per year
75 The cost of care 76

RisksFor some musculoskeletal conditions, their likelihood can be attributed to specific risk factors, mainly age, injury, family history, overweight and obesity, and occupational exposures and hazards.1 For example, a strong relationship exists between back problems and pain and occupations that require manual/physical work.2
Cost of musculoskeletal conditions in AustraliaThe burden of musculoskeletal conditions exceeds that of all other chronic conditions in Australia.5 In 2008–09, $5,690 million was spent on musculoskeletal conditions, making it the fourth largest contributor to direct healthcare expenditure.1
Musculoskeletal conditions are a considerable cause of disability and negatively impact a person’s quality of life, affecting their ability to engage in work and family and social activities.1 The most common reasons for Australians of working age (25–64 years) to drop out of the workforce are back problems and arthritis – these two conditions alone account for 40% of forced
retirements.6
What about carers and families?The burden of musculoskeletal conditions also affects the family members and friends of sufferers. Approximately 50% of people with osteoarthritis (OA) receive informal care, with caregivers spending an average of 27.4 hours per week providing care. Around 15 hours a week are spent assisting with household tasks and another 12.4 on activities of daily living.9
Musculoskeletal conditions, such as back problems and pain, arthritis, and osteoporosis affected nearly 7 million Australians in 2014–15.1
Such illnesses pose a significant burden to individuals and the community, as they largely contribute to pain and disability and have a substantial impact on daily living and productivity.1
Musculoskeletal conditions are mostly managed in primary care settings using medication, physical therapy and self-management strategies. Occasionally, referral to specialist care and/or hospitalisation is required.1 In 2014–15, there were 534,187 hospitalisations due to musculoskeletal conditions – most were for back problems.1
Prevalence of musculoskeletal conditions in AustraliaMusculoskeletal conditions are highly prevalent, affecting 30% of all Australians.1
The prevalence is higher amongst women than men and more than 60% of Australians affected by musculoskeletal conditions are aged 25–64 years.1
60% of Australians affected by musculoskeletal conditions are of working age (25–64 years)1
It is estimated that 70–90% of people will experience back pain at some point during their life, with men and women equally affected3,4
31% of Australians with disability report having musculoskeletal conditions1
52,000 people aged 15–64 years are unable to work due to their arthritis, leading to a personal loss of income of $955 per week on average8
References
1. Australian Institute of Health and Welfare (2017). The burden of musculoskeletal conditions in Australia: a detailed analysis of the Australian Burden of Disease Study 2011. Australian Burden of Disease Study series no. 13. BOD 14. Canberra: AIHW.
2. National Research Council & Institute of Medicine. (2001). Musculoskeletal Disorders and the Workplace: Low Back and Upper Extremities. Washington, D.C.: National Academy Press.
3. AIHW 2017. Back problems. Available from: https://www.aihw.gov.au/reports/arthritis-other-musculoskeletal-conditions/back-problems/what-are-back-problems [Accessed May 2018].
4. Australian Institute of Health and Welfare (2016). Impacts of chronic back problems. Bulletin 137. Cat. no. AUS 204. Canberra: AIHW.
5. The Conversation. Pain drain: the economic and social costs of chronic pain. Available from: https://theconversation.com/pain-drain-the-economic-and-social-costs-of-chronic-pain-49666 [Accessed May 2018].
6. Consumers Health Forum of Australia. Health voices. Australian healthcare – out of pocket and out of date? Issue 12 April 2013.
7. Lapsley HM et al. Living with rheumatoid arthritis: expenditures, health status, and social impact on patients. Annals Rheumatic Diseases 2002; 61:818–21.
8. University of Melbourne. Counting the cost: the current and future burden of arthritis. Available from: https://healthsciences.unimelb.edu.au/departments/physiotherapy/aboutus/chesm/news-and-events/count-the-costs [Accessed May 2018].
9. Deloitte. Access Economics. Arthritis – the bottom line. The economic impact of arthritis in Australia. January 2005.
Most prevalent musculoskeletal conditions in Australia1
Back pain or problems
0.0 1.0 2.0 3.0 4.0
Population (millions)
Rheumatoid arthritis
Osteoporosis
Osteoarthritis
People with rheumatoid arthritis spend anywhere from $71 to
$29,695 to manage their condition
per year
77 The cost of care 78
Mu
scu
losk
elet
al

Back pain and problems
Snapshot
Estimated number of cases (2014–15)1 3.7 million
Likelihood2 70–90% of people will experience back pain at some point in their lives1
Average cost3,4 $508 per month
% of people who take time off work5 17.1%
Average number of days off work6 21.2 days per year
• Back problems describes conditions relating to the bones, joints, connective tissue, muscles and nerves of the back, which can affect the neck, upper back, lower back, sacrum and tailbone1
• The main symptom relating to back problems is pain1
• Of those with back pain, 14% have constant pain and 86% experience pain at least one day per week1
Types of back pain2
Acute Chronic
Pain that lasts between 4 and 12 weeks
Pain that persists for 12 weeks or longer
About 20% of people with acute back pain will go on to develop chronic pain, with persistent symptoms starting around one year2
What’s the risk?It is estimated that 70–90% of people will experience back pain at some point during their life, with men and women equally affected.1,8
Back problems have many causes, such as injury, postural defects, diseases (e.g. osteoarthritis and disc diseases) and some genetic conditions.1 However, the risk of developing back problems and associated pain increases with factors such as age, physical inactivity, smoking, overweight and obesity, pregnancy and occupation.1
The cost of back painThe direct cost of care for back problems and pain in Australia is around $1 billion annually. Most of this cost is spent on treatment from chiropractors, general practitioners, massage therapists, physiotherapists and acupuncturists.9 Other costs associated with back problems include diagnostic evaluations, such as X-ray, computed tomography (CT) and MRI scans.
Costs associated with back problems and pain3
Average OOP cost (per month)
Medication $150
Allied health services (physiotherapy, osteopathic services, exercise physiology)
$182
Private pain clinic $1,290
Around 1 in 6 people have back pain7
References
1. Australian Institute of Health and Welfare (2017). Back problems. Available from: https://www.aihw.gov.au/reports/arthritis-other-musculoskeletal-conditions/back-problems/whatare-back-problems [Accessed May 2018].
2. National Institute of Neurological Disorders and Stroke. Low Back Pain Fact Sheet. Available from: www.ninds.nih.gov/Disorders/Patient-Caregiver-Education/Fact-Sheets/Low-BackPain-Fact-Sheet [Accessed May 2018].
3. Consumers Health Forum of Australia. Health voices. Australian healthcare – out of pocket and out of date? Issue 12 April 2013.
4. SBS News. The cost of pain increasing in Australia. Available from: https://www.sbs.com.au/news/the-cost-of-pain-increasing-in-australia [Accessed May 2018].
5. Andersson G and Watkins-Castillo S. Bed Days/Lost work days. Published on BMUS: The Burden of Musculoskeletal Diseases in the United States (http://www.boneandjointburden.org)
6. Wynne-Jones et al. Absence from work and return to work in people with back pain: a systematic review and meta-analysis. 2014 Occupational and Environmental Medicine 2014;71:448–56.
7. Health Direct. Back pain. Available from: www.healthdirect.gov.au/back-pain [Accessed May 2018]
8. Australian Institute of Health and Welfare (2016). Impacts of chronic back problems. Bulletin 137. Cat. no. AUS 204. Canberra: AIHW.
9. The Conversation. Pain drain: the economic and social costs of chronic pain. Available from: https://theconversation.com/pain-drain-the-economic-and-social-costs-of-chronicpain-49666 [Accessed May 2018].
10. The Conversation. Osteopathy can be used to treat mental health issues related to back pain – new study. Available from: https://theconversation.com/osteopathy-can-be-used-totreat-mental-health-issues-related-to-back-pain-new-study-94845 [Accessed May 2018].
Indirect costs
Back pain is associated with significant workforce absenteeism. Around 77% of people who experience back pain are of working age (15–64 years).7,8 Of those with a disability due to back problems, 44% are permanently unable to work.8
In addition, many people with back problems, especially chronic back pain, have poor mental health and are more likely to report conditions like depression, anxiety and psychological distress.8
Looking to the futureA specific type of osteopathic treatment, called osteopathic manipulative therapy (OMT), has been found to be effective in treating musculoskeletal pain as well as mental health conditions associated with chronic back pain.10
$508
Average cost per month
Most people reporting back pain and problems are between the ages of 45–64 years8
79 The cost of care 80
Mu
scu
losk
elet
al

Osteoarthritis
Snapshot
Estimated number of cases (2014–15)1 2.1 million
Likelihood2
2 in 5 chance by age 85 years• 1 in 4 (men)• 9 in 20 (women)
Average cost3 $1,220 per year
% of people who take time off work4 67%
Average number of days off work5 72 days per year
• Osteoarthritis (OA) is the most common form of arthritis in Australia1
• The condition is more common in women than in men (10% of females have osteoarthritis compared to 6% of males)1
• OA is the main condition leading to hip and knee replacement surgery1
The cost of OA
Average cost of carers, aids and other financial costs5
Average cost per year
Personal care, bathing, travel assistance $1,430
Home maintenance, gardening, cleaning $1,127
Travel and transportation $994
Prescription medications $402
Housing modifications $402
Dressings, ointments, incontinence sheets / pads $453
Health practitioners $465
Aids and appliances $264
Furniture $138
Some people with OA will require surgery to manage their condition. The most common surgeries for the management of OA are knee and hip replacements. Costs for such procedures are high, with the average cost of a knee replacement and hip replacement around $25,518 and $36,432, respectively. However, it is important to bear in mind that this doesn’t necessarily reflect the OOP cost.4
Indirect costs associated with OA
People with OA report that the financial consequences of their condition can be detrimental, not only because of high costs associated with treatment, but also due to the loss of income from a reduced capacity to work.4
In a survey of Australians with OA, respondents reported that, in the two weeks prior to completing the survey, they had taken an average of 2.9 days off work or school due to illness.5
67% of people with OA report that their condition affects their ability to work or study4
References
1. Australian Institute of Health and Welfare (2017). Osteoarthritis. Available from: https://www.aihw.gov.au/reports/arthritis-other-musculoskeletal-conditions/osteoarthritis/contents/what-is-osteoarthritis [Accessed May 2018].
2. Reuters. Lifetime risk of hand arthritis may be over 40 percent. Available from: www.reuters.com/article/us-health-arthritis-hands/lifetime-risk-of-hand-arthritis-may-be-over-40-percent-idUSKBN18828Q [Accessed May 2018].
3. Callander EJ, et al. Out-of-pocket healthcare expenditure and chronic disease — do Australians forgo care because of the cost? Australian Journal of Primary Health. 2016;23(1):15–22.
4. Bates S et al (2014). Arthritis and disability (SPRC Report 26/2014). Sydney: Social Policy Research Centre, UNSW Australia.
5. Deloitte. Access Economics. Arthritis – the bottom line. The economic impact of arthritis in Australia. January 2005.
6. Arthritis Australia. Counting the cost: The current and future burden of arthritis. Available from: https://www.arthritistas.org.au/wp-content/uploads/2016/05/Final-Counting-the-Costs_Part1-Healthcare-Costs_MAY2016.pdf [Accessed May 2018]
What’s the risk?Key risk factors for OA include:6
• Age – 30% of people aged 65 years and over have OA, while less than 3% of people under the age of 35 are affected
• Obesity – people who are obese are seven times more likely to have OA than those of a healthy weight
• Joint injury – sporting or a work-related injury is the leading cause of knee OA in younger people
Burden on carersThe burden of OA also affects the family members and friends of sufferers. Approximately 50% of people with OA receive informal care, with caregivers spending an average of 27.4 hours per week providing care. Around 15 hours a week are spent assisting with household tasks and another 12.4 on activities of daily living.5
$1,220
Average cost per year
The prevalence of OA rises dramatically from the age of 45 years1
81 The cost of care 82
Mu
scu
losk
elet
al

Osteoporosis
Snapshot
Estimated number of cases (2011)1 1.04 million
Likelihood2
• Men over the age of 50 years have a 1 in 5 chance of experiencing an osteoporotic fracture
• Women over the age of 50 years have a 1 in 3 chance of experiencing an osteoporotic fracture
Average cost1 $1,155 per fracture occurrence
% of people who take time off work3 7.5%
Average number of days off work4 12 days per year
• Osteoporosis is a condition that causes the bones to become fragile, thin and weak5
• Changes in the quality and strength makes bones more likely to break or fracture5
• Osteoporosis is more common in women and people over the age of 50 years5
• Osteoporosis is often not diagnosed until a fracture occurs5
Most people who have an osteoporosis-related fracture will experience re-fracture within 4 years7
The cost of osteoporosisBetween ambulance costs, general practitioner visits, physiotherapy and prescription medications, the cost of osteoporosis can add up, especially due to the recurrence of fractures and the need for long-term management.
Costs associated with osteoporosis mangement1,6
Emergency room attendance relating to fracture
$276–$397 (per visit)
Bone density scan $110 (per scan)
GP visit $40 (per visit)
Physiotherapy $68 (per session)
Medication $6–$319 (per month)
It is uncommon for osteoporosis-related fractures to be isolated incidences. Patients who suffer a minimal trauma fracture due to osteoporosis have a significantly greater risk of having another fracture and most will experience this within 4 years of their first fracture.7 The likelihood is 1 in 47 in the first year and 1 in 21 within two years.7
The impact of osteoporosis-related fractures extends beyond direct financial costs, with fractures in the wrist and forearm affecting a person’s ability to perform personal care tasks or their ability to write or type. Fractures of the hip also have a significant impact, affecting mobility and often leading to a loss of independence.5
References
1. Watts JJ, et al. Osteoporosis costing all Australians A new burden of disease analysis – 2012 to 2022.
2. International Osteoporosis Foundation. Facts and statistics. Available from: www.iofbonehealth.org/facts-statistics [Accessed May 2018].
3. Australian Bureau of Statistics 2013. 4364.0.55.002 – Australian Health Survey: Health Service Usage and Health Related Actions, 2011–12. March 2013.
4. Australian Institute of Health and Welfare (2009). Chronic disease and participation in work. Cat. no. PHE 109. Canberra: AIHW.
5. Australian Institute of Health and Welfare (2015). Musculoskeletal fact sheet: osteoporosis. Arthritis series no 23. Cat. no. PHE 187. Canberra: AIHW.
6. Jean Hailes. How is osteoporosis diagnosed? Available from: https://jeanhailes.org.au/health-a-z/bone-health/how-is-osteoporosis-diagnosed [Accessed May 2018].
7. Ruan W, et al. Analysis on the risk factors of second fracture in osteoporosis-related fractures. Chinese Journal of Traumatology 2011;14:74–8
What’s the risk?At the age of 50 years, men have a 20% chance of experiencing an osteoporotic fracture during the lifetime. For women, the likelihood of fracture is higher at 33%.2
There are a number of other risk factors associated with osteoporosis including:5
• Increasing age
• Family history
• Low vitamin D levels
• Low intake of calcium
• Low body weight
• Smoking
• Excess alcohol consumption
• Physical inactivity
• Long-term corticosteroid use
• Reduced oestrogen level
$1,155
Average cost per fracture
There are an estimated 395 fractures every week in Australia as a result of osteoporosis1
83 The cost of care 84
Mu
scu
losk
elet
al

$2,189
Average cost per year References
1. Australian Institute of Health and Welfare (2015). Musculoskeletal fact sheet: rheumatoid arthritis. Arthritis series no. 24. Cat. no. PHE 188. Canberra: AIHW.
2. Healthline. Rheumatoid arthritis by the numbers: Facts, statistics, and you. Available from: www.healthline.com/health/rheumatoid- arthritis/facts-statistics-infographic#1 [Accessed May 2018].
3. Lapsley HM, et al. Living with rheumatoid arthritis: expenditures, health status, and social impact on patients. Annals Rheumatic Diseases. 2002;61:818–21.
4. Chaparro del Moral R, et al. Work productivity in rheumatoid arthritis: Relationship with clinical and radiological features. Arthritis 2012;2012:137635.
5. Arthritis Australia. Arthritis information sheet. Available from: https://arthritisaustralia.com.au/wordpress/wp-content/uploads/2018/02/Osteoarthritis_New-updated.pdf [Accessed May 2018].
6. Australian Institute of Health and Welfare (2009). A picture of rheumatoid arthritis in Australia. Arthritis series no. 9. Cat. no. PHE 110. Canberra: AIHW.
7. Medical News Bulletin. New gene therapy drug for rheumatoid arthritis undergoes phase 1 trial. Available from: www.medicalnewsbulletin.com/new-gene-therapy-drug -rheumatoidarthritis-phase-1-trial/ [Accessed May 2018].
Rheumatoid arthritis
Snapshot
Estimated number of cases (2015)1 445,000
Estimated new cases each day (2015)1 36
Cost range3 $71–$29,695 per year
Average cost3 $2,189 per year
% of people who stop working2 • 32% (5 years after onset)• 60% (10 years after onset)
Average number of days off work4 38.4 days per year
• Rheumatoid arthritis (RA) is a chronic autoimmune disease characterised by inflammation of the joints. It most commonly affects the hands but can affect other areas of the body as well1
• RA is more common in women than men and in those over the age of 65 years1
• Increased mortality is a concern for those with RA due to related complications and co-existing medical conditions such as infections and cardiovascular disease (CVD)1
What’s the risk?Over the lifetime, men have a 1.7% chance of developing RA. In women, the risk is slightly higher at 3.6%.2
While the underlying cause of RA isn’t fully understood, there are a number of factors that may contribute to the likelihood of being diagnosed with RA, including genetics, lifestyle (e.g. smoking) and environmental factors.2
Complications1,2
• RA increases the CVD, including heart attack and stroke
• Infections are common in people with RA and may contribute to 25% of deaths for people with the condition
• People with RA are twice as likely to have depression than those without RA and are also more likely to suffer from anxiety and low self-esteem
• RA can also cause damage to the lungs, eyes, skin and blood
The risk of heart attack increases 60% one year after being diagnosed with RA2
Cost of rheumatoid arthritisOn average, people with RA spend $2,189 per year on healthcare. For some, out-of-pocket (OOP) costs can be as high as $29,695 per year. Women spend significantly more than men, on average, around $400 more and younger people with RA (<65 years) spend on average $400 less than those over the age of 65 years.5
There are also substantial indirect costs associated with RA, as many are forced to decrease the number of hours worked or stop working entirely.6 Work disability is a common problem for people with RA. Around 32% stop working at 5 years after disease onset.1
People with RA may also rely on daily assistance from a carer and/or family member, especially as their condition worsens over time.6
RA is more common in people who smoke and in those with a family history of the condition5
Looking to the futureUp to half of people with RA continue to experience symptoms of the disease. Although biologic medicines have significantly improved outcomes over the past 10 years, further treatments, such as gene therapies, are currently being studied to help improve quality of life for people with RA.7
RA usually starts between the ages of 30 and 60 years in women2
85 The cost of care 86
Mu
scu
losk
elet
al

Counting the costs
Vision disorders and blindness
Catherine (Cat) was a busy 33-year-old with a budding career and an active social life when she was diagnosed with rheumatoid arthritis (RA). Cat knew little about the disease but was determined not to let it affect her life.
Unfortunately for Cat, the symptoms of RA, along with the costs associated with managing her condition, began to take their toll.
In the first year following her diagnosis, Cat took more time off from work than she had during her entire career. Due to the constant pain and fatigue she experienced, Cat was absent a total of 29 days over the next 12 months.
Her absence from work, along with mounting medical costs meant Cat had to cancel an overseas trip to Europe that she had been planning for months.
Since her diagnosis, Cat has spent nearly $9,000 in medical costs. In the first two years, Cat paid around $4,000 out of pocket to access a new biologic treatment, which has since been subsidised through the Pharmaceutical Benefits Scheme. Another $4,000 was spent on numerous visits to her rheumatologist, as well as an exercise physiologist and dietitian. In addition, Cat had to purchase a number of assistance devices to help her with daily tasks such as dressing, grooming and cooking.
Her absenteeism from work continues to be an ongoing source of stress for Cat, who fears she will need to start working part time in the near future.
Case study
*This case study is provided for illustrative purposes based on the data in this document
$9,000 $4,000 $4,000 $?
out-of-pocket medical costs
loss of income treatments specialistassistance devices
In 2016, there were an estimated 384,000 cases of vision disorders and blindness in Australia, with sufferers affected by conditions such as:
• Age-related macular degeneration (AMD)
• Glaucoma
• Diabetic retinopathy
• Cataract
Eye injury is also common and trauma to the eye is the leading cause of blindness in one eye. Many eye injuries are sustained as a result of sport or work.
More than 1 in 3 people will experience vision impairment by the time they are 85 years and more than 1 in 6 will experience permanent sight loss or blindness by the same age. Eye-related injuries are more common for men than women, particularly men of working age.
The average cost of a vision disorder or blindness is $5,760 per year.
Loss of vision is a major cause of disability and therefore indirect costs are also high. Vision impairment often poses barriers to employment opportunities for those who are part of the workforce or would like to be part of the workforce.
Catherine*, 36
Rheumatoid arthritis
Case study
87 The cost of care 88

Snapshot
Estimated number of cases (2016)1 384,000*
Likelihood2
More than 1 in 3 chance by age 85 years (vision impairment)
More than 1 in 6 chance by age 85 years (permanent sight loss or blindness)
Average cost3 $5,760 per year
*Excludes refractive error
The most common causes of vision impairment and blindness are degenerative eye diseases such as:4
• Age-related macular degeneration (AMD): a disease that affects the retina and a person’s central vision
• Glaucoma: group of diseases in the optic nerve
• Diabetic retinopathy: complication of diabetes that affects the blood vessels of the retina
• Cataract: clouding of the lens resulting in a blurred image
• Vision impairment most commonly affects older individuals but it can also occur in young people, usually due to eye trauma6
• Degenerative eye diseases are the leading causes of blindness among Australians aged 55+ years4,6
• In 2014–15, around 421,000 Australians had a cataract, 236,000 had macular degeneration, and 129,000 had complete or partial blindness5
Vision disorders by age (2014–15)5
Major causes of vision impairment (40 years and older)7
Major causes of blindness (40 years and older)7
Other 22%
Diabetic retinopathy 5%
Glaucoma 12%
Cataract 37%
AMD 24%
Other 20%
Uncorrected refractive index 3%
Glaucoma 16%
Cataract 11%
AMD 50%
Eye-related injury: The facts8
• Trauma to the eye is the leading cause of blindness in one eye
• Between 2010–11 and 2014–15, nearly 52,000 people were admitted to hospital for eye injury treatment
• Many eye injuries are sustained as a result of sport or work
• Eye-related injuries are more common for males than for females, particularly men of working age
What’s the risk?The risk of an individual experiencing vision impairment during their lifetime, as a result of a degenerative eye disease, is 36.3%. The chance that an individual will have permanent sight loss or blindness during their lifetime is 18.2%.2
Risk factors for vision impairment and blindness include:6
• Older age
• Smoking and alcohol
• Exposure to ultraviolet (UV) light
• Diabetes
The cost of vision impairment and blindness Visual impairment places a significant burden on individuals and society.3 The average out-of-pocket (OOP) cost per year for a person with vision impairment is $5,760, with a large proportion of the total expenditure related to transportation.
Per cent
100
0-14 15-24 25-34
Age group
45-5435-44 55-64 65-74 75+
80
60
40
20
0
$5,760
Average cost per year
89 The cost of care 90
Vis
ion
dis
ord
ers
and
blin
dn
ess

References
1. Vision Australia. Blindness and vision loss. Available from: https://www.visionaustralia.org/information/newly-diagnosed/blindness-and-vision-loss [Accessed May 2018].
2. Deloitte. Access Economics. Incidence and risk of sight loss and blindness in the UK. Royal National Institute of Blind People. August 2017.
3. Wong EYH et al. Personal costs of visual impairment by different eye diseases and severity of visual loss. Ophthalmic Epidemiology. 2008;15:339–44.
4. National Eye Health Survey. A summary report of the first national survey to determine the prevalence and major causes of vision impairment and blindness in Australia prepared by the Centre for Eye Research Australia and Vision 2020 Australia. 2016.
5. Australian Institute of Health and Welfare (2016). Australia’s health 2016. Australia’s health series no. 15. Cat. no. AUS 199. Canberra: AIHW.
6. Australian Government Department of Health. Visual impairment and blindness in Australia. Available from: http://www.health.gov.au/internet/publications/publishing.nsf/Content/ageing-eyehealth-risk-factors.htm~ageing-eyehealth-risk-factors-4.htm~ageing-eyehealth-risk-factors-4-1.htm [Accessed May 2018].
7. National Seniors Australia. The facts on vision impairment and loss. Available from: https://nationalseniors.com.au/sites/default/files/NationalSeniors_FactSheet_VisionImpairment.pdf [Accessed May 2018].
8. Australian Institute of Health and Welfare: Tovell A & McKenna K (2018). Eye injuries in Australia, 2010–11 to 2014–15. Injury research and statistics series no. 194. Cat. no. INJCAT 114. Canberra: AIHW.
9. Deloitte. Access Economics. June 2010. Clear Focus: The economic impact of vision loss in Australia in 2009. June 2010.
10. The epidemiology and impact of blindness and vision loss in Australia. Available from: https://www.health.gov.au/internet/main/publishing.nsf/Content/D1A5409787D800F2CA257C73007F12F3/$File/2.pdf [Accessed May 2018].
11. National Academies of Sciences, Engineering, and Medicine; Health and Medicine Division; Board on Population Health and Public Health Practice; Committee on Public Health Approaches to Reduce Vision Impairment and Promote Eye Health; Welp A, Woodbury RB, McCoy MA, et al., editors. Washington (DC): National Academies Press (US); 2016.
Mental health• Loss of vision is one of the major causes of disability. Sufferers report
profound ‘core activity restriction’ as a result of vision impairment10
• It affects patients’ ability to work or care for themselves (or others) and makes it more difficult to perform activities of daily living11
• Vision impairment often poses barriers to employment opportunities for those who are part of the workforce or would like to be part of the workforce11
• Older Australians with vision impairment may be more likely to require long-term care1
The risk of depression in people with vision impairment is three times higher than in those without vision impairment9
Medicines, products and equipment
Health and community services
Informal care and support
Other expenses (e.g. education, transportation)
AMD $293 $700 $1,369 $519
Glaucoma $467 $429 $351 $269
Retinopathies $385 $285 $3,367 $594
Other $343 $286 $862 $755
Median personal costs by category3
Almost half of the total population (45.5%) experience a mental health condition at some point in their lifetime.
Anxiety disorders, affective disorders and substance-use disorders are the most common mental health conditions in Australia and they often occur in combination. These conditions typically affect individuals aged between 25 and 34 years and are more likely in women and those living in rural areas.
The risk of developing certain mental health conditions is high:
• 1 in 6 women and 1 in 8 men will experience depression during their lifetime
• 1 in 3 women and 1 in 5 men will experience anxiety
The costs associated with mental health are significant. Despite funding through the public health system, individuals spend an estimated $1,350 per year in out-of-pocket (OOP) costs for mental health conditions. Medications account for one-third of this cost.
Many individuals and employers report prolonged absences from work due to mental health conditions – poor mental health is associated with the lowest likelihood of being in the labour force.
91 The cost of care 92

The current landscape for mental healthMental health conditions represent one of the greatest challenges facing society. With over half of us likely to have a mental health condition at some time in our lives, it shares the stage with cancer and heart disease as a group of high-impact medical life disrupters. Mental health conditions are present in all ages and in all socio-economic groups. While severe mental health conditions such as schizophrenia and bipolar disorders are relatively rare, more common mental health conditions such as depression and anxiety are noteworthy for their large contribution to human disability.
When people experience mental health conditions, they often suffer a massive disruption to their work, family life and social functioning. The duration of these disruptions ranges from months to years.
Suicide rates remain disturbingly high despite increased availability of mental health resources and ongoing public awareness campaigns. Adverse economic conditions, alcohol and drug abuse as well as social isolation tend to increase suicide rates.
Emerging trends in mental health careEvery year, and into the foreseeable future, there will be new medications, usually antidepressants, antipsychotic medications and mood stabilisers. Disappointingly, while the medications often have better side effect profiles than their predecessors, little improvement in treatment efficacy has been achieved.
Transcranial Magnetic Stimulation, as an alternative treatment for depression, is likely to be increasingly popular due to both its limited side effects and effective treatment of depression.
Social prescribing has emerged as popular, and occurs when therapists identify social interventions for mental health conditions in recognition of their bio-psycho-social nature. These activities range from ‘equine therapy’ to men’s sheds.
In the long term, innovations in technology may produce objective diagnostic instruments. These may include wearables and new brain imaging techniques.
Common misconceptionsGovernment and non-government organisations will continue to create community awareness of mental health conditions. As such, misconceptions concerning mental health conditions appear to be declining. The growing demand for mental health services supports the intuition that social norms continue to shift in the right direction for the reduction in the stigma that has been associated with these conditions.
Popular misconceptions that often prevent people from seeking treatment include incorrect beliefs that most treatments are sedating, will lead to weight gain and are addictive. While some people experience some side effects, most medication is well-tolerated and reasonably effective.
The cost of mental health conditionsMental health conditions have large economic and social costs. The conditions are often lengthy, leading to career disruption and instability, loss of skills and social isolation. Therefore, economic costs are not limited to forgone work, but also to long-term forgone opportunity.
Costs incurred through social disruption include increased rates of divorce, domestic violence and substance abuse.
Treatment costs, including most medications, are heavily government subsidised, with public subsidies available through general practice mental health care plans, medical consultation rebates and the pharmaceutical benefit scheme. Public hospital admissions are reserved for the most serious mental health conditions and are provided free of charge. Moderate mental health conditions, including substance misuse, are treated largely by the private hospital system. Inpatient treatments are often lengthy and moderately expensive, with private health providers offering some subsidies for inpatient care.
What does the future hold?Social campaigns that aim to reduce drug and alcohol consumption, improve social cohesion and promote physical activity may slowly reduce both the incidence and severity of mental health conditions. The World Health Organisation (WHO) and most governments have increased resources for both research and the treatment of mental health conditions creating the expectation of further improvements in outcomes over the long term.
Mental or behavioural conditions account for 17.5% of the total disease burden in Australia and 24% of non-fatal diseases.1 Almost half of the total population (45.5%) experience a mental health disorder at some point in their lifetime.2 The estimated total health system expenditure on mental health was $12.8 billion comprising $974 million in healthcare costs and $11.8 billion in productivity loss.3
Prevalence of mental health conditions in AustraliaMental health conditions are most common in those aged between 25 and 34 years, affecting nearly one in four and decline with age.6 They affect women more than men across all age groups and those living in rural areas.2,7 The three most common mental health conditions in 2007 are illustrated below and commonly occur in combination.2
Three in four adult mental health conditions emerge by 24 years of age, and half by 14 years5
Estimated Australian prevalence of mental health conditions in 2007
Anxiety-disorders
Affective disorders
Substance-use disorders
0.0 1.0 2.0 3.0
Prevalence (millions)
Expert's viewDr Doron SamuellExperienced behavioural risk management expert
Suicide rates in rural areas are consistently 40% higher than in metropolitan areas7
Adults with depression, anxiety and other mental health conditions are seven times more likely to skip healthcare than people without a health condition4
In any 12-month period, approximately 14% of Australians will be affected by an anxiety disorder8
93 The cost of care 94
Men
tal h
ealth

Cost of mental health in AustraliaAlthough healthcare in Australia is largely publicly funded, there are still significant out-of-pocket (OOP) costs associated with mental health. Australians estimate their OOP cost for a mental health condition to be $1,350 per year.9
The annual cost of mental health10
$113 $339 38
Medication cost Consultations Average days off
What about carers and families?Informal caregiving often falls onto family members:12
• 24% receive carer payments
• 34% receive any assistance in their caring role
• 35% do not know the services that are available to support carers
Nationally, carers for people with mental health conditions spend an average of 36 hours per week providing care, which is 208 million hours each year.
The facts• Mental health conditions may affect the individual to function in social,
family, educational and vocational roles, therefore the early age of onset may have long-term implications, including relapse11
• Of six major health conditions, poor mental health is associated with the lowest likelihood of being in the labour force11
• Individuals with mental health conditions lost an average of 38 working days annually10
• Individuals contribute OOP 7% to the total cost of their mental health condition10
• Medications account for one-third of the overall OOP costs; the balance attributed to consultation services9
References
1. Australian Bureau of Statistics 2015. 4364.0.55.001 – National Health Survey: First Results, 2014–15. December 2015.
2. Australian Bureau of Statistics 2008. Survey of Mental Health and Wellbeing: Summary of Results, 2007. October 2008.
3. Australian Institute of Health and Welfare (2018). Mental health services in Australia. Canberra: AIHW.
4. Callander EJ, et al. Out-of-pocket healthcare expenditure and chronic disease — do Australians forgo care because of the cost? Aust J Prim Health. 2016;23(1):p.15–22.
5. Kessler RC, et al. Lifetime prevalence and age of onset distributions of DSM-IV Disorders in the National Comorbidity Survey replication. Archives General Psychiatry. 2005; 62:593.
6. Slade T, et al. The Mental Health of Australians 2: Report on the 2007 National Survey of Mental Health and Wellbeing. May 2009.
7. Condon M (2017). Big problem with mental illness and suicide in rural and remote areas. Available from: www.abc.net.au/news/rural/2017-10-12/suicide-still-a-bigger-problem-in-the-bush/8996568 [Accessed May 2018].
8. Mindframe (2014) Facts and stats about mental illness in Australia. Available from: www.mindframe-media.info/for-mental-health-and-suicide-prevention/talking-to-media-about-mental-illness/facts-and-stats [Accessed May 2018].
9. Jackson S (2017). How much do mental health conditions cost? Available from: www.medibank.com.au/livebetter/health-brief/health-insights/how-much-do-mental-health-conditions-cost/ [Accessed May 2018].
10. Lee Y, et al. Cost of high prevalence mental disorders: Findings from the 2007 Australian National Survey of Mental Health and Wellbeing. Australian New Zealand Journal Psychiatry. 2017;51(12):1198–211.
11. Australian Government, Department of Health. The magnitude of the problem. Available from: www.health.gov.au/internet/publications/publishing.nsf/Content/mental-pubs-f-plan09-toc~mental-pubs-f-plan09-con~mental-pubs-f-plan09-con-mag [Accessed May 2018].
12. Diminic S, et al. The economic value of informal mental health caring in Australia: summary report. Brisbane: The University of Queensland; 2016.
13. Jorm A (2013). Why hasn’t the mental health of Australians improved? Available from: theconversation.com/why-hasnt-themental-health-of-australians-improved-15176 [Accessed May 2018].
Looking to the futureDespite significant investment into mental health over the past two decades, the mental health of Australians has not improved. It is thought that prevention and early detection is key to minimising those affected.13
95 The cost of care 96
Men
tal h
ealth

What’s the risk?Approximately 40% of cases of clinical depression are caused by genetic factors. The remaining 60% may be due to stressful events in a person’s life and/or their personality style.2 For bipolar disorder, women with a personal or family are at an 80% increased risk of an episode occurring during pregnancy and after childbirth.2
Depressive symptoms are more likely to develop in jobs:2
• Higher levels of psychological demand
• Lower levels of flexibility in decision-making
• Low levels of social and environmental support
• Longer work hours
The cost of affective disorders• The cost of depression is $17,190 on average per individual9
• Indirect spending for affective disorders include non-health services and social costs (e.g. family breakdown and legal costs)10
• If an individual were paying $450/session for psychiatry treatment weekly, they would be $296 out of pocket ($154 Medicare rebate); after the 7th treatment week, the individual would have reached the Medicare Safety Net threshold ($2,093.30 out of pocket)11,12
Affective disorders
Snapshot
Lifetime estimated prevalence (2007)1 2.4 million
Lifetime risk2Males 5.3%
Females 7.1%
Recovery rate3 Up to 50%, within the first six months
Relapse rate4 30–50% of those who initially recover
Average individual cost (2013–14)5 $181/year ($115–$262 if combined with another disorder)
Average number of days off work1 75.4 days per year
• Affective disorders, such as depression, bipolar and schizophrenia, affect more people who are widowed, separated or divorced (11.2%), unemployed (14.9%) and who did not complete school (8.1%)1
• The occurrence of affective disorders is highest among women between the ages of 25 and 34 years followed by men between the ages of 35 and 44 years1
• 1 in 6 women and 1 in 8 men will experience some level of depression during their life6
• Most affective disorders tend to be recurrent and the onset of individual episodes can often be related to stressful events or situations6
• Fewer than two in five individuals (35%) with anxiety or depression seek treatment6
• Depressive disorders accounted for 24% of non-fatal mental health-related burden7
75.4 Average number of days off work per year
References
1. Slade T, et al. The Mental Health of Australians 2: Report on the 2007 National Survey of Mental Health and Wellbeing. May 2009.
2. The Mental Health of Australians. https://www.health.gov.au/internet/main/publishing.nsf/content/A24556C814804A99CA257BF0001CAC45/$File/mha24.pdf [Accessed May 2018]..
3. Manicavasagar V. A review of depression diagnosis and management. InPsych 2012;34(1).
4. Australian Institute of Health and Welfare. Profile of depression in Australia. Canberra: AIHW.
5. Lee Y, et al. Cost of high prevalence mental disorders: Findings from the 2007 Australian National Survey of Mental Health and Wellbeing. Australian New Zealand Journal Psychiatry. 2017;51(12):1198–211.
6. Australian Bureau of Statistics 2008. Survey of Mental Health and Wellbeing: Summary of Results, 2007. October 2008.
7. Australian Institute of Health and Welfare. Australian Burden of Disease Study: Impact and causes of illness and death in Australia 2011. Australian Burden of Disease Study series no. 3. BOD 4. Canberra: AIHW.
8. McEvoy PM, et al. Epidemiology of anxiety disorders in the Australian general population: findings of the 2007 Australian National Survey of Mental Health and Wellbeing. Australian New Zealand Journal Psychiatry. 2011;45(11):957–67.
9. Doran CM. The evidence on the costs and impacts on the economy and productivity due to mental ill health: a rapid review. 2013.
10. Hawthorne G, et al. The Excess Cost of Depression in South Australia: A Population-Based Study. Australian New Zealand Journal Psychiatry 2003;37(3):362–73.
11. Consumers Health Forum of Australia. Out of pocket pain: Research report. April 2018.
12. Australian Government, Department of Health. 2018 table of Medicare Safety Net thresholds. Available from: www.humanservices.gov.au/individuals/enablers/2018-table-medicare-safety-net-thresholds/39326 [Accessed May 2018].
11.5% of mental illness sufferers are diagnosed with affective disorders
$17,190
Average cost of
97 The cost of care 98
Men
tal h
ealth

Anxiety disorders
Snapshot
Lifetime estimated prevalence (2007)1,2 4.2 million (20%)
Recovery rate3 50–60%
Relapse rate3 50–66% of those who initially recover
Average individual cost (2013–14)4 $190/year ($186–$262 if combined with another disorder)
Average number of days off work1 53.5 days per year
• Anxiety disorders include panic, agoraphobia, social phobia, generalised anxiety, obsessive-compulsive and post-traumatic stress disorders5
• Anxiety is the most common mental health condition in Australia affecting 1 in 4 people (1 in 3 women and 1 in 5 men)6
• Anxiety disorders affect more people who are widowed, separated or divorced (19.0%), those not in the labour force (20.9%) and those who did not complete school (18.9%)1
• The occurrence of anxiety disorders is higher in women between the ages of 16 and 54 years. For men, it affects those aged between 35 and 44 years the most1
What’s the risk?Risk factors associated with anxiety disorders include:7
• Family history of mental health conditions
• Personality factors
• Ongoing stressful events
• Comorbidities of diabetes, asthma, hypertension or heart disease
19 years of age is the median age of onset for anxiety disorders2
The cost of anxiety disorders• Out of all types of mental health conditions
(including combinations), anxiety-related disorders contribute to the largest proportion of total treatment costs (37.2%)4
• It costs an individual an average of $57 to attend a centre, where they will receive treatment free of charge; they will need at least 6–10 visits to complete a course of treatment8
The average individual cost of anxiety per year is $2294
References
1. Slade T, et al. The Mental Health of Australians 2: Report on the 2007 National Survey of Mental Health and Wellbeing. May 2009.
2. McEvoy PM, et al. Epidemiology of anxiety disorders in the Australian general population: findings of the 2007 Australian National Survey of Mental Health and Wellbeing. Australian New Zealand Journal Psychiatry. 2011;45(11):957–67.
3. Mandos LA. Achieving Remission in Generalized Anxiety Disorder. Psychiatric Times 2009;26(2)
4. Lee Y, et al. Cost of high prevalence mental disorders: Findings from the 2007 Australian National Survey of Mental Health and Wellbeing. Australian New Zealand Journal Psychiatry. 2017;51(12):1198–211.
5. Australian Government, Australian Institute of Family Studies (2008). Family relationships and mental illness: Impacts and service responses. Available from: aifs.gov.au/cfca/publications/family-relationships-and-mental-illness/section-1-overview-mental-health-problems [Accessed 2018].
6. Australian Bureau of Statistics 2008. Survey of Mental Health and Wellbeing: Summary of Results, 2007. October 2008.
7. BeyondBlue. What causes anxiety? Available from: www.beyondblue.org.au/the-facts/anxiety/what-causes-anxiety [Accessed May 2018].
8. Anderson R, et al. The non-medical out-of-pocket costs to attend a free anxiety disorders treatment clinic in Australia. Australasian Psychiatry. 2016;24(3):261–3.
Anxiety is the most common mental health condition in Australia
$262
Average individual cost from $190 per year up to
affecting 1 in 3 women and 1 in 5 men
99 The cost of care 100
Men
tal h
ealth

What’s the risk?Factors that increase the likelihood of an individual developing a substance use disorder can be categorised into:8,9
• Related to the individual, such as being male, having other mental health conditions and behavioural traits
• Related to the family, such as family history and attitudes, a lower socioeconomic group and being in a single parent family
• Related to the community, such as use in peers and being located in remote and regional areas of Australia
The cost of substance use disordersPeople with substance use disorders are often frequent users of psychiatric services. Although many services are publicly funded there may still be payment gaps for individuals seeking counselling, medication, rehabilitation centres, self-help programs or support networks.11
Substance use disorders
Snapshot
Lifetime estimated prevalence (2007)1 4.0 million
Number of deaths (2011)2 6,600
Recovery rate3 Up to 80%
Relapse rate4 40–60%
Average individual cost (2013–14)5 $219/year ($186–$258 if combined with another disorder)
Average number of days off work1 40.2 days per year
• Substance-use disorders include alcohol/drug harmful use or abuse and alcohol/drug dependence6
• The main contributors to mental health-related deaths were alcohol dependence (44%) and drug use disorders (20%)7
• Nearly 5% of all deaths are attributed from alcohol and illicit drug use2
• Substance use disorders affect more people who are widowed, separated or divorced (7.5%) or unemployed (8.5%)1
• The occurrence of substance use disorders is higher in men above 16 years of age. For women, it affects those aged between 16 and 24 years the most1
• The burden from substance abuse is three times greater in men than women8
20 years of age is the median age of onset for substance use disorders10
Alcohol dependence is four times higher in people who first tried alcohol before
15 years of age vs before 20 years.8
References
1. Slade T, et al. The Mental Health of Australians 2: Report on the 2007 National Survey of Mental Health and Wellbeing. May 2009.
2. Maynard C, et al. Drug Use Severity, Mortality, and Cause of Death in Primary Care Patients With Substance Use Disorders. SAGE Open. 2016;1–6.
3. Rickwood D, et al. Substance Use: A Position Statement prepared for The Australian Psychological Society. March 2008.
4. Odyssey House New South Wales. Managing relapse is vital to sustained recovery from addiction. Available from: www.odysseyhouse.com.au/355/ [Accessed May 2018].
5. Lee Y, et al. Cost of high prevalence mental disorders: Findings from the 2007 Australian National Survey of Mental Health and Wellbeing. Australian New Zealand Journal Psychiatry. 2017;51(12):1198–211.
6. Australian Government, Australian Institute of Family Studies (2008). Family relationships and mental illness: Impacts and service responses. Available from: aifs.gov.au/cfca/publications/family-relationships-and-mental-illness/section-1-overview-mental-healthproblems [Accessed 2018].
7. Australian Institute of Health and Welfare. Australian Burden of Disease Study: Impact and causes of illness and death in Australia 2011. Australian Burden of Disease Study series no. 3. BOD 4. Canberra: AIHW.
8. Headspace. Substance Use Assessment & Treatment. Available from: headspace.org.au/health-professionals/understanding-substance-abuse-for-health-professionals/ [Accessed May 2018].
9. Australian Institute of Health and Welfare. Australian Burden of Disease Study: Impact of alcohol and illicit drug use on the burden of disease and injury in Australia. BOD 19. Canberra: AIHW.
10. McEvoy PM, et al. Epidemiology of anxiety disorders in the Australian general population: findings of the 2007 Australian National Survey of Mental Health and Wellbeing. Australian New Zealand Journal Psychiatry. 2011;45(11):957–67.
11. Kavanagh DJ. Social and Economic Costs of Comorbid Substance Abuse and Mental Disorder. The University of Queensland.
$258
Average cost per year up to
x4
101 The cost of care 102
Men
tal h
ealth

Suicide
Number of deaths by suicide (2016)1
• 2,866 (8 deaths each day)
• 2,151 (men)
• 15 (women)
References
1. Australian Bureau of Statistics. (2017). Causes of Death, Australia, 2016. Catalogue No. 3303.0. Belconnen, ACT: Commonwealth of Australia. Accessed September 27, 2017 from: www.abs.gov.au/AUSSTATS/[email protected]/allprimarymainfeatures/47E19CA15036B04BCA2577570014668B?opendocument.
2. Black Dog Institute. Facts about suicide in Australia. Available from: https://www.blackdoginstitute.org.au/clinical-resources/suicide-self-harm/facts-about-suicide-in-australia [Accessed June 2018]
3. www.abs.gov.au/ausstats/[email protected]/Lookup/by%20Subject/3303.0~2016~Main%20Features~Intentional%20self-harm:%20key%20characteristics~7.
4. McKenna, K., & Harrison, J. E. (2012). Hospital separations due to injury and poisoning, Australia 2008-09. Injury research and statistics series. No. 65. Cat. INJCAT 141. Canberra, ACT: Australian Institute of Health and Welfare. Available from: www.aihw.gov.au/publication-detail/?id=10737422893 [Accessed June 2018].
5. Connor, K. R., Langley, J., Tomaszewski, K. J., & Conwell, Y. (2003). Injury hospitalization and risks for subsequent self-injury and suicide: A national study from New Zealand. American Journal of Public Health, 93(7), 1128-1131.
6. Martin, G., Swannell, S., Harrison, J., Hazell, P., & Taylor, A. (2010). The Australian National Epidemiological Study of Self-Injury (ANESSI). Brisbane, QLD: Centre for Suicide Prevention Studies. Available from: www.suicidepreventionstudies.org/uploads/ANESSI%20Report%20Publication.pdf [Accessed June 2018].
7. Lifeline. Statistics on suicide in Australia. Available from: https://www.lifeline.org.au/aboutlifeline/lifeline-information/statistics-on-suicide-in-australia [Accessed June 2018]
8. Health Direct. Mental health care plan. Available from: https://www.healthdirect.gov.au/mental-health-care-plan [Accessed June 2018].
The facts: Mental health care plan8
• People who have a mental health disorder as diagnosed by a doctor can access a mental health care plan
• This can be accessed through a registered healthcare professional, including a General Practitioner (GP)
• People who have a mental health care plan are entitled to Medicare rebates for up to 10 appointments with some allied mental health services in a year, such as psychologists, occupational therapists and social workers
• After 6 appointments, plans must be reviewed by the referring doctor and a new referral must be acquired
Suicide is approximately three times higher in men1
Number annual of deaths by age range (2016)1 Men Women
20–24 202 64
25–29 188 188
30–34 246 246
35–39 199 60
40–44 220 70
45–49 180 68
50–54 181 82
55–59 161 161
60–64 135 35
Groups at risk of suicide • People with previous history of attempted suicide4
• Those with mental disorders such as major depression, psychotic illnesses and eating disorders5,6
• People with substance use disorders
• Men
• Aboriginal and or Torres Strait Islander People
Suicide is the leading cause of death for Australians aged 15 to 44, and the second leading cause of death for Australians aged 45 to 54 years2,3
There are approximately
65,300 suicide attempts each year in Australia7
103 The cost of care 104
Men
tal h
ealth

Useful resourceBeyondblue provides people with 24 hour a day information and support for a range of mental health issues. Phone: 1300 224 636 Website: beyondblue.org.au
Mental Health Australia is an organisation that strives to affect reform in Australia by providing people with a better understanding of the effects of mental illness. Phone: (02) 6285 3100 Website: mhaustralia.org/
MindHealthConnect is a mental health resource that provides users with information about mental health issues and online programs. Website: mindhealthconnect.org.au
Mental Health Council of Australia is an independent body that provides people who have suffered discrimination because of their mental illness with an avenue for recourse. Website: mhca.org.au
SANE is a charity designed to help young people who have been affected by mental illness. Website: sane.org
ReachOut Pro provides information about mental health. Website: http://about.au.reachout.com/tag/reachout-pro/
Black Dog Institute provides information about bipolar disorder and depression. Website: blackdoginstitute.org.au
BlueBoard is an online support group for people are suffering from or those whose lives have been impacted by a range of mental health conditions. Website: blueboard.anu.edu.au
e-couch is a self-help interactive mental health program. Website: ecouch.anu.edu.au
Headspace provides young people specifically with advice, information and support about health with mental health problems. Website: headspace.org.au
Mental health online offers information about anxiety issues, auto-psychological assessment that are free of charge and treatment programs. Website: mentalhealthonline.org.au
MoodGYM provides behavioural therapy through an interactive program. Website: moodgym.anu.edu.au
Partners In Depression offers support and info to those who are helping someone who is currently experiencing a mental health issue. Website: partnersindepression.com.au
Sources:Australian Bureau of Statistics (2007) National Survey of Mental Health and Well-being
Australian Institute of Health and Welfare (2011 Australian Burden of Disease Study: impact and causes of illness and death in Australia
Zurich (2016) Zurich claims: putting our customers at the heart of everything we do
The Royal Australian & New Zealand College of Psychiatrists (2016): The economic cost of serious mental illness and comorbidities in Australia and New Zealand
Fourth national mental health plan: an agenda for collaborative government action in mental health 2009-2014
The Risk Store (2016) Claims Paid Statistics by Product Type
Case study
“The destructive impact of poor mental health on Australians is colossal. From my own experiences of PTSD, depression and anxiety, it has at times hindered my ability to think rationally and be kind to myself. Since I reached out for clinical help 4 years ago, ironically, on a professional level it has made me more emotionally intelligent and sensitive to the struggles of others. Financially it can be a strain, such as $300 bills for specialists such as Psychiatrists and other mental health professionals. However I am now realistic about this and realise I am lucky to be able to access this help and in the long-term it is an investment that will hopefully ensure I stay on track and as mentally healthy as I can".
Terry Cornick Founder & CEO of Mr. Perfect
Mr. Perfect is a grassroots charity that aims to create a judgement-free society for men and their mental health. www.mrperfect.org.au
Terry Cornick,
Mr Perfect
Case study
105 The cost of care 106

Zurich Australia Limited ABN 92 000 010 195, AFSLN 232510 118 Mount St, North Sydney NSW 2060 Client Enquiries 131 551 www.zurich.com.au
OnePath Life Limited (OnePath Life) ABN 33 009 657 176, AFSL 238341 Client Enquiries 133 667 www.onepath.com.au
This document has been prepared by Zurich Australia Limited ABN 92 000 010 195, AFSL 232510 and OnePath Life Limited ABN 33 009 657 176, AFSL 238341. This information is current as at 15 March 2021 and may be subject to change.
This information is for adviser use only, it does not take into account any personal objectives, financial situations or needs. You should consider these factors, the appropriateness of the information and the relevant Zurich Wealth Protection Product Disclosure Statement (PDS) (available on www.zurich.com.au) or the relevant OnePath OneCare Product Disclosure Statement (PDS) (available on www.onepathinsurance.com.au ) before making any decisions or recommendations. Furthermore, this product has been designed to meet certain objectives, financial situations and needs, which are described in our Target Market Determination available at www.zurich.com.au/tmd and www.onepathinsurance.com.au/tmd. The information is a summary only and there are relevant conditions and exclusions that are explained in the PDS.
MPOI-013754-2018. ZU23798 V1 09/18


![2. THE SCHRODINGER EQUATION. BOUND STATES · inhomogeneous or absorbing media. [Missing: Aparagraphontheadvantages ofusingcomplex amplitudessuchas (x;t) = Ae2ˇi(x= t=˝).] If a sinusoidal](https://img.pdfslide.us/doc/110x75/5ca9ebae88c993130d8c91cf/2-the-schrodinger-equation-bound-states-inhomogeneous-or-absorbing-media.jpg)